Catheter type, placement and insertion techniques for preventing catheter‐related infections in chronic peritoneal dialysis patients
Abstract
Background
Peritonitis is one of the limiting factors for the growth of peritoneal dialysis (PD) worldwide and is a major cause of technique failure. Several studies have examined the effectiveness of various catheter‐related interventions for lowering the risk of PD‐related peritonitis. This is an update of a review first published in 2004.
Objectives
To evaluate the role of different catheter implantation techniques and catheter types in lowering the risk of PD‐related peritonitis in PD patients.
Search methods
We searched the Cochrane Kidney and Transplant Register of Studies up to 15 January 2019 through contact with the Information Specialist using search terms relevant to this review. Studies in the Register are identified through searches of CENTRAL, MEDLINE, and EMBASE, conference proceedings, the International Clinical Trials Register (ICTRP) Search Portal and ClinicalTrials.gov.
Selection criteria
Studies comparing different catheter insertion techniques, catheter types, use of immobilisation techniques and different break‐in periods were included. Studies of different PD sets were excluded.
Data collection and analysis
Two authors independently assessed study quality and extracted data. Statistical analyses were performed using a random effects model and the results expressed as risk ratio (RR) with 95% confidence intervals (CI).
Main results
Forty‐two studies (3144 participants) were included: 18 evaluated techniques of catheter implantation, 22 examined catheter types, one assessed an immobiliser device, and one examined break‐in period. In general, study quality was variable and almost all aspects of study design did not fulfil CONSORT standards for reporting.
Catheter insertion by laparoscopy compared with laparotomy probably makes little or no difference to the risks of peritonitis (RR 0.90, 95% CI 0.59 to 1.35; moderate certainty evidence), exit‐site/tunnel infection (RR 1.00, 95% CI 0.43 to 2.31; low certainty evidence), catheter removal/replacement (RR 1.20, 95% CI 0.77 to 1.86; low certainty evidence), technique failure (RR 0.71, 95% CI 0.47 to 1.08; low certainty evidence), and death (all causes) (RR 1.26, 95% CI 0.72 to 2.20; moderate certainty evidence). It is uncertain whether subcutaneous burying of catheter increases peritonitis (RR 1.16, 95% CI 0.37 to 3.60; very low certainty evidence). Midline insertion compared to lateral insertion probably makes little or no difference to the risks of peritonitis (RR 0.65, 95% CI 0.32 to 1.33; moderate certainty evidence) and may make little or no difference to exit‐site/tunnel infection (RR 0.56, 95% CI 0.12 to 2.58; low certainty evidence). Percutaneous insertion compared with open surgery probably makes little or no difference to the exit‐site/tunnel infection (RR 0.16, 95% CI 0.02 to 1.30; moderate certainty evidence).
Straight catheters probably make little or no difference to the risk of peritonitis (RR 1.04, 95% CI 0.82 to 1.31; moderate certainty evidence), peritonitis rate (RR 0.91, 95% CI 0.68 to 1.21; moderate certainty evidence), risk of exit‐site infection (RR 1.12, 95% CI 0.94 to 1.34; moderate certainty evidence), and exit‐site infection rate (RR 1.05, 95% CI 0.77 to 1.43; moderate certainty evidence) compared to coiled catheter. It is uncertain whether straight catheters prevent catheter removal or replacement (RR 1.11, 95% CI 0.73 to 1.66; very low certainty evidence) but straight catheters probably make little or no difference to technique failure (RR 0.82, 95% CI 0.51 to 1.31; moderate certainty evidence) and death (all causes) (RR 0.95, 95% CI 0.62 to 1.46; low certainty evidence) compared to coiled catheter. Tenckhoff catheter with artificial curve at subcutaneous tract compared with swan‐neck catheter may make little or no difference to peritonitis (RR 1.29, 95% CI 0.85 to 1.96; low certainty evidence) and incidence of exit‐site/tunnel infection (RR 0.96, 95% CI 0.77 to 1.21; low certainty evidence) but may slightly improve exit‐site infection rate (RR 0.67, 95% CI 0.50 to 0.90; low certainty evidence).
Authors' conclusions
There is no strong evidence that any catheter‐related intervention, including the use of different catheter types or different insertion techniques, reduces the risks of PD peritonitis or other PD‐related infections, technique failure or death (all causes). However, the numbers and sizes of studies were generally small and the methodological quality of available studies was suboptimal, such that the possibility that a particular catheter‐related intervention might have a beneficial effect cannot be completely ruled out with confidence.
PICO
Plain language summary
Catheter type, placement and insertion techniques for preventing peritonitis in peritoneal dialysis patients
What is the issue?
People with kidney failure may be treated with peritoneal dialysis where a catheter is permanently inserted into the peritoneum (lining around abdominal contents) through the abdominal wall and sterile fluid is drained in and out several times overnight or during the day. The most common serious complication is infection of the peritoneum ‐ peritonitis. This may be caused by germs which may be accidentally introduced via the catheter into the peritoneum resulting in peritonitis.
What did we do?
We conducted a review of the literature to examine the effects of different methods of catheter insertion and different types of catheter in prevention of peritonitis in PD patients.
What did we find?
We identified 42 studies (3144 participants) examining the effects of different methods of catheter insertion and types of catheter on peritonitis. The risk of peritonitis was not affected by different types of insertion methods or types of catheters inserted.
Conclusions
There is no evidence to support a specific catheter insertion technique or type of catheter with the aim to prevent peritonitis in peritoneal dialysis patients.
Authors' conclusions
Summary of findings
| Laparoscopy versus laparotomy for preventing catheter‐related infections in chronic peritoneal dialysis patients | |||||
| Patient or population: chronic peritoneal dialysis patients | |||||
| Outcomes | Anticipated absolute effects* (95% CI) | Relative effect | No. of participants or patient‐months | Certainty of the evidence | |
| Risk with laparotomy | Risk with laparoscopy | ||||
| Peritonitis | 242 per 1,000 | 218 per 1,000 | RR 0.90 | 315 (4) | ⊕⊕⊕⊝ |
| Peritonitis rate (patient‐months) | 59 per 1,000 | 52 per 1,000 | RR 0.89 | 375 (1) | ⊕⊝⊝⊝ |
| Exit‐site/tunnel infection | 125 per 1,000 | 125 per 1,000 | RR 1.00 | 270 (3) | ⊕⊕⊝⊝ |
| Catheter removal or replacement | 281 per 1,000 | 337 per 1,000 | RR 1.20 | 167 (3) | ⊕⊕⊝⊝ |
| Technique failure | 293 per 1,000 | 208 per 1,000 | RR 0.71 | 283 (4) | ⊕⊕⊝⊝ |
| Death (all causes) | 140 per 1,000 | 176 per 1,000 | RR 1.26 | 270 (3) | ⊕⊕⊕⊝ |
| *The risk in the intervention group (and its 95% confidence interval) is based on the assumed risk in the comparison group and the relative effect of the intervention (and its 95% CI). | |||||
| GRADE Working Group grades of evidence | |||||
| 1 Downgraded one level: suboptimal quality of studies 2 Downgraded two levels: single study with suboptimal quality and imprecision 3 Downgraded two levels: suboptimal quality and imprecision | |||||
| Buried (subcutaneous) versus non‐buried catheter for preventing catheter‐related infections in chronic peritoneal dialysis patients | |||||
| Patient or population: chronic peritoneal dialysis patients | |||||
| Outcomes | Anticipated absolute effects* (95% CI) | Relative effect | No. of participants or patient‐months | Certainty of the evidence | |
| Risk with non‐buried | Risk with buried (subcutaneous) | ||||
| Peritonitis rate (patient‐months) | 37 per 1,000 | 43 per 1,000 | RR 1.16 | 2511 (2) | ⊕⊝⊝⊝ |
| Exit‐site/tunnel infection rate (patient‐months) | 31 per 1,000 | 36 per 1,000 | RR 1.15 | 2511 (2) | ⊕⊝⊝⊝ |
| Technique failure | 367 per 1,000 | 268 per 1,000 | RR 0.73 | 60 (1) | ⊕⊝⊝⊝ |
| Death (all causes) | 169 per 1,000 | 153 per 1,000 | RR 0.90 | 119 (2) | ⊕⊕⊕⊝ |
| *The risk in the intervention group (and its 95% confidence interval) is based on the assumed risk in the comparison group and the relative effect of the intervention (and its 95% CI). | |||||
| GRADE Working Group grades of evidence | |||||
| 1 Downgraded three levels: suboptimal quality, inconsistency, and imprecision 2 Downgraded three levels: single study, suboptimal quality, and imprecision 3 Downgraded two levels: suboptimal quality of studies and imprecision | |||||
| Midline versus lateral insertion for preventing catheter‐related infections in chronic peritoneal dialysis patients | |||||
| Patient or population: chronic peritoneal dialysis patients | |||||
| Outcomes | Anticipated absolute effects* (95% CI) | Relative effect | No. of participants | Certainty of the evidence | |
| Risk with lateral | Risk with midline | ||||
| Peritonitis | 255 per 1,000 | 166 per 1,000 | RR 0.65 | 120 (2) | ⊕⊕⊕⊝ |
| Exit‐site/tunnel infection | 78 per 1,000 | 44 per 1,000 | RR 0.56 | 120 (2) | ⊕⊕⊝⊝ |
| Catheter removal or replacement | 514 per 1,000 | 293 per 1,000 | RR 0.57 | 83 (1) | ⊕⊝⊝⊝ VERY LOW 3 |
| Death (all causes) | 0 per 1,000 | 0 per 1,000 | RR 8.50 | 37 (1) | ⊕⊝⊝⊝ |
| *The risk in the intervention group (and its 95% confidence interval) is based on the assumed risk in the comparison group and the relative effect of the intervention (and its 95% CI). | |||||
| GRADE Working Group grades of evidence | |||||
| 1 Downgraded one level: suboptimal quality of studies 2 Downgraded two levels: suboptimal quality and imprecision 3 Downgraded three levels: single study, suboptimal quality study, and imprecision | |||||
| Percutaneous insertion versus open surgery for preventing catheter‐related infections in chronic peritoneal dialysis patients | |||||
| Patient or population: chronic peritoneal dialysis patients | |||||
| Outcomes | Anticipated absolute effects* (95% CI) | Relative effect | No. of participants | Certainty of the evidence | |
| Risk with open surgery | Risk with percutaneous insertion | ||||
| Exit‐site/tunnel infection | 106 per 1,000 | 17 per 1,000 | RR 0.16 | 96 | ⊕⊕⊕⊝ |
| Catheter removal or replacement | 133 per 1,000 | 32 per 1,000 | RR 0.24 | 61 | ⊕⊝⊝⊝ |
| *The risk in the intervention group (and its 95% confidence interval) is based on the assumed risk in the comparison group and the relative effect of the intervention (and its 95% CI). | |||||
| GRADE Working Group grades of evidence | |||||
| 1 Downgraded one level: suboptimal quality of studies 2 Downgraded two levels: single study with suboptimal quality and imprecision | |||||
| Straight versus coiled catheters for preventing catheter‐related infections in chronic peritoneal dialysis patients | |||||
| Patient or population: chronic peritoneal dialysis patients | |||||
| Outcomes | Anticipated absolute effects* (95% CI) | Relative effect | No. of participants or patient‐months | Certainty of the evidence | |
| Risk with coiled | Risk with straight | ||||
| Peritonitis | 217 per 1,000 | 225 per 1,000 | RR 1.04 | 818 (9) | ⊕⊕⊕⊝ |
| Peritonitis rate (patient‐months) | 32 per 1,000 | 29 per 1,000 | RR 0.91 | 5882 (5) | ⊕⊕⊕⊝ |
| Exit‐site/tunnel infection | 281 per 1,000 | 314 per 1,000 | RR 1.12 | 826 (10) | ⊕⊕⊕⊝ |
| Exit‐site/tunnel infection rate (patient‐months) | 27 per 1,000 | 28 per 1,000 | RR 1.05 | 5286 (4) | ⊕⊕⊕⊝ |
| Catheter removal or replacement | 249 per 1,000 | 276 per 1,000 | RR 1.11 | 713 (9) | ⊕⊝⊝⊝ |
| Technique failure | 131 per 1,000 | 108 per 1,000 | RR 0.82 | 442 (4) | ⊕⊕⊕⊝ |
| Death (all causes) | 124 per 1,000 | 117 per 1,000 | RR 0.95 | 703 (8) | ⊕⊕⊝⊝ |
| *The risk in the intervention group (and its 95% confidence interval) is based on the assumed risk in the comparison group and the relative effect of the intervention (and its 95% CI). | |||||
| GRADE Working Group grades of evidence | |||||
| 1 Downgraded one level: most studies are of suboptimal quality 2 Downgrade one level: inconsistency 3 Downgraded one level: publication bias | |||||
| Tenckhoff catheter with artificial curve at tunnel tract versus swan‐neck for preventing catheter‐related infections in chronic peritoneal dialysis patients | |||||
| Patient or population: preventing catheter‐related infections in chronic peritoneal dialysis patients | |||||
| Outcomes | Anticipated absolute effects* (95% CI) | Relative effect | No. of participants or patient‐months | Certainty of the evidence | |
| Risk with swan‐neck | Risk with Tenckhoff | ||||
| Peritonitis | 329 per 1,000 | 424 per 1,000 | RR 1.29 | 140 (2) | ⊕⊕⊝⊝ |
| Peritonitis rate (patient‐months) | 47 per 1,000 | 57 per 1,000 | RR 1.22 | 2535 (2) | ⊕⊕⊝⊝ |
| Exit‐site/tunnel infection | 671 per 1,000 | 645 per 1,000 | RR 0.96 | 140 (2) | ⊕⊕⊕⊝ |
| Exit‐site/tunnel infection rate (patient‐months) | 83 per 1,000 | 55 per 1,000 | RR 0.67 | 2535 (2) | ⊕⊕⊕⊝ |
| Catheter removal or replacement | 229 per 1,000 | 194 per 1,000 | RR 0.85 | 140 (2) | ⊕⊕⊕⊝ |
| Technique failure | 157 per 1,000 | 101 per 1,000 | RR 0.64 | 140 (2) | ⊕⊕⊕⊝ |
| Death (all causes) | 114 per 1,000 | 85 per 1,000 | RR 0.74 | 140 (2) | ⊕⊕⊝⊝ |
| *The risk in the intervention group (and its 95% confidence interval) is based on the assumed risk in the comparison group and the relative effect of the intervention (and its 95% CI). | |||||
| GRADE Working Group grades of evidence | |||||
| 1 Downgraded two levels: suboptimal quality of studies and imprecision 2 Downgraded two levels: suboptimal quality of studies and inconsistency 3 Downgraded one level: suboptimal quality of studies | |||||
| Self‐locating versus straight Tenckhoff catheter for preventing catheter‐related infections in chronic peritoneal dialysis patients | |||||
| Patient or population: chronic peritoneal dialysis patients | |||||
| Outcomes | Anticipated absolute effects* (95% CI) | Relative effect | No. of participants | Certainty of the evidence | |
| Risk with straight Tenckhoff | Risk with self‐locating | ||||
| Peritonitis | 684 per 1,000 | 773 per 1,000 | RR 1.13 | 78 (1) | ⊕⊝⊝⊝ |
| Exit‐site/tunnel infection | 184 per 1,000 | 175 per 1,000 | RR 0.95 | 78 (1) | ⊕⊝⊝⊝ |
| Catheter removal or replacement | 343 per 1,000 | 110 per 1,000 | RR 0.32 | 139 (2) | ⊕⊝⊝⊝ |
| Technique failure | 414 per 1,000 | 265 per 1,000 | RR 0.64 | 139 (2) | ⊕⊕⊕⊝ |
| Death (all causes) | 71 per 1,000 | 73 per 1,000 | RR 1.02 | 139 (2) | ⊕⊕⊝⊝ |
| *The risk in the intervention group (and its 95% confidence interval) is based on the assumed risk in the comparison group and the relative effect of the intervention (and its 95% CI). | |||||
| GRADE Working Group grades of evidence | |||||
| 1 Downgraded three levels: single study, suboptimal quality, and imprecision 2 Downgraded three levels: suboptimal quality, imprecision and inconsistency 3 Downgraded one level: suboptimal quality of study 4 Downgraded two levels: suboptimal quality and imprecision | |||||
Background
Description of the condition
Peritonitis is a serious complication of peritoneal dialysis (PD) that is associated with appreciably higher rates of hospitalisation (Barraclough 2010; Edey 2010; Htay 2018), technique failure (Htay 2017; Kolesnyk 2010 ) and death (Boudville 2012). Moreover, a previous study (Campbell 2016) has shown that peritonitis has serious impacts on patients’ lifestyles (burden on family, financial burden) and quality of life (feeling of pain, loss of control and dignity). In addition, peritonitis and its complications can potentially increase the financial burden on healthcare systems (Li 2017).
Several factors can potentially contribute to a heightened risk of peritonitis, including older age (Kotsanas 2007; McDonald 2004), race (Lim 2011; McDonald 2004; Piraino 2002; Shen 2013), body mass index (Jegatheesan 2018; McDonald 2004), coexisting diseases (for example, diabetes mellitus) (Chow 2005), nasal carriage of Staphylococcus aureus (Schaefer 2003; Ong 2016), immunocompromised status, and connection methodology (Strippoli 2004a). However, PD‐related infection can be prevented by measures including administering antibiotic prophylaxis prior to catheter implantation (Strippoli 2004a), application of topical antimicrobial agent at catheter exit‐site (Xu 2009), and antibiotic prophylaxis prior to invasive gastrointestinal and gynaecological procedures (Wu 2013).
A previous observational study reported that double cuff catheters were associated with a lower risk of exit‐site infection compared with single cuff catheters (Lindblad 1988). However, this association was unable to be confirmed in an RCT (Eklund 1997) or meta‐analysis (Strippoli 2004; Strippoli 2004b).The International Society for Peritoneal Dialysis (ISPD) has recently issued updated guidelines for PD‐related peritonitis prevention, which do not recommend any specific method of catheter implantation or type of catheter for the prevention of peritonitis in PD patients (Li 2016; Szeto 2017). These guidelines are largely based on the previous Cochrane review (Strippoli 2004). Since the last review, there have been several RCTs published on the different catheter types and implantation techniques in PD patients. The present review examined the role of catheter‐related interventions, including different catheter types, placement and insertion techniques, in mitigating the risk of peritonitis in PD patients.
Description of the intervention
One of the key strategies employed to prevent PD‐related peritonitis is to reduce the risk of microbial contamination via PD catheters. Different catheter‐related interventions were examined in the review, including various catheter implantation methods (laparoscopic insertion, open surgery, percutaneous insertion, ureteroscope‐assisted insertion, cystoscopy‐assisted insertion, radiological insertion, midline or lateral insertion, implantation and subcutaneous burying of catheter with a resting period prior to catheter use, modified surgery with catheter fixation), different catheter types (single‐cuff, double‐cuff, triple‐cuff, straight catheter, coiled catheter, self‐locating catheter, swan‐neck catheter, Moncrief‐Popovich catheter, antibiotic‐treated catheter), use of silver rings at exit‐sites, immobilization of PD catheters, and break‐in periods.
How the intervention might work
A randomised study by Gadallah 1999 reported that early peritonitis episodes (within 2 weeks of catheter placement) were significantly lower in76 patients who underwent catheter insertion via a peritoneoscopic approach compared to 72 patients with surgically placed catheters (2.6% versus 12.5%, P = 0.02). The previous systematic review conducted in 2004 (Strippoli 2004) reported that no specific catheter implantation technique was beneficial in lowering the risk of peritonitis. Since then, the approaches in catheter insertion technique and types of available catheters have evolved, which may have impacted on the risk of peritonitis and in turn translated into improvements in catheter and/or technique survival
Why it is important to do this review
The ISPD guidelines do not recommend any specific implantation method or any specific type of catheter for prevention of peritonitis in PD patients. This recommendation was mainly based on the results of the previous review. Since then, more randomised controlled trials (RCTs) have been published on this topic which this update will include.
Objectives
To evaluate the role of different catheter implantation techniques and catheter types in lowering the risk of PD‐related peritonitis in PD patients.
Methods
Criteria for considering studies for this review
Types of studies
All RCTs and quasi‐RCTs (RCTs in which allocation to treatment was obtained by alternation, use of alternate medical records, date of birth or other predictable methods) investigating the effect of different catheter types, placement and insertion techniques for the prevention of peritonitis in PD patients.
Types of participants
Inclusion criteria
Adults and children undergoing PD treatment for end‐stage kidney disease.
Exclusion criteria
Patients not on PD.
Types of interventions
-
Surgical catheter insertion techniques (laparoscopy, laparotomy, subcutaneous burying and rest of catheter, standard insertion with resting but no subcutaneous burying of catheter, midline insertion, lateral insertion)
-
Catheter types (straight, coiled, self‐locating catheter, Tenckhoff catheter with an artificial curve at the subcutaneous tract, single‐cuffed, double‐cuffed, triple‐cuffed, antibiotic treated catheter
-
Use of immobilisation techniques
-
Break‐in periods
-
Use of silver ring at exit‐site (new intervention identified during updated search).
Types of outcome measures
Primary outcomes
-
Peritonitis: number of patients with peritonitis (peritonitis defined as dialysate count of > 100 cells/mm3 with > 50% being polymorphonuclear leukocytes) and peritonitis rate
-
Exit‐site and tunnel infection: number of patients with exit‐site and tunnel infection and exit‐site and tunnel infection rates.
Secondary outcomes
-
Catheter removal/catheter replacement
-
Technique failure (transfer from PD to haemodialysis)
-
Death (all causes)
-
Peritonitis relapse
-
Peritonitis‐related death
-
Time to first peritonitis episode.
Search methods for identification of studies
Electronic searches
We searched the Cochrane Kidney and Transplant Register of Studies up to 15 January 2019 through contact with the Information Specialist using search terms relevant to this review. The Register contains studies identified from the following sources.
-
Monthly searches of the Cochrane Central Register of Controlled Trials (CENTRAL)
-
Weekly searches of MEDLINE OVID SP
-
Handsearching of kidney‐related journals and the proceedings of major kidney and transplant conferences
-
Searching of the current year of EMBASE OVID SP
-
Weekly current awareness alerts for selected kidney and transplant journals
-
Searches of the International Clinical Trials Register (ICTRP) Search Portal and ClinicalTrials.gov.
Studies contained in the Register are identified through searches of CENTRAL, MEDLINE, and EMBASE based on the scope of Cochrane Kidney and Transplant. Details of search strategies, as well as a list of handsearched journals, conference proceedings and current awareness alerts, are available in the Specialised Register section of information about Cochrane Kidney and Transplant.
See Appendix 1 for search terms used in strategies for this review.
Searching other resources
-
Reference lists of review articles, relevant studies and clinical practice guidelines.
-
Letters seeking information about unpublished or incomplete studies to investigators known to be involved in previous studies.
Data collection and analysis
Selection of studies
The search strategies described were used to obtain titles and abstracts of studies that may be relevant to the review. The titles and abstracts were screened independently by two authors, who discarded studies that were not applicable, however studies and reviews that may have included relevant data or information on studies were retained initially. Two authors independently assessed retrieved abstracts and, where necessary the full text, of these studies to determine which studies satisfied the inclusion criteria.
Data extraction and management
Data extraction was carried out independently by two authors using standard data extraction forms. It was planned that studies reported in non‐English language journals would be translated before assessment. Where more than one publication of one study existed, reports were grouped together and the publication with the most complete data was included.
Assessment of risk of bias in included studies
The following items were assessed independently by two authors using the risk of bias assessment tool (Higgins 2011) (see Appendix 2).
-
Was there adequate sequence generation (selection bias)?
-
Was allocation adequately concealed (selection bias)?
-
Was knowledge of the allocated interventions adequately prevented during the study?
-
Participants and personnel (performance bias)
-
Outcome assessors (detection bias)
-
-
Were incomplete outcome data adequately addressed (attrition bias)?
-
Are reports of the study free of suggestion of selective outcome reporting (reporting bias)?
-
Was the study apparently free of other problems that could put it at a risk of bias?
Measures of treatment effect
Data from individual studies were analysed using the risk ratio (RR) measure and its 95% confidence intervals (CI). Subgroup analysis was planned to explore potential sources of variability in observed treatment effect where possible (children versus adult population, diabetic versus non‐diabetic, study quality, timing of peritonitis or other outcome). Absolute effects were reported where appropriate.
Unit of analysis issues
Where data on the number of subjects with events (e.g. number of participants with one or more episodes of peritonitis) were available, the RR was calculated as the ratio of the incidence of the event (one or more episodes) in the experimental treatment group over the incidence in the control group. Where data on the number of episodes were available, then the RR was calculated as the ratio of the rate of the outcome (e.g. the peritonitis rate) in the experimental treatment group (given by number of episodes of the outcome over total patient months on PD) over the rate in the control group.
Dealing with missing data
Any further information or clarification required from the authors was requested by written or electronic correspondence and relevant information obtained in this manner was included in the review. Disagreements were resolved in consultation with the other two authors.
Assessment of heterogeneity
We first assessed the heterogeneity by visual inspection of the forest plot. We then quantified statistical heterogeneity using the I2 statistic, which describes the percentage of total variation across studies that is due to heterogeneity rather than sampling error (Higgins 2003). A guide to the interpretation of I2 values was as follows.
-
0% to 40%: might not be important
-
30% to 60%: may represent moderate heterogeneity
-
50% to 90%: may represent substantial heterogeneity
-
75% to 100%: considerable heterogeneity.
The importance of the observed value of I2 depends on the magnitude and direction of treatment effects and the strength of evidence for heterogeneity (e.g. P‐value from the Chi2 test, or a confidence interval for I2) (Higgins 2011).
Assessment of reporting biases
It was also planned that if sufficient RCTs were identified, an attempt would be made to assess for publication bias using a funnel plot (Egger 1997).
Data synthesis
When appropriate, summary estimators of treatment effects were calculated using a random effects model with RR and its 95% CI.
Subgroup analysis and investigation of heterogeneity
Subgroup analysis was used to explore possible sources of heterogeneity (e.g. study duration, participants, interventions and study quality). Heterogeneity among participants may have been related to age and co‐existing conditions, for example diabetes mellitus. Heterogeneity in interventions may have been related to prior prophylactic antibiotics used and the type and dose of therapy. If subgroup analysis was unable to be performed due to absence of other similar studies, this limitation was acknowledged and discussed in the manuscript.
Sensitivity analysis
Where sufficient studies were available we investigated the following:
-
Studies with data from RCTs only or quasi RCTs only
-
Studies with different risks of bias together, for example, studies with low attrition bias risk and studies with high attrition bias risk.
Summary of findings' tables
We presented the main results of the review in 'Summary of findings' tables. These tables present key information concerning the quality of the evidence, the magnitude of the effects of the interventions examined, and the sum of the available data for the main outcomes (Schünemann 2011a). The 'Summary of findings' tables also include an overall grading of the evidence related to each of the main outcomes using the GRADE (Grades of Recommendation, Assessment, Development and Evaluation) approach (GRADE 2008; GRADE 2011). The GRADE approach defines the quality of a body of evidence as the extent to which one can be confident that an estimate of effect or association is close to the true quantity of specific interest. The quality of a body of evidence involves consideration of within‐trial risk of bias (methodological quality), directness of evidence, heterogeneity, precision of effect estimates and risk of publication bias (Schünemann 2011b). We presented the following outcomes in the 'Summary of findings' tables.
-
Incidence of peritonitis (defined as number of patients with peritonitis)
-
Peritonitis rate (episode/patient‐months)
-
Incidence of exit‐site/tunnel infection (defined as number of patients of exit‐site/tunnel infection)
-
Exit‐site/tunnel infection rate (episode/patient‐months)
-
Catheter removal/replacement
-
Technique failure (death‐censored)
-
Death (all causes).
Results
Description of studies
Results of the search
The original Cochrane review contained 17 included studies (Akyol 1990; Danielsson 2002; Dasgupta 1998; Ejlersen 1990; Eklund 1994; Eklund 1995; Eklund 1997; Gadallah 1999; Lye 1996; Moncrief 1998; Nielsen 1995; Park 1998; Rubin 1990; Scott 1994; Tsimoyiannis 2000; Turner 1992; Wright 1999) and two ongoing studies.
For this update we searched Cochrane Kidney and Transplant's Specialised Register up to January 2019 and identified 49 new reports. After full‐text assessment 34 new studies were identified: 25 new studies (34 reports) were included (Akcicek 1995; Al‐Hwiesh 2016; Atapour 2011; Buijsen 1994; Chen 2014a; Johnson 2006; Jwo 2010; Li 2009e; Lo 2003b; Merrikhi 2014; Ouyang 2015; Qian 2014; Sanchez‐Canel 2016; SIPROCE 1997; Stegmayr 2005a; Stegmayr 2015; Sun 2015a; Timely PD 2010; Trooskin 1990; Voss 2012; Winch 2000; Xie 2011a; Yip 2010; Zhang 2016; Zhu 2015), 6 studies (6 reports) were excluded (Crabtree 2003; ISRCTN87054124; Moncrief 1994; N0547061060; O'Dwyer 2005; Williams 1989), and two ongoing studies were identified (NCT01023191; NCT02479295). Three studies are awaiting assessment (no data available and awaiting author response) (Ahmad 2010; LOCI 2011; Wong 2004b). We also identified three new reports of three existing included studies.
For this update a total of 42 studies (54 reports, 3144 participants) (Figure 1) were included.
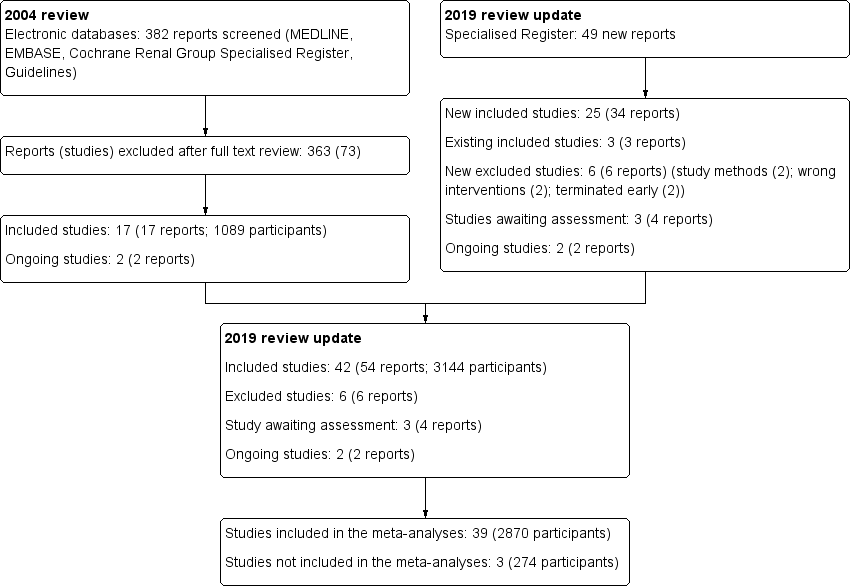
Study flow diagram.
Included studies
Eighteen studies (1314 randomised participants) examined different methods of catheter insertion.
-
Laparoscopy versus laparotomy: 4 studies (320 participants) (Gadallah 1999; Jwo 2010; Tsimoyiannis 2000; Wright 1999)
-
Subcutaneous burying with a period of resting of the catheter versus standard insertion: 3 studies (232 participants) (Danielsson 2002; Moncrief 1998; Park 1998)
-
Midline versus lateral insertion: 2 studies (122 participants) (Ejlersen 1990; Rubin 1990)
-
Open surgery versus percutaneous implantation: 2 studies (96 participants) (Atapour 2011; Merrikhi 2014)
-
Open surgery versus open surgery with omentum folding: 1 study (67 participants) (Chen 2014a)
-
Radiological versus surgical implantation: 1 study (113 participants) (Voss 2012)
-
Open surgery versus modified open surgery with or without catheter fixation: 1 study (152 participants) (Zhang 2016)
-
Conventional open surgery versus vertical tunnel‐based low‐site implantation: 1 study (89 participant) (Sun 2015a)
-
Open surgery versus ureteroscopic‐assisted surgery: 1 study (72 participants) (Zhu 2015)
-
Cystoscopy‐assisted surgery versus open surgery: 1 study (29 participants) (Qian 2014)
-
Laparoscopic Moncrief‐Popovich technique versus blind trocar technique: 1 study (22 participants) (Akcicek 1995).
Twenty‐one studies (1447 randomised participants) examined different types of PD catheters.
-
Straight versus coiled catheters: 12 studies (878 participants) (Akyol 1990; Dasgupta 1998; Eklund 1994; Eklund 1995; Johnson 2006; Lo 2003b; Lye 1996; Nielsen 1995; Ouyang 2015; Scott 1994; Stegmayr 2005a; Xie 2011a)
-
Straight‐tip versus self‐locating tip catheters: 2 studies (139 participants) (Sanchez‐Canel 2016; Stegmayr 2015)
-
Swan‐neck straight‐tip versus straight‐tip with artificial curve at subcutaneous tunnel tract: 2 studies (140 participants) (Li 2009e; Yip 2010)
-
Single versus double cuff catheters: 2 studies (109 participants) (Buijsen 1994; Eklund 1997)
-
Double versus triple cuff catheters: 1 study (73 participants) (Al‐Hwiesh 2016)
-
Swan‐neck versus straight curled catheter: 1 study (22 participants) (Winch 2000)
-
Antibiotic‐treated versus standard catheters: 1 study (86 participants) (Trooskin 1990).
There were two additional studies that examined other interventions: one study (195 participants) (SIPROCE 1997) compared a silver ring versus no silver ring at the exit‐site, and one study (66 participants) (Turner 1992) compared immobilisation versus non‐immobilisation of PD catheters.
There was one study examining the different break‐in periods (122 participants) (Timely PD 2010).
Three studies could not be included in the meta‐analyses (Dasgupta 1998; Moncrief 1998; Timely PD 2010).
Excluded studies
Six studies did not meet our inclusion criteria and were excluded (Figure 1). The reasons for exclusion were wrong study methods (Crabtree 2003; N0547061060), wrong interventions (O'Dwyer 2005; Williams 1989), or terminated early (ISRCTN87054124; Moncrief 1994).
Risk of bias in included studies
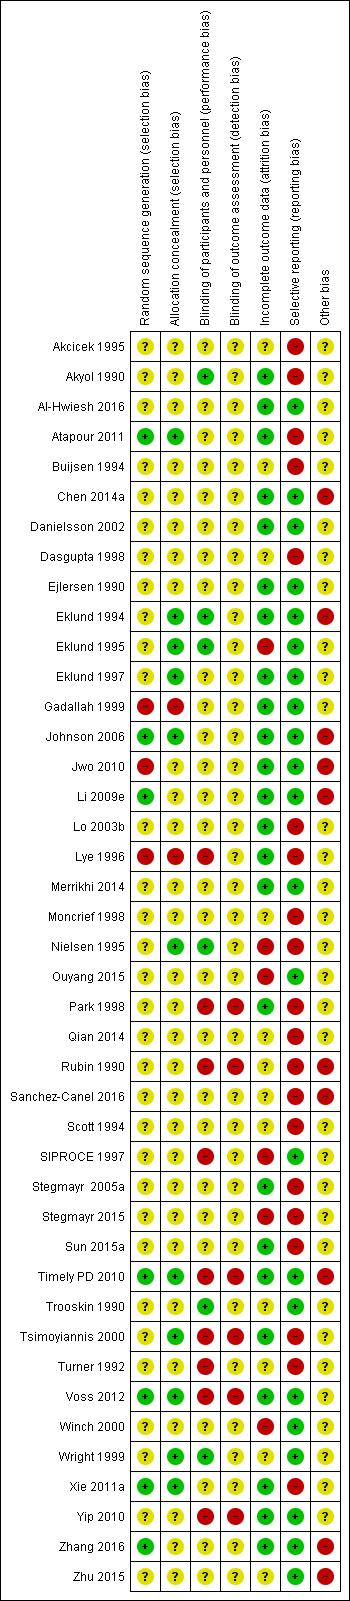
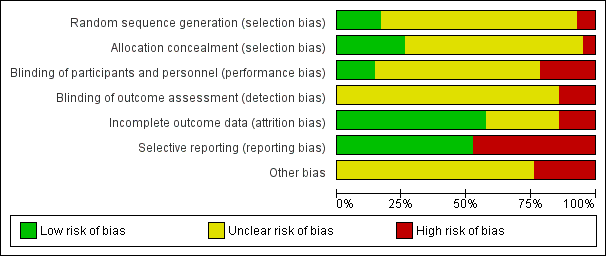
The quality of the studies was difficult to assess because many details such as the use of intention‐to‐treat analysis and the number of patients lost to follow‐up were difficult to ascertain or were not provided. In general, study quality was variable and almost all aspects of study design did not fulfil CONSORT standards for reporting (CONSORT 2001). Risk of bias for the individual studies is presented in Figure 2 and the summary is presented in Figure 3.

Risk of bias summary: review authors' judgements about each risk of bias item for each included study.

Risk of bias graph: review authors' judgements about each risk of bias item presented as percentages across all included studies.
Allocation
Random sequence generation
Random sequence generation was judged to be at low risk of bias in seven studies (Atapour 2011; Johnson 2006; Li 2009e; Timely PD 2010; Voss 2012; Xie 2011a; Zhang 2016) and at high risk of bias in three studies (Gadallah 1999; Jwo 2010; Lye 1996). The risk of bias was unclear for the remaining 32 studies.
Allocation concealment
Allocation concealment was judged to be at low risk of bias in 11 studies (Atapour 2011; Eklund 1994; Eklund 1995; Eklund 1997; Johnson 2006; Nielsen 1995; Timely PD 2010; Tsimoyiannis 2000; Voss 2012; Wright 1999; Xie 2011a) and at high risk of bias in two studies (Gadallah 1999; Lye 1996). The risk of bias was unclear in the remaining 29 studies.
Blinding
Performance bias (blinding of participants and investigators) was judged to be at low risk of bias in six studies (Akyol 1990; Eklund 1994; Eklund 1995; Nielsen 1995; Trooskin 1990; Wright 1999) and at high risk of bias in nine studies (Lye 1996; Park 1998; Rubin 1990; SIPROCE 1997; Timely PD 2010; Tsimoyiannis 2000; Turner 1992; Voss 2012; Yip 2010). The risk of bias was unclear in the remaining 27 studies.
Detection bias (blinding of outcome assessors) was judged to be at high risk of bias in six studies (Park 1998; Rubin 1990; Timely PD 2010; Tsimoyiannis 2000; Voss 2012; Yip 2010). The risk of bias was unclear in the remaining 36 studies.
Incomplete outcome data
Attrition bias was judged to be at low risk of bias in 24 studies (Akyol 1990; Al‐Hwiesh 2016; Atapour 2011; Chen 2014a; Danielsson 2002; Ejlersen 1990; Eklund 1994; Eklund 1997; Gadallah 1999; Johnson 2006; Jwo 2010; Li 2009e; Lo 2003b; Lye 1996; Merrikhi 2014; Park 1998; Stegmayr 2005a; Sun 2015a; Timely PD 2010; Tsimoyiannis 2000; Voss 2012; Xie 2011a; Yip 2010; Zhang 2016) and at high risk of bias in six studies (Eklund 1995; Nielsen 1995; Ouyang 2015; SIPROCE 1997; Stegmayr 2015; Winch 2000). The risk of bias was unclear in the remaining 12 studies.
Selective reporting
Reporting bias was judged to be at low risk of bias in 22 studies (Al‐Hwiesh 2016; Chen 2014a; Danielsson 2002; Ejlersen 1990; Eklund 1994; Eklund 1995; Eklund 1997; Gadallah 1999; Johnson 2006; Jwo 2010; Li 2009e; Merrikhi 2014; Ouyang 2015; SIPROCE 1997; Timely PD 2010; Trooskin 1990; Voss 2012; Winch 2000; Wright 1999; Yip 2010; Zhang 2016; Zhu 2015) and at high risk of bias in 20 studies (Akcicek 1995; Akyol 1990; Atapour 2011; Buijsen 1994; Dasgupta 1998; Lo 2003b; Lye 1996; Moncrief 1998; Nielsen 1995; Park 1998; Qian 2014; Rubin 1990; Sanchez‐Canel 2016; Scott 1994; Stegmayr 2005a; Stegmayr 2015; Sun 2015a; Tsimoyiannis 2000; Turner 1992; Xie 2011a).
Other potential sources of bias
Ten studies (23%) were identified as high risk for other potential sources of bias. The potential sources of other risks of bias included: different baseline characteristics between the two groups (Johnson 2006; Jwo 2010; Sanchez‐Canel 2016; Zhang 2016; Zhu 2015; 511 participants); use of a different definition for peritonitis (Eklund 1994; 40 participants); premature study closure due to insufficient supply of the intervention (Li 2009e; 39 participants); examination of two distinct interventions (the new method of insertion and new catheter or new method insertion (Rubin 1990) and different connection methods (Chen 2014a)) in the treatment arm (152 participants); and violation of study protocols (Timely PD 2010; 122 participants).
Effects of interventions
See: Summary of findings for the main comparison Laparoscopy versus laparotomy for preventing catheter‐related infections in chronic peritoneal dialysis patients; Summary of findings 2 Buried (subcutaneous) versus non‐buried catheter for preventing catheter‐related infections in chronic peritoneal dialysis patients; Summary of findings 3 Midline versus lateral insertion for preventing catheter‐related infections in chronic peritoneal dialysis patients; Summary of findings 4 Percutaneous insertion versus open surgery for preventing catheter‐related infections in chronic peritoneal dialysis patients; Summary of findings 5 Straight versus coiled catheters for preventing catheter‐related infections in chronic peritoneal dialysis patients; Summary of findings 6 Tenckhoff catheter with artificial curve at tunnel tract versus swan‐neck for preventing catheter‐related infections in chronic peritoneal dialysis patients; Summary of findings 7 Self‐locating versus straight Tenckhoff catheter for preventing catheter‐related infections in chronic peritoneal dialysis patients
Laparoscopy versus laparotomy
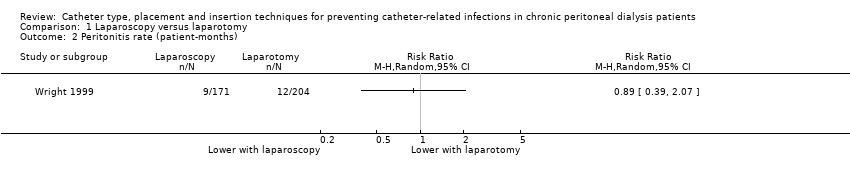
Laparoscopy insertion compared with laparotomy probably makes little or no difference to the incidence of peritonitis (Analysis 1.1 (4 studies, 315 participants): RR 0.90, 95% CI 0.59 to 1.35, P = 0.60; I2 = 5%; moderate certainty evidence; 24 fewer per 1000), exit site/tunnel infection (Analysis 1.3 (3 studies, 270 participants): RR 1.00, 95% CI 0.43 to 2.31, P = 0.99; I2 = 30%; low certainty evidence; 0 fewer per 1000), catheter removal or replacement (Analysis 1.4 (3 studies, 167 participants): RR 1.20, 95% CI 0.77 to 1.86, P = 0.42; I2 = 0%; low certainty evidence), technique failure (Analysis 1.5 (4 studies, 283 participants): RR 0.71, 95% CI 0.47 to 1.08, P = 0.11, I2 = 5%; low certainty evidence), and death (all causes) (Analysis 1.6 (3 studies, 270 participants): RR 1.26, 95% CI 0.72 to 2.20, P = 0.42; I2 = 0%; moderate certainty evidence) (summary of findings Table for the main comparison). Wright 1999 reported no difference in peritonitis rate between laparoscopy and laparotomy (Analysis 1.2 (375 patient‐months): RR 0.89, 95% CI 0.39 to 2.07). Laparoscopy may make little or no difference to dialysate leak compared with laparotomy insertion (Analysis 1.7 (3 studies, 167 participants): RR 0.85, 95% CI 0.10 to 6.97, P = 0.88; I2 = 63%; low certainty evidence).
Moderate heterogeneity was resolved by subgroup analysis with different break‐in periods. Jwo 2010 reported 3 post‐operative bleeding (haematoma or haemoperitoneum) and 2 hernia in laparoscopic insertion compared with 8 bleed and 1 hernia in laparotomy (Table 1).
| Study ID | Intervention | Control group | ||
| Events | Total | Events | Total | |
| Haematoma or haemoperitoneum | ||||
| 1 | 31 | 4 | 30 | |
| 7 | 34 | 4 | 32 | |
| 7 | 40 | 6 | 38 | |
| 0 | 36 | 0 | 37 | |
| 0 | 18 | 2 | 17 | |
| 3 | 99 | 2 | 90 | |
| 0 | 20 | 0 | 20 | |
| 0 | 20 | 0 | 20 | |
| 14 | 20 | 22 | 19 | |
| 1 | 48 | 1 | 35 | |
| 0 | 30 | 1 | 59 | |
| 1 | 103 | 0 | 49 | |
| Dialysate leak | ||||
| 2 | 34 | 1 | 32 | |
| 9 | 40 | 7 | 38 | |
| 7 | 40 | 6 | 37 | |
| 1 | 31 | 1 | 30 | |
| 2 | 36 | 3 | 37 | |
| 2 | 10 | 4 | 12 | |
| 0 | 20 | 2 | 20 | |
| 0 | 20 | 4 | 20 | |
| 0 | 20 | 0 | 20 | |
| 1 | 38 | 0 | 34 | |
| 0 | 99 | 3 | 90 | |
| 0 | 14 | 1 | 15 | |
| 6 | 48 | 3 | 35 | |
| 2 | 30 | 0 | 59 | |
| 1 | 29 | 3 | 32 | |
| 4 | 57 | 10 | 56 | |
| 2 | 11 | 0 | 11 | |
| 2 | 21 | 0 | 24 | |
| 1 | 40 | 0 | 40 | |
| 0 | 50 | 0 | 51 | |
| 0 | 103 | 1 | 49 | |
| Viscus perforation | ||||
| Nielsen 1995 (bladder perforation) | 0 | 38 | 1 | 34 |
| Al‐Hwiesh 2016 (bowel perforation) | 0 | 36 | 0 | 37 |
| Merrikhi 2014 (hollow viscus perforation) | 0 | 18 | 0 | 17 |
| 0 | 31 | 0 | 30 | |
| Outflow failure or catheter tip migration | ||||
| 1 | 31 | 4 | 30 | |
| 2 | 20 | 1 | 19 | |
| 12 | 40 | 25 | 38 | |
| 3 | 57 | 4 | 56 | |
| 1 | 36 | 11 | 37 | |
| 1 | 30 | 2 | 59 | |
| 3 | 20 | 1 | 20 | |
| 0 | 14 | 1 | 15 | |
| 1 | 10 | 3 | 12 | |
| 1 | 11 | 1 | 11 | |
| Hernia | ||||
| 0 | 34 | 1 | 32 | |
| 2 | 40 | 1 | 37 | |
| 7 | 40 | 7 | 38 | |
| 4 | 99 | 6 | 90 | |
| 2 | 40 | 2 | 40 | |
| 4 | 57 | 8 | 56 | |
| 0 | 103 | 1 | 49 | |
Implantation and subcutaneous burying of the catheter versus standard insertion with resting but no subcutaneous burying of the catheter
It is uncertain whether the subcutaneous burying of a PD catheter 6 weeks before initiation of PD prevents peritonitis rates (Analysis 2.1 (2 studies, 2511 patient‐months): RR 1.16, 95% CI 0.37 to 3.60, P = 0.80; I2 = 84%; very low certainty evidence). Subcutaneous burying of catheter may make little or no difference to exit site/tunnel infection (Analysis 2.2 (2 studies, 2511 patient‐months): RR 1.15, 95% CI 0.39 to 3.42, P = 0.80; I2 = 67%; low certainty evidence) and probably makes little or no difference to death (all causes) (Analysis 2.4 (2 studies, 119 participants): RR 0.90, 95% CI 0.39 to 2.08, P = 0.81; I2 = 0%; moderate certainty evidence) compared with standard PD catheter insertion. Danielsson 2002 reported no difference in technique failure between the two groups (Analysis 2.3 (60 participants): RR 0.33, 95% CI 0.04 to 3.03) (summary of findings Table 2).
There was considerable heterogeneity in the analysis of peritonitis rate and exit‐site/tunnel infection rate. A detailed subgroup analysis was unable to be performed given that only two studies were included. There were differences in study design (single versus multicentre study), catheter types (Moncrief‐Popovich catheter versus swan‐neck catheter), connection methodology (double bag versus either Y connector or standard spike), and follow‐up periods (0.4 to 44 months versus 12 months) between the two studies that could have introduced heterogeneity. Park 1998 reported no difference in post‐operative bleeding and dialysate leak between the two groups.
Midline versus lateral insertion of the PD catheter
The midline insertion compared with lateral insertion of PD catheters probably makes little or no difference to the risks of peritonitis (Analysis 3.1 (2 studies, 120 participants): RR 0.65, 95% CI 0.32 to 1.33, P = 0.24; I2 = 0%; moderate certainty evidence) and may make little or no difference to exit‐site/tunnel infection (Analysis 3.2 (2 studies, 120 participants): RR 0.56, 95% CI 0.12 to 2.58, P = 0.45; I2= 5%; low certainty evidence) compared with lateral insertion of PD catheter. Rubin 1990 reported midline insertion reduced the risk of catheter removal or replacement compared with lateral insertion (Analysis 3.3 (83 participants): RR 0.57, 95% CI 0.33 to 0.98, P = 0.04). Ejlersen 1990 reported no difference in death (all causes) between midline versus lateral insertion of catheter (Analysis 3.4 (37 participants): RR 8.50, 95% CI 0.50 to 143.32) (summary of findings Table 3). Rubin 1990 reported 6 dialysate leaks in the midline compared with 3 leaks in the lateral insertion group and 1 haematoma at the exit‐site in each group.
Percutaneous insertion versus open surgery
Percutaneous insertion compared with open surgical insertion of a PD catheter probably makes little or no difference to exit‐site/tunnel infection (Analysis 4.1 (2 studies, 96 participants): RR 0.16, 95% CI 0.02 to 1.30, P = 0.08; I2 = 0%; moderate certainty evidence). Atapour 2011 reported no episodes of early peritonitis in either group and similar risks of catheter removal or replacement between the two groups (Analysis 4.2 (1 study, 61 participants): RR 0.24, 95% CI 0.03 to 2.04) (summary of findings Table 4). Percutaneous insertion makes little or no difference to post‐operative bleeding (haematoma or haemoperitoneum) compared to open surgery (Analysis 4.3 (2 studies, 96 participants) RR 0.22, 95% CI 0.04 to 1.26, I2= 0%; low certainty evidence). Atapour 2011) reported 1 outflow failure with percutaneous insertion compared with 4 with open surgery. Two studies (Atapour 2011; Merrikhi 2014) reported no viscus perforation or dialysate leak in either group.
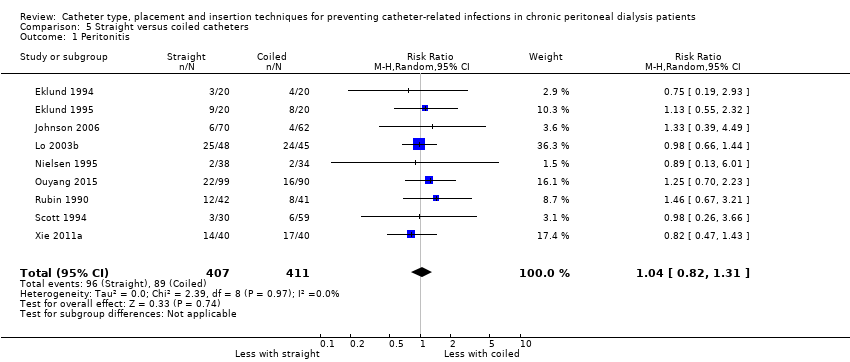
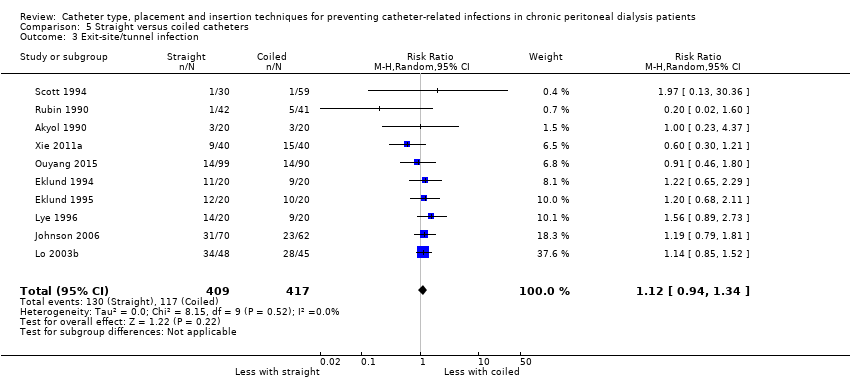
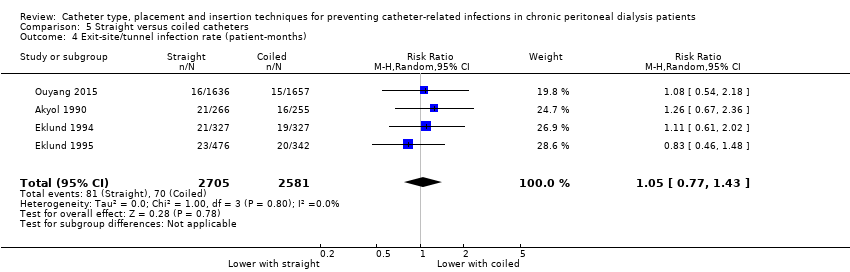
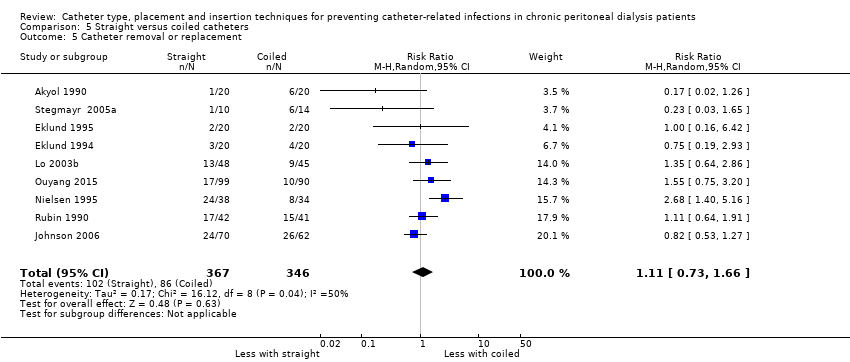
Straight versus coiled PD catheter
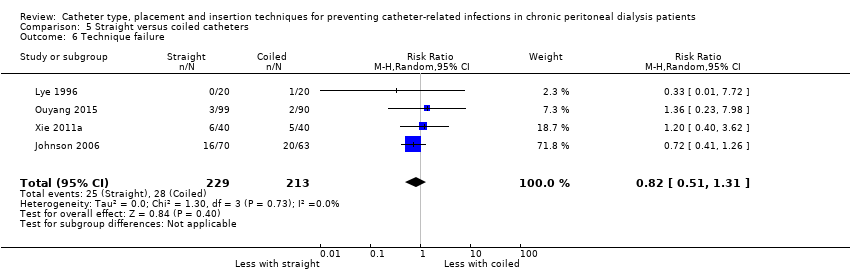
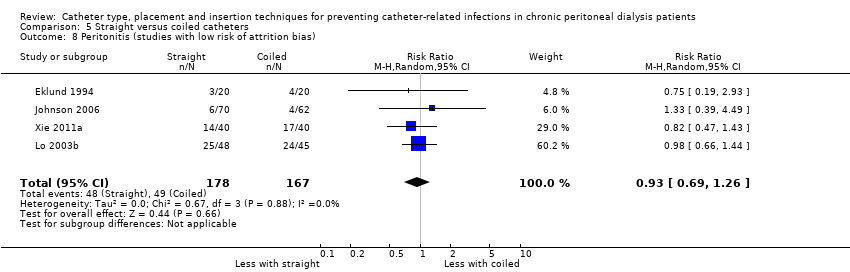
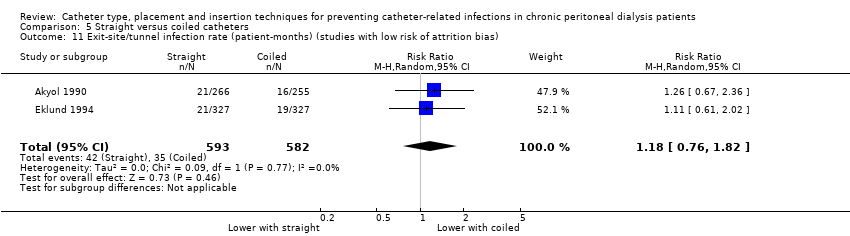
A straight catheter probably makes little or no difference to the risk of peritonitis (Analysis 5.1 (9 studies, 818 participants): RR 1.04, 95% CI 0.82 to 1.31, P = 0.74; I2 = 0%; moderate certainty evidence; 9 more per 1000), peritonitis rate (Analysis 5.2 (5 studies, 5882 patient‐months): RR 0.91, 95% CI 0.68 to 1.21, P = 0.51, I2 = 0% moderate certainty evidence), the risk of exit‐site/tunnel infection (Analysis 5.3 (10 studies, 826 participants): RR 1.12, 95% CI 0.94 to 1.34, P = 0.22; I2 = 0%; moderate certainty evidence; 34 more per 1000), and exit‐site/tunnel infection rate (Analysis 5.4 (4 studies, 5286 patient‐months): RR 1.05, 95% CI 0.77 to 1.43, P = 0.78; I2 = 0%; moderate certainty evidence) compared with a coiled catheter. It is uncertain whether straight catheters prevent catheter removal or replacement (Analysis 5.5 (9 studies, 713 participants): RR 1.11, 95% CI 0.73 to 1.66, P = 0.63; I2 = 50%; very low certainty evidence), however, a straight catheter probably makes little or no difference to technique failure (Analysis 5.6 (4 studies, 442 participants): RR 0.82, 95% CI 0.51 to 1.31, P = 0.4; I2 = 0%; moderate certainty evidence) and death (all causes) (Analysis 5.7 (8 studies, 703 participants): RR 0.95, 95% CI 0.62 to 1.46, P = 0.82; I2 = 3%; low certainty evidence) compared with coiled catheters, (summary of findings Table 5). In a sensitivity analysis in which only studies with a low risk of attrition bias were included, similar results were observed for peritonitis (Analysis 5.8: RR 0.93, 95% CI 0.69 to 1.26), peritonitis rate (Analysis 5.9: RR 0.91, 95% CI 0.61 to 1.35), exit‐site infection (Analysis 5.10: RR 1.14, 95% CI 0.94 to 1.39), and exit‐site infection rate (Analysis 5.11; RR 1.18, 95% CI 0.76 to 1.82).
There was moderate heterogeneity (50%) in the analysis of catheter removal/replacement between the two groups. This heterogeneity largely disappeared in a subgroup analysis that only included studies with follow‐up durations of ≥ 2 years, but increased to 74% when studies with follow‐up durations of < 2 years were included in the analysis. The substantial heterogeneity among studies with short follow‐up durations might have been due to different catheter types (double cuff versus single cuff and Tenckhoff versus swan‐neck catheter) and different follow‐up durations (ranged from 12 to 19 months) among the studies. Another possible explanation for the heterogeneity may relate to risk of attrition bias. In sensitivity analysis including only studies with a low risk of attrition bias, the observed heterogeneity was reduced (Analysis 5.12: RR 0.78, 95% CI 0.45 to 1.33; I2 = 32%).
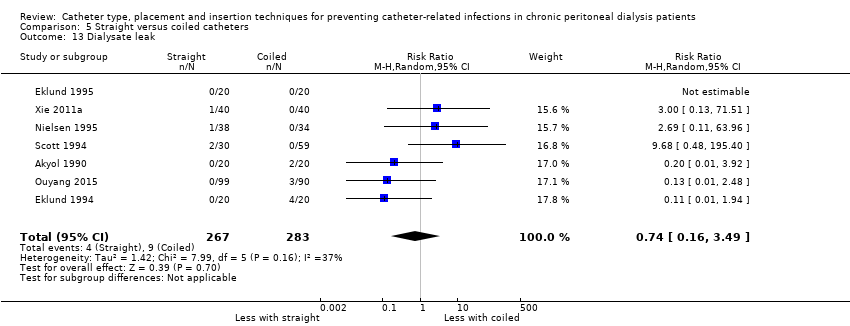
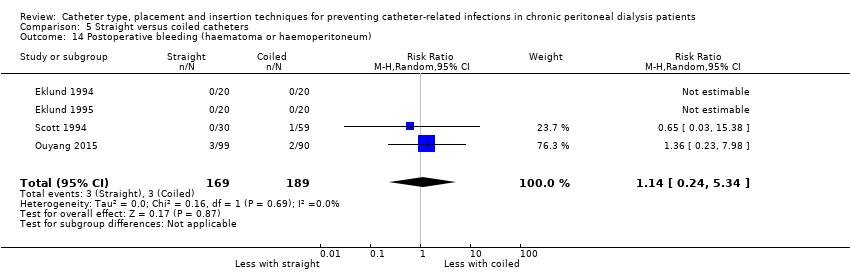
Straight catheter makes little or no difference to dialysate leak compared with coiled catheter (Analysis 5.13 (7 studies, 550 participants): RR 0.74, 95% CI 0.16 to 3.49, P = 0.70; I2 = 37%; low certainty evidence). It is uncertain whether straight catheter lead to post‐operative bleeding (haematoma or haemoperitoneum) compared with coiled catheter (Analysis 5.14 (4 studies, 358 participants): RR 1.14, 95% CI 0.24 to 5.34, P = 0.87; I2 = 0%; very low certainty evidence). Nielsen 1995 reported one case of bladder perforation with coiled catheter but none in the straight catheter group.
Tenckhoff catheter with artificial curve at subcutaneous tunnel tract versus swan‐neck catheter
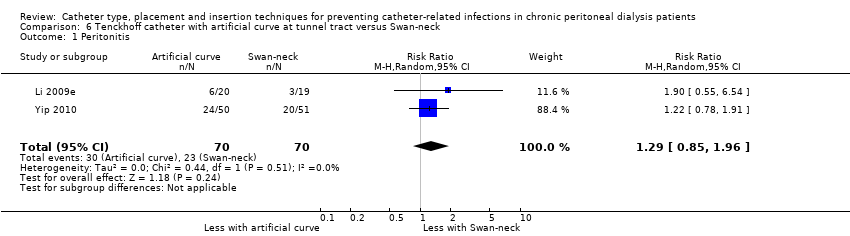
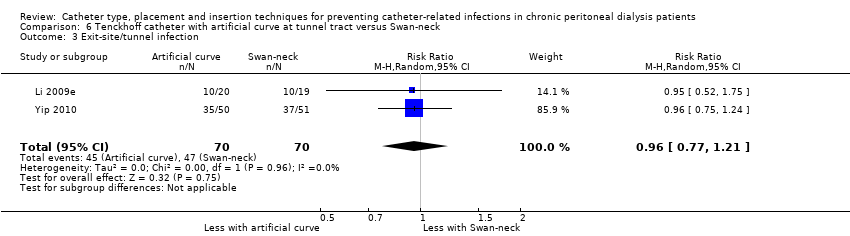
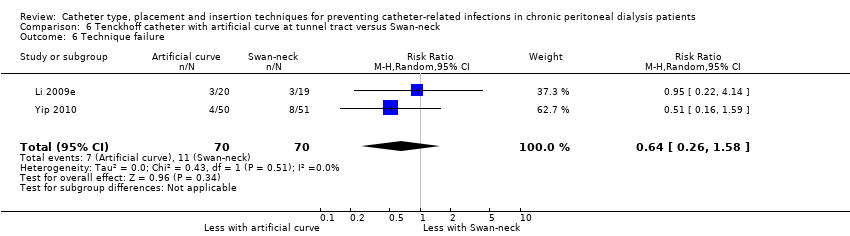
Catheter with artificial curve at subcutaneous tract compared with swan‐neck catheter may make little or no difference to peritonitis risk (Analysis 6.1 (2 studies, 140 participants): RR 1.29, 95% CI 0.85 to 1.96, P = 0.24; I2 = 0%; low certainty evidence), peritonitis rate (Analysis 6.2 (2 studies, 2535 patient‐months): RR 1.22, 95% CI 0.54 to 2.75, P = 0.63; I2 = 47%; low certainty evidence), exit‐site/tunnel infection (Analysis 6.3 (2 studies, 140 participants): RR 0.96, 95% CI 0.77 to 1.21, P = 0.75; I2 = 0%; moderate certainty evidence), but may improve exit‐site infection rate (Analysis 6.4 (2 studies, 2535 patient‐months): RR 0.67, 95% CI 0.50 to 0.90, P = 0.007; I2 = 0%; low certainty evidence), and probably makes little or no difference to catheter removal or replacement (Analysis 6.5 (2 studies, 140 participants): RR 0.85, 95% CI 0.42 to 1.72, P = 0.65; I2 = 15%; moderate certainty evidence), technique failure (Analysis 6.6 (2 studies, 140 participants): RR 0.64, 95% CI 0.26 to 1.58, P = 0.3;, I2 = 0%; moderate certainty evidence), and death, all causes (Analysis 6.7 (2 studies, 140 participants): (RR 0.74, 95% CI 0.27 to 2.03, P = 0.57; I2 = 0%; moderate certainty evidence) compared with insertion of PD catheters with an artificial curve at the tunnel tract (summary of findings Table 6). Yip 2010 reported no dialysate leaks in either group but there was one superficial cuff extrusion in the swan‐neck catheter group but none in the other group. Li 2009e reported post‐operative bleeding from the main wound (5 versus 9) and exit‐site (9 versus 13) in Tenckhoff catheter and swan‐neck catheter respectively.
Self‐locating catheter versus straight catheter
It is uncertain whether self‐locating catheter reduces catheter removal or replacement (Analysis 7.3 (2 studies, 139 participants): RR 0.32, 95% CI 0.03 to 3.06, P = 0.32; I2 = 64%; very low certainty of evidence). Self‐locating catheter probably slightly reduces technique failure (Analysis 7.4 (2 studies, 139 participants): RR 0.64, 95% CI 0.39 to 1.04, P = 0.07; I2 = 0%; moderate certainty evidence), but may make little or no difference to death (all causes) (Analysis 7.5 (2 studies, 139 participants): RR 1.02, 95% CI 0.11 to 9.75, P = 0.99; I2 = 49%; low certainty evidence) compared to a straight catheter. Sanchez‐Canel 2016 reported no difference in the incidence of peritonitis (Analysis 7.1 (78 participants): RR 1.13, 95% CI 0.86 to 1.49) and exit‐site infection (Analysis 7.2 (78 participants): RR 0.95, 95% CI 0.37 to 2.45) (summary of findings Table 7). Moderate heterogeneity was observed with analysis for catheter removal/replacement and death (all causes), for which subgroup analysis was unable to be performed given the small number of studies. The potential explanation for heterogeneity might have related to the suboptimal quality of included studies, which did not report the method of randomisation, blinding and follow up duration. In addition, one study reported different baseline BMI values between the treatment and control groups and the other study interrupted recruitment early due to an observed significant reduction in the incidence of catheter removal/replacement in the treatment group. Self‐locating catheter makes little or no difference to dialysate leak compared with straight catheter (Analysis 7.6 (2 studies, 139 participants): RR 1.04, 95% CI 0.46 to 2.35, P = 0.93; I2 = 0%; low certainty evidence). Sanchez‐Canel 2016 reported post‐operative peritoneal bleed (7 versus 6) in self‐locating and straight catheter groups respectively.
Other interventions
The risk of peritonitis and/or peritonitis rate were examined using:
-
Different insertion techniques: open surgery versus open surgery with omentum folding (Analysis 8.1), open surgery versus modified surgery with or without catheter fixation (Analysis 9.1), open surgery versus vertical tunnel‐based low‐site implantation (Analysis 10.1), open surgery versus ureteroscopic‐assisted surgery (Analysis 11.1), radiological versus surgical implantation (Analysis 12.1), cystoscopy‐assisted surgery versus open surgery (Analysis 13.1), laparoscopic Moncrief‐Popovich technique versus blind trocar technique (Analysis 14.1)
-
Different catheter types: single–cuff versus double‐cuff catheter (Analysis 15.1), double‐cuff versus triple‐cuff catheter (Analysis 16.1), swan‐neck versus straight curled catheter (Analysis 17.1), antibiotic‐treated catheters versus standard catheter (Analysis 18.1)
-
Immobilizer device versus no immobilizer device (Analysis 19.1)
-
Silver ring at exit‐site versus no silver ring (Analysis 20.1)
See (Table 2).
| Name of studies | Relative risk | 95% CI | P value |
| Peritonitis | |||
| Methods of catheter implantation | |||
| 1.41 | 0.25 to 7.91 | 0.69 | |
| 1.20 | 0.59 to 2.42 | 0.61 | |
| 0.93 | 0.48 to 1.80 | 0.82 | |
| 0.39 | 0.11 to 1.42 | 0.15 | |
| 0.81 | 0.41 to 1.61 | 0.55 | |
| 0.21 | 0.03 to 1.61 | 0.13 | |
| 0.60 | 0.20 to 1.81 | 0.36 | |
| Types of catheter | |||
| 0.82 | 0.50 to 1.35 | 0.44 | |
| 0.34 | 0.07 to 1.59 | 0.17 | |
| 0.80 | 0.29 to 2.21 | 0.67 | |
| 0.78 | 0.6 to 1.69 | 0.53 | |
| Other intervention | |||
| 0.90 | 0.49 to 1.66 | 0.73 | |
| 1.20 | 0.59 to 2.42 | 0.61 | |
| Peritonitis rate (patient‐month) | |||
| Methods of catheter implantation | |||
| 1.40 | 0.23 to 8.34 | 0.71 | |
| 0.67 | 0.38 to 1.18 | 0.16 | |
| Types of catheters | |||
| 0.34 | 0.07 to 1.69 | 0.19 | |
| 0.69 | 0.19 to 2.53 | 0.57 | |
CI: confidence interval
Dasgupta 1998 reported 14 episodes of peritonitis in 19 patients using Moncrief‐Popovich catheter compared with 22 episodes of peritonitis in 20 patients using Tenckhoff catheter. The other outcomes were not different among these studies except that Zhang 2016 reported that catheter removal/replacement was lower with modified surgery with or without catheter fixation compared with open surgery (Analysis 9.3 (152 participants): RR 0.16, 95% CI 0.03 to 0.76).
Break‐in periods
Timely PD 2010 (122 participants) examined the effect of different break‐in periods (1 week versus 2 weeks versus 4 weeks post catheter insertion) on the composite PD‐related infection (defined as exit‐site/tunnel infection and/or peritonitis) at 4 weeks after PD initiation and 8 weeks after catheter insertion reported that there was no difference across 3 groups. The study reported higher risk of dialysate leak in break‐in period of 1 week compared with 4 weeks (11 versus 1 respectively). There was one post‐operative wound haematoma observed in the break‐in period of 2 weeks but none in the other groups.
Discussion
Summary of main results
The review demonstrated that no specific PD catheter implantation technique or catheter type significantly reduced the risk of PD peritonitis. In a single study with a small number of participants, midline catheter insertion resulted in a lower risk of catheter removal/replacement compared with lateral insertion and in another small, single‐centre study, modified open surgery with or without catheter fixation resulted in a lower risk of catheter removal/replacement compared with open surgery. Similarly, in two other small, methodologically suboptimal studies involving 140 participants, a swan‐neck catheter was associated with a higher exit‐site/tunnel infection rate than a Tenckhoff catheter with an artificial curve at the subcutaneous tract.
Overall completeness and applicability of evidence
Since the last review in 2004, there have been limited RCTs examining the different new surgical techniques or PD catheter types in the last decade but none has been shown superior to any other in the reduction of peritonitis. However, it should also be acknowledged that there have been general improvements in peritonitis rates globally since the time of the last systematic review (Li 2017; Mehrotra 2016). The general trend in improvement of peritonitis rates might potentially make it difficult for any interventions in this area to achieve further major improvement.
Comparison between the different techniques of PD catheter implantation demonstrated that no specific technique was superior to any other in the prevention of peritonitis and/or exit‐site/tunnel infection. Generally, most of the studies were from single‐centres and involved small study populations followed for variable periods of time. There was no standardized method of reporting the infection‐related outcomes (peritonitis and exit‐site/tunnel infection); one study reported early and total infection (Gadallah 1999), two studies reported both early and late infection separately (Jwo 2010; Wright 1999), and the remainder of the studies reported total infection. The definitions of early infection (ranged from ≤ 2 weeks to ≤ 6 weeks) and late infection (ranged from > 2 weeks to > 6 weeks) also varied among studies. Gadallah 1999 postulated that the higher rate of early peritonitis (within 2 weeks of catheter placement) was likely contributed to by a higher exit‐site leak incidence related to the technique of catheter insertion. In the present review, the majority of included studies reported overall infection (peritonitis or exit‐site/tunnel infection) rather than separately reporting early and late infections. The potential benefit of catheter insertion technique on prevention of catheter‐related infection, especially in the early period of catheter insertion, was not able to be comprehensively assessed in this review.
Moreover, a majority of these studies only reported either the incidence of peritonitis or the peritonitis rate but not both. In addition, some studies did not report details about the use of prophylactic antibiotics prior to catheter implantation, which is a key intervention that has been shown to convincingly reduce the risk of early peritonitis in PD patients in the previous meta‐analysis (Strippoli 2004a).
Five studies examined the effects of laparoscopy versus laparotomy and demonstrated that the risks of peritonitis and exit‐site/tunnel infection were not significantly different between the two methods.
Moncrief 1998 reported that catheter implantation with subcutaneous burying for three to five weeks was associated with reduced incidence of peritonitis. However, in the present review, subcutaneous burying of a PD catheter for six weeks prior to PD initiation exerted comparable effects on peritonitis, exit‐site/tunnel infection and death (all causes) compared to the standard insertion technique. In view of the suboptimal methodologic quality and small numbers of studies and participants, there were insufficient data to draw conclusions regarding the value of this technique.
Spence 1985 reported that paramedian insertion was associated with reduction in the incidence of leak and extrusion of the cuff compared with midline insertion of the PD catheter. In the present review, midline versus lateral insertion of PD catheters did not significantly affect the risks of peritonitis, exit‐site/tunnel infection and death (all causes). However, in a single small study, midline insertion resulted in a lower risk of catheter removal/replacement than lateral insertion. In that particular study, there was a potential bias as the study introduced two different interventions (spiral versus straight catheters, and midline versus lateral insertion techniques) at the same time. In another RCT examining midline versus lateral catheter insertion (Ejlersen 1990), one‐year catheter survival rates were comparable between the two groups (midline 59% versus lateral 51%). In view of the suboptimal methodologic quality and small number of studies available, there are insufficient data to draw definitive conclusions regarding the effects of midline versus lateral insertion on the outcomes examined in this review.
In a single small study centre, Zhang 2016 reported that a modified catheter placement method, which was characterised by a low implant site, a short intra‐abdominal catheter segment and upward straight subcutaneous tunnel, significantly decreased the incidence of catheter removal/replacement compared with open surgery. The authors postulated that a long intra‐abdominal catheter segment following a traditional open surgical method might lead to an increased risk of catheter tip migration and omental wrap. However, in that study, there was a trend towards a high incidence of participants with prior abdominal surgery in the open surgery group (20.4%) versus modified open surgery group with or without catheter fixation (11.7%). In view of the single centre design, small study population and suboptimal methodologic quality, no firm conclusion can be drawn regarding the effect of open surgery versus modified open surgery with or without catheter fixation on the incidence of catheter removal/replacement.
The most commonly examined type of catheter was straight versus coiled catheters, which demonstrated no significant differences in peritonitis, exit‐site/tunnel infection, and catheter removal/replacement or death (all causes). There was moderate heterogeneity in the analysis of catheter removal/replacement between the two groups. The heterogeneity was resolved when only studies with follow‐up durations of ≥ 2 years were included in the analysis, but increased when studies with follow‐up durations of < 2 years were additionally included. The substantial heterogeneity among studies with short follow‐up durations might due to different catheter types (double cuff versus single cuff and Tenckhoff versus swan‐neck catheter) and different follow‐up durations (ranged from 12 to 19 months) among the studies.
Two small studies comparing swan‐neck catheters and PD catheters with artificial curves at the subcutaneous tract showed no significant differences in peritonitis risk, peritonitis rate, exit‐site/tunnel infection risk, catheter removal/replacement, technique failure and death (all causes). Though the analysis of the risk of exit‐site/tunnel infection found no significant difference between the two groups, the rate of exit‐site/tunnel infection was significantly higher in the swan‐neck catheter group. This finding might be explained by an increased number of participants with repeated/recurrent exit‐site/tunnel infection in the swan‐neck group. Alternatively, the result might have been a chance finding or related to bias stemming from suboptimal methodologic quality. Reassuringly, there was no difference in the risk of either catheter removal or technique failure.
Quality of the evidence
The methodological quality of evidence for most of the studies was considered suboptimal. The methods of randomisation and allocation concealment were not clearly described in most of the studies. The majority of included studies were single‐centre with small sample sizes and had widely variable follow‐up periods. A small number of studies (33%) analysed their data using the intention‐to‐treat method. In addition, most studies were not registered with the clinical trial databases, had not published a protocol of their study, and did not report on many patient‐level outcomes which could have contributed to the risk of selective reporting bias. Timely PD 2010 only reported a composite outcome of exit‐site infection and peritonitis such that analysis of the individual outcomes was unable to perform. Moreover, the types of interventions examined were numerous with very few studies (either one or two studies) in each category, such that definitive conclusions could not be drawn. Finally, the risk of peritonitis may have been modified by other unreported co‐interventions, including the centre protocol for prophylactic antibiotics prior to catheter implantation, PD training protocol and exit‐site care, other centre‐specific factors, and the skill and experience of interventionists, which were unable to be adjusted for in the review.
Potential biases in the review process
The present review was conducted as per published standardized Cochrane methodology. The review included the up‐to‐date publications through MEDLINE, EMBASE, and CENTRAL searches with the assistance of the Information Specialist. The review included RCTs and quasi‐RCTs. All potential publications were assessed by two independent authors who performed the data extraction, data analysis and assessment of quality of studies independently. Any dispute or concern about the data between the two authors was resolved with additional two authors. The primary authors were contacted to seek the additional data for analysis by the authors. A few abstracts/publications, which were published a decade ago, were not able to be included in the current review as we were unable to contact primary authors for further information. Finally, there is a potential for bias as one of the investigators of the present review (DWJ) was also an author of an included study (Johnson 2006).
Agreements and disagreements with other studies or reviews
Similar to the previously published review (Strippoli 2004), the present study has demonstrated that no specific type of catheter or implantation method was superior in reducing the risk of PD peritonitis. The previous meta‐analysis by Xie 2011a reported no significant difference in peritonitis (7 studies: RR 1.12, 95% CI 0.83 to 1.50) or exit‐site/tunnel infection (6 studies: RR 1.05, 95% CI 0.79 to 1.39) between straight versus coiled catheters. The results of the present updated review support the findings of the previous reviews.
A meta‐analysis by Hagen 2014 that included both RCTs and cohort studies comparing laparoscopic insertion and laparotomy also reported no significant differences in peritonitis (9 studies: OR 0.83, 95% CI 0.48 to 1.42) and exit‐site/tunnel infection (7 studies: OR 0.80, 95% CI 0.47 to 1.37) between the two groups. The present review only included RCTs of laparoscopy versus laparotomy and reported similar findings.
The review also demonstrated that catheter removal or replacement and technique failure were not significantly different among the different methods of implantation, including laparoscopically and surgically placed catheters. The finding was contrary to that of a previous meta‐analysis (Hagen 2014), which included both RCTs and cohort studies, and reported that one‐year catheter survival was significantly higher in the laparoscopy group compared with the laparotomy group. The finding from the previous meta‐analysis may have been biased due to the fact that the majority of included studies were non‐RCTs (8 cohort studies compared with 3 RCTs). To date, there have only been 4 RCTs comparing laparoscopic versus laparotomy methods: all 4 studies were single‐centre design, only 1 study was analysed by intention‐to‐treat method, all studies practised different antibiotic prophylaxis regimens with varying doses (2 g vancomycin versus 0.5 to 1 g cefazolin) prior to the procedure, and all initiated PD at different time points following the operative procedure (ranging from immediately after procedure to several days post‐procedure). The current available data suggested that laparoscopic insertion makes little or no difference to PD‐related infection, catheter removal/replacement, technique or patient survival compared to laparotomy.
In the current review, different catheter types, including straight versus coiled/curved (either at the tip or at the subcutaneous tract) catheters, were not significantly associated with catheter removal/replacement and technique failure in PD patients. There was moderate heterogeneity in the analysis of catheter removal/replacement in the review, which was potentially due to the fact that different studies used different types of catheter including different products from different manufacturing companies, single or double cuff catheters, and different methods of catheter placement (percutaneous versus open surgical methods). Heterogeneity was decreased but not totally resolved following subgroup analysis with straight tip versus coiled/curved tip catheters and straight versus curved catheter at the subcutaneous tract, open surgical method versus percutaneously inserted method, and single cuff versus double cuff catheters. Similarly, the previous meta‐analysis by Xie 2011a, which compared straight tip versus coiled tip catheters, reported that although there was a significantly increased risk of catheter tip migration with coiled catheters, overall catheter failure was not significantly different between the two groups.
The present review demonstrated there was no significant difference in death (all causes) between straight and coiled catheters. In contrast, our previous review (Strippoli 2004) reported that there was a survival advantage with straight catheters compared with curved catheters. The discrepancy in findings between the two reviews can be explained by the fact that the present review included a larger number of studies (8 RCTs versus 4 RCTs) and more well‐designed studies compared to the previous review.

Study flow diagram.
Risk of bias summary: review authors' judgements about each risk of bias item for each included study.
Risk of bias graph: review authors' judgements about each risk of bias item presented as percentages across all included studies.

Comparison 1 Laparoscopy versus laparotomy, Outcome 1 Peritonitis.
Comparison 1 Laparoscopy versus laparotomy, Outcome 2 Peritonitis rate (patient‐months).

Comparison 1 Laparoscopy versus laparotomy, Outcome 3 Exit‐site/tunnel infection.

Comparison 1 Laparoscopy versus laparotomy, Outcome 4 Catheter removal or replacement.
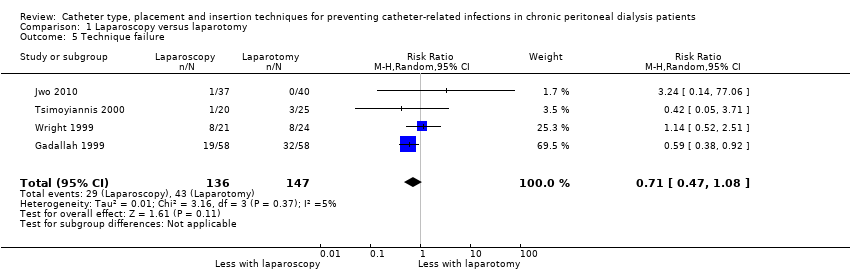
Comparison 1 Laparoscopy versus laparotomy, Outcome 5 Technique failure.

Comparison 1 Laparoscopy versus laparotomy, Outcome 6 Death (all causes).

Comparison 1 Laparoscopy versus laparotomy, Outcome 7 Dialysate leak.

Comparison 2 Buried (subcutaneous) versus non‐buried catheter, Outcome 1 Peritonitis rate (patient‐months).

Comparison 2 Buried (subcutaneous) versus non‐buried catheter, Outcome 2 Exit‐site/tunnel infection rate (patient‐months).
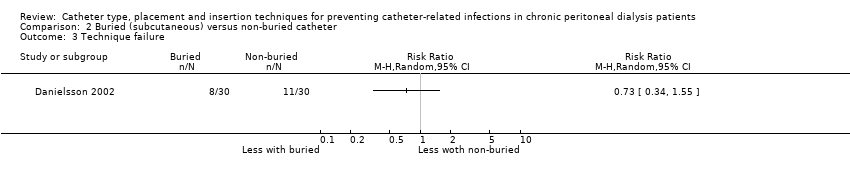
Comparison 2 Buried (subcutaneous) versus non‐buried catheter, Outcome 3 Technique failure.
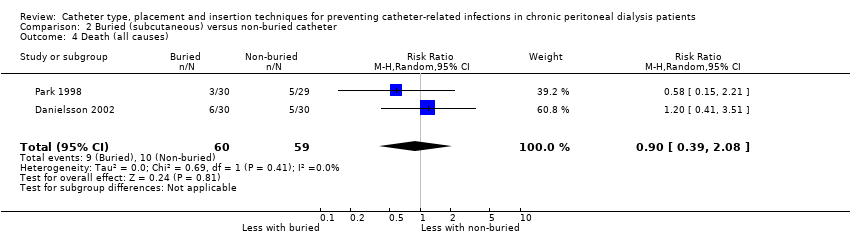
Comparison 2 Buried (subcutaneous) versus non‐buried catheter, Outcome 4 Death (all causes).

Comparison 3 Midline versus lateral insertion, Outcome 1 Peritonitis.

Comparison 3 Midline versus lateral insertion, Outcome 2 Exit‐site/tunnel infection.

Comparison 3 Midline versus lateral insertion, Outcome 3 Catheter removal or replacement.

Comparison 3 Midline versus lateral insertion, Outcome 4 Death (all causes).

Comparison 4 Percutaneous insertion versus open surgery, Outcome 1 Exit‐site/tunnel infection.

Comparison 4 Percutaneous insertion versus open surgery, Outcome 2 Catheter removal or replacement.
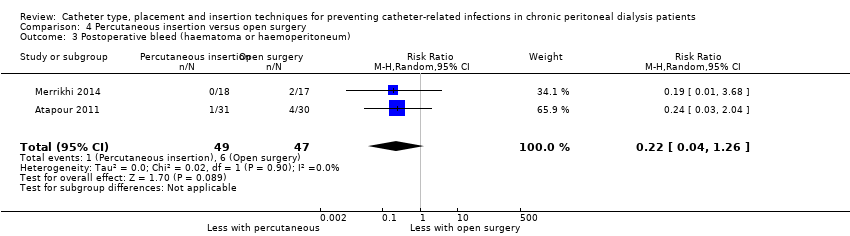
Comparison 4 Percutaneous insertion versus open surgery, Outcome 3 Postoperative bleed (haematoma or haemoperitoneum).
Comparison 5 Straight versus coiled catheters, Outcome 1 Peritonitis.

Comparison 5 Straight versus coiled catheters, Outcome 2 Peritonitis rate (patient‐months).
Comparison 5 Straight versus coiled catheters, Outcome 3 Exit‐site/tunnel infection.
Comparison 5 Straight versus coiled catheters, Outcome 4 Exit‐site/tunnel infection rate (patient‐months).
Comparison 5 Straight versus coiled catheters, Outcome 5 Catheter removal or replacement.
Comparison 5 Straight versus coiled catheters, Outcome 6 Technique failure.

Comparison 5 Straight versus coiled catheters, Outcome 7 Death (all causes).
Comparison 5 Straight versus coiled catheters, Outcome 8 Peritonitis (studies with low risk of attrition bias).

Comparison 5 Straight versus coiled catheters, Outcome 9 Peritonitis rate (patient‐months) (studies with low risk of attrition bias).

Comparison 5 Straight versus coiled catheters, Outcome 10 Exit‐site/tunnel infection (studies with low risk of attrition bias).
Comparison 5 Straight versus coiled catheters, Outcome 11 Exit‐site/tunnel infection rate (patient‐months) (studies with low risk of attrition bias).

Comparison 5 Straight versus coiled catheters, Outcome 12 Catheter removal or replacement (studies with low risk of attrition bias).
Comparison 5 Straight versus coiled catheters, Outcome 13 Dialysate leak.
Comparison 5 Straight versus coiled catheters, Outcome 14 Postoperative bleeding (haematoma or haemoperitoneum).
Comparison 6 Tenckhoff catheter with artificial curve at tunnel tract versus Swan‐neck, Outcome 1 Peritonitis.

Comparison 6 Tenckhoff catheter with artificial curve at tunnel tract versus Swan‐neck, Outcome 2 Peritonitis rate (patient‐months).
Comparison 6 Tenckhoff catheter with artificial curve at tunnel tract versus Swan‐neck, Outcome 3 Exit‐site/tunnel infection.

Comparison 6 Tenckhoff catheter with artificial curve at tunnel tract versus Swan‐neck, Outcome 4 Exit‐site/tunnel infection rate (patient‐months).

Comparison 6 Tenckhoff catheter with artificial curve at tunnel tract versus Swan‐neck, Outcome 5 Catheter removal or replacement.
Comparison 6 Tenckhoff catheter with artificial curve at tunnel tract versus Swan‐neck, Outcome 6 Technique failure.
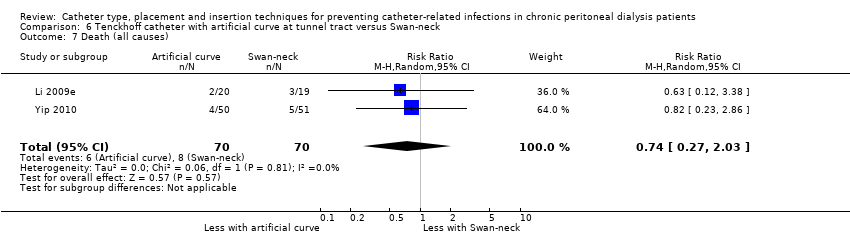
Comparison 6 Tenckhoff catheter with artificial curve at tunnel tract versus Swan‐neck, Outcome 7 Death (all causes).

Comparison 7 Self‐locating catheter versus straight tenckhoff catheter, Outcome 1 Peritonitis.
Comparison 7 Self‐locating catheter versus straight tenckhoff catheter, Outcome 2 Exit‐site/tunnel infection.

Comparison 7 Self‐locating catheter versus straight tenckhoff catheter, Outcome 3 Catheter removal or replacement.
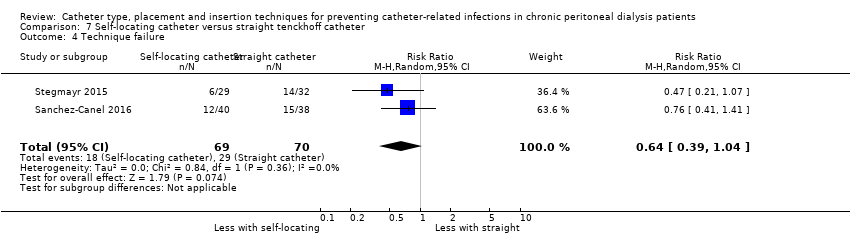
Comparison 7 Self‐locating catheter versus straight tenckhoff catheter, Outcome 4 Technique failure.

Comparison 7 Self‐locating catheter versus straight tenckhoff catheter, Outcome 5 Death (all causes).
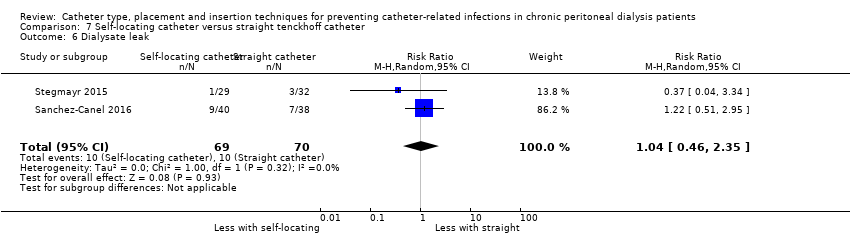
Comparison 7 Self‐locating catheter versus straight tenckhoff catheter, Outcome 6 Dialysate leak.
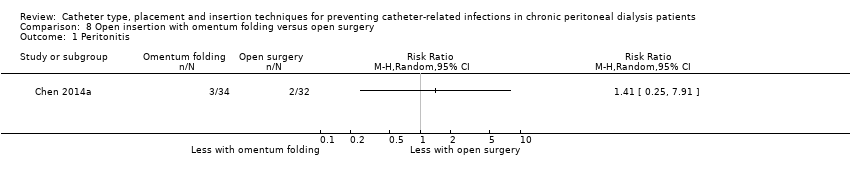
Comparison 8 Open insertion with omentum folding versus open surgery, Outcome 1 Peritonitis.

Comparison 8 Open insertion with omentum folding versus open surgery, Outcome 2 Peritonitis rate (patient‐months).

Comparison 8 Open insertion with omentum folding versus open surgery, Outcome 3 Exit‐site/tunnel infection.
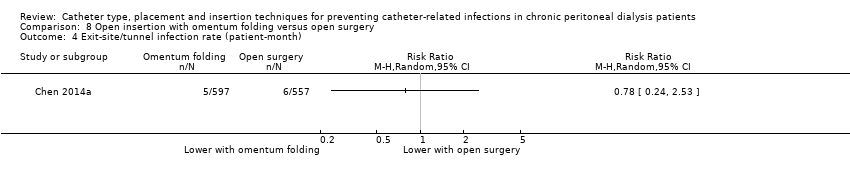
Comparison 8 Open insertion with omentum folding versus open surgery, Outcome 4 Exit‐site/tunnel infection rate (patient‐month).

Comparison 8 Open insertion with omentum folding versus open surgery, Outcome 5 Catheter removal or replacement.

Comparison 8 Open insertion with omentum folding versus open surgery, Outcome 6 Technique failure.
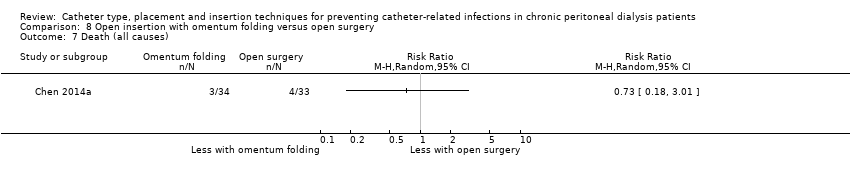
Comparison 8 Open insertion with omentum folding versus open surgery, Outcome 7 Death (all causes).

Comparison 8 Open insertion with omentum folding versus open surgery, Outcome 8 Dialysate leak.

Comparison 8 Open insertion with omentum folding versus open surgery, Outcome 9 Postoperative bleed (haematoma or haemoperitoneum).

Comparison 9 Modified surgery with or without catheter fixation versus open surgery, Outcome 1 Peritonitis.

Comparison 9 Modified surgery with or without catheter fixation versus open surgery, Outcome 2 Exit‐site/tunnel infection.

Comparison 9 Modified surgery with or without catheter fixation versus open surgery, Outcome 3 Catheter removal or replacement.

Comparison 9 Modified surgery with or without catheter fixation versus open surgery, Outcome 4 Dialysate leak.
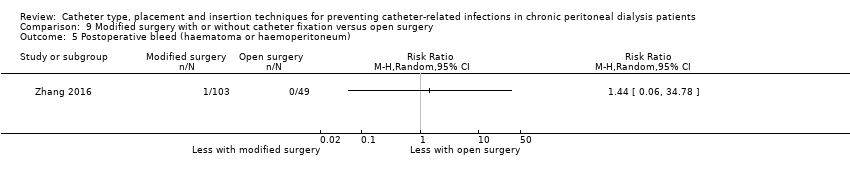
Comparison 9 Modified surgery with or without catheter fixation versus open surgery, Outcome 5 Postoperative bleed (haematoma or haemoperitoneum).
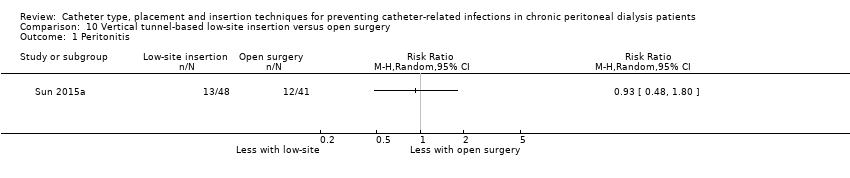
Comparison 10 Vertical tunnel‐based low‐site insertion versus open surgery, Outcome 1 Peritonitis.

Comparison 10 Vertical tunnel‐based low‐site insertion versus open surgery, Outcome 2 Exit‐site/tunnel infection.

Comparison 11 Ureteroscope‐assisted technique versus modified open surgery, Outcome 1 Peritonitis.

Comparison 11 Ureteroscope‐assisted technique versus modified open surgery, Outcome 2 Exit‐site/tunnel infection.

Comparison 11 Ureteroscope‐assisted technique versus modified open surgery, Outcome 3 Death (all causes).
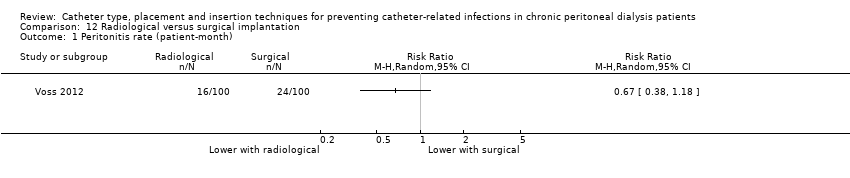
Comparison 12 Radiological versus surgical implantation, Outcome 1 Peritonitis rate (patient‐month).
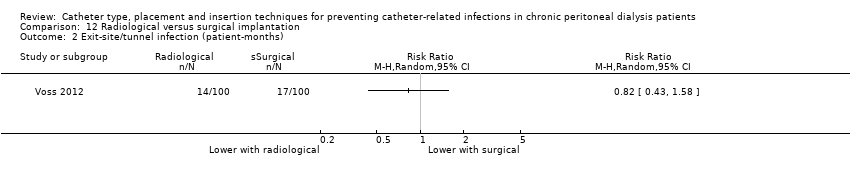
Comparison 12 Radiological versus surgical implantation, Outcome 2 Exit‐site/tunnel infection (patient‐months).
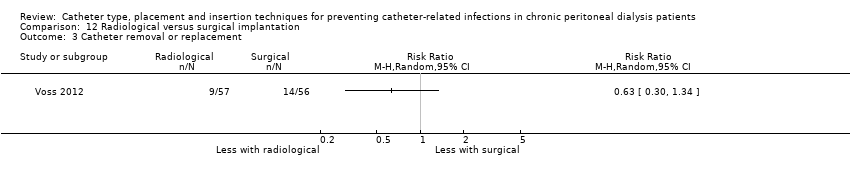
Comparison 12 Radiological versus surgical implantation, Outcome 3 Catheter removal or replacement.
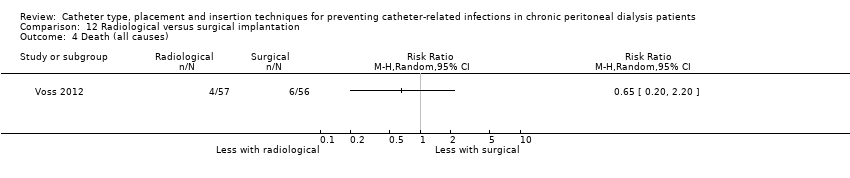
Comparison 12 Radiological versus surgical implantation, Outcome 4 Death (all causes).

Comparison 12 Radiological versus surgical implantation, Outcome 5 Dialysate leak.
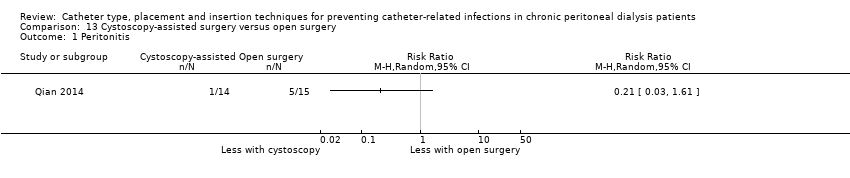
Comparison 13 Cystoscopy‐assisted surgery versus open surgery, Outcome 1 Peritonitis.

Comparison 13 Cystoscopy‐assisted surgery versus open surgery, Outcome 2 Exit‐site/tunnel infection.
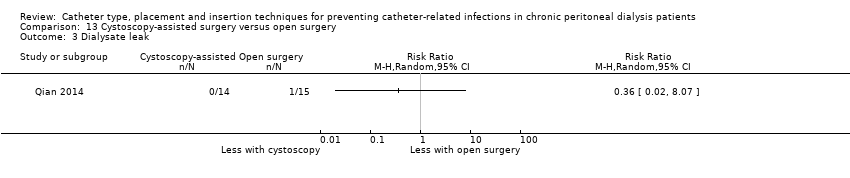
Comparison 13 Cystoscopy‐assisted surgery versus open surgery, Outcome 3 Dialysate leak.

Comparison 14 Laparoscopic Moncrief‐Popovich versus Trocar technique, Outcome 1 Peritonitis.

Comparison 14 Laparoscopic Moncrief‐Popovich versus Trocar technique, Outcome 2 Exit‐site infection.

Comparison 14 Laparoscopic Moncrief‐Popovich versus Trocar technique, Outcome 3 Dialysate leak.

Comparison 15 Single versus double cuff, Outcome 1 Peritonitis.
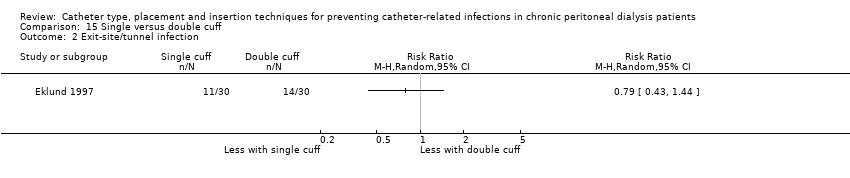
Comparison 15 Single versus double cuff, Outcome 2 Exit‐site/tunnel infection.
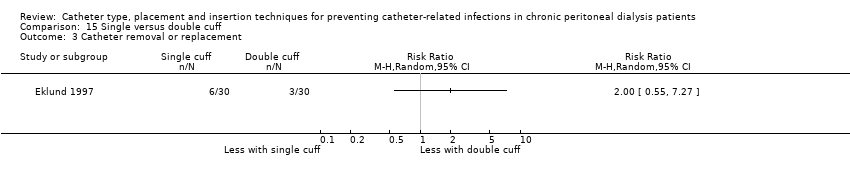
Comparison 15 Single versus double cuff, Outcome 3 Catheter removal or replacement.
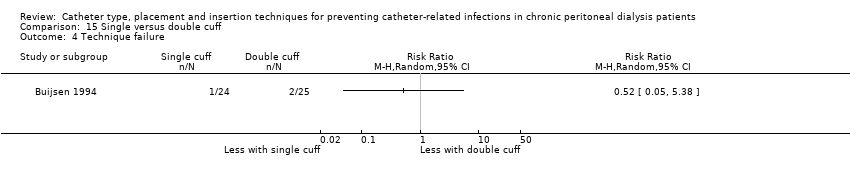
Comparison 15 Single versus double cuff, Outcome 4 Technique failure.

Comparison 15 Single versus double cuff, Outcome 5 Death (all causes).

Comparison 16 Triple cuff versus double catheter, Outcome 1 Peritonitis.

Comparison 16 Triple cuff versus double catheter, Outcome 2 Peritonitis rate (patient‐months).

Comparison 16 Triple cuff versus double catheter, Outcome 3 Exit‐site/tunnel infection.
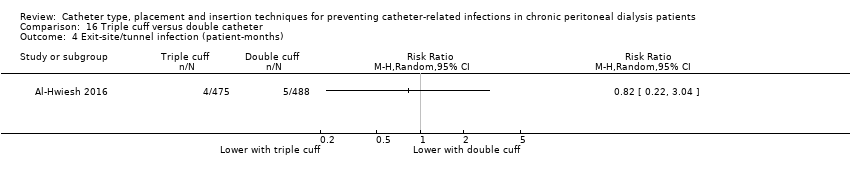
Comparison 16 Triple cuff versus double catheter, Outcome 4 Exit‐site/tunnel infection (patient‐months).

Comparison 16 Triple cuff versus double catheter, Outcome 5 Catheter removal or replacement.
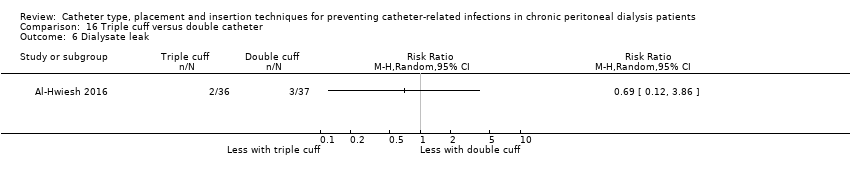
Comparison 16 Triple cuff versus double catheter, Outcome 6 Dialysate leak.

Comparison 17 Swan‐neck versus straight curled catheter, Outcome 1 Peritonitis.

Comparison 17 Swan‐neck versus straight curled catheter, Outcome 2 Peritonitis rate (patient‐months).
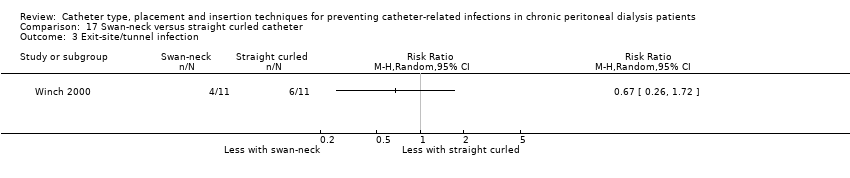
Comparison 17 Swan‐neck versus straight curled catheter, Outcome 3 Exit‐site/tunnel infection.
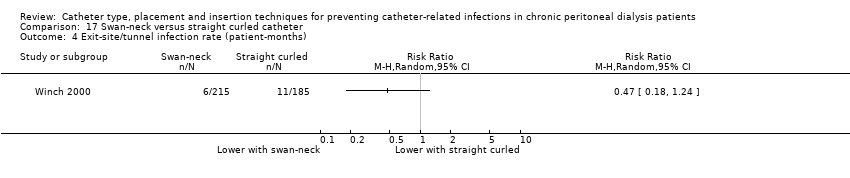
Comparison 17 Swan‐neck versus straight curled catheter, Outcome 4 Exit‐site/tunnel infection rate (patient‐months).

Comparison 17 Swan‐neck versus straight curled catheter, Outcome 5 Technique failure.

Comparison 17 Swan‐neck versus straight curled catheter, Outcome 6 Dialysate leak.

Comparison 18 Antibiotic‐treated catheter versus none, Outcome 1 Peritonitis.

Comparison 18 Antibiotic‐treated catheter versus none, Outcome 2 Exit‐site/tunnel infection.
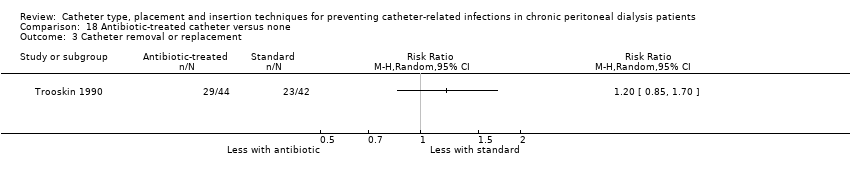
Comparison 18 Antibiotic‐treated catheter versus none, Outcome 3 Catheter removal or replacement.

Comparison 18 Antibiotic‐treated catheter versus none, Outcome 4 Death (all causes).

Comparison 19 Immobilisation versus no immobilisation, Outcome 1 Peritonitis.
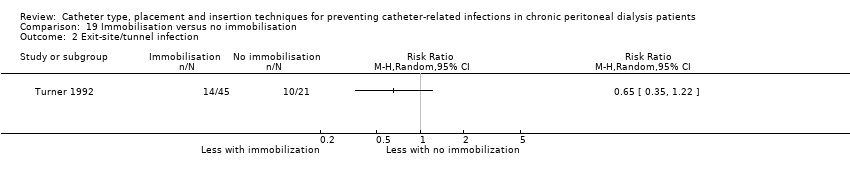
Comparison 19 Immobilisation versus no immobilisation, Outcome 2 Exit‐site/tunnel infection.

Comparison 20 Silver ring versus no silver ring, Outcome 1 Peritonitis.

Comparison 20 Silver ring versus no silver ring, Outcome 2 Exit‐site/tunnel infection.

Comparison 20 Silver ring versus no silver ring, Outcome 3 Technique failure.

Comparison 20 Silver ring versus no silver ring, Outcome 4 Death (all causes).
| Laparoscopy versus laparotomy for preventing catheter‐related infections in chronic peritoneal dialysis patients | |||||
| Patient or population: chronic peritoneal dialysis patients | |||||
| Outcomes | Anticipated absolute effects* (95% CI) | Relative effect | No. of participants or patient‐months | Certainty of the evidence | |
| Risk with laparotomy | Risk with laparoscopy | ||||
| Peritonitis | 242 per 1,000 | 218 per 1,000 | RR 0.90 | 315 (4) | ⊕⊕⊕⊝ |
| Peritonitis rate (patient‐months) | 59 per 1,000 | 52 per 1,000 | RR 0.89 | 375 (1) | ⊕⊝⊝⊝ |
| Exit‐site/tunnel infection | 125 per 1,000 | 125 per 1,000 | RR 1.00 | 270 (3) | ⊕⊕⊝⊝ |
| Catheter removal or replacement | 281 per 1,000 | 337 per 1,000 | RR 1.20 | 167 (3) | ⊕⊕⊝⊝ |
| Technique failure | 293 per 1,000 | 208 per 1,000 | RR 0.71 | 283 (4) | ⊕⊕⊝⊝ |
| Death (all causes) | 140 per 1,000 | 176 per 1,000 | RR 1.26 | 270 (3) | ⊕⊕⊕⊝ |
| *The risk in the intervention group (and its 95% confidence interval) is based on the assumed risk in the comparison group and the relative effect of the intervention (and its 95% CI). | |||||
| GRADE Working Group grades of evidence | |||||
| 1 Downgraded one level: suboptimal quality of studies 2 Downgraded two levels: single study with suboptimal quality and imprecision 3 Downgraded two levels: suboptimal quality and imprecision | |||||
| Buried (subcutaneous) versus non‐buried catheter for preventing catheter‐related infections in chronic peritoneal dialysis patients | |||||
| Patient or population: chronic peritoneal dialysis patients | |||||
| Outcomes | Anticipated absolute effects* (95% CI) | Relative effect | No. of participants or patient‐months | Certainty of the evidence | |
| Risk with non‐buried | Risk with buried (subcutaneous) | ||||
| Peritonitis rate (patient‐months) | 37 per 1,000 | 43 per 1,000 | RR 1.16 | 2511 (2) | ⊕⊝⊝⊝ |
| Exit‐site/tunnel infection rate (patient‐months) | 31 per 1,000 | 36 per 1,000 | RR 1.15 | 2511 (2) | ⊕⊝⊝⊝ |
| Technique failure | 367 per 1,000 | 268 per 1,000 | RR 0.73 | 60 (1) | ⊕⊝⊝⊝ |
| Death (all causes) | 169 per 1,000 | 153 per 1,000 | RR 0.90 | 119 (2) | ⊕⊕⊕⊝ |
| *The risk in the intervention group (and its 95% confidence interval) is based on the assumed risk in the comparison group and the relative effect of the intervention (and its 95% CI). | |||||
| GRADE Working Group grades of evidence | |||||
| 1 Downgraded three levels: suboptimal quality, inconsistency, and imprecision 2 Downgraded three levels: single study, suboptimal quality, and imprecision 3 Downgraded two levels: suboptimal quality of studies and imprecision | |||||
| Midline versus lateral insertion for preventing catheter‐related infections in chronic peritoneal dialysis patients | |||||
| Patient or population: chronic peritoneal dialysis patients | |||||
| Outcomes | Anticipated absolute effects* (95% CI) | Relative effect | No. of participants | Certainty of the evidence | |
| Risk with lateral | Risk with midline | ||||
| Peritonitis | 255 per 1,000 | 166 per 1,000 | RR 0.65 | 120 (2) | ⊕⊕⊕⊝ |
| Exit‐site/tunnel infection | 78 per 1,000 | 44 per 1,000 | RR 0.56 | 120 (2) | ⊕⊕⊝⊝ |
| Catheter removal or replacement | 514 per 1,000 | 293 per 1,000 | RR 0.57 | 83 (1) | ⊕⊝⊝⊝ VERY LOW 3 |
| Death (all causes) | 0 per 1,000 | 0 per 1,000 | RR 8.50 | 37 (1) | ⊕⊝⊝⊝ |
| *The risk in the intervention group (and its 95% confidence interval) is based on the assumed risk in the comparison group and the relative effect of the intervention (and its 95% CI). | |||||
| GRADE Working Group grades of evidence | |||||
| 1 Downgraded one level: suboptimal quality of studies 2 Downgraded two levels: suboptimal quality and imprecision 3 Downgraded three levels: single study, suboptimal quality study, and imprecision | |||||
| Percutaneous insertion versus open surgery for preventing catheter‐related infections in chronic peritoneal dialysis patients | |||||
| Patient or population: chronic peritoneal dialysis patients | |||||
| Outcomes | Anticipated absolute effects* (95% CI) | Relative effect | No. of participants | Certainty of the evidence | |
| Risk with open surgery | Risk with percutaneous insertion | ||||
| Exit‐site/tunnel infection | 106 per 1,000 | 17 per 1,000 | RR 0.16 | 96 | ⊕⊕⊕⊝ |
| Catheter removal or replacement | 133 per 1,000 | 32 per 1,000 | RR 0.24 | 61 | ⊕⊝⊝⊝ |
| *The risk in the intervention group (and its 95% confidence interval) is based on the assumed risk in the comparison group and the relative effect of the intervention (and its 95% CI). | |||||
| GRADE Working Group grades of evidence | |||||
| 1 Downgraded one level: suboptimal quality of studies 2 Downgraded two levels: single study with suboptimal quality and imprecision | |||||
| Straight versus coiled catheters for preventing catheter‐related infections in chronic peritoneal dialysis patients | |||||
| Patient or population: chronic peritoneal dialysis patients | |||||
| Outcomes | Anticipated absolute effects* (95% CI) | Relative effect | No. of participants or patient‐months | Certainty of the evidence | |
| Risk with coiled | Risk with straight | ||||
| Peritonitis | 217 per 1,000 | 225 per 1,000 | RR 1.04 | 818 (9) | ⊕⊕⊕⊝ |
| Peritonitis rate (patient‐months) | 32 per 1,000 | 29 per 1,000 | RR 0.91 | 5882 (5) | ⊕⊕⊕⊝ |
| Exit‐site/tunnel infection | 281 per 1,000 | 314 per 1,000 | RR 1.12 | 826 (10) | ⊕⊕⊕⊝ |
| Exit‐site/tunnel infection rate (patient‐months) | 27 per 1,000 | 28 per 1,000 | RR 1.05 | 5286 (4) | ⊕⊕⊕⊝ |
| Catheter removal or replacement | 249 per 1,000 | 276 per 1,000 | RR 1.11 | 713 (9) | ⊕⊝⊝⊝ |
| Technique failure | 131 per 1,000 | 108 per 1,000 | RR 0.82 | 442 (4) | ⊕⊕⊕⊝ |
| Death (all causes) | 124 per 1,000 | 117 per 1,000 | RR 0.95 | 703 (8) | ⊕⊕⊝⊝ |
| *The risk in the intervention group (and its 95% confidence interval) is based on the assumed risk in the comparison group and the relative effect of the intervention (and its 95% CI). | |||||
| GRADE Working Group grades of evidence | |||||
| 1 Downgraded one level: most studies are of suboptimal quality 2 Downgrade one level: inconsistency 3 Downgraded one level: publication bias | |||||
| Tenckhoff catheter with artificial curve at tunnel tract versus swan‐neck for preventing catheter‐related infections in chronic peritoneal dialysis patients | |||||
| Patient or population: preventing catheter‐related infections in chronic peritoneal dialysis patients | |||||
| Outcomes | Anticipated absolute effects* (95% CI) | Relative effect | No. of participants or patient‐months | Certainty of the evidence | |
| Risk with swan‐neck | Risk with Tenckhoff | ||||
| Peritonitis | 329 per 1,000 | 424 per 1,000 | RR 1.29 | 140 (2) | ⊕⊕⊝⊝ |
| Peritonitis rate (patient‐months) | 47 per 1,000 | 57 per 1,000 | RR 1.22 | 2535 (2) | ⊕⊕⊝⊝ |
| Exit‐site/tunnel infection | 671 per 1,000 | 645 per 1,000 | RR 0.96 | 140 (2) | ⊕⊕⊕⊝ |
| Exit‐site/tunnel infection rate (patient‐months) | 83 per 1,000 | 55 per 1,000 | RR 0.67 | 2535 (2) | ⊕⊕⊕⊝ |
| Catheter removal or replacement | 229 per 1,000 | 194 per 1,000 | RR 0.85 | 140 (2) | ⊕⊕⊕⊝ |
| Technique failure | 157 per 1,000 | 101 per 1,000 | RR 0.64 | 140 (2) | ⊕⊕⊕⊝ |
| Death (all causes) | 114 per 1,000 | 85 per 1,000 | RR 0.74 | 140 (2) | ⊕⊕⊝⊝ |
| *The risk in the intervention group (and its 95% confidence interval) is based on the assumed risk in the comparison group and the relative effect of the intervention (and its 95% CI). | |||||
| GRADE Working Group grades of evidence | |||||
| 1 Downgraded two levels: suboptimal quality of studies and imprecision 2 Downgraded two levels: suboptimal quality of studies and inconsistency 3 Downgraded one level: suboptimal quality of studies | |||||
| Self‐locating versus straight Tenckhoff catheter for preventing catheter‐related infections in chronic peritoneal dialysis patients | |||||
| Patient or population: chronic peritoneal dialysis patients | |||||
| Outcomes | Anticipated absolute effects* (95% CI) | Relative effect | No. of participants | Certainty of the evidence | |
| Risk with straight Tenckhoff | Risk with self‐locating | ||||
| Peritonitis | 684 per 1,000 | 773 per 1,000 | RR 1.13 | 78 (1) | ⊕⊝⊝⊝ |
| Exit‐site/tunnel infection | 184 per 1,000 | 175 per 1,000 | RR 0.95 | 78 (1) | ⊕⊝⊝⊝ |
| Catheter removal or replacement | 343 per 1,000 | 110 per 1,000 | RR 0.32 | 139 (2) | ⊕⊝⊝⊝ |
| Technique failure | 414 per 1,000 | 265 per 1,000 | RR 0.64 | 139 (2) | ⊕⊕⊕⊝ |
| Death (all causes) | 71 per 1,000 | 73 per 1,000 | RR 1.02 | 139 (2) | ⊕⊕⊝⊝ |
| *The risk in the intervention group (and its 95% confidence interval) is based on the assumed risk in the comparison group and the relative effect of the intervention (and its 95% CI). | |||||
| GRADE Working Group grades of evidence | |||||
| 1 Downgraded three levels: single study, suboptimal quality, and imprecision 2 Downgraded three levels: suboptimal quality, imprecision and inconsistency 3 Downgraded one level: suboptimal quality of study 4 Downgraded two levels: suboptimal quality and imprecision | |||||
| Study ID | Intervention | Control group | ||
| Events | Total | Events | Total | |
| Haematoma or haemoperitoneum | ||||
| 1 | 31 | 4 | 30 | |
| 7 | 34 | 4 | 32 | |
| 7 | 40 | 6 | 38 | |
| 0 | 36 | 0 | 37 | |
| 0 | 18 | 2 | 17 | |
| 3 | 99 | 2 | 90 | |
| 0 | 20 | 0 | 20 | |
| 0 | 20 | 0 | 20 | |
| 14 | 20 | 22 | 19 | |
| 1 | 48 | 1 | 35 | |
| 0 | 30 | 1 | 59 | |
| 1 | 103 | 0 | 49 | |
| Dialysate leak | ||||
| 2 | 34 | 1 | 32 | |
| 9 | 40 | 7 | 38 | |
| 7 | 40 | 6 | 37 | |
| 1 | 31 | 1 | 30 | |
| 2 | 36 | 3 | 37 | |
| 2 | 10 | 4 | 12 | |
| 0 | 20 | 2 | 20 | |
| 0 | 20 | 4 | 20 | |
| 0 | 20 | 0 | 20 | |
| 1 | 38 | 0 | 34 | |
| 0 | 99 | 3 | 90 | |
| 0 | 14 | 1 | 15 | |
| 6 | 48 | 3 | 35 | |
| 2 | 30 | 0 | 59 | |
| 1 | 29 | 3 | 32 | |
| 4 | 57 | 10 | 56 | |
| 2 | 11 | 0 | 11 | |
| 2 | 21 | 0 | 24 | |
| 1 | 40 | 0 | 40 | |
| 0 | 50 | 0 | 51 | |
| 0 | 103 | 1 | 49 | |
| Viscus perforation | ||||
| Nielsen 1995 (bladder perforation) | 0 | 38 | 1 | 34 |
| Al‐Hwiesh 2016 (bowel perforation) | 0 | 36 | 0 | 37 |
| Merrikhi 2014 (hollow viscus perforation) | 0 | 18 | 0 | 17 |
| 0 | 31 | 0 | 30 | |
| Outflow failure or catheter tip migration | ||||
| 1 | 31 | 4 | 30 | |
| 2 | 20 | 1 | 19 | |
| 12 | 40 | 25 | 38 | |
| 3 | 57 | 4 | 56 | |
| 1 | 36 | 11 | 37 | |
| 1 | 30 | 2 | 59 | |
| 3 | 20 | 1 | 20 | |
| 0 | 14 | 1 | 15 | |
| 1 | 10 | 3 | 12 | |
| 1 | 11 | 1 | 11 | |
| Hernia | ||||
| 0 | 34 | 1 | 32 | |
| 2 | 40 | 1 | 37 | |
| 7 | 40 | 7 | 38 | |
| 4 | 99 | 6 | 90 | |
| 2 | 40 | 2 | 40 | |
| 4 | 57 | 8 | 56 | |
| 0 | 103 | 1 | 49 | |
| Name of studies | Relative risk | 95% CI | P value |
| Peritonitis | |||
| Methods of catheter implantation | |||
| 1.41 | 0.25 to 7.91 | 0.69 | |
| 1.20 | 0.59 to 2.42 | 0.61 | |
| 0.93 | 0.48 to 1.80 | 0.82 | |
| 0.39 | 0.11 to 1.42 | 0.15 | |
| 0.81 | 0.41 to 1.61 | 0.55 | |
| 0.21 | 0.03 to 1.61 | 0.13 | |
| 0.60 | 0.20 to 1.81 | 0.36 | |
| Types of catheter | |||
| 0.82 | 0.50 to 1.35 | 0.44 | |
| 0.34 | 0.07 to 1.59 | 0.17 | |
| 0.80 | 0.29 to 2.21 | 0.67 | |
| 0.78 | 0.6 to 1.69 | 0.53 | |
| Other intervention | |||
| 0.90 | 0.49 to 1.66 | 0.73 | |
| 1.20 | 0.59 to 2.42 | 0.61 | |
| Peritonitis rate (patient‐month) | |||
| Methods of catheter implantation | |||
| 1.40 | 0.23 to 8.34 | 0.71 | |
| 0.67 | 0.38 to 1.18 | 0.16 | |
| Types of catheters | |||
| 0.34 | 0.07 to 1.69 | 0.19 | |
| 0.69 | 0.19 to 2.53 | 0.57 | |
| CI: confidence interval | |||
| Outcome or subgroup title | No. of studies | No. of participants | Statistical method | Effect size |
| 1 Peritonitis Show forest plot | 4 | 315 | Risk Ratio (M‐H, Random, 95% CI) | 0.90 [0.59, 1.35] |
| 2 Peritonitis rate (patient‐months) Show forest plot | 1 | Risk Ratio (M‐H, Random, 95% CI) | Totals not selected | |
| 3 Exit‐site/tunnel infection Show forest plot | 3 | 270 | Risk Ratio (M‐H, Random, 95% CI) | 1.00 [0.43, 2.31] |
| 4 Catheter removal or replacement Show forest plot | 3 | 167 | Risk Ratio (M‐H, Random, 95% CI) | 1.20 [0.77, 1.86] |
| 5 Technique failure Show forest plot | 4 | 283 | Risk Ratio (M‐H, Random, 95% CI) | 0.71 [0.47, 1.08] |
| 6 Death (all causes) Show forest plot | 3 | 270 | Risk Ratio (M‐H, Random, 95% CI) | 1.26 [0.72, 2.20] |
| 7 Dialysate leak Show forest plot | 3 | 167 | Risk Ratio (M‐H, Random, 95% CI) | 0.85 [0.10, 6.97] |
| Outcome or subgroup title | No. of studies | No. of participants | Statistical method | Effect size |
| 1 Peritonitis rate (patient‐months) Show forest plot | 2 | 2511 | Risk Ratio (M‐H, Random, 95% CI) | 1.16 [0.37, 3.60] |
| 2 Exit‐site/tunnel infection rate (patient‐months) Show forest plot | 2 | 2511 | Risk Ratio (M‐H, Random, 95% CI) | 1.15 [0.39, 3.42] |
| 3 Technique failure Show forest plot | 1 | Risk Ratio (M‐H, Random, 95% CI) | Totals not selected | |
| 4 Death (all causes) Show forest plot | 2 | 119 | Risk Ratio (M‐H, Random, 95% CI) | 0.90 [0.39, 2.08] |
| Outcome or subgroup title | No. of studies | No. of participants | Statistical method | Effect size |
| 1 Peritonitis Show forest plot | 2 | 120 | Risk Ratio (M‐H, Random, 95% CI) | 0.65 [0.32, 1.33] |
| 2 Exit‐site/tunnel infection Show forest plot | 2 | 120 | Risk Ratio (M‐H, Random, 95% CI) | 0.56 [0.12, 2.58] |
| 3 Catheter removal or replacement Show forest plot | 1 | Risk Ratio (M‐H, Random, 95% CI) | Totals not selected | |
| 4 Death (all causes) Show forest plot | 1 | Risk Ratio (M‐H, Random, 95% CI) | Totals not selected | |
| Outcome or subgroup title | No. of studies | No. of participants | Statistical method | Effect size |
| 1 Exit‐site/tunnel infection Show forest plot | 2 | 96 | Risk Ratio (M‐H, Random, 95% CI) | 0.16 [0.02, 1.30] |
| 2 Catheter removal or replacement Show forest plot | 1 | Risk Ratio (M‐H, Random, 95% CI) | Totals not selected | |
| 3 Postoperative bleed (haematoma or haemoperitoneum) Show forest plot | 2 | 96 | Risk Ratio (M‐H, Random, 95% CI) | 0.22 [0.04, 1.26] |
| Outcome or subgroup title | No. of studies | No. of participants | Statistical method | Effect size |
| 1 Peritonitis Show forest plot | 9 | 818 | Risk Ratio (M‐H, Random, 95% CI) | 1.04 [0.82, 1.31] |
| 2 Peritonitis rate (patient‐months) Show forest plot | 5 | 5882 | Risk Ratio (M‐H, Random, 95% CI) | 0.91 [0.68, 1.21] |
| 3 Exit‐site/tunnel infection Show forest plot | 10 | 826 | Risk Ratio (M‐H, Random, 95% CI) | 1.12 [0.94, 1.34] |
| 4 Exit‐site/tunnel infection rate (patient‐months) Show forest plot | 4 | 5286 | Risk Ratio (M‐H, Random, 95% CI) | 1.05 [0.77, 1.43] |
| 5 Catheter removal or replacement Show forest plot | 9 | 713 | Risk Ratio (M‐H, Random, 95% CI) | 1.11 [0.73, 1.66] |
| 6 Technique failure Show forest plot | 4 | 442 | Risk Ratio (M‐H, Random, 95% CI) | 0.82 [0.51, 1.31] |
| 7 Death (all causes) Show forest plot | 8 | 703 | Risk Ratio (M‐H, Random, 95% CI) | 0.95 [0.62, 1.46] |
| 8 Peritonitis (studies with low risk of attrition bias) Show forest plot | 4 | 345 | Risk Ratio (M‐H, Random, 95% CI) | 0.93 [0.69, 1.26] |
| 9 Peritonitis rate (patient‐months) (studies with low risk of attrition bias) Show forest plot | 3 | 1771 | Risk Ratio (M‐H, Random, 95% CI) | 0.91 [0.61, 1.35] |
| 10 Exit‐site/tunnel infection (studies with low risk of attrition bias) Show forest plot | 6 | 425 | Risk Ratio (M‐H, Random, 95% CI) | 1.14 [0.94, 1.39] |
| 11 Exit‐site/tunnel infection rate (patient‐months) (studies with low risk of attrition bias) Show forest plot | 2 | 1175 | Risk Ratio (M‐H, Random, 95% CI) | 1.18 [0.76, 1.82] |
| 12 Catheter removal or replacement (studies with low risk of attrition bias) Show forest plot | 5 | 329 | Risk Ratio (M‐H, Random, 95% CI) | 0.78 [0.45, 1.33] |
| 13 Dialysate leak Show forest plot | 7 | 550 | Risk Ratio (M‐H, Random, 95% CI) | 0.74 [0.16, 3.49] |
| 14 Postoperative bleeding (haematoma or haemoperitoneum) Show forest plot | 4 | 358 | Risk Ratio (M‐H, Random, 95% CI) | 1.14 [0.24, 5.34] |
| Outcome or subgroup title | No. of studies | No. of participants | Statistical method | Effect size |
| 1 Peritonitis Show forest plot | 2 | 140 | Risk Ratio (M‐H, Random, 95% CI) | 1.29 [0.85, 1.96] |
| 2 Peritonitis rate (patient‐months) Show forest plot | 2 | 2535 | Risk Ratio (M‐H, Random, 95% CI) | 1.22 [0.54, 2.75] |
| 3 Exit‐site/tunnel infection Show forest plot | 2 | 140 | Risk Ratio (M‐H, Random, 95% CI) | 0.96 [0.77, 1.21] |
| 4 Exit‐site/tunnel infection rate (patient‐months) Show forest plot | 2 | 2535 | Risk Ratio (M‐H, Random, 95% CI) | 0.67 [0.50, 0.90] |
| 5 Catheter removal or replacement Show forest plot | 2 | 140 | Risk Ratio (M‐H, Random, 95% CI) | 0.85 [0.42, 1.72] |
| 6 Technique failure Show forest plot | 2 | 140 | Risk Ratio (M‐H, Random, 95% CI) | 0.64 [0.26, 1.58] |
| 7 Death (all causes) Show forest plot | 2 | 140 | Risk Ratio (M‐H, Random, 95% CI) | 0.74 [0.27, 2.03] |
| Outcome or subgroup title | No. of studies | No. of participants | Statistical method | Effect size |
| 1 Peritonitis Show forest plot | 1 | Risk Ratio (M‐H, Random, 95% CI) | Totals not selected | |
| 2 Exit‐site/tunnel infection Show forest plot | 1 | Risk Ratio (M‐H, Random, 95% CI) | Totals not selected | |
| 3 Catheter removal or replacement Show forest plot | 2 | 139 | Risk Ratio (M‐H, Random, 95% CI) | 0.32 [0.03, 3.06] |
| 4 Technique failure Show forest plot | 2 | 139 | Risk Ratio (M‐H, Random, 95% CI) | 0.64 [0.39, 1.04] |
| 5 Death (all causes) Show forest plot | 2 | 139 | Risk Ratio (M‐H, Random, 95% CI) | 1.02 [0.11, 9.75] |
| 6 Dialysate leak Show forest plot | 2 | 139 | Risk Ratio (M‐H, Random, 95% CI) | 1.04 [0.46, 2.35] |
| Outcome or subgroup title | No. of studies | No. of participants | Statistical method | Effect size |
| 1 Peritonitis Show forest plot | 1 | Risk Ratio (M‐H, Random, 95% CI) | Totals not selected | |
| 2 Peritonitis rate (patient‐months) Show forest plot | 1 | Risk Ratio (M‐H, Random, 95% CI) | Totals not selected | |
| 3 Exit‐site/tunnel infection Show forest plot | 1 | Risk Ratio (M‐H, Random, 95% CI) | Totals not selected | |
| 4 Exit‐site/tunnel infection rate (patient‐month) Show forest plot | 1 | Risk Ratio (M‐H, Random, 95% CI) | Totals not selected | |
| 5 Catheter removal or replacement Show forest plot | 1 | Risk Ratio (M‐H, Random, 95% CI) | Totals not selected | |
| 6 Technique failure Show forest plot | 1 | Risk Ratio (M‐H, Random, 95% CI) | Totals not selected | |
| 7 Death (all causes) Show forest plot | 1 | Risk Ratio (M‐H, Random, 95% CI) | Totals not selected | |
| 8 Dialysate leak Show forest plot | 1 | Risk Ratio (M‐H, Random, 95% CI) | Totals not selected | |
| 9 Postoperative bleed (haematoma or haemoperitoneum) Show forest plot | 1 | Risk Ratio (M‐H, Random, 95% CI) | Totals not selected | |
| Outcome or subgroup title | No. of studies | No. of participants | Statistical method | Effect size |
| 1 Peritonitis Show forest plot | 1 | Risk Ratio (M‐H, Random, 95% CI) | Totals not selected | |
| 2 Exit‐site/tunnel infection Show forest plot | 1 | Risk Ratio (M‐H, Random, 95% CI) | Totals not selected | |
| 3 Catheter removal or replacement Show forest plot | 1 | Risk Ratio (M‐H, Random, 95% CI) | Totals not selected | |
| 4 Dialysate leak Show forest plot | 1 | Risk Ratio (M‐H, Random, 95% CI) | Totals not selected | |
| 5 Postoperative bleed (haematoma or haemoperitoneum) Show forest plot | 1 | Risk Ratio (M‐H, Random, 95% CI) | Totals not selected | |
| Outcome or subgroup title | No. of studies | No. of participants | Statistical method | Effect size |
| 1 Peritonitis Show forest plot | 1 | Risk Ratio (M‐H, Random, 95% CI) | Totals not selected | |
| 2 Exit‐site/tunnel infection Show forest plot | 1 | Risk Ratio (M‐H, Random, 95% CI) | Totals not selected | |
| 3 Death (all causes) Show forest plot | 1 | Risk Ratio (M‐H, Random, 95% CI) | Totals not selected | |
| Outcome or subgroup title | No. of studies | No. of participants | Statistical method | Effect size |
| 1 Peritonitis rate (patient‐month) Show forest plot | 1 | Risk Ratio (M‐H, Random, 95% CI) | Totals not selected | |
| 2 Exit‐site/tunnel infection (patient‐months) Show forest plot | 1 | Risk Ratio (M‐H, Random, 95% CI) | Totals not selected | |
| 3 Catheter removal or replacement Show forest plot | 1 | Risk Ratio (M‐H, Random, 95% CI) | Totals not selected | |
| 4 Death (all causes) Show forest plot | 1 | Risk Ratio (M‐H, Random, 95% CI) | Totals not selected | |
| 5 Dialysate leak Show forest plot | 1 | Risk Ratio (M‐H, Random, 95% CI) | Totals not selected | |
| Outcome or subgroup title | No. of studies | No. of participants | Statistical method | Effect size |
| 1 Peritonitis Show forest plot | 1 | Risk Ratio (M‐H, Random, 95% CI) | Totals not selected | |
| 2 Exit‐site/tunnel infection Show forest plot | 1 | Risk Ratio (M‐H, Random, 95% CI) | Totals not selected | |
| 3 Dialysate leak Show forest plot | 1 | Risk Ratio (M‐H, Random, 95% CI) | Totals not selected | |
| Outcome or subgroup title | No. of studies | No. of participants | Statistical method | Effect size |
| 1 Peritonitis Show forest plot | 1 | Risk Ratio (M‐H, Random, 95% CI) | Totals not selected | |
| 2 Exit‐site infection Show forest plot | 1 | Risk Ratio (M‐H, Random, 95% CI) | Totals not selected | |
| 3 Dialysate leak Show forest plot | 1 | Risk Ratio (M‐H, Random, 95% CI) | Totals not selected | |
| Outcome or subgroup title | No. of studies | No. of participants | Statistical method | Effect size |
| 1 Peritonitis Show forest plot | 1 | Risk Ratio (M‐H, Random, 95% CI) | Totals not selected | |
| 2 Exit‐site/tunnel infection Show forest plot | 1 | Risk Ratio (M‐H, Random, 95% CI) | Totals not selected | |
| 3 Catheter removal or replacement Show forest plot | 1 | Risk Ratio (M‐H, Random, 95% CI) | Totals not selected | |
| 4 Technique failure Show forest plot | 1 | Risk Ratio (M‐H, Random, 95% CI) | Totals not selected | |
| 5 Death (all causes) Show forest plot | 1 | Risk Ratio (M‐H, Random, 95% CI) | Totals not selected | |
| Outcome or subgroup title | No. of studies | No. of participants | Statistical method | Effect size |
| 1 Peritonitis Show forest plot | 1 | Risk Ratio (M‐H, Random, 95% CI) | Totals not selected | |
| 2 Peritonitis rate (patient‐months) Show forest plot | 1 | Risk Ratio (M‐H, Random, 95% CI) | Totals not selected | |
| 3 Exit‐site/tunnel infection Show forest plot | 1 | Risk Ratio (M‐H, Random, 95% CI) | Totals not selected | |
| 4 Exit‐site/tunnel infection (patient‐months) Show forest plot | 1 | Risk Ratio (M‐H, Random, 95% CI) | Totals not selected | |
| 5 Catheter removal or replacement Show forest plot | 1 | Risk Ratio (M‐H, Random, 95% CI) | Totals not selected | |
| 6 Dialysate leak Show forest plot | 1 | Risk Ratio (M‐H, Random, 95% CI) | Totals not selected | |
| Outcome or subgroup title | No. of studies | No. of participants | Statistical method | Effect size |
| 1 Peritonitis Show forest plot | 1 | Risk Ratio (M‐H, Random, 95% CI) | Totals not selected | |
| 2 Peritonitis rate (patient‐months) Show forest plot | 1 | Risk Ratio (M‐H, Random, 95% CI) | Totals not selected | |
| 3 Exit‐site/tunnel infection Show forest plot | 1 | Risk Ratio (M‐H, Random, 95% CI) | Totals not selected | |
| 4 Exit‐site/tunnel infection rate (patient‐months) Show forest plot | 1 | Risk Ratio (M‐H, Random, 95% CI) | Totals not selected | |
| 5 Technique failure Show forest plot | 1 | Risk Ratio (M‐H, Random, 95% CI) | Totals not selected | |
| 6 Dialysate leak Show forest plot | 1 | Risk Ratio (M‐H, Random, 95% CI) | Totals not selected | |
| Outcome or subgroup title | No. of studies | No. of participants | Statistical method | Effect size |
| 1 Peritonitis Show forest plot | 1 | Risk Ratio (M‐H, Random, 95% CI) | Totals not selected | |
| 2 Exit‐site/tunnel infection Show forest plot | 1 | Risk Ratio (M‐H, Random, 95% CI) | Totals not selected | |
| 3 Catheter removal or replacement Show forest plot | 1 | Risk Ratio (M‐H, Random, 95% CI) | Totals not selected | |
| 4 Death (all causes) Show forest plot | 1 | Risk Ratio (M‐H, Random, 95% CI) | Totals not selected | |
| Outcome or subgroup title | No. of studies | No. of participants | Statistical method | Effect size |
| 1 Peritonitis Show forest plot | 1 | Risk Ratio (M‐H, Random, 95% CI) | Totals not selected | |
| 2 Exit‐site/tunnel infection Show forest plot | 1 | Risk Ratio (M‐H, Random, 95% CI) | Totals not selected | |
| 3 Technique failure Show forest plot | 1 | Risk Ratio (M‐H, Random, 95% CI) | Totals not selected | |
| 4 Death (all causes) Show forest plot | 1 | Risk Ratio (M‐H, Random, 95% CI) | Totals not selected | |