Catheter type, placement and insertion techniques for preventing catheter‐related infections in chronic peritoneal dialysis patients
Información
- DOI:
- https://doi.org/10.1002/14651858.CD004680.pub3Copiar DOI

- Base de datos:
-
- Cochrane Database of Systematic Reviews
- Versión publicada:
-
- 31 mayo 2019see what's new
- Tipo:
-
- Intervention
- Etapa:
-
- Review
- Grupo Editorial Cochrane:
-
Grupo Cochrane de Riñón y trasplante
- Copyright:
-
- Copyright © 2019 The Cochrane Collaboration. Published by John Wiley & Sons, Ltd.
Cifras del artículo
Altmetric:
Citado por:
Autores
Contributions of authors
-
Screening of titles and abstracts: HH, YJ
-
Study eligibility: HH, YJ
-
Data collection for the review was carried out independently by HH and YJ
-
Quality assessment, data analysis: HH, YJ, GFMS
-
Writing of review: HH, YC, DJ, GFMS, JC
-
Providing general advice on the review; DJ, GFMS, JC, FPS, AT
-
Disagreements were resolved in consultation with DJ, GFMS and JC
Declarations of interest
Professor David Johnson is a current recipient of a National Health and Medical Research Council Practitioner Fellowship. Professor David Johnson has received consultancy fees, research grants, speaker’s honoraria and travel sponsorships for Baxter Healthcare and Fresenius Medical Care. He has also received a consulting fee from AstraZeneca and travel grants from Amgen
Yeoungjee Cho is a current recipient of a National Health and Medical Research Council Early Career Fellowship and has in the past received research grants from Fresenius Medical Care.
Acknowledgements
We are indebted to Dr R. Russo and Dr R. Curciulo of the University of Bari, Italy, who commented on the original project and provided useful background information. Particular thanks to Dr Paolo Strippoli, Director of Nephrology, Ospedale "A. Perrino", Brindisi, Italy, for his intellectual input in the manuscript with comments on the original review. The authors gratefully acknowledge the contribution of Chu‐Jun Ouyang, Shyh‐Chuan Jwo, Abdullah Khalaf Al‐Hwiesh, Guochun Chen, Terence Yip who responded to our queries about their studies. The authors gratefully acknowledge Narelle Willis and Gail Higgins from Cochrane Kidney and Transplant for their contribution.
Version history
| Published | Title | Stage | Authors | Version |
| 2019 May 31 | Catheter type, placement and insertion techniques for preventing catheter‐related infections in chronic peritoneal dialysis patients | Review | Htay Htay, David W Johnson, Jonathan C Craig, Francesco Paolo Schena, Giovanni FM Strippoli, Allison Tong, Yeoungjee Cho | |
| 2004 Oct 18 | Catheter type, placement and insertion techniques for preventing peritonitis in peritoneal dialysis patients | Review | Giovanni FM Strippoli, Allison Tong, David W Johnson, Francesco Paolo Schena, Jonathan C Craig | |
| 2003 Oct 20 | Catheter type, placement and insertion techniques for preventing peritonitis in peritoneal dialysis patients | Protocol | Giovanni FM Strippoli, Allison Tong, David Johnson, Francesco Paolo Schena, Jonathan C Craig | |
Differences between protocol and review
Peritonitis relapse and time to the first episode of peritonitis and peritonitis‐related death were unable to examine in the review as all the included studies did not specifically report these outcomes.
Keywords
MeSH
Medical Subject Headings (MeSH) Keywords
Medical Subject Headings Check Words
Humans;
PICO

Study flow diagram.
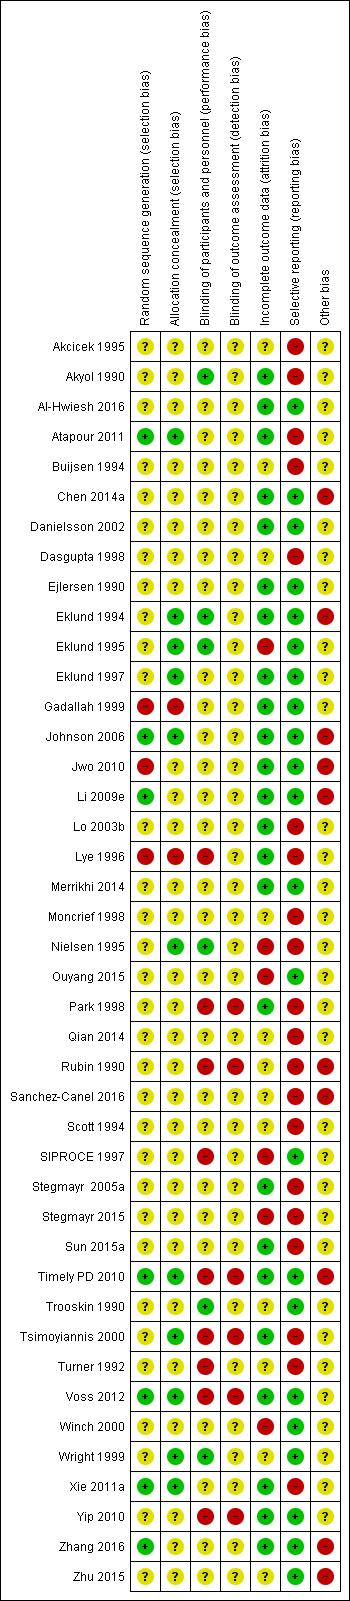
Risk of bias summary: review authors' judgements about each risk of bias item for each included study.
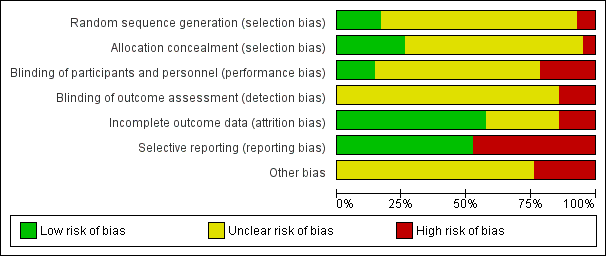
Risk of bias graph: review authors' judgements about each risk of bias item presented as percentages across all included studies.

Comparison 1 Laparoscopy versus laparotomy, Outcome 1 Peritonitis.
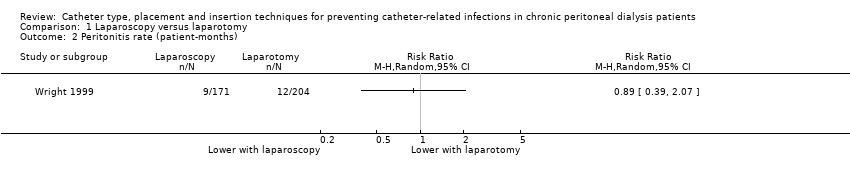
Comparison 1 Laparoscopy versus laparotomy, Outcome 2 Peritonitis rate (patient‐months).

Comparison 1 Laparoscopy versus laparotomy, Outcome 3 Exit‐site/tunnel infection.

Comparison 1 Laparoscopy versus laparotomy, Outcome 4 Catheter removal or replacement.
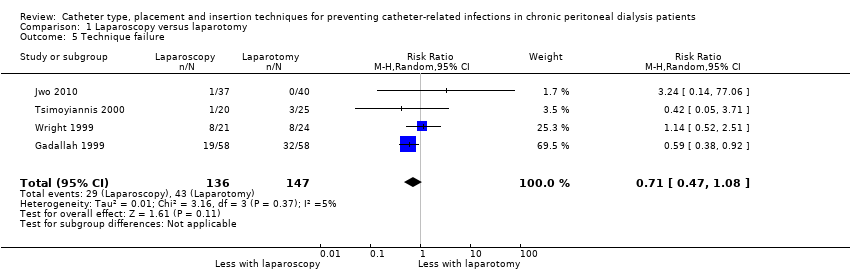
Comparison 1 Laparoscopy versus laparotomy, Outcome 5 Technique failure.

Comparison 1 Laparoscopy versus laparotomy, Outcome 6 Death (all causes).

Comparison 1 Laparoscopy versus laparotomy, Outcome 7 Dialysate leak.

Comparison 2 Buried (subcutaneous) versus non‐buried catheter, Outcome 1 Peritonitis rate (patient‐months).

Comparison 2 Buried (subcutaneous) versus non‐buried catheter, Outcome 2 Exit‐site/tunnel infection rate (patient‐months).
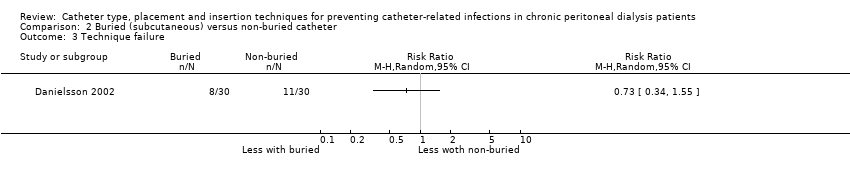
Comparison 2 Buried (subcutaneous) versus non‐buried catheter, Outcome 3 Technique failure.
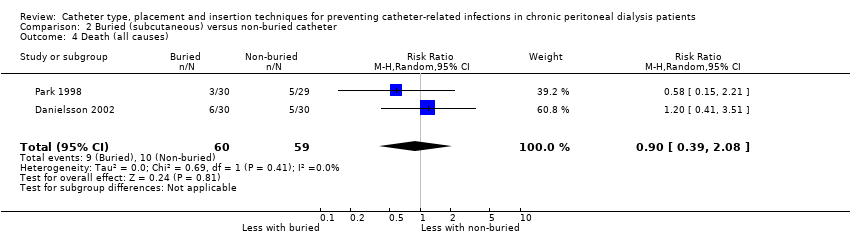
Comparison 2 Buried (subcutaneous) versus non‐buried catheter, Outcome 4 Death (all causes).

Comparison 3 Midline versus lateral insertion, Outcome 1 Peritonitis.

Comparison 3 Midline versus lateral insertion, Outcome 2 Exit‐site/tunnel infection.

Comparison 3 Midline versus lateral insertion, Outcome 3 Catheter removal or replacement.

Comparison 3 Midline versus lateral insertion, Outcome 4 Death (all causes).

Comparison 4 Percutaneous insertion versus open surgery, Outcome 1 Exit‐site/tunnel infection.

Comparison 4 Percutaneous insertion versus open surgery, Outcome 2 Catheter removal or replacement.
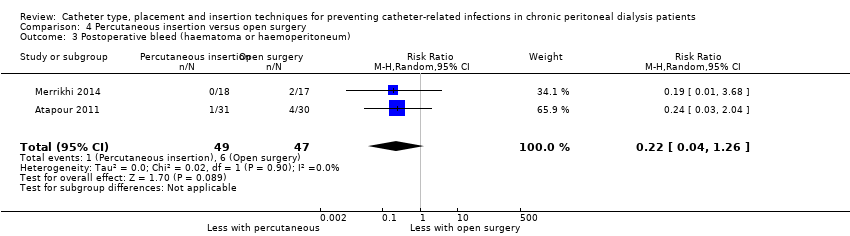
Comparison 4 Percutaneous insertion versus open surgery, Outcome 3 Postoperative bleed (haematoma or haemoperitoneum).
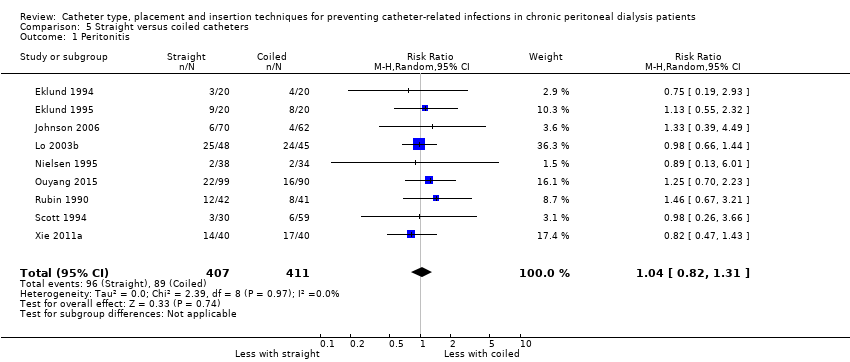
Comparison 5 Straight versus coiled catheters, Outcome 1 Peritonitis.

Comparison 5 Straight versus coiled catheters, Outcome 2 Peritonitis rate (patient‐months).
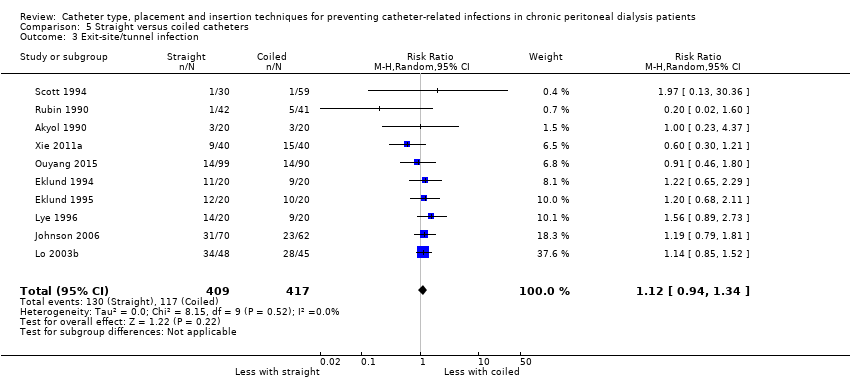
Comparison 5 Straight versus coiled catheters, Outcome 3 Exit‐site/tunnel infection.
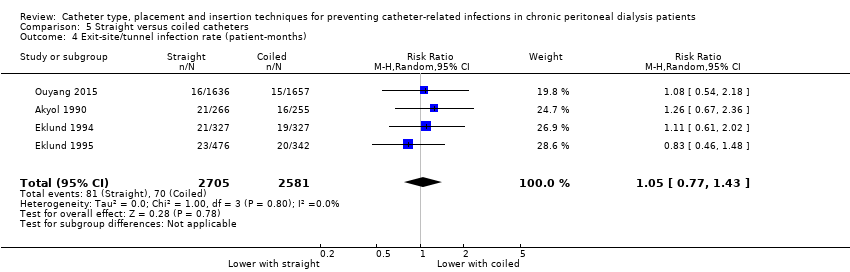
Comparison 5 Straight versus coiled catheters, Outcome 4 Exit‐site/tunnel infection rate (patient‐months).
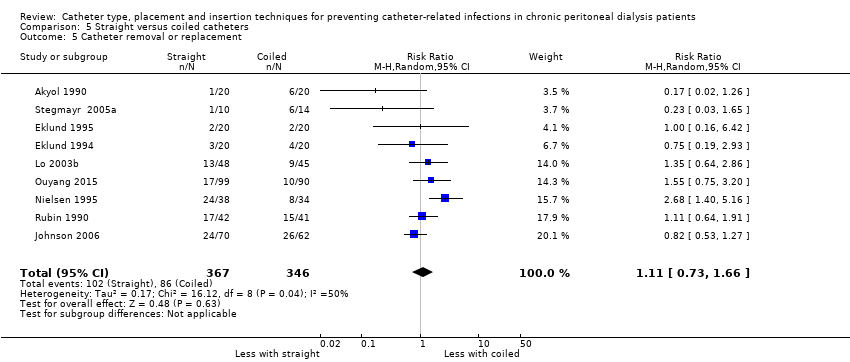
Comparison 5 Straight versus coiled catheters, Outcome 5 Catheter removal or replacement.
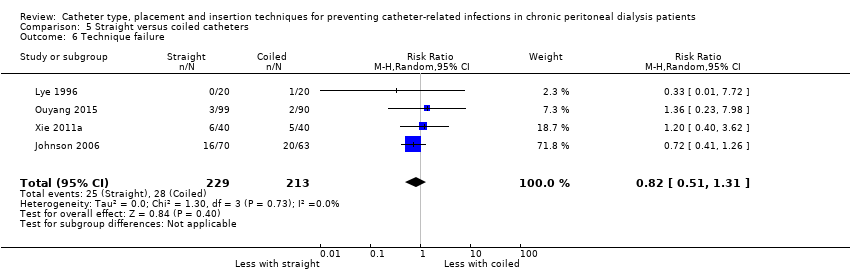
Comparison 5 Straight versus coiled catheters, Outcome 6 Technique failure.

Comparison 5 Straight versus coiled catheters, Outcome 7 Death (all causes).
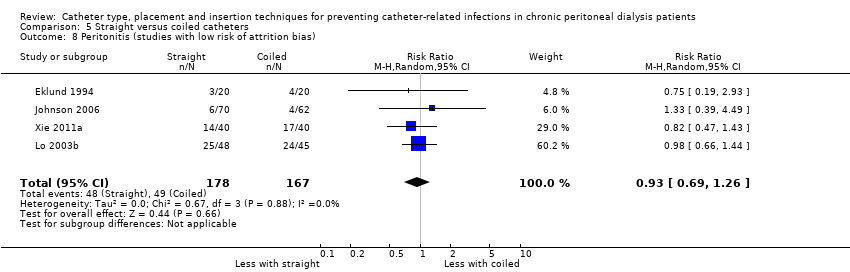
Comparison 5 Straight versus coiled catheters, Outcome 8 Peritonitis (studies with low risk of attrition bias).

Comparison 5 Straight versus coiled catheters, Outcome 9 Peritonitis rate (patient‐months) (studies with low risk of attrition bias).

Comparison 5 Straight versus coiled catheters, Outcome 10 Exit‐site/tunnel infection (studies with low risk of attrition bias).
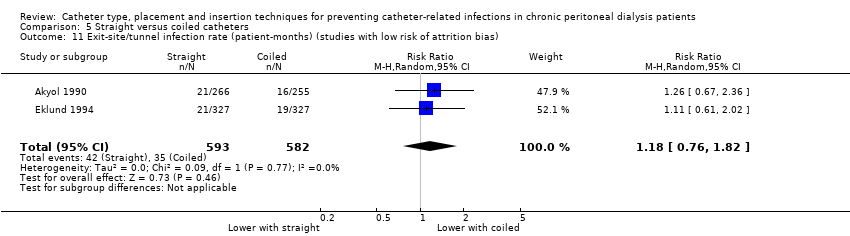
Comparison 5 Straight versus coiled catheters, Outcome 11 Exit‐site/tunnel infection rate (patient‐months) (studies with low risk of attrition bias).

Comparison 5 Straight versus coiled catheters, Outcome 12 Catheter removal or replacement (studies with low risk of attrition bias).
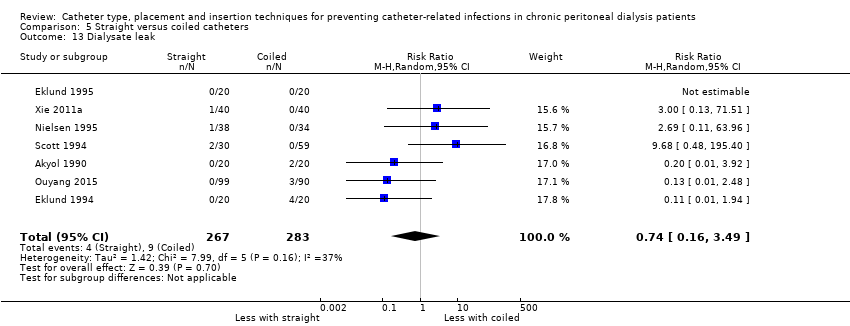
Comparison 5 Straight versus coiled catheters, Outcome 13 Dialysate leak.
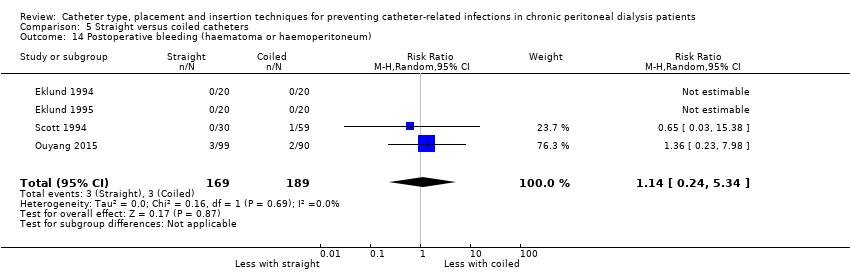
Comparison 5 Straight versus coiled catheters, Outcome 14 Postoperative bleeding (haematoma or haemoperitoneum).
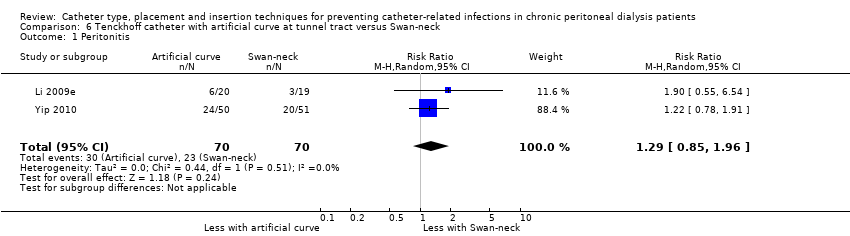
Comparison 6 Tenckhoff catheter with artificial curve at tunnel tract versus Swan‐neck, Outcome 1 Peritonitis.

Comparison 6 Tenckhoff catheter with artificial curve at tunnel tract versus Swan‐neck, Outcome 2 Peritonitis rate (patient‐months).
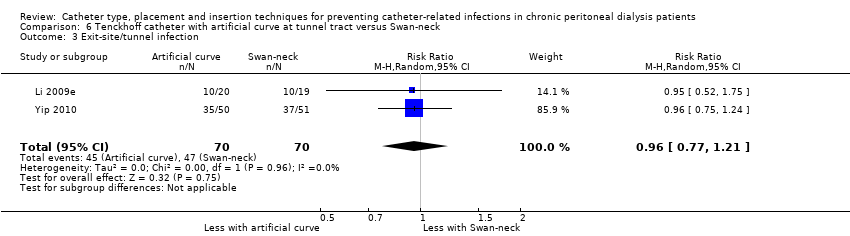
Comparison 6 Tenckhoff catheter with artificial curve at tunnel tract versus Swan‐neck, Outcome 3 Exit‐site/tunnel infection.

Comparison 6 Tenckhoff catheter with artificial curve at tunnel tract versus Swan‐neck, Outcome 4 Exit‐site/tunnel infection rate (patient‐months).

Comparison 6 Tenckhoff catheter with artificial curve at tunnel tract versus Swan‐neck, Outcome 5 Catheter removal or replacement.
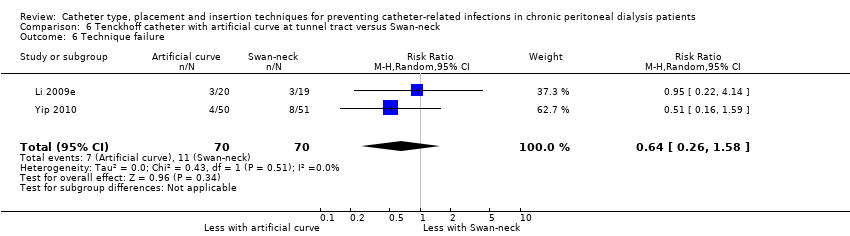
Comparison 6 Tenckhoff catheter with artificial curve at tunnel tract versus Swan‐neck, Outcome 6 Technique failure.
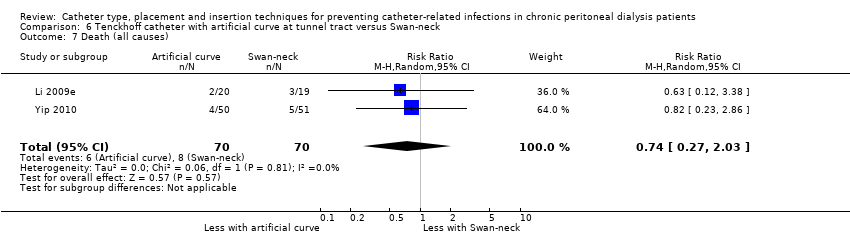
Comparison 6 Tenckhoff catheter with artificial curve at tunnel tract versus Swan‐neck, Outcome 7 Death (all causes).

Comparison 7 Self‐locating catheter versus straight tenckhoff catheter, Outcome 1 Peritonitis.
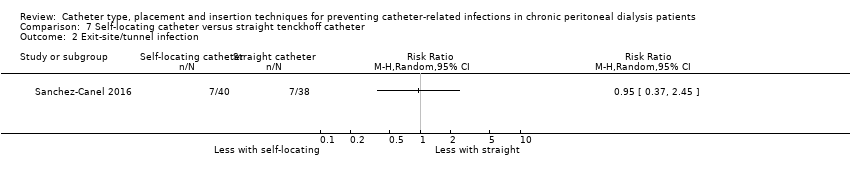
Comparison 7 Self‐locating catheter versus straight tenckhoff catheter, Outcome 2 Exit‐site/tunnel infection.

Comparison 7 Self‐locating catheter versus straight tenckhoff catheter, Outcome 3 Catheter removal or replacement.
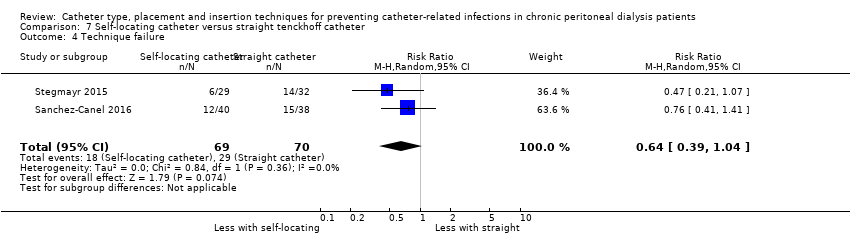
Comparison 7 Self‐locating catheter versus straight tenckhoff catheter, Outcome 4 Technique failure.

Comparison 7 Self‐locating catheter versus straight tenckhoff catheter, Outcome 5 Death (all causes).
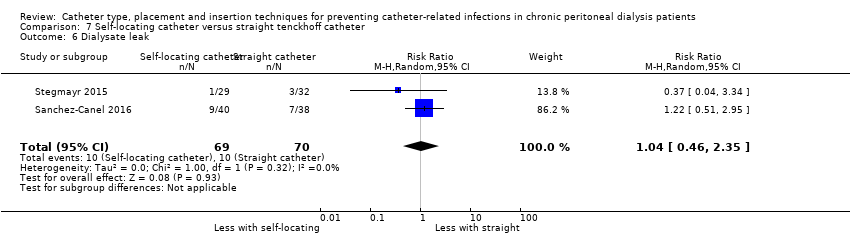
Comparison 7 Self‐locating catheter versus straight tenckhoff catheter, Outcome 6 Dialysate leak.
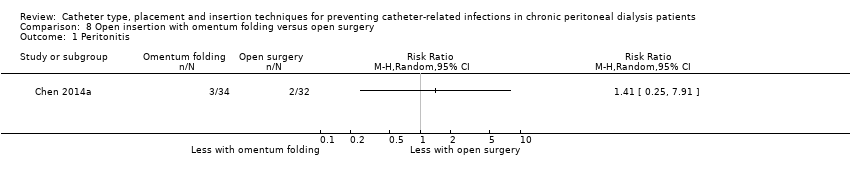
Comparison 8 Open insertion with omentum folding versus open surgery, Outcome 1 Peritonitis.

Comparison 8 Open insertion with omentum folding versus open surgery, Outcome 2 Peritonitis rate (patient‐months).

Comparison 8 Open insertion with omentum folding versus open surgery, Outcome 3 Exit‐site/tunnel infection.
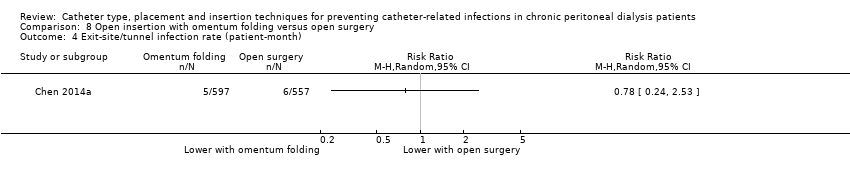
Comparison 8 Open insertion with omentum folding versus open surgery, Outcome 4 Exit‐site/tunnel infection rate (patient‐month).

Comparison 8 Open insertion with omentum folding versus open surgery, Outcome 5 Catheter removal or replacement.

Comparison 8 Open insertion with omentum folding versus open surgery, Outcome 6 Technique failure.
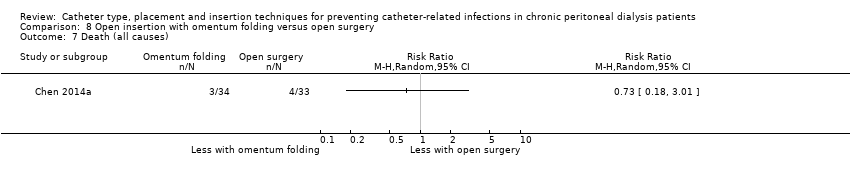
Comparison 8 Open insertion with omentum folding versus open surgery, Outcome 7 Death (all causes).

Comparison 8 Open insertion with omentum folding versus open surgery, Outcome 8 Dialysate leak.

Comparison 8 Open insertion with omentum folding versus open surgery, Outcome 9 Postoperative bleed (haematoma or haemoperitoneum).

Comparison 9 Modified surgery with or without catheter fixation versus open surgery, Outcome 1 Peritonitis.

Comparison 9 Modified surgery with or without catheter fixation versus open surgery, Outcome 2 Exit‐site/tunnel infection.

Comparison 9 Modified surgery with or without catheter fixation versus open surgery, Outcome 3 Catheter removal or replacement.

Comparison 9 Modified surgery with or without catheter fixation versus open surgery, Outcome 4 Dialysate leak.
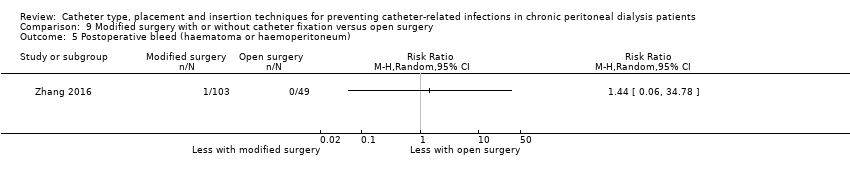
Comparison 9 Modified surgery with or without catheter fixation versus open surgery, Outcome 5 Postoperative bleed (haematoma or haemoperitoneum).
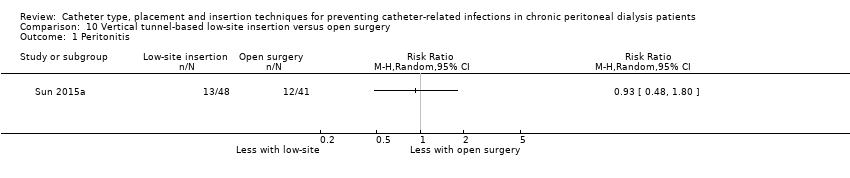
Comparison 10 Vertical tunnel‐based low‐site insertion versus open surgery, Outcome 1 Peritonitis.

Comparison 10 Vertical tunnel‐based low‐site insertion versus open surgery, Outcome 2 Exit‐site/tunnel infection.

Comparison 11 Ureteroscope‐assisted technique versus modified open surgery, Outcome 1 Peritonitis.

Comparison 11 Ureteroscope‐assisted technique versus modified open surgery, Outcome 2 Exit‐site/tunnel infection.

Comparison 11 Ureteroscope‐assisted technique versus modified open surgery, Outcome 3 Death (all causes).
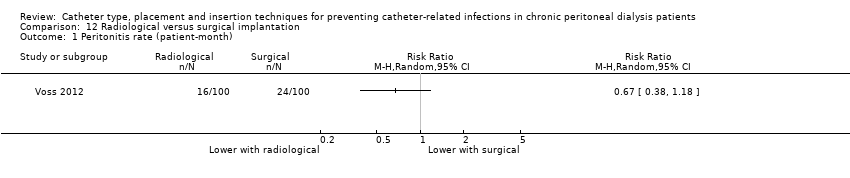
Comparison 12 Radiological versus surgical implantation, Outcome 1 Peritonitis rate (patient‐month).
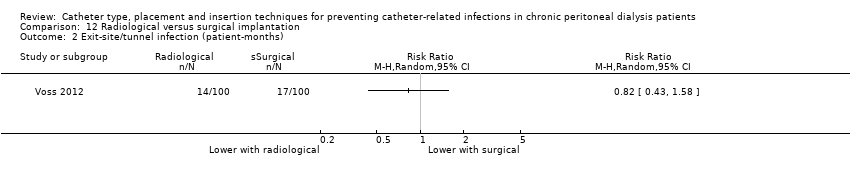
Comparison 12 Radiological versus surgical implantation, Outcome 2 Exit‐site/tunnel infection (patient‐months).
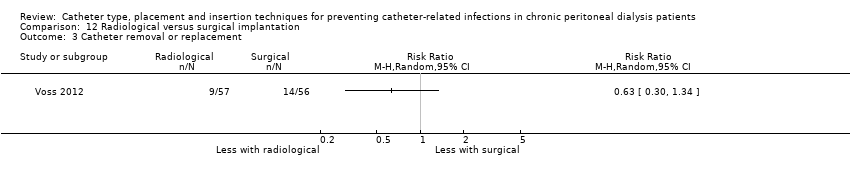
Comparison 12 Radiological versus surgical implantation, Outcome 3 Catheter removal or replacement.
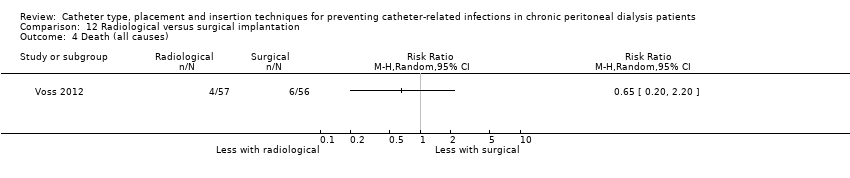
Comparison 12 Radiological versus surgical implantation, Outcome 4 Death (all causes).

Comparison 12 Radiological versus surgical implantation, Outcome 5 Dialysate leak.
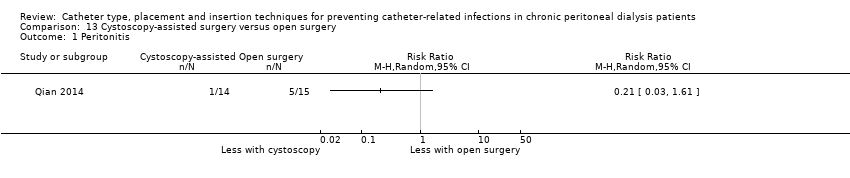
Comparison 13 Cystoscopy‐assisted surgery versus open surgery, Outcome 1 Peritonitis.

Comparison 13 Cystoscopy‐assisted surgery versus open surgery, Outcome 2 Exit‐site/tunnel infection.
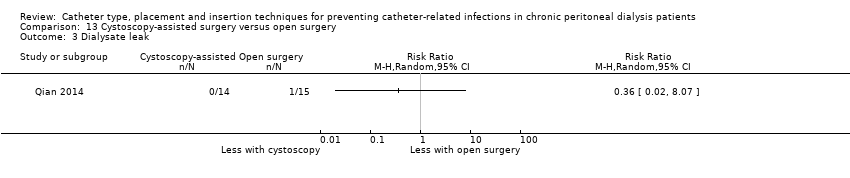
Comparison 13 Cystoscopy‐assisted surgery versus open surgery, Outcome 3 Dialysate leak.

Comparison 14 Laparoscopic Moncrief‐Popovich versus Trocar technique, Outcome 1 Peritonitis.

Comparison 14 Laparoscopic Moncrief‐Popovich versus Trocar technique, Outcome 2 Exit‐site infection.

Comparison 14 Laparoscopic Moncrief‐Popovich versus Trocar technique, Outcome 3 Dialysate leak.

Comparison 15 Single versus double cuff, Outcome 1 Peritonitis.
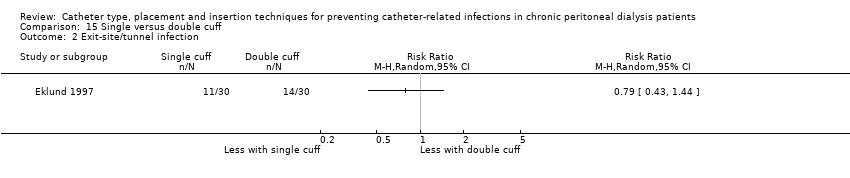
Comparison 15 Single versus double cuff, Outcome 2 Exit‐site/tunnel infection.
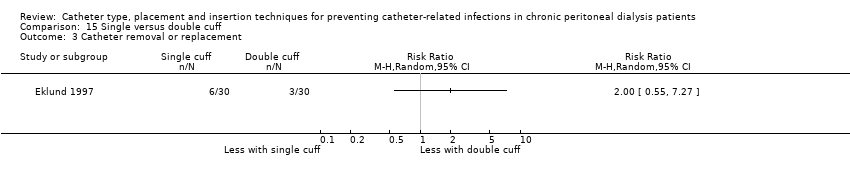
Comparison 15 Single versus double cuff, Outcome 3 Catheter removal or replacement.
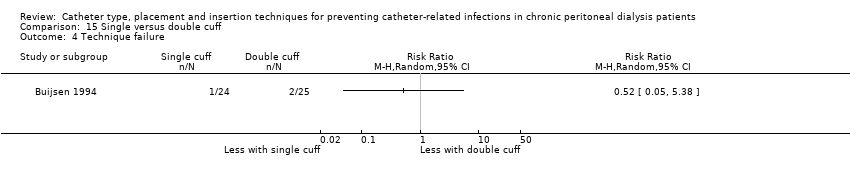
Comparison 15 Single versus double cuff, Outcome 4 Technique failure.

Comparison 15 Single versus double cuff, Outcome 5 Death (all causes).

Comparison 16 Triple cuff versus double catheter, Outcome 1 Peritonitis.

Comparison 16 Triple cuff versus double catheter, Outcome 2 Peritonitis rate (patient‐months).

Comparison 16 Triple cuff versus double catheter, Outcome 3 Exit‐site/tunnel infection.
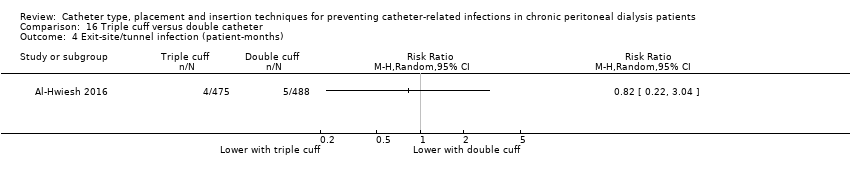
Comparison 16 Triple cuff versus double catheter, Outcome 4 Exit‐site/tunnel infection (patient‐months).

Comparison 16 Triple cuff versus double catheter, Outcome 5 Catheter removal or replacement.
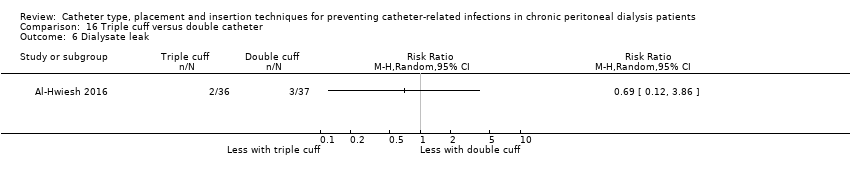
Comparison 16 Triple cuff versus double catheter, Outcome 6 Dialysate leak.

Comparison 17 Swan‐neck versus straight curled catheter, Outcome 1 Peritonitis.

Comparison 17 Swan‐neck versus straight curled catheter, Outcome 2 Peritonitis rate (patient‐months).
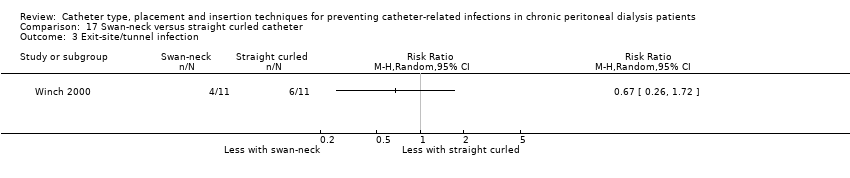
Comparison 17 Swan‐neck versus straight curled catheter, Outcome 3 Exit‐site/tunnel infection.
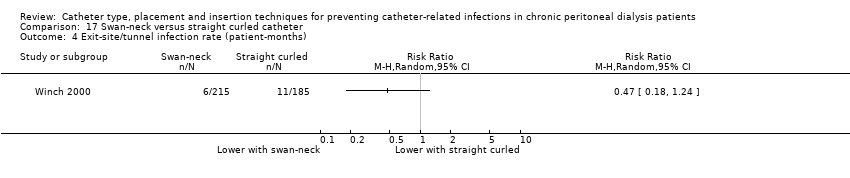
Comparison 17 Swan‐neck versus straight curled catheter, Outcome 4 Exit‐site/tunnel infection rate (patient‐months).

Comparison 17 Swan‐neck versus straight curled catheter, Outcome 5 Technique failure.

Comparison 17 Swan‐neck versus straight curled catheter, Outcome 6 Dialysate leak.

Comparison 18 Antibiotic‐treated catheter versus none, Outcome 1 Peritonitis.

Comparison 18 Antibiotic‐treated catheter versus none, Outcome 2 Exit‐site/tunnel infection.
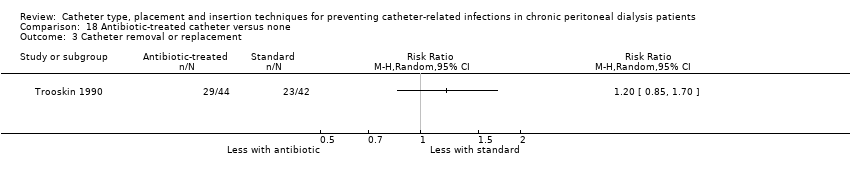
Comparison 18 Antibiotic‐treated catheter versus none, Outcome 3 Catheter removal or replacement.

Comparison 18 Antibiotic‐treated catheter versus none, Outcome 4 Death (all causes).

Comparison 19 Immobilisation versus no immobilisation, Outcome 1 Peritonitis.
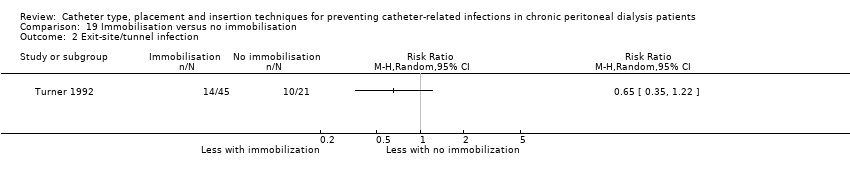
Comparison 19 Immobilisation versus no immobilisation, Outcome 2 Exit‐site/tunnel infection.

Comparison 20 Silver ring versus no silver ring, Outcome 1 Peritonitis.

Comparison 20 Silver ring versus no silver ring, Outcome 2 Exit‐site/tunnel infection.

Comparison 20 Silver ring versus no silver ring, Outcome 3 Technique failure.

Comparison 20 Silver ring versus no silver ring, Outcome 4 Death (all causes).
| Laparoscopy versus laparotomy for preventing catheter‐related infections in chronic peritoneal dialysis patients | |||||
| Patient or population: chronic peritoneal dialysis patients | |||||
| Outcomes | Anticipated absolute effects* (95% CI) | Relative effect | No. of participants or patient‐months | Certainty of the evidence | |
| Risk with laparotomy | Risk with laparoscopy | ||||
| Peritonitis | 242 per 1,000 | 218 per 1,000 | RR 0.90 | 315 (4) | ⊕⊕⊕⊝ |
| Peritonitis rate (patient‐months) | 59 per 1,000 | 52 per 1,000 | RR 0.89 | 375 (1) | ⊕⊝⊝⊝ |
| Exit‐site/tunnel infection | 125 per 1,000 | 125 per 1,000 | RR 1.00 | 270 (3) | ⊕⊕⊝⊝ |
| Catheter removal or replacement | 281 per 1,000 | 337 per 1,000 | RR 1.20 | 167 (3) | ⊕⊕⊝⊝ |
| Technique failure | 293 per 1,000 | 208 per 1,000 | RR 0.71 | 283 (4) | ⊕⊕⊝⊝ |
| Death (all causes) | 140 per 1,000 | 176 per 1,000 | RR 1.26 | 270 (3) | ⊕⊕⊕⊝ |
| *The risk in the intervention group (and its 95% confidence interval) is based on the assumed risk in the comparison group and the relative effect of the intervention (and its 95% CI). | |||||
| GRADE Working Group grades of evidence | |||||
| 1 Downgraded one level: suboptimal quality of studies 2 Downgraded two levels: single study with suboptimal quality and imprecision 3 Downgraded two levels: suboptimal quality and imprecision | |||||
| Buried (subcutaneous) versus non‐buried catheter for preventing catheter‐related infections in chronic peritoneal dialysis patients | |||||
| Patient or population: chronic peritoneal dialysis patients | |||||
| Outcomes | Anticipated absolute effects* (95% CI) | Relative effect | No. of participants or patient‐months | Certainty of the evidence | |
| Risk with non‐buried | Risk with buried (subcutaneous) | ||||
| Peritonitis rate (patient‐months) | 37 per 1,000 | 43 per 1,000 | RR 1.16 | 2511 (2) | ⊕⊝⊝⊝ |
| Exit‐site/tunnel infection rate (patient‐months) | 31 per 1,000 | 36 per 1,000 | RR 1.15 | 2511 (2) | ⊕⊝⊝⊝ |
| Technique failure | 367 per 1,000 | 268 per 1,000 | RR 0.73 | 60 (1) | ⊕⊝⊝⊝ |
| Death (all causes) | 169 per 1,000 | 153 per 1,000 | RR 0.90 | 119 (2) | ⊕⊕⊕⊝ |
| *The risk in the intervention group (and its 95% confidence interval) is based on the assumed risk in the comparison group and the relative effect of the intervention (and its 95% CI). | |||||
| GRADE Working Group grades of evidence | |||||
| 1 Downgraded three levels: suboptimal quality, inconsistency, and imprecision 2 Downgraded three levels: single study, suboptimal quality, and imprecision 3 Downgraded two levels: suboptimal quality of studies and imprecision | |||||
| Midline versus lateral insertion for preventing catheter‐related infections in chronic peritoneal dialysis patients | |||||
| Patient or population: chronic peritoneal dialysis patients | |||||
| Outcomes | Anticipated absolute effects* (95% CI) | Relative effect | No. of participants | Certainty of the evidence | |
| Risk with lateral | Risk with midline | ||||
| Peritonitis | 255 per 1,000 | 166 per 1,000 | RR 0.65 | 120 (2) | ⊕⊕⊕⊝ |
| Exit‐site/tunnel infection | 78 per 1,000 | 44 per 1,000 | RR 0.56 | 120 (2) | ⊕⊕⊝⊝ |
| Catheter removal or replacement | 514 per 1,000 | 293 per 1,000 | RR 0.57 | 83 (1) | ⊕⊝⊝⊝ VERY LOW 3 |
| Death (all causes) | 0 per 1,000 | 0 per 1,000 | RR 8.50 | 37 (1) | ⊕⊝⊝⊝ |
| *The risk in the intervention group (and its 95% confidence interval) is based on the assumed risk in the comparison group and the relative effect of the intervention (and its 95% CI). | |||||
| GRADE Working Group grades of evidence | |||||
| 1 Downgraded one level: suboptimal quality of studies 2 Downgraded two levels: suboptimal quality and imprecision 3 Downgraded three levels: single study, suboptimal quality study, and imprecision | |||||
| Percutaneous insertion versus open surgery for preventing catheter‐related infections in chronic peritoneal dialysis patients | |||||
| Patient or population: chronic peritoneal dialysis patients | |||||
| Outcomes | Anticipated absolute effects* (95% CI) | Relative effect | No. of participants | Certainty of the evidence | |
| Risk with open surgery | Risk with percutaneous insertion | ||||
| Exit‐site/tunnel infection | 106 per 1,000 | 17 per 1,000 | RR 0.16 | 96 | ⊕⊕⊕⊝ |
| Catheter removal or replacement | 133 per 1,000 | 32 per 1,000 | RR 0.24 | 61 | ⊕⊝⊝⊝ |
| *The risk in the intervention group (and its 95% confidence interval) is based on the assumed risk in the comparison group and the relative effect of the intervention (and its 95% CI). | |||||
| GRADE Working Group grades of evidence | |||||
| 1 Downgraded one level: suboptimal quality of studies 2 Downgraded two levels: single study with suboptimal quality and imprecision | |||||
| Straight versus coiled catheters for preventing catheter‐related infections in chronic peritoneal dialysis patients | |||||
| Patient or population: chronic peritoneal dialysis patients | |||||
| Outcomes | Anticipated absolute effects* (95% CI) | Relative effect | No. of participants or patient‐months | Certainty of the evidence | |
| Risk with coiled | Risk with straight | ||||
| Peritonitis | 217 per 1,000 | 225 per 1,000 | RR 1.04 | 818 (9) | ⊕⊕⊕⊝ |
| Peritonitis rate (patient‐months) | 32 per 1,000 | 29 per 1,000 | RR 0.91 | 5882 (5) | ⊕⊕⊕⊝ |
| Exit‐site/tunnel infection | 281 per 1,000 | 314 per 1,000 | RR 1.12 | 826 (10) | ⊕⊕⊕⊝ |
| Exit‐site/tunnel infection rate (patient‐months) | 27 per 1,000 | 28 per 1,000 | RR 1.05 | 5286 (4) | ⊕⊕⊕⊝ |
| Catheter removal or replacement | 249 per 1,000 | 276 per 1,000 | RR 1.11 | 713 (9) | ⊕⊝⊝⊝ |
| Technique failure | 131 per 1,000 | 108 per 1,000 | RR 0.82 | 442 (4) | ⊕⊕⊕⊝ |
| Death (all causes) | 124 per 1,000 | 117 per 1,000 | RR 0.95 | 703 (8) | ⊕⊕⊝⊝ |
| *The risk in the intervention group (and its 95% confidence interval) is based on the assumed risk in the comparison group and the relative effect of the intervention (and its 95% CI). | |||||
| GRADE Working Group grades of evidence | |||||
| 1 Downgraded one level: most studies are of suboptimal quality 2 Downgrade one level: inconsistency 3 Downgraded one level: publication bias | |||||
| Tenckhoff catheter with artificial curve at tunnel tract versus swan‐neck for preventing catheter‐related infections in chronic peritoneal dialysis patients | |||||
| Patient or population: preventing catheter‐related infections in chronic peritoneal dialysis patients | |||||
| Outcomes | Anticipated absolute effects* (95% CI) | Relative effect | No. of participants or patient‐months | Certainty of the evidence | |
| Risk with swan‐neck | Risk with Tenckhoff | ||||
| Peritonitis | 329 per 1,000 | 424 per 1,000 | RR 1.29 | 140 (2) | ⊕⊕⊝⊝ |
| Peritonitis rate (patient‐months) | 47 per 1,000 | 57 per 1,000 | RR 1.22 | 2535 (2) | ⊕⊕⊝⊝ |
| Exit‐site/tunnel infection | 671 per 1,000 | 645 per 1,000 | RR 0.96 | 140 (2) | ⊕⊕⊕⊝ |
| Exit‐site/tunnel infection rate (patient‐months) | 83 per 1,000 | 55 per 1,000 | RR 0.67 | 2535 (2) | ⊕⊕⊕⊝ |
| Catheter removal or replacement | 229 per 1,000 | 194 per 1,000 | RR 0.85 | 140 (2) | ⊕⊕⊕⊝ |
| Technique failure | 157 per 1,000 | 101 per 1,000 | RR 0.64 | 140 (2) | ⊕⊕⊕⊝ |
| Death (all causes) | 114 per 1,000 | 85 per 1,000 | RR 0.74 | 140 (2) | ⊕⊕⊝⊝ |
| *The risk in the intervention group (and its 95% confidence interval) is based on the assumed risk in the comparison group and the relative effect of the intervention (and its 95% CI). | |||||
| GRADE Working Group grades of evidence | |||||
| 1 Downgraded two levels: suboptimal quality of studies and imprecision 2 Downgraded two levels: suboptimal quality of studies and inconsistency 3 Downgraded one level: suboptimal quality of studies | |||||
| Self‐locating versus straight Tenckhoff catheter for preventing catheter‐related infections in chronic peritoneal dialysis patients | |||||
| Patient or population: chronic peritoneal dialysis patients | |||||
| Outcomes | Anticipated absolute effects* (95% CI) | Relative effect | No. of participants | Certainty of the evidence | |
| Risk with straight Tenckhoff | Risk with self‐locating | ||||
| Peritonitis | 684 per 1,000 | 773 per 1,000 | RR 1.13 | 78 (1) | ⊕⊝⊝⊝ |
| Exit‐site/tunnel infection | 184 per 1,000 | 175 per 1,000 | RR 0.95 | 78 (1) | ⊕⊝⊝⊝ |
| Catheter removal or replacement | 343 per 1,000 | 110 per 1,000 | RR 0.32 | 139 (2) | ⊕⊝⊝⊝ |
| Technique failure | 414 per 1,000 | 265 per 1,000 | RR 0.64 | 139 (2) | ⊕⊕⊕⊝ |
| Death (all causes) | 71 per 1,000 | 73 per 1,000 | RR 1.02 | 139 (2) | ⊕⊕⊝⊝ |
| *The risk in the intervention group (and its 95% confidence interval) is based on the assumed risk in the comparison group and the relative effect of the intervention (and its 95% CI). | |||||
| GRADE Working Group grades of evidence | |||||
| 1 Downgraded three levels: single study, suboptimal quality, and imprecision 2 Downgraded three levels: suboptimal quality, imprecision and inconsistency 3 Downgraded one level: suboptimal quality of study 4 Downgraded two levels: suboptimal quality and imprecision | |||||
| Study ID | Intervention | Control group | ||
| Events | Total | Events | Total | |
| Haematoma or haemoperitoneum | ||||
| 1 | 31 | 4 | 30 | |
| 7 | 34 | 4 | 32 | |
| 7 | 40 | 6 | 38 | |
| 0 | 36 | 0 | 37 | |
| 0 | 18 | 2 | 17 | |
| 3 | 99 | 2 | 90 | |
| 0 | 20 | 0 | 20 | |
| 0 | 20 | 0 | 20 | |
| 14 | 20 | 22 | 19 | |
| 1 | 48 | 1 | 35 | |
| 0 | 30 | 1 | 59 | |
| 1 | 103 | 0 | 49 | |
| Dialysate leak | ||||
| 2 | 34 | 1 | 32 | |
| 9 | 40 | 7 | 38 | |
| 7 | 40 | 6 | 37 | |
| 1 | 31 | 1 | 30 | |
| 2 | 36 | 3 | 37 | |
| 2 | 10 | 4 | 12 | |
| 0 | 20 | 2 | 20 | |
| 0 | 20 | 4 | 20 | |
| 0 | 20 | 0 | 20 | |
| 1 | 38 | 0 | 34 | |
| 0 | 99 | 3 | 90 | |
| 0 | 14 | 1 | 15 | |
| 6 | 48 | 3 | 35 | |
| 2 | 30 | 0 | 59 | |
| 1 | 29 | 3 | 32 | |
| 4 | 57 | 10 | 56 | |
| 2 | 11 | 0 | 11 | |
| 2 | 21 | 0 | 24 | |
| 1 | 40 | 0 | 40 | |
| 0 | 50 | 0 | 51 | |
| 0 | 103 | 1 | 49 | |
| Viscus perforation | ||||
| Nielsen 1995 (bladder perforation) | 0 | 38 | 1 | 34 |
| Al‐Hwiesh 2016 (bowel perforation) | 0 | 36 | 0 | 37 |
| Merrikhi 2014 (hollow viscus perforation) | 0 | 18 | 0 | 17 |
| 0 | 31 | 0 | 30 | |
| Outflow failure or catheter tip migration | ||||
| 1 | 31 | 4 | 30 | |
| 2 | 20 | 1 | 19 | |
| 12 | 40 | 25 | 38 | |
| 3 | 57 | 4 | 56 | |
| 1 | 36 | 11 | 37 | |
| 1 | 30 | 2 | 59 | |
| 3 | 20 | 1 | 20 | |
| 0 | 14 | 1 | 15 | |
| 1 | 10 | 3 | 12 | |
| 1 | 11 | 1 | 11 | |
| Hernia | ||||
| 0 | 34 | 1 | 32 | |
| 2 | 40 | 1 | 37 | |
| 7 | 40 | 7 | 38 | |
| 4 | 99 | 6 | 90 | |
| 2 | 40 | 2 | 40 | |
| 4 | 57 | 8 | 56 | |
| 0 | 103 | 1 | 49 | |
| Name of studies | Relative risk | 95% CI | P value |
| Peritonitis | |||
| Methods of catheter implantation | |||
| 1.41 | 0.25 to 7.91 | 0.69 | |
| 1.20 | 0.59 to 2.42 | 0.61 | |
| 0.93 | 0.48 to 1.80 | 0.82 | |
| 0.39 | 0.11 to 1.42 | 0.15 | |
| 0.81 | 0.41 to 1.61 | 0.55 | |
| 0.21 | 0.03 to 1.61 | 0.13 | |
| 0.60 | 0.20 to 1.81 | 0.36 | |
| Types of catheter | |||
| 0.82 | 0.50 to 1.35 | 0.44 | |
| 0.34 | 0.07 to 1.59 | 0.17 | |
| 0.80 | 0.29 to 2.21 | 0.67 | |
| 0.78 | 0.6 to 1.69 | 0.53 | |
| Other intervention | |||
| 0.90 | 0.49 to 1.66 | 0.73 | |
| 1.20 | 0.59 to 2.42 | 0.61 | |
| Peritonitis rate (patient‐month) | |||
| Methods of catheter implantation | |||
| 1.40 | 0.23 to 8.34 | 0.71 | |
| 0.67 | 0.38 to 1.18 | 0.16 | |
| Types of catheters | |||
| 0.34 | 0.07 to 1.69 | 0.19 | |
| 0.69 | 0.19 to 2.53 | 0.57 | |
| CI: confidence interval | |||
| Outcome or subgroup title | No. of studies | No. of participants | Statistical method | Effect size |
| 1 Peritonitis Show forest plot | 4 | 315 | Risk Ratio (M‐H, Random, 95% CI) | 0.90 [0.59, 1.35] |
| 2 Peritonitis rate (patient‐months) Show forest plot | 1 | Risk Ratio (M‐H, Random, 95% CI) | Totals not selected | |
| 3 Exit‐site/tunnel infection Show forest plot | 3 | 270 | Risk Ratio (M‐H, Random, 95% CI) | 1.00 [0.43, 2.31] |
| 4 Catheter removal or replacement Show forest plot | 3 | 167 | Risk Ratio (M‐H, Random, 95% CI) | 1.20 [0.77, 1.86] |
| 5 Technique failure Show forest plot | 4 | 283 | Risk Ratio (M‐H, Random, 95% CI) | 0.71 [0.47, 1.08] |
| 6 Death (all causes) Show forest plot | 3 | 270 | Risk Ratio (M‐H, Random, 95% CI) | 1.26 [0.72, 2.20] |
| 7 Dialysate leak Show forest plot | 3 | 167 | Risk Ratio (M‐H, Random, 95% CI) | 0.85 [0.10, 6.97] |
| Outcome or subgroup title | No. of studies | No. of participants | Statistical method | Effect size |
| 1 Peritonitis rate (patient‐months) Show forest plot | 2 | 2511 | Risk Ratio (M‐H, Random, 95% CI) | 1.16 [0.37, 3.60] |
| 2 Exit‐site/tunnel infection rate (patient‐months) Show forest plot | 2 | 2511 | Risk Ratio (M‐H, Random, 95% CI) | 1.15 [0.39, 3.42] |
| 3 Technique failure Show forest plot | 1 | Risk Ratio (M‐H, Random, 95% CI) | Totals not selected | |
| 4 Death (all causes) Show forest plot | 2 | 119 | Risk Ratio (M‐H, Random, 95% CI) | 0.90 [0.39, 2.08] |
| Outcome or subgroup title | No. of studies | No. of participants | Statistical method | Effect size |
| 1 Peritonitis Show forest plot | 2 | 120 | Risk Ratio (M‐H, Random, 95% CI) | 0.65 [0.32, 1.33] |
| 2 Exit‐site/tunnel infection Show forest plot | 2 | 120 | Risk Ratio (M‐H, Random, 95% CI) | 0.56 [0.12, 2.58] |
| 3 Catheter removal or replacement Show forest plot | 1 | Risk Ratio (M‐H, Random, 95% CI) | Totals not selected | |
| 4 Death (all causes) Show forest plot | 1 | Risk Ratio (M‐H, Random, 95% CI) | Totals not selected | |
| Outcome or subgroup title | No. of studies | No. of participants | Statistical method | Effect size |
| 1 Exit‐site/tunnel infection Show forest plot | 2 | 96 | Risk Ratio (M‐H, Random, 95% CI) | 0.16 [0.02, 1.30] |
| 2 Catheter removal or replacement Show forest plot | 1 | Risk Ratio (M‐H, Random, 95% CI) | Totals not selected | |
| 3 Postoperative bleed (haematoma or haemoperitoneum) Show forest plot | 2 | 96 | Risk Ratio (M‐H, Random, 95% CI) | 0.22 [0.04, 1.26] |
| Outcome or subgroup title | No. of studies | No. of participants | Statistical method | Effect size |
| 1 Peritonitis Show forest plot | 9 | 818 | Risk Ratio (M‐H, Random, 95% CI) | 1.04 [0.82, 1.31] |
| 2 Peritonitis rate (patient‐months) Show forest plot | 5 | 5882 | Risk Ratio (M‐H, Random, 95% CI) | 0.91 [0.68, 1.21] |
| 3 Exit‐site/tunnel infection Show forest plot | 10 | 826 | Risk Ratio (M‐H, Random, 95% CI) | 1.12 [0.94, 1.34] |
| 4 Exit‐site/tunnel infection rate (patient‐months) Show forest plot | 4 | 5286 | Risk Ratio (M‐H, Random, 95% CI) | 1.05 [0.77, 1.43] |
| 5 Catheter removal or replacement Show forest plot | 9 | 713 | Risk Ratio (M‐H, Random, 95% CI) | 1.11 [0.73, 1.66] |
| 6 Technique failure Show forest plot | 4 | 442 | Risk Ratio (M‐H, Random, 95% CI) | 0.82 [0.51, 1.31] |
| 7 Death (all causes) Show forest plot | 8 | 703 | Risk Ratio (M‐H, Random, 95% CI) | 0.95 [0.62, 1.46] |
| 8 Peritonitis (studies with low risk of attrition bias) Show forest plot | 4 | 345 | Risk Ratio (M‐H, Random, 95% CI) | 0.93 [0.69, 1.26] |
| 9 Peritonitis rate (patient‐months) (studies with low risk of attrition bias) Show forest plot | 3 | 1771 | Risk Ratio (M‐H, Random, 95% CI) | 0.91 [0.61, 1.35] |
| 10 Exit‐site/tunnel infection (studies with low risk of attrition bias) Show forest plot | 6 | 425 | Risk Ratio (M‐H, Random, 95% CI) | 1.14 [0.94, 1.39] |
| 11 Exit‐site/tunnel infection rate (patient‐months) (studies with low risk of attrition bias) Show forest plot | 2 | 1175 | Risk Ratio (M‐H, Random, 95% CI) | 1.18 [0.76, 1.82] |
| 12 Catheter removal or replacement (studies with low risk of attrition bias) Show forest plot | 5 | 329 | Risk Ratio (M‐H, Random, 95% CI) | 0.78 [0.45, 1.33] |
| 13 Dialysate leak Show forest plot | 7 | 550 | Risk Ratio (M‐H, Random, 95% CI) | 0.74 [0.16, 3.49] |
| 14 Postoperative bleeding (haematoma or haemoperitoneum) Show forest plot | 4 | 358 | Risk Ratio (M‐H, Random, 95% CI) | 1.14 [0.24, 5.34] |
| Outcome or subgroup title | No. of studies | No. of participants | Statistical method | Effect size |
| 1 Peritonitis Show forest plot | 2 | 140 | Risk Ratio (M‐H, Random, 95% CI) | 1.29 [0.85, 1.96] |
| 2 Peritonitis rate (patient‐months) Show forest plot | 2 | 2535 | Risk Ratio (M‐H, Random, 95% CI) | 1.22 [0.54, 2.75] |
| 3 Exit‐site/tunnel infection Show forest plot | 2 | 140 | Risk Ratio (M‐H, Random, 95% CI) | 0.96 [0.77, 1.21] |
| 4 Exit‐site/tunnel infection rate (patient‐months) Show forest plot | 2 | 2535 | Risk Ratio (M‐H, Random, 95% CI) | 0.67 [0.50, 0.90] |
| 5 Catheter removal or replacement Show forest plot | 2 | 140 | Risk Ratio (M‐H, Random, 95% CI) | 0.85 [0.42, 1.72] |
| 6 Technique failure Show forest plot | 2 | 140 | Risk Ratio (M‐H, Random, 95% CI) | 0.64 [0.26, 1.58] |
| 7 Death (all causes) Show forest plot | 2 | 140 | Risk Ratio (M‐H, Random, 95% CI) | 0.74 [0.27, 2.03] |
| Outcome or subgroup title | No. of studies | No. of participants | Statistical method | Effect size |
| 1 Peritonitis Show forest plot | 1 | Risk Ratio (M‐H, Random, 95% CI) | Totals not selected | |
| 2 Exit‐site/tunnel infection Show forest plot | 1 | Risk Ratio (M‐H, Random, 95% CI) | Totals not selected | |
| 3 Catheter removal or replacement Show forest plot | 2 | 139 | Risk Ratio (M‐H, Random, 95% CI) | 0.32 [0.03, 3.06] |
| 4 Technique failure Show forest plot | 2 | 139 | Risk Ratio (M‐H, Random, 95% CI) | 0.64 [0.39, 1.04] |
| 5 Death (all causes) Show forest plot | 2 | 139 | Risk Ratio (M‐H, Random, 95% CI) | 1.02 [0.11, 9.75] |
| 6 Dialysate leak Show forest plot | 2 | 139 | Risk Ratio (M‐H, Random, 95% CI) | 1.04 [0.46, 2.35] |
| Outcome or subgroup title | No. of studies | No. of participants | Statistical method | Effect size |
| 1 Peritonitis Show forest plot | 1 | Risk Ratio (M‐H, Random, 95% CI) | Totals not selected | |
| 2 Peritonitis rate (patient‐months) Show forest plot | 1 | Risk Ratio (M‐H, Random, 95% CI) | Totals not selected | |
| 3 Exit‐site/tunnel infection Show forest plot | 1 | Risk Ratio (M‐H, Random, 95% CI) | Totals not selected | |
| 4 Exit‐site/tunnel infection rate (patient‐month) Show forest plot | 1 | Risk Ratio (M‐H, Random, 95% CI) | Totals not selected | |
| 5 Catheter removal or replacement Show forest plot | 1 | Risk Ratio (M‐H, Random, 95% CI) | Totals not selected | |
| 6 Technique failure Show forest plot | 1 | Risk Ratio (M‐H, Random, 95% CI) | Totals not selected | |
| 7 Death (all causes) Show forest plot | 1 | Risk Ratio (M‐H, Random, 95% CI) | Totals not selected | |
| 8 Dialysate leak Show forest plot | 1 | Risk Ratio (M‐H, Random, 95% CI) | Totals not selected | |
| 9 Postoperative bleed (haematoma or haemoperitoneum) Show forest plot | 1 | Risk Ratio (M‐H, Random, 95% CI) | Totals not selected | |
| Outcome or subgroup title | No. of studies | No. of participants | Statistical method | Effect size |
| 1 Peritonitis Show forest plot | 1 | Risk Ratio (M‐H, Random, 95% CI) | Totals not selected | |
| 2 Exit‐site/tunnel infection Show forest plot | 1 | Risk Ratio (M‐H, Random, 95% CI) | Totals not selected | |
| 3 Catheter removal or replacement Show forest plot | 1 | Risk Ratio (M‐H, Random, 95% CI) | Totals not selected | |
| 4 Dialysate leak Show forest plot | 1 | Risk Ratio (M‐H, Random, 95% CI) | Totals not selected | |
| 5 Postoperative bleed (haematoma or haemoperitoneum) Show forest plot | 1 | Risk Ratio (M‐H, Random, 95% CI) | Totals not selected | |
| Outcome or subgroup title | No. of studies | No. of participants | Statistical method | Effect size |
| 1 Peritonitis Show forest plot | 1 | Risk Ratio (M‐H, Random, 95% CI) | Totals not selected | |
| 2 Exit‐site/tunnel infection Show forest plot | 1 | Risk Ratio (M‐H, Random, 95% CI) | Totals not selected | |
| 3 Death (all causes) Show forest plot | 1 | Risk Ratio (M‐H, Random, 95% CI) | Totals not selected | |
| Outcome or subgroup title | No. of studies | No. of participants | Statistical method | Effect size |
| 1 Peritonitis rate (patient‐month) Show forest plot | 1 | Risk Ratio (M‐H, Random, 95% CI) | Totals not selected | |
| 2 Exit‐site/tunnel infection (patient‐months) Show forest plot | 1 | Risk Ratio (M‐H, Random, 95% CI) | Totals not selected | |
| 3 Catheter removal or replacement Show forest plot | 1 | Risk Ratio (M‐H, Random, 95% CI) | Totals not selected | |
| 4 Death (all causes) Show forest plot | 1 | Risk Ratio (M‐H, Random, 95% CI) | Totals not selected | |
| 5 Dialysate leak Show forest plot | 1 | Risk Ratio (M‐H, Random, 95% CI) | Totals not selected | |
| Outcome or subgroup title | No. of studies | No. of participants | Statistical method | Effect size |
| 1 Peritonitis Show forest plot | 1 | Risk Ratio (M‐H, Random, 95% CI) | Totals not selected | |
| 2 Exit‐site/tunnel infection Show forest plot | 1 | Risk Ratio (M‐H, Random, 95% CI) | Totals not selected | |
| 3 Dialysate leak Show forest plot | 1 | Risk Ratio (M‐H, Random, 95% CI) | Totals not selected | |
| Outcome or subgroup title | No. of studies | No. of participants | Statistical method | Effect size |
| 1 Peritonitis Show forest plot | 1 | Risk Ratio (M‐H, Random, 95% CI) | Totals not selected | |
| 2 Exit‐site infection Show forest plot | 1 | Risk Ratio (M‐H, Random, 95% CI) | Totals not selected | |
| 3 Dialysate leak Show forest plot | 1 | Risk Ratio (M‐H, Random, 95% CI) | Totals not selected | |
| Outcome or subgroup title | No. of studies | No. of participants | Statistical method | Effect size |
| 1 Peritonitis Show forest plot | 1 | Risk Ratio (M‐H, Random, 95% CI) | Totals not selected | |
| 2 Exit‐site/tunnel infection Show forest plot | 1 | Risk Ratio (M‐H, Random, 95% CI) | Totals not selected | |
| 3 Catheter removal or replacement Show forest plot | 1 | Risk Ratio (M‐H, Random, 95% CI) | Totals not selected | |
| 4 Technique failure Show forest plot | 1 | Risk Ratio (M‐H, Random, 95% CI) | Totals not selected | |
| 5 Death (all causes) Show forest plot | 1 | Risk Ratio (M‐H, Random, 95% CI) | Totals not selected | |
| Outcome or subgroup title | No. of studies | No. of participants | Statistical method | Effect size |
| 1 Peritonitis Show forest plot | 1 | Risk Ratio (M‐H, Random, 95% CI) | Totals not selected | |
| 2 Peritonitis rate (patient‐months) Show forest plot | 1 | Risk Ratio (M‐H, Random, 95% CI) | Totals not selected | |
| 3 Exit‐site/tunnel infection Show forest plot | 1 | Risk Ratio (M‐H, Random, 95% CI) | Totals not selected | |
| 4 Exit‐site/tunnel infection (patient‐months) Show forest plot | 1 | Risk Ratio (M‐H, Random, 95% CI) | Totals not selected | |
| 5 Catheter removal or replacement Show forest plot | 1 | Risk Ratio (M‐H, Random, 95% CI) | Totals not selected | |
| 6 Dialysate leak Show forest plot | 1 | Risk Ratio (M‐H, Random, 95% CI) | Totals not selected | |
| Outcome or subgroup title | No. of studies | No. of participants | Statistical method | Effect size |
| 1 Peritonitis Show forest plot | 1 | Risk Ratio (M‐H, Random, 95% CI) | Totals not selected | |
| 2 Peritonitis rate (patient‐months) Show forest plot | 1 | Risk Ratio (M‐H, Random, 95% CI) | Totals not selected | |
| 3 Exit‐site/tunnel infection Show forest plot | 1 | Risk Ratio (M‐H, Random, 95% CI) | Totals not selected | |
| 4 Exit‐site/tunnel infection rate (patient‐months) Show forest plot | 1 | Risk Ratio (M‐H, Random, 95% CI) | Totals not selected | |
| 5 Technique failure Show forest plot | 1 | Risk Ratio (M‐H, Random, 95% CI) | Totals not selected | |
| 6 Dialysate leak Show forest plot | 1 | Risk Ratio (M‐H, Random, 95% CI) | Totals not selected | |
| Outcome or subgroup title | No. of studies | No. of participants | Statistical method | Effect size |
| 1 Peritonitis Show forest plot | 1 | Risk Ratio (M‐H, Random, 95% CI) | Totals not selected | |
| 2 Exit‐site/tunnel infection Show forest plot | 1 | Risk Ratio (M‐H, Random, 95% CI) | Totals not selected | |
| 3 Catheter removal or replacement Show forest plot | 1 | Risk Ratio (M‐H, Random, 95% CI) | Totals not selected | |
| 4 Death (all causes) Show forest plot | 1 | Risk Ratio (M‐H, Random, 95% CI) | Totals not selected | |
| Outcome or subgroup title | No. of studies | No. of participants | Statistical method | Effect size |
| 1 Peritonitis Show forest plot | 1 | Risk Ratio (M‐H, Random, 95% CI) | Totals not selected | |
| 2 Exit‐site/tunnel infection Show forest plot | 1 | Risk Ratio (M‐H, Random, 95% CI) | Totals not selected | |
| 3 Technique failure Show forest plot | 1 | Risk Ratio (M‐H, Random, 95% CI) | Totals not selected | |
| 4 Death (all causes) Show forest plot | 1 | Risk Ratio (M‐H, Random, 95% CI) | Totals not selected | |