Tipo de catéter y técnicas de colocación e inserción para la prevención de infecciones relacionadas con el catéter en pacientes en diálisis peritoneal crónica
Referencias
Referencias de los estudios incluidos en esta revisión
Referencias de los estudios excluidos de esta revisión
Referencias de los estudios en espera de evaluación
Referencias de los estudios en curso
Referencias adicionales
Referencias de otras versiones publicadas de esta revisión
Characteristics of studies
Characteristics of included studies [ordered by study ID]
| Methods |
| |
| Participants |
| |
| Interventions | Treatment group
Control group
| |
| Outcomes |
| |
| Notes |
| |
| Risk of bias | ||
| Bias | Authors' judgement | Support for judgement |
| Random sequence generation (selection bias) | Unclear risk | Insufficient information to permit judgement |
| Allocation concealment (selection bias) | Unclear risk | Insufficient information to permit judgement |
| Blinding of participants and personnel (performance bias) | Unclear risk | Insufficient information to permit judgement |
| Blinding of outcome assessment (detection bias) | Unclear risk | Insufficient information to permit judgement |
| Incomplete outcome data (attrition bias) | Unclear risk | Insufficient information to permit judgement |
| Selective reporting (reporting bias) | High risk | Not all the outcomes were reported |
| Other bias | Unclear risk | Insufficient information to permit judgement |
| Methods |
| |
| Participants |
| |
| Interventions | Treatment group
Control group
Other information
| |
| Outcomes |
| |
| Notes |
| |
| Risk of bias | ||
| Bias | Authors' judgement | Support for judgement |
| Random sequence generation (selection bias) | Unclear risk | Insufficient information to permit judgement |
| Allocation concealment (selection bias) | Unclear risk | Insufficient information to permit judgement |
| Blinding of participants and personnel (performance bias) | Low risk | Quote " Neither the patients nor the staff supervising their care thereafter were aware of the type of catheter used." |
| Blinding of outcome assessment (detection bias) | Unclear risk | Not blinded |
| Incomplete outcome data (attrition bias) | Low risk | 5% dropout (2/40) |
| Selective reporting (reporting bias) | High risk | Not all the outcomes were reported |
| Other bias | Unclear risk | Insufficient information to permit judgement |
| Methods |
| |
| Participants |
| |
| Interventions | Treatment group
Control group
Other information
| |
| Outcomes |
| |
| Notes |
| |
| Risk of bias | ||
| Bias | Authors' judgement | Support for judgement |
| Random sequence generation (selection bias) | Unclear risk | Randomised using adaptive randomisation method |
| Allocation concealment (selection bias) | Unclear risk | Insufficient information to permit judgement |
| Blinding of participants and personnel (performance bias) | Unclear risk | Insufficient information to permit judgement |
| Blinding of outcome assessment (detection bias) | Unclear risk | Insufficient information to permit judgement |
| Incomplete outcome data (attrition bias) | Low risk | No dropouts |
| Selective reporting (reporting bias) | Low risk | Most outcomes were reported |
| Other bias | Unclear risk | Insufficient information to permit judgement |
| Methods |
| |
| Participants |
| |
| Interventions | Treatment group
Control group
| |
| Outcomes |
| |
| Notes |
| |
| Risk of bias | ||
| Bias | Authors' judgement | Support for judgement |
| Random sequence generation (selection bias) | Low risk | Random allocation software |
| Allocation concealment (selection bias) | Low risk | Random allocation software |
| Blinding of participants and personnel (performance bias) | Unclear risk | Insufficient information to permit judgement |
| Blinding of outcome assessment (detection bias) | Unclear risk | Insufficient information to permit judgement |
| Incomplete outcome data (attrition bias) | Low risk | No dropouts |
| Selective reporting (reporting bias) | High risk | The incidence of infection was reported for the first two weeks only, did not report infection at the end of study |
| Other bias | Unclear risk | No information was provided for who performed the procedures for both groups |
| Methods |
| |
| Participants |
| |
| Interventions | Treatment group
Control group
| |
| Outcomes |
| |
| Notes |
| |
| Risk of bias | ||
| Bias | Authors' judgement | Support for judgement |
| Random sequence generation (selection bias) | Unclear risk | Insufficient information to permit judgement |
| Allocation concealment (selection bias) | Unclear risk | Insufficient information to permit judgement |
| Blinding of participants and personnel (performance bias) | Unclear risk | Insufficient information to permit judgement |
| Blinding of outcome assessment (detection bias) | Unclear risk | Insufficient information to permit judgement |
| Incomplete outcome data (attrition bias) | Unclear risk | Insufficient information to permit judgement |
| Selective reporting (reporting bias) | High risk | Not all the outcomes were reported |
| Other bias | Unclear risk | Insufficient information to permit judgement |
| Methods |
| |
| Participants |
| |
| Interventions | Treatment group
Control group
| |
| Outcomes |
| |
| Notes |
| |
| Risk of bias | ||
| Bias | Authors' judgement | Support for judgement |
| Random sequence generation (selection bias) | Unclear risk | Insufficient information to permit judgement |
| Allocation concealment (selection bias) | Unclear risk | Insufficient information to permit judgement |
| Blinding of participants and personnel (performance bias) | Unclear risk | Insufficient information to permit judgement |
| Blinding of outcome assessment (detection bias) | Unclear risk | Insufficient information to permit judgement |
| Incomplete outcome data (attrition bias) | Low risk | No dropouts |
| Selective reporting (reporting bias) | Low risk | All the outcomes are reported |
| Other bias | High risk | Assessment of presence of greater omentum was only possible during operation hence it is unclear randomisation was occurred after surgical incision was made |
| Methods |
| |
| Participants |
| |
| Interventions | Treatment group
Control group
Other information
| |
| Outcomes |
| |
| Notes |
| |
| Risk of bias | ||
| Bias | Authors' judgement | Support for judgement |
| Random sequence generation (selection bias) | Unclear risk | Insufficient information to permit judgement |
| Allocation concealment (selection bias) | Unclear risk | Insufficient information to permit judgement |
| Blinding of participants and personnel (performance bias) | Unclear risk | Not blinded |
| Blinding of outcome assessment (detection bias) | Unclear risk | Not blinded |
| Incomplete outcome data (attrition bias) | Low risk | 1.5% dropout (1/60) |
| Selective reporting (reporting bias) | Low risk | Most outcomes were reported |
| Other bias | Unclear risk | Insufficient information to permit judgement |
| Methods |
| |
| Participants |
| |
| Interventions | Treatment group
Control group
| |
| Outcomes |
| |
| Notes |
| |
| Risk of bias | ||
| Bias | Authors' judgement | Support for judgement |
| Random sequence generation (selection bias) | Unclear risk | Insufficient information to permit judgement |
| Allocation concealment (selection bias) | Unclear risk | Insufficient information to permit judgement |
| Blinding of participants and personnel (performance bias) | Unclear risk | Insufficient information to permit judgement |
| Blinding of outcome assessment (detection bias) | Unclear risk | Insufficient information to permit judgement |
| Incomplete outcome data (attrition bias) | Unclear risk | Insufficient information to permit judgement |
| Selective reporting (reporting bias) | High risk | Reported few outcomes |
| Other bias | Unclear risk | Insufficient information to permit judgement |
| Methods |
| |
| Participants |
| |
| Interventions | Treatment group
Control group
Other information
| |
| Outcomes |
| |
| Notes |
| |
| Risk of bias | ||
| Bias | Authors' judgement | Support for judgement |
| Random sequence generation (selection bias) | Unclear risk | Insufficient information to permit judgement |
| Allocation concealment (selection bias) | Unclear risk | Insufficient information to permit judgement |
| Blinding of participants and personnel (performance bias) | Unclear risk | Not blinded |
| Blinding of outcome assessment (detection bias) | Unclear risk | Not blinded |
| Incomplete outcome data (attrition bias) | Low risk | No dropouts |
| Selective reporting (reporting bias) | Low risk | Most outcomes were reported |
| Other bias | Unclear risk | Insufficient information to permit judgement |
| Methods |
| |
| Participants |
| |
| Interventions | Treatment group
Control group
Other information
| |
| Outcomes |
| |
| Notes |
| |
| Risk of bias | ||
| Bias | Authors' judgement | Support for judgement |
| Random sequence generation (selection bias) | Unclear risk | Insufficient information to permit judgement |
| Allocation concealment (selection bias) | Low risk | Sequentially numbered sealed envelopes containing catheter configurations in random order |
| Blinding of participants and personnel (performance bias) | Low risk | Blinded |
| Blinding of outcome assessment (detection bias) | Unclear risk | Not blinded |
| Incomplete outcome data (attrition bias) | Low risk | No dropouts |
| Selective reporting (reporting bias) | Low risk | All outcomes were reported |
| Other bias | High risk | Definition of peritonitis was different from the ISPD guidelines |
| Methods |
| |
| Participants |
| |
| Interventions | Treatment group
Control group
Other information
| |
| Outcomes |
| |
| Notes |
| |
| Risk of bias | ||
| Bias | Authors' judgement | Support for judgement |
| Random sequence generation (selection bias) | Unclear risk | Insufficient information to permit judgement |
| Allocation concealment (selection bias) | Low risk | Sequentially numbered sealed envelopes containing catheter configurations in random order |
| Blinding of participants and personnel (performance bias) | Low risk | Blinded |
| Blinding of outcome assessment (detection bias) | Unclear risk | Not blinded |
| Incomplete outcome data (attrition bias) | High risk | High dropout (14/40, transferred to HD or death) |
| Selective reporting (reporting bias) | Low risk | All outcomes were reported |
| Other bias | Unclear risk | Insufficient information to permit judgement |
| Methods |
| |
| Participants |
| |
| Interventions | Treatment group
Control group
Other information
| |
| Outcomes |
| |
| Notes |
| |
| Risk of bias | ||
| Bias | Authors' judgement | Support for judgement |
| Random sequence generation (selection bias) | Unclear risk | Insufficient information to permit judgement |
| Allocation concealment (selection bias) | Low risk | Sealed envelopes |
| Blinding of participants and personnel (performance bias) | Unclear risk | Not blinded |
| Blinding of outcome assessment (detection bias) | Unclear risk | Not blinded |
| Incomplete outcome data (attrition bias) | Low risk | No dropouts |
| Selective reporting (reporting bias) | Low risk | Unclear, unable to totally exclude reporting bias |
| Other bias | Unclear risk | Insufficient information to permit judgement |
| Methods |
| |
| Participants |
| |
| Interventions | Treatment group
Control group
Other information
| |
| Outcomes |
| |
| Notes |
| |
| Risk of bias | ||
| Bias | Authors' judgement | Support for judgement |
| Random sequence generation (selection bias) | High risk | Randomisation method was by alternate months, quasi‐RCT |
| Allocation concealment (selection bias) | High risk | Alternate months |
| Blinding of participants and personnel (performance bias) | Unclear risk | Not blinded |
| Blinding of outcome assessment (detection bias) | Unclear risk | Not blinded |
| Incomplete outcome data (attrition bias) | Low risk | 3% dropout (5/148) |
| Selective reporting (reporting bias) | Low risk | All outcomes were reported |
| Other bias | Unclear risk | Insufficient information to permit judgement |
| Methods |
| |
| Participants |
| |
| Interventions | Treatment group
Control group
| |
| Outcomes |
| |
| Notes |
| |
| Risk of bias | ||
| Bias | Authors' judgement | Support for judgement |
| Random sequence generation (selection bias) | Low risk | Computer‐generated random number list with randomisation blocks of 20 |
| Allocation concealment (selection bias) | Low risk | Random number with randomisation blocks of 20 |
| Blinding of participants and personnel (performance bias) | Unclear risk | Insufficient information to permit judgement |
| Blinding of outcome assessment (detection bias) | Unclear risk | Insufficient information to permit judgement |
| Incomplete outcome data (attrition bias) | Low risk | No dropouts |
| Selective reporting (reporting bias) | Low risk | Low risk, most outcomes were reported |
| Other bias | High risk | Unequal baseline characteristics |
| Methods |
| |
| Participants |
| |
| Interventions | Treatment group
Control group
| |
| Outcomes |
| |
| Notes |
| |
| Risk of bias | ||
| Bias | Authors' judgement | Support for judgement |
| Random sequence generation (selection bias) | High risk | Insufficient information to permit judgement, significantly high number of cirrhosis patients in laparoscopic group |
| Allocation concealment (selection bias) | Unclear risk | Insufficient information to permit judgement |
| Blinding of participants and personnel (performance bias) | Unclear risk | Insufficient information to permit judgement |
| Blinding of outcome assessment (detection bias) | Unclear risk | Insufficient information to permit judgement |
| Incomplete outcome data (attrition bias) | Low risk | No loss of follow‐up |
| Selective reporting (reporting bias) | Low risk | All the outcomes were reported |
| Other bias | High risk | Different baseline characteristic between the two groups |
| Methods |
| |
| Participants |
| |
| Interventions | Treatment group
Control group
| |
| Outcomes |
| |
| Notes |
| |
| Risk of bias | ||
| Bias | Authors' judgement | Support for judgement |
| Random sequence generation (selection bias) | Low risk | Computer‐generated randomising chart |
| Allocation concealment (selection bias) | Unclear risk | Insufficient information to permit judgement |
| Blinding of participants and personnel (performance bias) | Unclear risk | Insufficient information to permit judgement |
| Blinding of outcome assessment (detection bias) | Unclear risk | Insufficient information to permit judgement |
| Incomplete outcome data (attrition bias) | Low risk | All patients were followed up and analysed |
| Selective reporting (reporting bias) | Low risk | All outcomes were reported |
| Other bias | High risk | Procedures were performed by 3 nephrologists; the study was terminated earlier than planned as they ran out of catheters |
| Methods |
| |
| Participants |
| |
| Interventions | Treatment group 1
Treatment group 2
Control group
Other information
| |
| Outcomes |
| |
| Notes |
| |
| Risk of bias | ||
| Bias | Authors' judgement | Support for judgement |
| Random sequence generation (selection bias) | Unclear risk | Insufficient information to permit judgement |
| Allocation concealment (selection bias) | Unclear risk | Insufficient information to permit judgement |
| Blinding of participants and personnel (performance bias) | Unclear risk | Insufficient information to permit judgement |
| Blinding of outcome assessment (detection bias) | Unclear risk | Insufficient information to permit judgement |
| Incomplete outcome data (attrition bias) | Low risk | No loss to follow‐up |
| Selective reporting (reporting bias) | High risk | Not all of the outcomes were reported |
| Other bias | Unclear risk | Despite calculate power before the study, no significant difference in the outcomes was observed after complete the recruitment and finally the number of recruitment was increased by 50% |
| Methods |
| |
| Participants |
| |
| Interventions | Treatment group
Control group
Other information
| |
| Outcomes |
| |
| Notes |
| |
| Risk of bias | ||
| Bias | Authors' judgement | Support for judgement |
| Random sequence generation (selection bias) | High risk | Alternate randomisation |
| Allocation concealment (selection bias) | High risk | Alternate randomisation |
| Blinding of participants and personnel (performance bias) | High risk | Not blinded |
| Blinding of outcome assessment (detection bias) | Unclear risk | Insufficient information to permit judgement |
| Incomplete outcome data (attrition bias) | Low risk | 7% lost to follow‐up (3/40) |
| Selective reporting (reporting bias) | High risk | Not all the outcomes were reported |
| Other bias | Unclear risk | Insufficient information to permit judgement |
| Methods |
| |
| Participants |
| |
| Interventions | Treatment group
Control group
| |
| Outcomes |
| |
| Notes |
| |
| Risk of bias | ||
| Bias | Authors' judgement | Support for judgement |
| Random sequence generation (selection bias) | Unclear risk | Insufficient information to permit judgement |
| Allocation concealment (selection bias) | Unclear risk | Insufficient information to permit judgement |
| Blinding of participants and personnel (performance bias) | Unclear risk | Insufficient information to permit judgement |
| Blinding of outcome assessment (detection bias) | Unclear risk | Insufficient information to permit judgement |
| Incomplete outcome data (attrition bias) | Low risk | No loss to follow‐up |
| Selective reporting (reporting bias) | Low risk | Study was registered with Iranian Registry of clinical trials |
| Other bias | Unclear risk | Insufficient information to permit judgement |
| Methods |
| |
| Participants |
| |
| Interventions | Treatment group
Control group
| |
| Outcomes |
| |
| Notes |
| |
| Risk of bias | ||
| Bias | Authors' judgement | Support for judgement |
| Random sequence generation (selection bias) | Unclear risk | Insufficient information to permit judgement |
| Allocation concealment (selection bias) | Unclear risk | Insufficient information to permit judgement |
| Blinding of participants and personnel (performance bias) | Unclear risk | Insufficient information to permit judgement |
| Blinding of outcome assessment (detection bias) | Unclear risk | Insufficient information to permit judgement |
| Incomplete outcome data (attrition bias) | Unclear risk | Insufficient information to permit judgement |
| Selective reporting (reporting bias) | High risk | Outcomes were not reported |
| Other bias | Unclear risk | Insufficient information to permit judgement |
| Methods |
| |
| Participants |
| |
| Interventions | Treatment group
Control group
Other information
| |
| Outcomes |
| |
| Notes |
| |
| Risk of bias | ||
| Bias | Authors' judgement | Support for judgement |
| Random sequence generation (selection bias) | Unclear risk | Study described as randomised; method of randomisation not reported |
| Allocation concealment (selection bias) | Low risk | Sequentially number sealed envelopes with catheter type in random order |
| Blinding of participants and personnel (performance bias) | Low risk | Both participants and personnel are blinded |
| Blinding of outcome assessment (detection bias) | Unclear risk | Insufficient information to permit judgement |
| Incomplete outcome data (attrition bias) | High risk | High dropout rate (32/72) |
| Selective reporting (reporting bias) | High risk | Not all the outcomes were reported |
| Other bias | Unclear risk | Insufficient information to permit judgement |
| Methods |
| |
| Participants |
| |
| Interventions | Treatment group
Control group
Other information
| |
| Outcomes |
| |
| Notes |
| |
| Risk of bias | ||
| Bias | Authors' judgement | Support for judgement |
| Random sequence generation (selection bias) | Unclear risk | Insufficient information to permit judgement |
| Allocation concealment (selection bias) | Unclear risk | Insufficient information to permit judgement |
| Blinding of participants and personnel (performance bias) | Unclear risk | Insufficient information to permit judgement |
| Blinding of outcome assessment (detection bias) | Unclear risk | Insufficient information to permit judgement |
| Incomplete outcome data (attrition bias) | High risk | 22% dropout (43/189) |
| Selective reporting (reporting bias) | Low risk | All the outcomes were reported |
| Other bias | Unclear risk | Insufficient information to permit judgement |
| Methods |
| |
| Participants |
| |
| Interventions | Treatment group
Control group
Other information
| |
| Outcomes |
| |
| Notes |
| |
| Risk of bias | ||
| Bias | Authors' judgement | Support for judgement |
| Random sequence generation (selection bias) | Unclear risk | Insufficient information to permit judgement |
| Allocation concealment (selection bias) | Unclear risk | Insufficient information to permit judgement |
| Blinding of participants and personnel (performance bias) | High risk | Not blinded |
| Blinding of outcome assessment (detection bias) | High risk | Not blinded |
| Incomplete outcome data (attrition bias) | Low risk | 2% dropout (1/60) |
| Selective reporting (reporting bias) | High risk | Not all the outcomes were reported |
| Other bias | Unclear risk | Insufficient information to permit judgement |
| Methods |
| |
| Participants |
| |
| Interventions | Treatment group
Control group
| |
| Outcomes |
| |
| Notes |
| |
| Risk of bias | ||
| Bias | Authors' judgement | Support for judgement |
| Random sequence generation (selection bias) | Unclear risk | Insufficient information to permit judgement |
| Allocation concealment (selection bias) | Unclear risk | Insufficient information to permit judgement |
| Blinding of participants and personnel (performance bias) | Unclear risk | Insufficient information to permit judgement |
| Blinding of outcome assessment (detection bias) | Unclear risk | Insufficient information to permit judgement |
| Incomplete outcome data (attrition bias) | Unclear risk | Insufficient information to permit judgement |
| Selective reporting (reporting bias) | High risk | Not all the outcomes were reported |
| Other bias | Unclear risk | Insufficient information to permit judgement |
| Methods |
| |
| Participants |
| |
| Interventions | Treatment group (groups 1 and 3)
Control group (groups 2 and 4)
Other information
| |
| Outcomes |
| |
| Notes |
| |
| Risk of bias | ||
| Bias | Authors' judgement | Support for judgement |
| Random sequence generation (selection bias) | Unclear risk | Insufficient information to permit judgement |
| Allocation concealment (selection bias) | Unclear risk | Insufficient information to permit judgement |
| Blinding of participants and personnel (performance bias) | High risk | Not blinded |
| Blinding of outcome assessment (detection bias) | High risk | Not blinded |
| Incomplete outcome data (attrition bias) | Unclear risk | Insufficient information to permit judgement |
| Selective reporting (reporting bias) | High risk | Not all the outcomes were reported |
| Other bias | High risk | Introduced new type of catheter and new catheter insertion technique at the same time for the treatment group |
| Methods |
| |
| Participants |
| |
| Interventions | Treatment group
Control group
| |
| Outcomes |
| |
| Notes |
| |
| Risk of bias | ||
| Bias | Authors' judgement | Support for judgement |
| Random sequence generation (selection bias) | Unclear risk | Insufficient information to permit judgement |
| Allocation concealment (selection bias) | Unclear risk | Insufficient information to permit judgement |
| Blinding of participants and personnel (performance bias) | Unclear risk | Insufficient information to permit judgement |
| Blinding of outcome assessment (detection bias) | Unclear risk | Insufficient information to permit judgement |
| Incomplete outcome data (attrition bias) | Unclear risk | Insufficient information to permit judgement |
| Selective reporting (reporting bias) | High risk | Some of outcomes were not reported |
| Other bias | High risk | Different baseline characteristics; BMI significantly higher in the control group |
| Methods |
| |
| Participants |
| |
| Interventions | Treatment group
Control group 1
Control group 2
Other information
| |
| Outcomes |
| |
| Notes |
| |
| Risk of bias | ||
| Bias | Authors' judgement | Support for judgement |
| Random sequence generation (selection bias) | Unclear risk | Insufficient information to permit judgement |
| Allocation concealment (selection bias) | Unclear risk | Insufficient information to permit judgement |
| Blinding of participants and personnel (performance bias) | Unclear risk | Insufficient information to permit judgement |
| Blinding of outcome assessment (detection bias) | Unclear risk | Insufficient information to permit judgement |
| Incomplete outcome data (attrition bias) | Unclear risk | Insufficient information to permit judgement, unclear |
| Selective reporting (reporting bias) | High risk | Not all the outcomes of interest were reported |
| Other bias | Unclear risk | Insufficient information to permit judgement |
| Methods |
| |
| Participants |
| |
| Interventions | Treatment group
Control group
| |
| Outcomes |
| |
| Notes |
| |
| Risk of bias | ||
| Bias | Authors' judgement | Support for judgement |
| Random sequence generation (selection bias) | Unclear risk | Insufficient information to permit judgement |
| Allocation concealment (selection bias) | Unclear risk | Insufficient information to permit judgement |
| Blinding of participants and personnel (performance bias) | High risk | Not blinded |
| Blinding of outcome assessment (detection bias) | Unclear risk | Insufficient information to permit judgement |
| Incomplete outcome data (attrition bias) | High risk | High dropout 30% (59/195) |
| Selective reporting (reporting bias) | Low risk | Most of the outcomes were reported |
| Other bias | Unclear risk | Insufficient information to permit judgement |
| Methods |
| |
| Participants |
| |
| Interventions | Treatment group
Control group
| |
| Outcomes |
| |
| Notes |
| |
| Risk of bias | ||
| Bias | Authors' judgement | Support for judgement |
| Random sequence generation (selection bias) | Unclear risk | Insufficient information to permit judgement |
| Allocation concealment (selection bias) | Unclear risk | Insufficient information to permit judgement |
| Blinding of participants and personnel (performance bias) | Unclear risk | Insufficient information to permit judgement |
| Blinding of outcome assessment (detection bias) | Unclear risk | Insufficient information to permit judgement |
| Incomplete outcome data (attrition bias) | Low risk | No dropouts |
| Selective reporting (reporting bias) | High risk | Few outcomes were reported |
| Other bias | Unclear risk | Insufficient information to permit judgement |
| Methods |
| |
| Participants |
| |
| Interventions | Treatment group
Control group
| |
| Outcomes |
| |
| Notes |
| |
| Risk of bias | ||
| Bias | Authors' judgement | Support for judgement |
| Random sequence generation (selection bias) | Unclear risk | Quote: "A peritoneal dialysis nurse made randomization from envelopes and provided the surgeon with the respective catheter" |
| Allocation concealment (selection bias) | Unclear risk | Quote: "A peritoneal dialysis nurse made randomization from envelopes and provided the surgeon with the respective catheter" |
| Blinding of participants and personnel (performance bias) | Unclear risk | Insufficient information to permit judgement |
| Blinding of outcome assessment (detection bias) | Unclear risk | Insufficient information to permit judgement |
| Incomplete outcome data (attrition bias) | High risk | High dropout; loss to follow‐up: died (7/61), transfer to HD (20/61), transplant (15/61) |
| Selective reporting (reporting bias) | High risk | Not all the outcomes were reported |
| Other bias | Unclear risk | Significantly large number of patients from treatment group dropped out due to transplant |
| Methods |
| |
| Participants |
| |
| Interventions | Treatment group
Control group
| |
| Outcomes |
| |
| Notes |
| |
| Risk of bias | ||
| Bias | Authors' judgement | Support for judgement |
| Random sequence generation (selection bias) | Unclear risk | Insufficient information to permit judgement |
| Allocation concealment (selection bias) | Unclear risk | Insufficient information to permit judgement |
| Blinding of participants and personnel (performance bias) | Unclear risk | Insufficient information to permit judgement |
| Blinding of outcome assessment (detection bias) | Unclear risk | Insufficient information to permit judgement |
| Incomplete outcome data (attrition bias) | Low risk | Low dropout rate |
| Selective reporting (reporting bias) | High risk | Not all the outcomes were reported |
| Other bias | Unclear risk | Insufficient information to permit judgement |
| Methods |
| |
| Participants |
| |
| Interventions | Treatment group 1
Treatment group 2
Control group
| |
| Outcomes |
| |
| Notes |
| |
| Risk of bias | ||
| Bias | Authors' judgement | Support for judgement |
| Random sequence generation (selection bias) | Low risk | Randomisation sequence was generated using STATA software (permuted block) |
| Allocation concealment (selection bias) | Low risk | Sealed envelopes |
| Blinding of participants and personnel (performance bias) | High risk | Not blinded |
| Blinding of outcome assessment (detection bias) | High risk | Not blinded |
| Incomplete outcome data (attrition bias) | Low risk | No dropout |
| Selective reporting (reporting bias) | Low risk | Published protocol before study |
| Other bias | High risk | Protocol violation present |
| Methods |
| |
| Participants |
| |
| Interventions | Treatment group
Control group
| |
| Outcomes |
| |
| Notes |
| |
| Risk of bias | ||
| Bias | Authors' judgement | Support for judgement |
| Random sequence generation (selection bias) | Unclear risk | Insufficient information to permit judgement |
| Allocation concealment (selection bias) | Unclear risk | Insufficient information to permit judgement |
| Blinding of participants and personnel (performance bias) | Low risk | Double blinded |
| Blinding of outcome assessment (detection bias) | Unclear risk | Insufficient information to permit judgement |
| Incomplete outcome data (attrition bias) | Unclear risk | Insufficient information to permit judgement |
| Selective reporting (reporting bias) | Low risk | Most of the outcomes of interest were reported |
| Other bias | Unclear risk | Insufficient information to permit judgement |
| Methods |
| |
| Participants |
| |
| Interventions | Treatment group
Control group
| |
| Outcomes |
| |
| Notes |
| |
| Risk of bias | ||
| Bias | Authors' judgement | Support for judgement |
| Random sequence generation (selection bias) | Unclear risk | Insufficient information to permit judgement |
| Allocation concealment (selection bias) | Low risk | Quote: "Closed envelope contained information regarding placement into group A or B" |
| Blinding of participants and personnel (performance bias) | High risk | Not blinded |
| Blinding of outcome assessment (detection bias) | High risk | Not blinded |
| Incomplete outcome data (attrition bias) | Low risk | 10% dropout (5/50) |
| Selective reporting (reporting bias) | High risk | Not all the outcomes of interest were reported |
| Other bias | Unclear risk | Insufficient information to permit judgement |
| Methods |
| |
| Participants |
| |
| Interventions | Treatment group 1
Treatment group 2
Control group
| |
| Outcomes |
| |
| Notes |
| |
| Risk of bias | ||
| Bias | Authors' judgement | Support for judgement |
| Random sequence generation (selection bias) | Unclear risk | Insufficient information to permit judgement |
| Allocation concealment (selection bias) | Unclear risk | Insufficient information to permit judgement |
| Blinding of participants and personnel (performance bias) | High risk | Not blinded |
| Blinding of outcome assessment (detection bias) | Unclear risk | Insufficient information to permit judgement |
| Incomplete outcome data (attrition bias) | Unclear risk | Insufficient information to permit judgement |
| Selective reporting (reporting bias) | High risk | Not all the outcomes were reported |
| Other bias | Unclear risk | Insufficient information to permit judgement |
| Methods |
| |
| Participants |
| |
| Interventions | Treatment group
Control group
| |
| Outcomes |
| |
| Notes |
| |
| Risk of bias | ||
| Bias | Authors' judgement | Support for judgement |
| Random sequence generation (selection bias) | Low risk | Quote "allocated by simple randomization... performed by the research staff not involved with the care of the subjects" |
| Allocation concealment (selection bias) | Low risk | Sequentially numbered opaque, sealed envelopes |
| Blinding of participants and personnel (performance bias) | High risk | Not blinded |
| Blinding of outcome assessment (detection bias) | High risk | Not blinded |
| Incomplete outcome data (attrition bias) | Low risk | No dropouts |
| Selective reporting (reporting bias) | Low risk | Not all the outcomes were reported |
| Other bias | Unclear risk | Insufficient information to permit judgement |
| Methods |
| |
| Participants |
| |
| Interventions | Treatment group
Control group
| |
| Outcomes |
| |
| Notes |
| |
| Risk of bias | ||
| Bias | Authors' judgement | Support for judgement |
| Random sequence generation (selection bias) | Unclear risk | Insufficient information to permit judgement |
| Allocation concealment (selection bias) | Unclear risk | Insufficient information to permit judgement |
| Blinding of participants and personnel (performance bias) | Unclear risk | Insufficient information to permit judgement |
| Blinding of outcome assessment (detection bias) | Unclear risk | Insufficient information to permit judgement |
| Incomplete outcome data (attrition bias) | High risk | High dropout (8/22) |
| Selective reporting (reporting bias) | Low risk | Reported most of outcomes |
| Other bias | Unclear risk | Insufficient information to permit judgement |
| Methods |
| |
| Participants |
| |
| Interventions | Treatment group
Control group
Other information
| |
| Outcomes |
| |
| Notes |
| |
| Risk of bias | ||
| Bias | Authors' judgement | Support for judgement |
| Random sequence generation (selection bias) | Unclear risk | Insufficient information to permit judgement |
| Allocation concealment (selection bias) | Low risk | "Sealed enveloped containing cards with 'laparoscopic" or "conventional". Cards stored in theatre anaesthetic room and one envelope opened after each patient was anaesthetized" |
| Blinding of participants and personnel (performance bias) | Low risk | Blinded |
| Blinding of outcome assessment (detection bias) | Unclear risk | Insufficient information to permit judgement |
| Incomplete outcome data (attrition bias) | Unclear risk | Low dropout rate (5/50) |
| Selective reporting (reporting bias) | Low risk | Most outcomes were reported |
| Other bias | Unclear risk | Insufficient information to permit judgement |
| Methods |
| |
| Participants |
| |
| Interventions | Treatment group
Control group
| |
| Outcomes |
| |
| Notes |
| |
| Risk of bias | ||
| Bias | Authors' judgement | Support for judgement |
| Random sequence generation (selection bias) | Low risk | Computer generated random numbers |
| Allocation concealment (selection bias) | Low risk | "Randomization was performed using sequentially numbered opaque sealed envelopes" |
| Blinding of participants and personnel (performance bias) | Unclear risk | Insufficient information to permit judgement |
| Blinding of outcome assessment (detection bias) | Unclear risk | Insufficient information to permit judgement |
| Incomplete outcome data (attrition bias) | Low risk | Low dropout (1/80) |
| Selective reporting (reporting bias) | High risk | Not all the outcomes were reported |
| Other bias | Unclear risk | Insufficient information to permit judgement |
| Methods |
| |
| Participants |
| |
| Interventions | Treatment group
Control group
| |
| Outcomes |
| |
| Notes |
| |
| Risk of bias | ||
| Bias | Authors' judgement | Support for judgement |
| Random sequence generation (selection bias) | Unclear risk | Insufficient information to permit judgement |
| Allocation concealment (selection bias) | Unclear risk | Insufficient information to permit judgement |
| Blinding of participants and personnel (performance bias) | High risk | Not blinded |
| Blinding of outcome assessment (detection bias) | High risk | Not blinded |
| Incomplete outcome data (attrition bias) | Low risk | Low dropout rate (6/101) |
| Selective reporting (reporting bias) | Low risk | All the outcomes were reported |
| Other bias | Unclear risk | No prophylactic antibiotic for exit site. The study reported the procedures were performed by trained nephrologists in the unit, but unclear about the grade and training experience of the procedurists |
| Methods |
| |
| Participants |
| |
| Interventions | Treatment group 1
Treatment group 2
Control group
| |
| Outcomes |
| |
| Notes |
| |
| Risk of bias | ||
| Bias | Authors' judgement | Support for judgement |
| Random sequence generation (selection bias) | Low risk | Computer‐generated random number table |
| Allocation concealment (selection bias) | Unclear risk | Insufficient information to permit judgement |
| Blinding of participants and personnel (performance bias) | Unclear risk | Insufficient information to permit judgement |
| Blinding of outcome assessment (detection bias) | Unclear risk | Insufficient information to permit judgement |
| Incomplete outcome data (attrition bias) | Low risk | No dropouts |
| Selective reporting (reporting bias) | Low risk | All the outcomes were reported |
| Other bias | High risk | Percentage of patients with pervious abdominal surgery was appear to be higher than the other two modified surgery group (20.4% versus 10.2% and 13.0%) |
| Methods |
| |
| Participants |
| |
| Interventions | Treatment group
Control group
| |
| Outcomes |
| |
| Notes |
| |
| Risk of bias | ||
| Bias | Authors' judgement | Support for judgement |
| Random sequence generation (selection bias) | Unclear risk | Insufficient information to permit judgement |
| Allocation concealment (selection bias) | Unclear risk | Quote: "Randomization was done on the day of intervention using the closed envelope method" |
| Blinding of participants and personnel (performance bias) | Unclear risk | Insufficient information to permit judgement |
| Blinding of outcome assessment (detection bias) | Unclear risk | Insufficient information to permit judgement |
| Incomplete outcome data (attrition bias) | Unclear risk | Insufficient information to permit judgement |
| Selective reporting (reporting bias) | Low risk | All the outcomes were reported |
| Other bias | High risk | Unequal baseline characteristics between groups, significantly more patients in the treatment had history of abdominal surgery |
AKI ‐ acute kidney injury; APD ‐ automated peritoneal dialysis; BMI ‐ body mass index; CAD ‐ coronary artery disease; CAPD ‐ continuous ambulatory peritoneal dialysis; CKD ‐ chronic kidney disease; COPD ‐ chronic obstructive pulmonary disease; ESKD ‐ end‐stage kidney disease; HD ‐ haemodialysis; HIV ‐ human immunodeficiency virus; IQR ‐ interquartile range; IPD ‐ intermittent peritoneal dialysis; IV ‐ intravenous; M/F ‐ male/female; MI ‐ myocardial infarction; PD ‐ peritoneal dialysis; PKD ‐ polycystic kidney disease; RCT ‐ randomised controlled trial; RRT ‐ renal replacement therapy; WCC ‐ white cell count
Characteristics of excluded studies [ordered by study ID]
| Study | Reason for exclusion |
| Issues with randomisation: 5 patients entered the study twice, another 5 patients were not randomised | |
| Study terminated due to recruitment issues | |
| Study terminated for incomplete recruitment | |
| Unable to obtain sufficient information on the study type, populations or interventions to determine if the study meets all the review criteria | |
| Wrong intervention: compared two types of tunnelled HD catheters | |
| Wrong intervention: compared different methods of therapy for peritonitis |
HD ‐ haemodialysis
Characteristics of studies awaiting assessment [ordered by study ID]
| Methods |
|
| Participants |
|
| Interventions | Treatment group
Control group
|
| Outcomes |
|
| Notes |
|
| Methods |
|
| Participants |
|
| Interventions | Treatment group
Control group
|
| Outcomes |
|
| Notes |
|
| Methods |
|
| Participants |
|
| Interventions | Treatment group
Control group
|
| Outcomes |
|
| Notes |
|
PD ‐ peritoneal dialysis; QoL ‐ quality of life; RCT ‐ randomised controlled trial
Characteristics of ongoing studies [ordered by study ID]
| Trial name or title | A prospective randomized controlled trial of local anaesthetic percutaneous insertion versus general anaesthetic open surgical placement of continuous peritoneal dialysis catheters in a university teaching hospital |
| Methods |
|
| Participants | Inclusion criteria
Exclusion criteria
|
| Interventions | Treatment group
Control group
|
| Outcomes |
|
| Starting date | December 2011 |
| Contact information | Contact: Ian C Chetter, MB ChB |
| Notes |
| Trial name or title | Randomized controlled trial of straight versus coiled peritoneal dialysis |
| Methods |
|
| Participants | Inclusion criteria
Exclusion criteria
|
| Interventions | Treatment group
Control group
|
| Outcomes |
|
| Starting date | June 2015 |
| Contact information | Kai Ming Chow, MBChB, FRCP |
| Notes |
PD ‐ peritoneal dialysis; RCT ‐ randomised controlled trial
Data and analyses
| Outcome or subgroup title | No. of studies | No. of participants | Statistical method | Effect size |
| 1 Peritonitis Show forest plot | 4 | 315 | Risk Ratio (M‐H, Random, 95% CI) | 0.90 [0.59, 1.35] |
| Analysis 1.1  Comparison 1 Laparoscopy versus laparotomy, Outcome 1 Peritonitis. | ||||
| 2 Peritonitis rate (patient‐months) Show forest plot | 1 | Risk Ratio (M‐H, Random, 95% CI) | Totals not selected | |
| Analysis 1.2  Comparison 1 Laparoscopy versus laparotomy, Outcome 2 Peritonitis rate (patient‐months). | ||||
| 3 Exit‐site/tunnel infection Show forest plot | 3 | 270 | Risk Ratio (M‐H, Random, 95% CI) | 1.00 [0.43, 2.31] |
| Analysis 1.3  Comparison 1 Laparoscopy versus laparotomy, Outcome 3 Exit‐site/tunnel infection. | ||||
| 4 Catheter removal or replacement Show forest plot | 3 | 167 | Risk Ratio (M‐H, Random, 95% CI) | 1.20 [0.77, 1.86] |
| Analysis 1.4  Comparison 1 Laparoscopy versus laparotomy, Outcome 4 Catheter removal or replacement. | ||||
| 5 Technique failure Show forest plot | 4 | 283 | Risk Ratio (M‐H, Random, 95% CI) | 0.71 [0.47, 1.08] |
| Analysis 1.5  Comparison 1 Laparoscopy versus laparotomy, Outcome 5 Technique failure. | ||||
| 6 Death (all causes) Show forest plot | 3 | 270 | Risk Ratio (M‐H, Random, 95% CI) | 1.26 [0.72, 2.20] |
| Analysis 1.6  Comparison 1 Laparoscopy versus laparotomy, Outcome 6 Death (all causes). | ||||
| 7 Dialysate leak Show forest plot | 3 | 167 | Risk Ratio (M‐H, Random, 95% CI) | 0.85 [0.10, 6.97] |
| Analysis 1.7  Comparison 1 Laparoscopy versus laparotomy, Outcome 7 Dialysate leak. | ||||
| Outcome or subgroup title | No. of studies | No. of participants | Statistical method | Effect size |
| 1 Peritonitis rate (patient‐months) Show forest plot | 2 | 2511 | Risk Ratio (M‐H, Random, 95% CI) | 1.16 [0.37, 3.60] |
| Analysis 2.1  Comparison 2 Buried (subcutaneous) versus non‐buried catheter, Outcome 1 Peritonitis rate (patient‐months). | ||||
| 2 Exit‐site/tunnel infection rate (patient‐months) Show forest plot | 2 | 2511 | Risk Ratio (M‐H, Random, 95% CI) | 1.15 [0.39, 3.42] |
| Analysis 2.2  Comparison 2 Buried (subcutaneous) versus non‐buried catheter, Outcome 2 Exit‐site/tunnel infection rate (patient‐months). | ||||
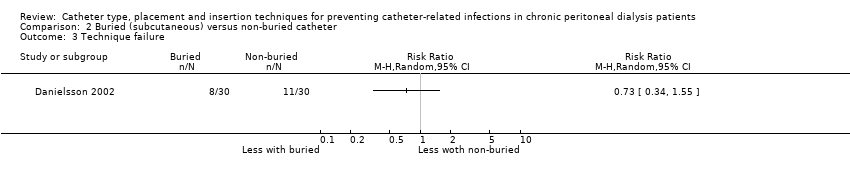
| 3 Technique failure Show forest plot | 1 | Risk Ratio (M‐H, Random, 95% CI) | Totals not selected | |
| Analysis 2.3  Comparison 2 Buried (subcutaneous) versus non‐buried catheter, Outcome 3 Technique failure. | ||||
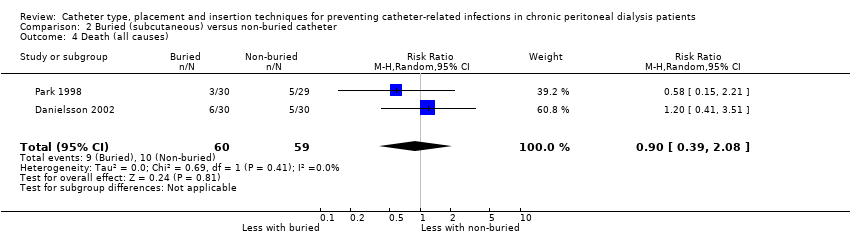
| 4 Death (all causes) Show forest plot | 2 | 119 | Risk Ratio (M‐H, Random, 95% CI) | 0.90 [0.39, 2.08] |
| Analysis 2.4  Comparison 2 Buried (subcutaneous) versus non‐buried catheter, Outcome 4 Death (all causes). | ||||
| Outcome or subgroup title | No. of studies | No. of participants | Statistical method | Effect size |
| 1 Peritonitis Show forest plot | 2 | 120 | Risk Ratio (M‐H, Random, 95% CI) | 0.65 [0.32, 1.33] |
| Analysis 3.1  Comparison 3 Midline versus lateral insertion, Outcome 1 Peritonitis. | ||||
| 2 Exit‐site/tunnel infection Show forest plot | 2 | 120 | Risk Ratio (M‐H, Random, 95% CI) | 0.56 [0.12, 2.58] |
| Analysis 3.2  Comparison 3 Midline versus lateral insertion, Outcome 2 Exit‐site/tunnel infection. | ||||
| 3 Catheter removal or replacement Show forest plot | 1 | Risk Ratio (M‐H, Random, 95% CI) | Totals not selected | |
| Analysis 3.3  Comparison 3 Midline versus lateral insertion, Outcome 3 Catheter removal or replacement. | ||||
| 4 Death (all causes) Show forest plot | 1 | Risk Ratio (M‐H, Random, 95% CI) | Totals not selected | |
| Analysis 3.4  Comparison 3 Midline versus lateral insertion, Outcome 4 Death (all causes). | ||||
| Outcome or subgroup title | No. of studies | No. of participants | Statistical method | Effect size |
| 1 Exit‐site/tunnel infection Show forest plot | 2 | 96 | Risk Ratio (M‐H, Random, 95% CI) | 0.16 [0.02, 1.30] |
| Analysis 4.1  Comparison 4 Percutaneous insertion versus open surgery, Outcome 1 Exit‐site/tunnel infection. | ||||
| 2 Catheter removal or replacement Show forest plot | 1 | Risk Ratio (M‐H, Random, 95% CI) | Totals not selected | |
| Analysis 4.2  Comparison 4 Percutaneous insertion versus open surgery, Outcome 2 Catheter removal or replacement. | ||||
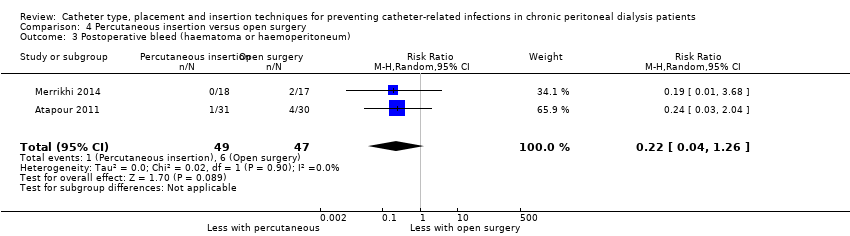
| 3 Postoperative bleed (haematoma or haemoperitoneum) Show forest plot | 2 | 96 | Risk Ratio (M‐H, Random, 95% CI) | 0.22 [0.04, 1.26] |
| Analysis 4.3  Comparison 4 Percutaneous insertion versus open surgery, Outcome 3 Postoperative bleed (haematoma or haemoperitoneum). | ||||
| Outcome or subgroup title | No. of studies | No. of participants | Statistical method | Effect size |
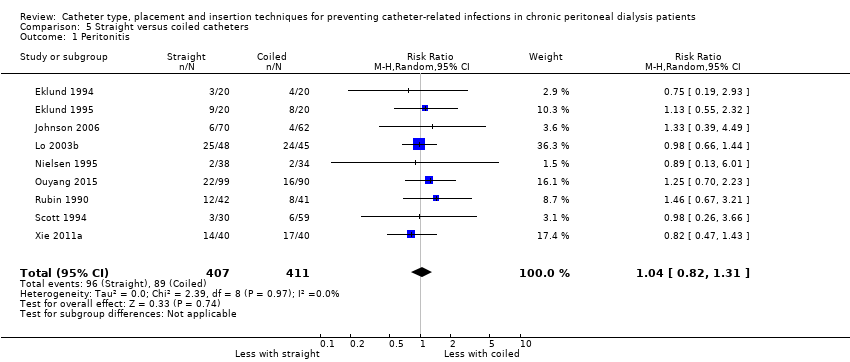
| 1 Peritonitis Show forest plot | 9 | 818 | Risk Ratio (M‐H, Random, 95% CI) | 1.04 [0.82, 1.31] |
| Analysis 5.1  Comparison 5 Straight versus coiled catheters, Outcome 1 Peritonitis. | ||||
| 2 Peritonitis rate (patient‐months) Show forest plot | 5 | 5882 | Risk Ratio (M‐H, Random, 95% CI) | 0.91 [0.68, 1.21] |
| Analysis 5.2  Comparison 5 Straight versus coiled catheters, Outcome 2 Peritonitis rate (patient‐months). | ||||
| 3 Exit‐site/tunnel infection Show forest plot | 10 | 826 | Risk Ratio (M‐H, Random, 95% CI) | 1.12 [0.94, 1.34] |
| Analysis 5.3  Comparison 5 Straight versus coiled catheters, Outcome 3 Exit‐site/tunnel infection. | ||||
| 4 Exit‐site/tunnel infection rate (patient‐months) Show forest plot | 4 | 5286 | Risk Ratio (M‐H, Random, 95% CI) | 1.05 [0.77, 1.43] |
| Analysis 5.4  Comparison 5 Straight versus coiled catheters, Outcome 4 Exit‐site/tunnel infection rate (patient‐months). | ||||
| 5 Catheter removal or replacement Show forest plot | 9 | 713 | Risk Ratio (M‐H, Random, 95% CI) | 1.11 [0.73, 1.66] |
| Analysis 5.5  Comparison 5 Straight versus coiled catheters, Outcome 5 Catheter removal or replacement. | ||||
| 6 Technique failure Show forest plot | 4 | 442 | Risk Ratio (M‐H, Random, 95% CI) | 0.82 [0.51, 1.31] |
| Analysis 5.6  Comparison 5 Straight versus coiled catheters, Outcome 6 Technique failure. | ||||
| 7 Death (all causes) Show forest plot | 8 | 703 | Risk Ratio (M‐H, Random, 95% CI) | 0.95 [0.62, 1.46] |
| Analysis 5.7  Comparison 5 Straight versus coiled catheters, Outcome 7 Death (all causes). | ||||
| 8 Peritonitis (studies with low risk of attrition bias) Show forest plot | 4 | 345 | Risk Ratio (M‐H, Random, 95% CI) | 0.93 [0.69, 1.26] |
| Analysis 5.8  Comparison 5 Straight versus coiled catheters, Outcome 8 Peritonitis (studies with low risk of attrition bias). | ||||
| 9 Peritonitis rate (patient‐months) (studies with low risk of attrition bias) Show forest plot | 3 | 1771 | Risk Ratio (M‐H, Random, 95% CI) | 0.91 [0.61, 1.35] |
| Analysis 5.9  Comparison 5 Straight versus coiled catheters, Outcome 9 Peritonitis rate (patient‐months) (studies with low risk of attrition bias). | ||||
| 10 Exit‐site/tunnel infection (studies with low risk of attrition bias) Show forest plot | 6 | 425 | Risk Ratio (M‐H, Random, 95% CI) | 1.14 [0.94, 1.39] |
| Analysis 5.10  Comparison 5 Straight versus coiled catheters, Outcome 10 Exit‐site/tunnel infection (studies with low risk of attrition bias). | ||||
| 11 Exit‐site/tunnel infection rate (patient‐months) (studies with low risk of attrition bias) Show forest plot | 2 | 1175 | Risk Ratio (M‐H, Random, 95% CI) | 1.18 [0.76, 1.82] |
| Analysis 5.11  Comparison 5 Straight versus coiled catheters, Outcome 11 Exit‐site/tunnel infection rate (patient‐months) (studies with low risk of attrition bias). | ||||
| 12 Catheter removal or replacement (studies with low risk of attrition bias) Show forest plot | 5 | 329 | Risk Ratio (M‐H, Random, 95% CI) | 0.78 [0.45, 1.33] |
| Analysis 5.12  Comparison 5 Straight versus coiled catheters, Outcome 12 Catheter removal or replacement (studies with low risk of attrition bias). | ||||
| 13 Dialysate leak Show forest plot | 7 | 550 | Risk Ratio (M‐H, Random, 95% CI) | 0.74 [0.16, 3.49] |
| Analysis 5.13  Comparison 5 Straight versus coiled catheters, Outcome 13 Dialysate leak. | ||||
| 14 Postoperative bleeding (haematoma or haemoperitoneum) Show forest plot | 4 | 358 | Risk Ratio (M‐H, Random, 95% CI) | 1.14 [0.24, 5.34] |
| Analysis 5.14  Comparison 5 Straight versus coiled catheters, Outcome 14 Postoperative bleeding (haematoma or haemoperitoneum). | ||||
| Outcome or subgroup title | No. of studies | No. of participants | Statistical method | Effect size |
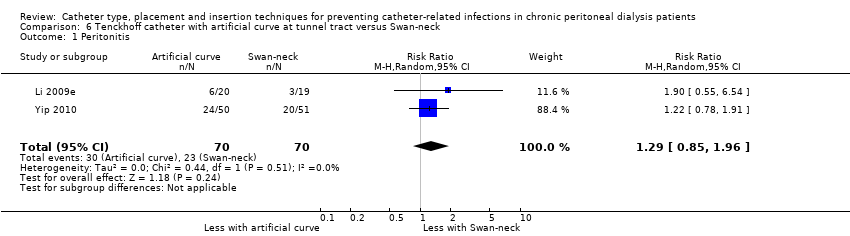
| 1 Peritonitis Show forest plot | 2 | 140 | Risk Ratio (M‐H, Random, 95% CI) | 1.29 [0.85, 1.96] |
| Analysis 6.1  Comparison 6 Tenckhoff catheter with artificial curve at tunnel tract versus Swan‐neck, Outcome 1 Peritonitis. | ||||
| 2 Peritonitis rate (patient‐months) Show forest plot | 2 | 2535 | Risk Ratio (M‐H, Random, 95% CI) | 1.22 [0.54, 2.75] |
| Analysis 6.2  Comparison 6 Tenckhoff catheter with artificial curve at tunnel tract versus Swan‐neck, Outcome 2 Peritonitis rate (patient‐months). | ||||
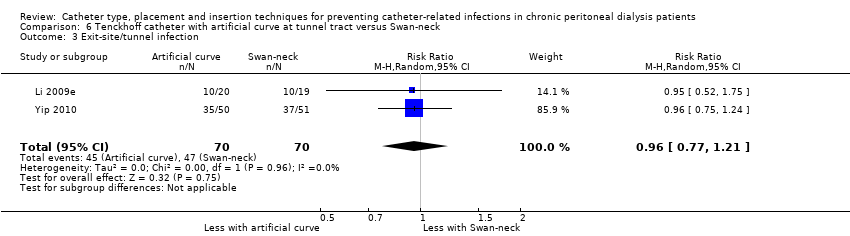
| 3 Exit‐site/tunnel infection Show forest plot | 2 | 140 | Risk Ratio (M‐H, Random, 95% CI) | 0.96 [0.77, 1.21] |
| Analysis 6.3  Comparison 6 Tenckhoff catheter with artificial curve at tunnel tract versus Swan‐neck, Outcome 3 Exit‐site/tunnel infection. | ||||
| 4 Exit‐site/tunnel infection rate (patient‐months) Show forest plot | 2 | 2535 | Risk Ratio (M‐H, Random, 95% CI) | 0.67 [0.50, 0.90] |
| Analysis 6.4  Comparison 6 Tenckhoff catheter with artificial curve at tunnel tract versus Swan‐neck, Outcome 4 Exit‐site/tunnel infection rate (patient‐months). | ||||
| 5 Catheter removal or replacement Show forest plot | 2 | 140 | Risk Ratio (M‐H, Random, 95% CI) | 0.85 [0.42, 1.72] |
| Analysis 6.5  Comparison 6 Tenckhoff catheter with artificial curve at tunnel tract versus Swan‐neck, Outcome 5 Catheter removal or replacement. | ||||
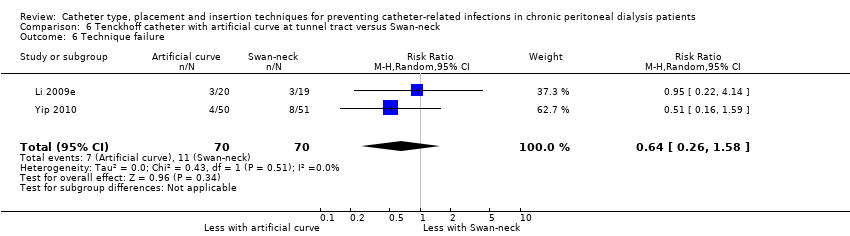
| 6 Technique failure Show forest plot | 2 | 140 | Risk Ratio (M‐H, Random, 95% CI) | 0.64 [0.26, 1.58] |
| Analysis 6.6  Comparison 6 Tenckhoff catheter with artificial curve at tunnel tract versus Swan‐neck, Outcome 6 Technique failure. | ||||
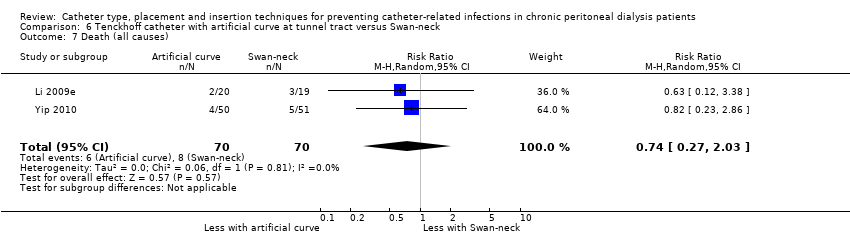
| 7 Death (all causes) Show forest plot | 2 | 140 | Risk Ratio (M‐H, Random, 95% CI) | 0.74 [0.27, 2.03] |
| Analysis 6.7  Comparison 6 Tenckhoff catheter with artificial curve at tunnel tract versus Swan‐neck, Outcome 7 Death (all causes). | ||||
| Outcome or subgroup title | No. of studies | No. of participants | Statistical method | Effect size |
| 1 Peritonitis Show forest plot | 1 | Risk Ratio (M‐H, Random, 95% CI) | Totals not selected | |
| Analysis 7.1  Comparison 7 Self‐locating catheter versus straight tenckhoff catheter, Outcome 1 Peritonitis. | ||||
| 2 Exit‐site/tunnel infection Show forest plot | 1 | Risk Ratio (M‐H, Random, 95% CI) | Totals not selected | |
| Analysis 7.2  Comparison 7 Self‐locating catheter versus straight tenckhoff catheter, Outcome 2 Exit‐site/tunnel infection. | ||||
| 3 Catheter removal or replacement Show forest plot | 2 | 139 | Risk Ratio (M‐H, Random, 95% CI) | 0.32 [0.03, 3.06] |
| Analysis 7.3  Comparison 7 Self‐locating catheter versus straight tenckhoff catheter, Outcome 3 Catheter removal or replacement. | ||||
| 4 Technique failure Show forest plot | 2 | 139 | Risk Ratio (M‐H, Random, 95% CI) | 0.64 [0.39, 1.04] |
| Analysis 7.4  Comparison 7 Self‐locating catheter versus straight tenckhoff catheter, Outcome 4 Technique failure. | ||||
| 5 Death (all causes) Show forest plot | 2 | 139 | Risk Ratio (M‐H, Random, 95% CI) | 1.02 [0.11, 9.75] |
| Analysis 7.5  Comparison 7 Self‐locating catheter versus straight tenckhoff catheter, Outcome 5 Death (all causes). | ||||
| 6 Dialysate leak Show forest plot | 2 | 139 | Risk Ratio (M‐H, Random, 95% CI) | 1.04 [0.46, 2.35] |
| Analysis 7.6  Comparison 7 Self‐locating catheter versus straight tenckhoff catheter, Outcome 6 Dialysate leak. | ||||
| Outcome or subgroup title | No. of studies | No. of participants | Statistical method | Effect size |
| 1 Peritonitis Show forest plot | 1 | Risk Ratio (M‐H, Random, 95% CI) | Totals not selected | |
| Analysis 8.1  Comparison 8 Open insertion with omentum folding versus open surgery, Outcome 1 Peritonitis. | ||||
| 2 Peritonitis rate (patient‐months) Show forest plot | 1 | Risk Ratio (M‐H, Random, 95% CI) | Totals not selected | |
| Analysis 8.2  Comparison 8 Open insertion with omentum folding versus open surgery, Outcome 2 Peritonitis rate (patient‐months). | ||||
| 3 Exit‐site/tunnel infection Show forest plot | 1 | Risk Ratio (M‐H, Random, 95% CI) | Totals not selected | |
| Analysis 8.3  Comparison 8 Open insertion with omentum folding versus open surgery, Outcome 3 Exit‐site/tunnel infection. | ||||
| 4 Exit‐site/tunnel infection rate (patient‐month) Show forest plot | 1 | Risk Ratio (M‐H, Random, 95% CI) | Totals not selected | |
| Analysis 8.4  Comparison 8 Open insertion with omentum folding versus open surgery, Outcome 4 Exit‐site/tunnel infection rate (patient‐month). | ||||
| 5 Catheter removal or replacement Show forest plot | 1 | Risk Ratio (M‐H, Random, 95% CI) | Totals not selected | |
| Analysis 8.5  Comparison 8 Open insertion with omentum folding versus open surgery, Outcome 5 Catheter removal or replacement. | ||||
| 6 Technique failure Show forest plot | 1 | Risk Ratio (M‐H, Random, 95% CI) | Totals not selected | |
| Analysis 8.6  Comparison 8 Open insertion with omentum folding versus open surgery, Outcome 6 Technique failure. | ||||
| 7 Death (all causes) Show forest plot | 1 | Risk Ratio (M‐H, Random, 95% CI) | Totals not selected | |
| Analysis 8.7  Comparison 8 Open insertion with omentum folding versus open surgery, Outcome 7 Death (all causes). | ||||
| 8 Dialysate leak Show forest plot | 1 | Risk Ratio (M‐H, Random, 95% CI) | Totals not selected | |
| Analysis 8.8  Comparison 8 Open insertion with omentum folding versus open surgery, Outcome 8 Dialysate leak. | ||||
| 9 Postoperative bleed (haematoma or haemoperitoneum) Show forest plot | 1 | Risk Ratio (M‐H, Random, 95% CI) | Totals not selected | |
| Analysis 8.9  Comparison 8 Open insertion with omentum folding versus open surgery, Outcome 9 Postoperative bleed (haematoma or haemoperitoneum). | ||||
| Outcome or subgroup title | No. of studies | No. of participants | Statistical method | Effect size |
| 1 Peritonitis Show forest plot | 1 | Risk Ratio (M‐H, Random, 95% CI) | Totals not selected | |
| Analysis 9.1  Comparison 9 Modified surgery with or without catheter fixation versus open surgery, Outcome 1 Peritonitis. | ||||
| 2 Exit‐site/tunnel infection Show forest plot | 1 | Risk Ratio (M‐H, Random, 95% CI) | Totals not selected | |
| Analysis 9.2  Comparison 9 Modified surgery with or without catheter fixation versus open surgery, Outcome 2 Exit‐site/tunnel infection. | ||||
| 3 Catheter removal or replacement Show forest plot | 1 | Risk Ratio (M‐H, Random, 95% CI) | Totals not selected | |
| Analysis 9.3  Comparison 9 Modified surgery with or without catheter fixation versus open surgery, Outcome 3 Catheter removal or replacement. | ||||
| 4 Dialysate leak Show forest plot | 1 | Risk Ratio (M‐H, Random, 95% CI) | Totals not selected | |
| Analysis 9.4  Comparison 9 Modified surgery with or without catheter fixation versus open surgery, Outcome 4 Dialysate leak. | ||||
| 5 Postoperative bleed (haematoma or haemoperitoneum) Show forest plot | 1 | Risk Ratio (M‐H, Random, 95% CI) | Totals not selected | |
| Analysis 9.5  Comparison 9 Modified surgery with or without catheter fixation versus open surgery, Outcome 5 Postoperative bleed (haematoma or haemoperitoneum). | ||||
| Outcome or subgroup title | No. of studies | No. of participants | Statistical method | Effect size |
| 1 Peritonitis Show forest plot | 1 | Risk Ratio (M‐H, Random, 95% CI) | Totals not selected | |
| Analysis 10.1  Comparison 10 Vertical tunnel‐based low‐site insertion versus open surgery, Outcome 1 Peritonitis. | ||||
| 2 Exit‐site/tunnel infection Show forest plot | 1 | Risk Ratio (M‐H, Random, 95% CI) | Totals not selected | |
| Analysis 10.2  Comparison 10 Vertical tunnel‐based low‐site insertion versus open surgery, Outcome 2 Exit‐site/tunnel infection. | ||||
| Outcome or subgroup title | No. of studies | No. of participants | Statistical method | Effect size |
| 1 Peritonitis Show forest plot | 1 | Risk Ratio (M‐H, Random, 95% CI) | Totals not selected | |
| Analysis 11.1  Comparison 11 Ureteroscope‐assisted technique versus modified open surgery, Outcome 1 Peritonitis. | ||||
| 2 Exit‐site/tunnel infection Show forest plot | 1 | Risk Ratio (M‐H, Random, 95% CI) | Totals not selected | |
| Analysis 11.2  Comparison 11 Ureteroscope‐assisted technique versus modified open surgery, Outcome 2 Exit‐site/tunnel infection. | ||||
| 3 Death (all causes) Show forest plot | 1 | Risk Ratio (M‐H, Random, 95% CI) | Totals not selected | |
| Analysis 11.3  Comparison 11 Ureteroscope‐assisted technique versus modified open surgery, Outcome 3 Death (all causes). | ||||
| Outcome or subgroup title | No. of studies | No. of participants | Statistical method | Effect size |
| 1 Peritonitis rate (patient‐month) Show forest plot | 1 | Risk Ratio (M‐H, Random, 95% CI) | Totals not selected | |
| Analysis 12.1  Comparison 12 Radiological versus surgical implantation, Outcome 1 Peritonitis rate (patient‐month). | ||||
| 2 Exit‐site/tunnel infection (patient‐months) Show forest plot | 1 | Risk Ratio (M‐H, Random, 95% CI) | Totals not selected | |
| Analysis 12.2  Comparison 12 Radiological versus surgical implantation, Outcome 2 Exit‐site/tunnel infection (patient‐months). | ||||
| 3 Catheter removal or replacement Show forest plot | 1 | Risk Ratio (M‐H, Random, 95% CI) | Totals not selected | |
| Analysis 12.3  Comparison 12 Radiological versus surgical implantation, Outcome 3 Catheter removal or replacement. | ||||
| 4 Death (all causes) Show forest plot | 1 | Risk Ratio (M‐H, Random, 95% CI) | Totals not selected | |
| Analysis 12.4  Comparison 12 Radiological versus surgical implantation, Outcome 4 Death (all causes). | ||||
| 5 Dialysate leak Show forest plot | 1 | Risk Ratio (M‐H, Random, 95% CI) | Totals not selected | |
| Analysis 12.5  Comparison 12 Radiological versus surgical implantation, Outcome 5 Dialysate leak. | ||||
| Outcome or subgroup title | No. of studies | No. of participants | Statistical method | Effect size |
| 1 Peritonitis Show forest plot | 1 | Risk Ratio (M‐H, Random, 95% CI) | Totals not selected | |
| Analysis 13.1  Comparison 13 Cystoscopy‐assisted surgery versus open surgery, Outcome 1 Peritonitis. | ||||
| 2 Exit‐site/tunnel infection Show forest plot | 1 | Risk Ratio (M‐H, Random, 95% CI) | Totals not selected | |
| Analysis 13.2  Comparison 13 Cystoscopy‐assisted surgery versus open surgery, Outcome 2 Exit‐site/tunnel infection. | ||||
| 3 Dialysate leak Show forest plot | 1 | Risk Ratio (M‐H, Random, 95% CI) | Totals not selected | |
| Analysis 13.3  Comparison 13 Cystoscopy‐assisted surgery versus open surgery, Outcome 3 Dialysate leak. | ||||
| Outcome or subgroup title | No. of studies | No. of participants | Statistical method | Effect size |
| 1 Peritonitis Show forest plot | 1 | Risk Ratio (M‐H, Random, 95% CI) | Totals not selected | |
| Analysis 14.1  Comparison 14 Laparoscopic Moncrief‐Popovich versus Trocar technique, Outcome 1 Peritonitis. | ||||
| 2 Exit‐site infection Show forest plot | 1 | Risk Ratio (M‐H, Random, 95% CI) | Totals not selected | |
| Analysis 14.2  Comparison 14 Laparoscopic Moncrief‐Popovich versus Trocar technique, Outcome 2 Exit‐site infection. | ||||
| 3 Dialysate leak Show forest plot | 1 | Risk Ratio (M‐H, Random, 95% CI) | Totals not selected | |
| Analysis 14.3  Comparison 14 Laparoscopic Moncrief‐Popovich versus Trocar technique, Outcome 3 Dialysate leak. | ||||
| Outcome or subgroup title | No. of studies | No. of participants | Statistical method | Effect size |
| 1 Peritonitis Show forest plot | 1 | Risk Ratio (M‐H, Random, 95% CI) | Totals not selected | |
| Analysis 15.1  Comparison 15 Single versus double cuff, Outcome 1 Peritonitis. | ||||
| 2 Exit‐site/tunnel infection Show forest plot | 1 | Risk Ratio (M‐H, Random, 95% CI) | Totals not selected | |
| Analysis 15.2  Comparison 15 Single versus double cuff, Outcome 2 Exit‐site/tunnel infection. | ||||
| 3 Catheter removal or replacement Show forest plot | 1 | Risk Ratio (M‐H, Random, 95% CI) | Totals not selected | |
| Analysis 15.3  Comparison 15 Single versus double cuff, Outcome 3 Catheter removal or replacement. | ||||
| 4 Technique failure Show forest plot | 1 | Risk Ratio (M‐H, Random, 95% CI) | Totals not selected | |
| Analysis 15.4  Comparison 15 Single versus double cuff, Outcome 4 Technique failure. | ||||
| 5 Death (all causes) Show forest plot | 1 | Risk Ratio (M‐H, Random, 95% CI) | Totals not selected | |
| Analysis 15.5  Comparison 15 Single versus double cuff, Outcome 5 Death (all causes). | ||||
| Outcome or subgroup title | No. of studies | No. of participants | Statistical method | Effect size |
| 1 Peritonitis Show forest plot | 1 | Risk Ratio (M‐H, Random, 95% CI) | Totals not selected | |
| Analysis 16.1  Comparison 16 Triple cuff versus double catheter, Outcome 1 Peritonitis. | ||||
| 2 Peritonitis rate (patient‐months) Show forest plot | 1 | Risk Ratio (M‐H, Random, 95% CI) | Totals not selected | |
| Analysis 16.2  Comparison 16 Triple cuff versus double catheter, Outcome 2 Peritonitis rate (patient‐months). | ||||
| 3 Exit‐site/tunnel infection Show forest plot | 1 | Risk Ratio (M‐H, Random, 95% CI) | Totals not selected | |
| Analysis 16.3  Comparison 16 Triple cuff versus double catheter, Outcome 3 Exit‐site/tunnel infection. | ||||
| 4 Exit‐site/tunnel infection (patient‐months) Show forest plot | 1 | Risk Ratio (M‐H, Random, 95% CI) | Totals not selected | |
| Analysis 16.4  Comparison 16 Triple cuff versus double catheter, Outcome 4 Exit‐site/tunnel infection (patient‐months). | ||||
| 5 Catheter removal or replacement Show forest plot | 1 | Risk Ratio (M‐H, Random, 95% CI) | Totals not selected | |
| Analysis 16.5  Comparison 16 Triple cuff versus double catheter, Outcome 5 Catheter removal or replacement. | ||||
| 6 Dialysate leak Show forest plot | 1 | Risk Ratio (M‐H, Random, 95% CI) | Totals not selected | |
| Analysis 16.6  Comparison 16 Triple cuff versus double catheter, Outcome 6 Dialysate leak. | ||||
| Outcome or subgroup title | No. of studies | No. of participants | Statistical method | Effect size |
| 1 Peritonitis Show forest plot | 1 | Risk Ratio (M‐H, Random, 95% CI) | Totals not selected | |
| Analysis 17.1  Comparison 17 Swan‐neck versus straight curled catheter, Outcome 1 Peritonitis. | ||||
| 2 Peritonitis rate (patient‐months) Show forest plot | 1 | Risk Ratio (M‐H, Random, 95% CI) | Totals not selected | |
| Analysis 17.2  Comparison 17 Swan‐neck versus straight curled catheter, Outcome 2 Peritonitis rate (patient‐months). | ||||
| 3 Exit‐site/tunnel infection Show forest plot | 1 | Risk Ratio (M‐H, Random, 95% CI) | Totals not selected | |
| Analysis 17.3  Comparison 17 Swan‐neck versus straight curled catheter, Outcome 3 Exit‐site/tunnel infection. | ||||
| 4 Exit‐site/tunnel infection rate (patient‐months) Show forest plot | 1 | Risk Ratio (M‐H, Random, 95% CI) | Totals not selected | |
| Analysis 17.4  Comparison 17 Swan‐neck versus straight curled catheter, Outcome 4 Exit‐site/tunnel infection rate (patient‐months). | ||||
| 5 Technique failure Show forest plot | 1 | Risk Ratio (M‐H, Random, 95% CI) | Totals not selected | |
| Analysis 17.5  Comparison 17 Swan‐neck versus straight curled catheter, Outcome 5 Technique failure. | ||||
| 6 Dialysate leak Show forest plot | 1 | Risk Ratio (M‐H, Random, 95% CI) | Totals not selected | |
| Analysis 17.6  Comparison 17 Swan‐neck versus straight curled catheter, Outcome 6 Dialysate leak. | ||||
| Outcome or subgroup title | No. of studies | No. of participants | Statistical method | Effect size |
| 1 Peritonitis Show forest plot | 1 | Risk Ratio (M‐H, Random, 95% CI) | Totals not selected | |
| Analysis 18.1  Comparison 18 Antibiotic‐treated catheter versus none, Outcome 1 Peritonitis. | ||||
| 2 Exit‐site/tunnel infection Show forest plot | 1 | Risk Ratio (M‐H, Random, 95% CI) | Totals not selected | |
| Analysis 18.2  Comparison 18 Antibiotic‐treated catheter versus none, Outcome 2 Exit‐site/tunnel infection. | ||||
| 3 Catheter removal or replacement Show forest plot | 1 | Risk Ratio (M‐H, Random, 95% CI) | Totals not selected | |
| Analysis 18.3  Comparison 18 Antibiotic‐treated catheter versus none, Outcome 3 Catheter removal or replacement. | ||||
| 4 Death (all causes) Show forest plot | 1 | Risk Ratio (M‐H, Random, 95% CI) | Totals not selected | |
| Analysis 18.4  Comparison 18 Antibiotic‐treated catheter versus none, Outcome 4 Death (all causes). | ||||
| Outcome or subgroup title | No. of studies | No. of participants | Statistical method | Effect size |
| 1 Peritonitis Show forest plot | 1 | Risk Ratio (M‐H, Random, 95% CI) | Totals not selected | |
| Analysis 19.1  Comparison 19 Immobilisation versus no immobilisation, Outcome 1 Peritonitis. | ||||
| 2 Exit‐site/tunnel infection Show forest plot | 1 | Risk Ratio (M‐H, Random, 95% CI) | Totals not selected | |
| Analysis 19.2  Comparison 19 Immobilisation versus no immobilisation, Outcome 2 Exit‐site/tunnel infection. | ||||
| Outcome or subgroup title | No. of studies | No. of participants | Statistical method | Effect size |
| 1 Peritonitis Show forest plot | 1 | Risk Ratio (M‐H, Random, 95% CI) | Totals not selected | |
| Analysis 20.1  Comparison 20 Silver ring versus no silver ring, Outcome 1 Peritonitis. | ||||
| 2 Exit‐site/tunnel infection Show forest plot | 1 | Risk Ratio (M‐H, Random, 95% CI) | Totals not selected | |
| Analysis 20.2  Comparison 20 Silver ring versus no silver ring, Outcome 2 Exit‐site/tunnel infection. | ||||
| 3 Technique failure Show forest plot | 1 | Risk Ratio (M‐H, Random, 95% CI) | Totals not selected | |
| Analysis 20.3  Comparison 20 Silver ring versus no silver ring, Outcome 3 Technique failure. | ||||
| 4 Death (all causes) Show forest plot | 1 | Risk Ratio (M‐H, Random, 95% CI) | Totals not selected | |
| Analysis 20.4  Comparison 20 Silver ring versus no silver ring, Outcome 4 Death (all causes). | ||||

Study flow diagram.
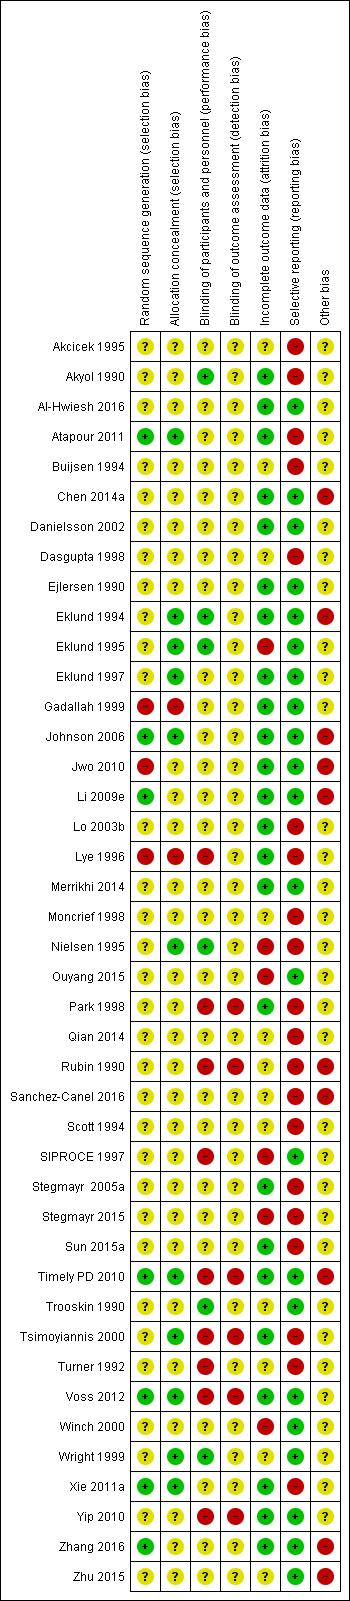
Risk of bias summary: review authors' judgements about each risk of bias item for each included study.
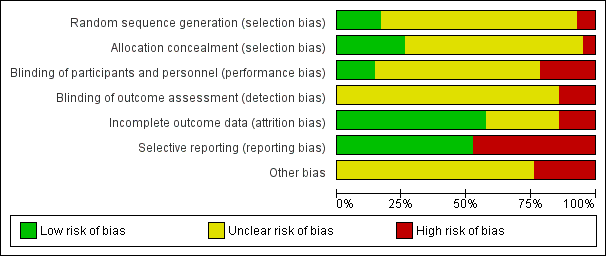
Risk of bias graph: review authors' judgements about each risk of bias item presented as percentages across all included studies.

Comparison 1 Laparoscopy versus laparotomy, Outcome 1 Peritonitis.
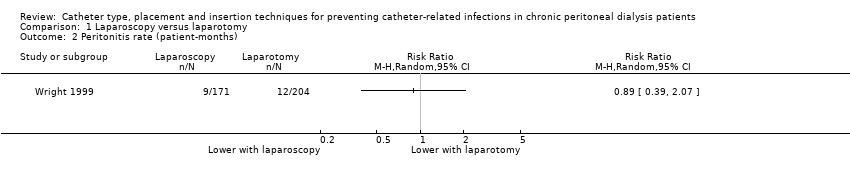
Comparison 1 Laparoscopy versus laparotomy, Outcome 2 Peritonitis rate (patient‐months).

Comparison 1 Laparoscopy versus laparotomy, Outcome 3 Exit‐site/tunnel infection.

Comparison 1 Laparoscopy versus laparotomy, Outcome 4 Catheter removal or replacement.
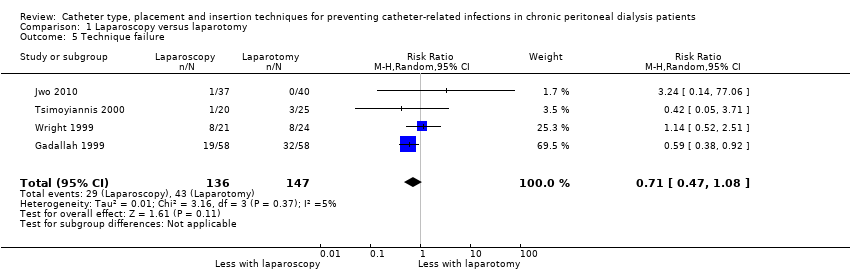
Comparison 1 Laparoscopy versus laparotomy, Outcome 5 Technique failure.

Comparison 1 Laparoscopy versus laparotomy, Outcome 6 Death (all causes).

Comparison 1 Laparoscopy versus laparotomy, Outcome 7 Dialysate leak.

Comparison 2 Buried (subcutaneous) versus non‐buried catheter, Outcome 1 Peritonitis rate (patient‐months).

Comparison 2 Buried (subcutaneous) versus non‐buried catheter, Outcome 2 Exit‐site/tunnel infection rate (patient‐months).
Comparison 2 Buried (subcutaneous) versus non‐buried catheter, Outcome 3 Technique failure.
Comparison 2 Buried (subcutaneous) versus non‐buried catheter, Outcome 4 Death (all causes).

Comparison 3 Midline versus lateral insertion, Outcome 1 Peritonitis.

Comparison 3 Midline versus lateral insertion, Outcome 2 Exit‐site/tunnel infection.

Comparison 3 Midline versus lateral insertion, Outcome 3 Catheter removal or replacement.

Comparison 3 Midline versus lateral insertion, Outcome 4 Death (all causes).

Comparison 4 Percutaneous insertion versus open surgery, Outcome 1 Exit‐site/tunnel infection.

Comparison 4 Percutaneous insertion versus open surgery, Outcome 2 Catheter removal or replacement.
Comparison 4 Percutaneous insertion versus open surgery, Outcome 3 Postoperative bleed (haematoma or haemoperitoneum).
Comparison 5 Straight versus coiled catheters, Outcome 1 Peritonitis.

Comparison 5 Straight versus coiled catheters, Outcome 2 Peritonitis rate (patient‐months).
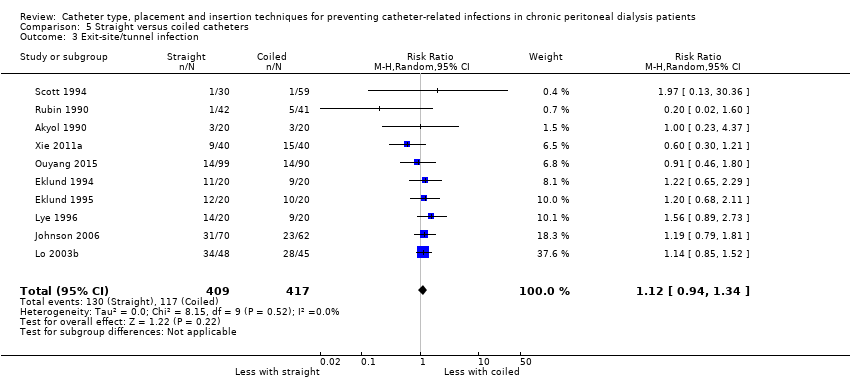
Comparison 5 Straight versus coiled catheters, Outcome 3 Exit‐site/tunnel infection.
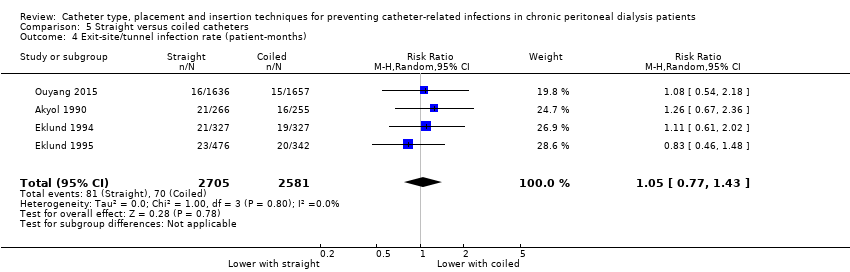
Comparison 5 Straight versus coiled catheters, Outcome 4 Exit‐site/tunnel infection rate (patient‐months).
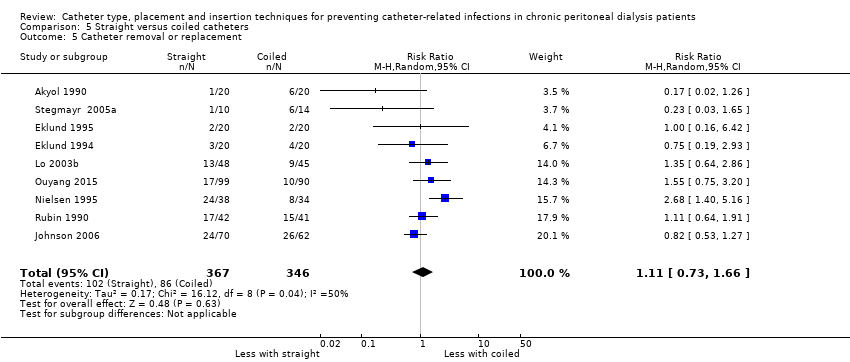
Comparison 5 Straight versus coiled catheters, Outcome 5 Catheter removal or replacement.
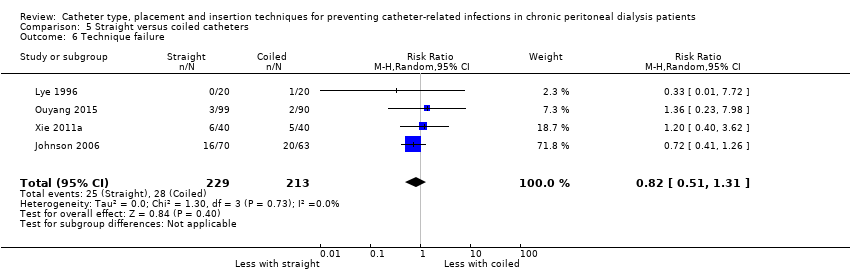
Comparison 5 Straight versus coiled catheters, Outcome 6 Technique failure.

Comparison 5 Straight versus coiled catheters, Outcome 7 Death (all causes).
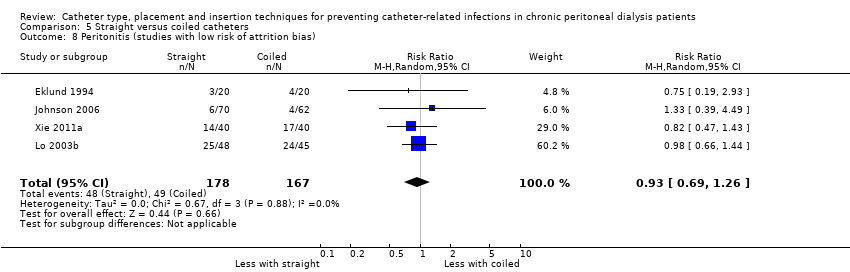
Comparison 5 Straight versus coiled catheters, Outcome 8 Peritonitis (studies with low risk of attrition bias).

Comparison 5 Straight versus coiled catheters, Outcome 9 Peritonitis rate (patient‐months) (studies with low risk of attrition bias).

Comparison 5 Straight versus coiled catheters, Outcome 10 Exit‐site/tunnel infection (studies with low risk of attrition bias).
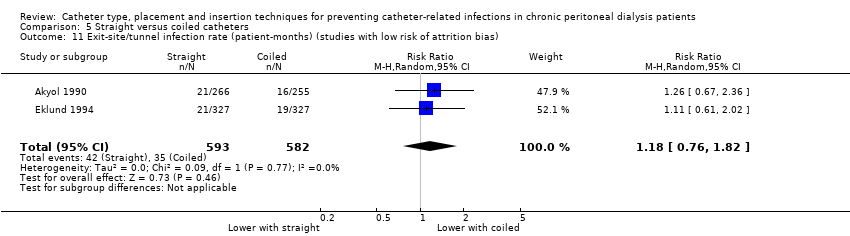
Comparison 5 Straight versus coiled catheters, Outcome 11 Exit‐site/tunnel infection rate (patient‐months) (studies with low risk of attrition bias).

Comparison 5 Straight versus coiled catheters, Outcome 12 Catheter removal or replacement (studies with low risk of attrition bias).
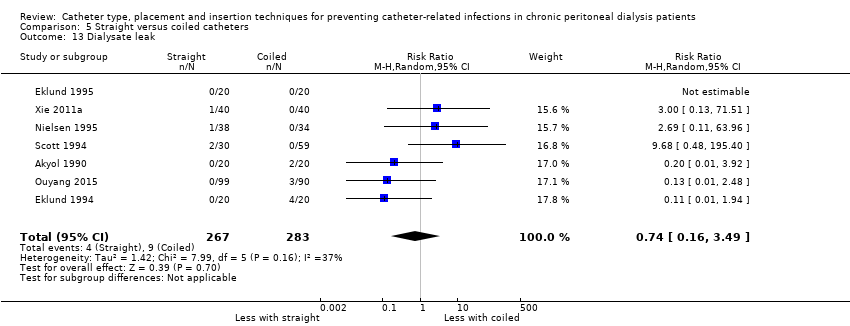
Comparison 5 Straight versus coiled catheters, Outcome 13 Dialysate leak.
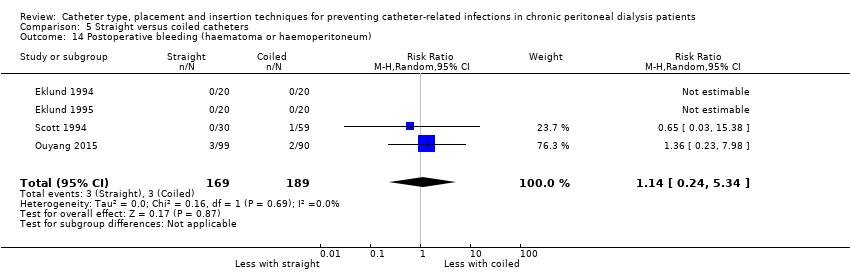
Comparison 5 Straight versus coiled catheters, Outcome 14 Postoperative bleeding (haematoma or haemoperitoneum).
Comparison 6 Tenckhoff catheter with artificial curve at tunnel tract versus Swan‐neck, Outcome 1 Peritonitis.

Comparison 6 Tenckhoff catheter with artificial curve at tunnel tract versus Swan‐neck, Outcome 2 Peritonitis rate (patient‐months).
Comparison 6 Tenckhoff catheter with artificial curve at tunnel tract versus Swan‐neck, Outcome 3 Exit‐site/tunnel infection.

Comparison 6 Tenckhoff catheter with artificial curve at tunnel tract versus Swan‐neck, Outcome 4 Exit‐site/tunnel infection rate (patient‐months).

Comparison 6 Tenckhoff catheter with artificial curve at tunnel tract versus Swan‐neck, Outcome 5 Catheter removal or replacement.
Comparison 6 Tenckhoff catheter with artificial curve at tunnel tract versus Swan‐neck, Outcome 6 Technique failure.
Comparison 6 Tenckhoff catheter with artificial curve at tunnel tract versus Swan‐neck, Outcome 7 Death (all causes).

Comparison 7 Self‐locating catheter versus straight tenckhoff catheter, Outcome 1 Peritonitis.
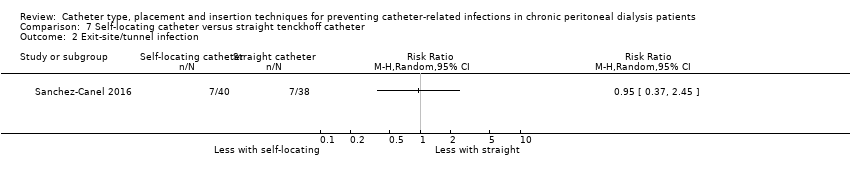
Comparison 7 Self‐locating catheter versus straight tenckhoff catheter, Outcome 2 Exit‐site/tunnel infection.

Comparison 7 Self‐locating catheter versus straight tenckhoff catheter, Outcome 3 Catheter removal or replacement.
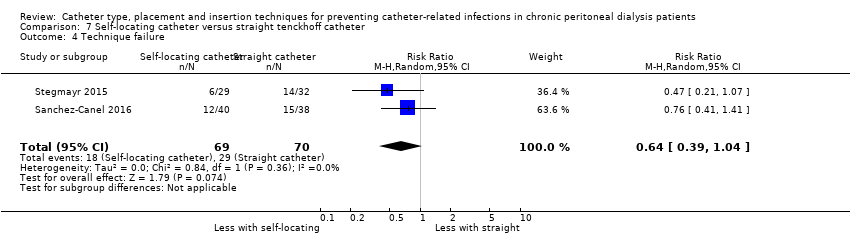
Comparison 7 Self‐locating catheter versus straight tenckhoff catheter, Outcome 4 Technique failure.

Comparison 7 Self‐locating catheter versus straight tenckhoff catheter, Outcome 5 Death (all causes).
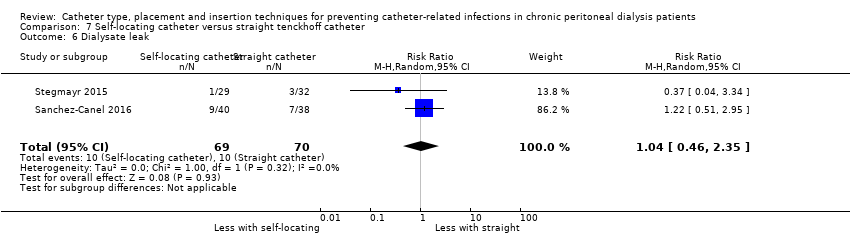
Comparison 7 Self‐locating catheter versus straight tenckhoff catheter, Outcome 6 Dialysate leak.
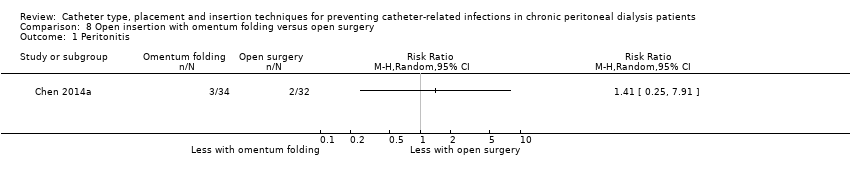
Comparison 8 Open insertion with omentum folding versus open surgery, Outcome 1 Peritonitis.

Comparison 8 Open insertion with omentum folding versus open surgery, Outcome 2 Peritonitis rate (patient‐months).

Comparison 8 Open insertion with omentum folding versus open surgery, Outcome 3 Exit‐site/tunnel infection.
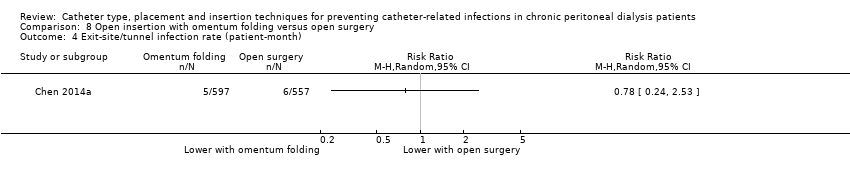
Comparison 8 Open insertion with omentum folding versus open surgery, Outcome 4 Exit‐site/tunnel infection rate (patient‐month).

Comparison 8 Open insertion with omentum folding versus open surgery, Outcome 5 Catheter removal or replacement.

Comparison 8 Open insertion with omentum folding versus open surgery, Outcome 6 Technique failure.
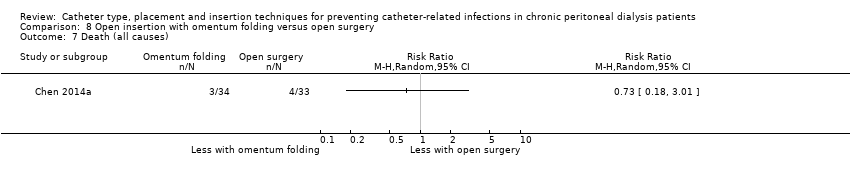
Comparison 8 Open insertion with omentum folding versus open surgery, Outcome 7 Death (all causes).

Comparison 8 Open insertion with omentum folding versus open surgery, Outcome 8 Dialysate leak.

Comparison 8 Open insertion with omentum folding versus open surgery, Outcome 9 Postoperative bleed (haematoma or haemoperitoneum).

Comparison 9 Modified surgery with or without catheter fixation versus open surgery, Outcome 1 Peritonitis.

Comparison 9 Modified surgery with or without catheter fixation versus open surgery, Outcome 2 Exit‐site/tunnel infection.

Comparison 9 Modified surgery with or without catheter fixation versus open surgery, Outcome 3 Catheter removal or replacement.

Comparison 9 Modified surgery with or without catheter fixation versus open surgery, Outcome 4 Dialysate leak.
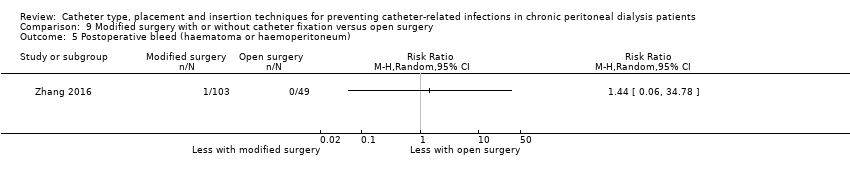
Comparison 9 Modified surgery with or without catheter fixation versus open surgery, Outcome 5 Postoperative bleed (haematoma or haemoperitoneum).
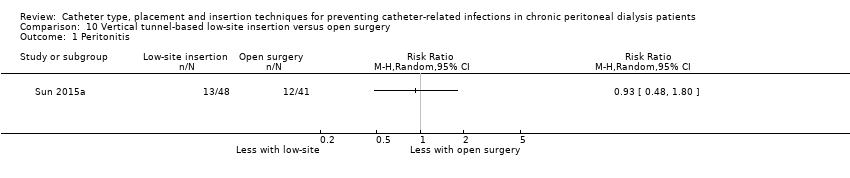
Comparison 10 Vertical tunnel‐based low‐site insertion versus open surgery, Outcome 1 Peritonitis.

Comparison 10 Vertical tunnel‐based low‐site insertion versus open surgery, Outcome 2 Exit‐site/tunnel infection.

Comparison 11 Ureteroscope‐assisted technique versus modified open surgery, Outcome 1 Peritonitis.

Comparison 11 Ureteroscope‐assisted technique versus modified open surgery, Outcome 2 Exit‐site/tunnel infection.

Comparison 11 Ureteroscope‐assisted technique versus modified open surgery, Outcome 3 Death (all causes).
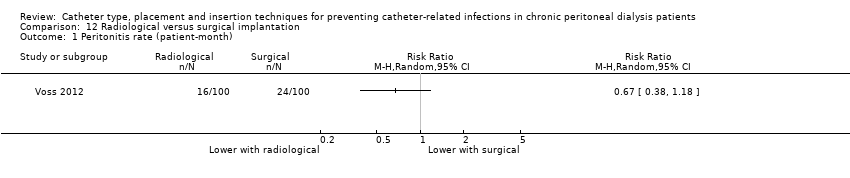
Comparison 12 Radiological versus surgical implantation, Outcome 1 Peritonitis rate (patient‐month).
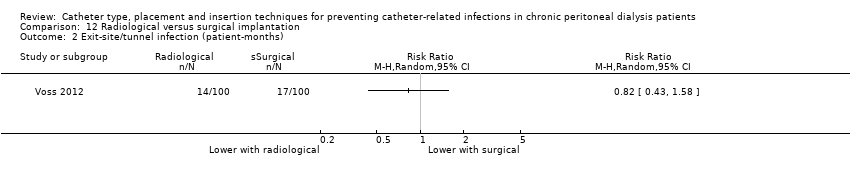
Comparison 12 Radiological versus surgical implantation, Outcome 2 Exit‐site/tunnel infection (patient‐months).
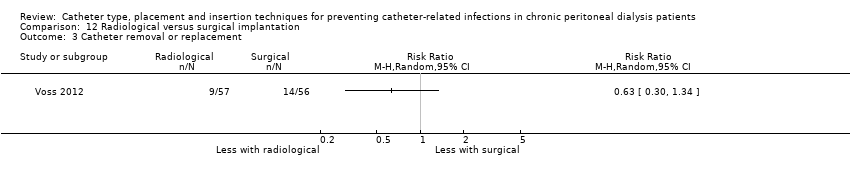
Comparison 12 Radiological versus surgical implantation, Outcome 3 Catheter removal or replacement.
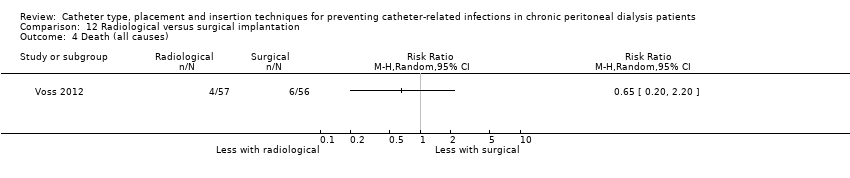
Comparison 12 Radiological versus surgical implantation, Outcome 4 Death (all causes).

Comparison 12 Radiological versus surgical implantation, Outcome 5 Dialysate leak.
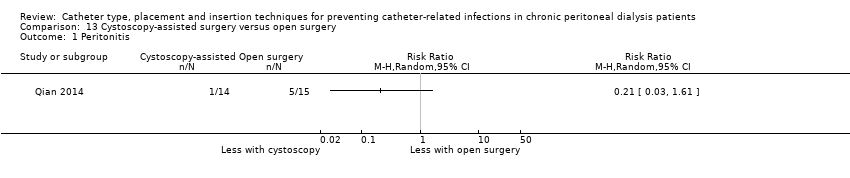
Comparison 13 Cystoscopy‐assisted surgery versus open surgery, Outcome 1 Peritonitis.

Comparison 13 Cystoscopy‐assisted surgery versus open surgery, Outcome 2 Exit‐site/tunnel infection.
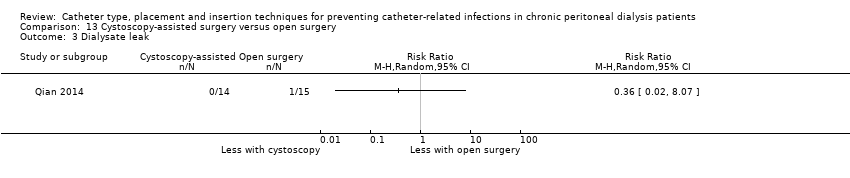
Comparison 13 Cystoscopy‐assisted surgery versus open surgery, Outcome 3 Dialysate leak.

Comparison 14 Laparoscopic Moncrief‐Popovich versus Trocar technique, Outcome 1 Peritonitis.

Comparison 14 Laparoscopic Moncrief‐Popovich versus Trocar technique, Outcome 2 Exit‐site infection.

Comparison 14 Laparoscopic Moncrief‐Popovich versus Trocar technique, Outcome 3 Dialysate leak.

Comparison 15 Single versus double cuff, Outcome 1 Peritonitis.
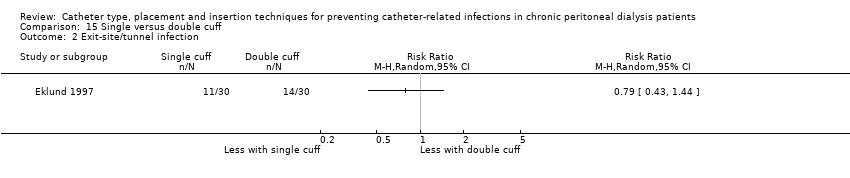
Comparison 15 Single versus double cuff, Outcome 2 Exit‐site/tunnel infection.
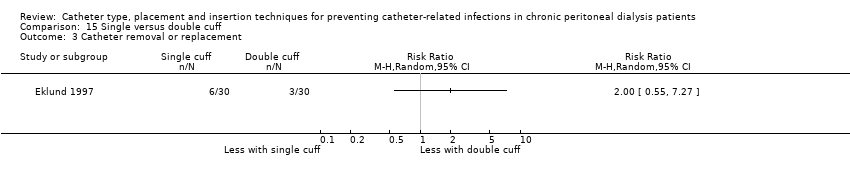
Comparison 15 Single versus double cuff, Outcome 3 Catheter removal or replacement.
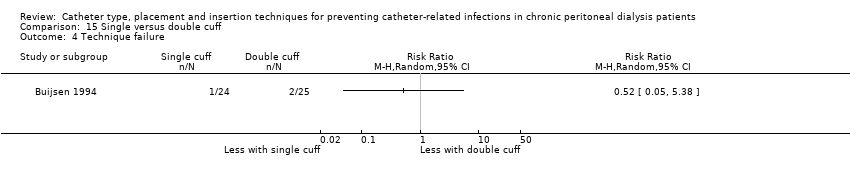
Comparison 15 Single versus double cuff, Outcome 4 Technique failure.

Comparison 15 Single versus double cuff, Outcome 5 Death (all causes).

Comparison 16 Triple cuff versus double catheter, Outcome 1 Peritonitis.

Comparison 16 Triple cuff versus double catheter, Outcome 2 Peritonitis rate (patient‐months).

Comparison 16 Triple cuff versus double catheter, Outcome 3 Exit‐site/tunnel infection.
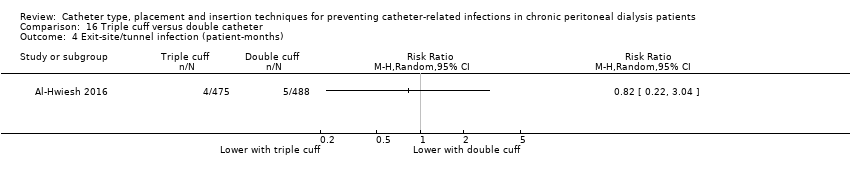
Comparison 16 Triple cuff versus double catheter, Outcome 4 Exit‐site/tunnel infection (patient‐months).

Comparison 16 Triple cuff versus double catheter, Outcome 5 Catheter removal or replacement.
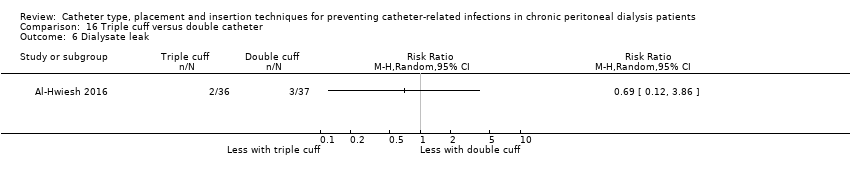
Comparison 16 Triple cuff versus double catheter, Outcome 6 Dialysate leak.

Comparison 17 Swan‐neck versus straight curled catheter, Outcome 1 Peritonitis.

Comparison 17 Swan‐neck versus straight curled catheter, Outcome 2 Peritonitis rate (patient‐months).
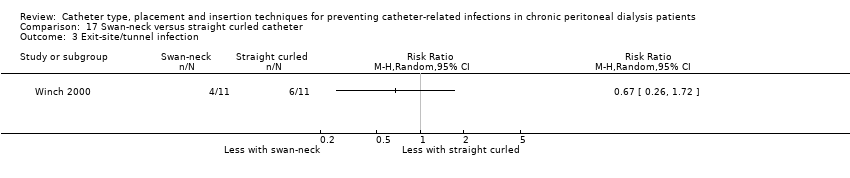
Comparison 17 Swan‐neck versus straight curled catheter, Outcome 3 Exit‐site/tunnel infection.
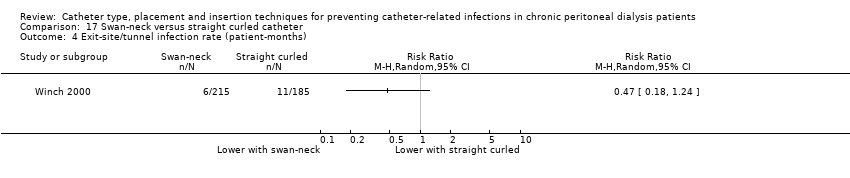
Comparison 17 Swan‐neck versus straight curled catheter, Outcome 4 Exit‐site/tunnel infection rate (patient‐months).

Comparison 17 Swan‐neck versus straight curled catheter, Outcome 5 Technique failure.

Comparison 17 Swan‐neck versus straight curled catheter, Outcome 6 Dialysate leak.

Comparison 18 Antibiotic‐treated catheter versus none, Outcome 1 Peritonitis.

Comparison 18 Antibiotic‐treated catheter versus none, Outcome 2 Exit‐site/tunnel infection.
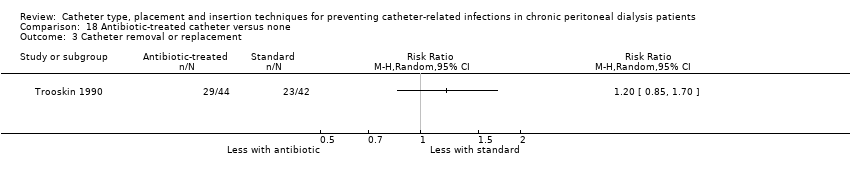
Comparison 18 Antibiotic‐treated catheter versus none, Outcome 3 Catheter removal or replacement.

Comparison 18 Antibiotic‐treated catheter versus none, Outcome 4 Death (all causes).

Comparison 19 Immobilisation versus no immobilisation, Outcome 1 Peritonitis.
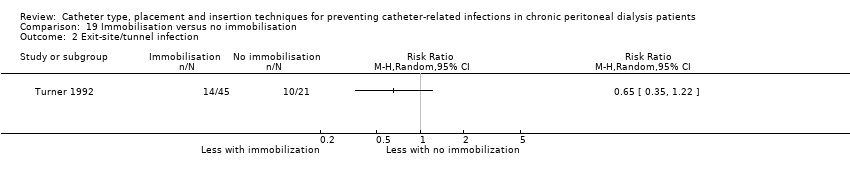
Comparison 19 Immobilisation versus no immobilisation, Outcome 2 Exit‐site/tunnel infection.

Comparison 20 Silver ring versus no silver ring, Outcome 1 Peritonitis.

Comparison 20 Silver ring versus no silver ring, Outcome 2 Exit‐site/tunnel infection.

Comparison 20 Silver ring versus no silver ring, Outcome 3 Technique failure.

Comparison 20 Silver ring versus no silver ring, Outcome 4 Death (all causes).
| Laparoscopy versus laparotomy for preventing catheter‐related infections in chronic peritoneal dialysis patients | |||||
| Patient or population: chronic peritoneal dialysis patients | |||||
| Outcomes | Anticipated absolute effects* (95% CI) | Relative effect | No. of participants or patient‐months | Certainty of the evidence | |
| Risk with laparotomy | Risk with laparoscopy | ||||
| Peritonitis | 242 per 1,000 | 218 per 1,000 | RR 0.90 | 315 (4) | ⊕⊕⊕⊝ |
| Peritonitis rate (patient‐months) | 59 per 1,000 | 52 per 1,000 | RR 0.89 | 375 (1) | ⊕⊝⊝⊝ |
| Exit‐site/tunnel infection | 125 per 1,000 | 125 per 1,000 | RR 1.00 | 270 (3) | ⊕⊕⊝⊝ |
| Catheter removal or replacement | 281 per 1,000 | 337 per 1,000 | RR 1.20 | 167 (3) | ⊕⊕⊝⊝ |
| Technique failure | 293 per 1,000 | 208 per 1,000 | RR 0.71 | 283 (4) | ⊕⊕⊝⊝ |
| Death (all causes) | 140 per 1,000 | 176 per 1,000 | RR 1.26 | 270 (3) | ⊕⊕⊕⊝ |
| *The risk in the intervention group (and its 95% confidence interval) is based on the assumed risk in the comparison group and the relative effect of the intervention (and its 95% CI). | |||||
| GRADE Working Group grades of evidence | |||||
| 1 Downgraded one level: suboptimal quality of studies 2 Downgraded two levels: single study with suboptimal quality and imprecision 3 Downgraded two levels: suboptimal quality and imprecision | |||||
| Buried (subcutaneous) versus non‐buried catheter for preventing catheter‐related infections in chronic peritoneal dialysis patients | |||||
| Patient or population: chronic peritoneal dialysis patients | |||||
| Outcomes | Anticipated absolute effects* (95% CI) | Relative effect | No. of participants or patient‐months | Certainty of the evidence | |
| Risk with non‐buried | Risk with buried (subcutaneous) | ||||
| Peritonitis rate (patient‐months) | 37 per 1,000 | 43 per 1,000 | RR 1.16 | 2511 (2) | ⊕⊝⊝⊝ |
| Exit‐site/tunnel infection rate (patient‐months) | 31 per 1,000 | 36 per 1,000 | RR 1.15 | 2511 (2) | ⊕⊝⊝⊝ |
| Technique failure | 367 per 1,000 | 268 per 1,000 | RR 0.73 | 60 (1) | ⊕⊝⊝⊝ |
| Death (all causes) | 169 per 1,000 | 153 per 1,000 | RR 0.90 | 119 (2) | ⊕⊕⊕⊝ |
| *The risk in the intervention group (and its 95% confidence interval) is based on the assumed risk in the comparison group and the relative effect of the intervention (and its 95% CI). | |||||
| GRADE Working Group grades of evidence | |||||
| 1 Downgraded three levels: suboptimal quality, inconsistency, and imprecision 2 Downgraded three levels: single study, suboptimal quality, and imprecision 3 Downgraded two levels: suboptimal quality of studies and imprecision | |||||
| Midline versus lateral insertion for preventing catheter‐related infections in chronic peritoneal dialysis patients | |||||
| Patient or population: chronic peritoneal dialysis patients | |||||
| Outcomes | Anticipated absolute effects* (95% CI) | Relative effect | No. of participants | Certainty of the evidence | |
| Risk with lateral | Risk with midline | ||||
| Peritonitis | 255 per 1,000 | 166 per 1,000 | RR 0.65 | 120 (2) | ⊕⊕⊕⊝ |
| Exit‐site/tunnel infection | 78 per 1,000 | 44 per 1,000 | RR 0.56 | 120 (2) | ⊕⊕⊝⊝ |
| Catheter removal or replacement | 514 per 1,000 | 293 per 1,000 | RR 0.57 | 83 (1) | ⊕⊝⊝⊝ VERY LOW 3 |
| Death (all causes) | 0 per 1,000 | 0 per 1,000 | RR 8.50 | 37 (1) | ⊕⊝⊝⊝ |
| *The risk in the intervention group (and its 95% confidence interval) is based on the assumed risk in the comparison group and the relative effect of the intervention (and its 95% CI). | |||||
| GRADE Working Group grades of evidence | |||||
| 1 Downgraded one level: suboptimal quality of studies 2 Downgraded two levels: suboptimal quality and imprecision 3 Downgraded three levels: single study, suboptimal quality study, and imprecision | |||||
| Percutaneous insertion versus open surgery for preventing catheter‐related infections in chronic peritoneal dialysis patients | |||||
| Patient or population: chronic peritoneal dialysis patients | |||||
| Outcomes | Anticipated absolute effects* (95% CI) | Relative effect | No. of participants | Certainty of the evidence | |
| Risk with open surgery | Risk with percutaneous insertion | ||||
| Exit‐site/tunnel infection | 106 per 1,000 | 17 per 1,000 | RR 0.16 | 96 | ⊕⊕⊕⊝ |
| Catheter removal or replacement | 133 per 1,000 | 32 per 1,000 | RR 0.24 | 61 | ⊕⊝⊝⊝ |
| *The risk in the intervention group (and its 95% confidence interval) is based on the assumed risk in the comparison group and the relative effect of the intervention (and its 95% CI). | |||||
| GRADE Working Group grades of evidence | |||||
| 1 Downgraded one level: suboptimal quality of studies 2 Downgraded two levels: single study with suboptimal quality and imprecision | |||||
| Straight versus coiled catheters for preventing catheter‐related infections in chronic peritoneal dialysis patients | |||||
| Patient or population: chronic peritoneal dialysis patients | |||||
| Outcomes | Anticipated absolute effects* (95% CI) | Relative effect | No. of participants or patient‐months | Certainty of the evidence | |
| Risk with coiled | Risk with straight | ||||
| Peritonitis | 217 per 1,000 | 225 per 1,000 | RR 1.04 | 818 (9) | ⊕⊕⊕⊝ |
| Peritonitis rate (patient‐months) | 32 per 1,000 | 29 per 1,000 | RR 0.91 | 5882 (5) | ⊕⊕⊕⊝ |
| Exit‐site/tunnel infection | 281 per 1,000 | 314 per 1,000 | RR 1.12 | 826 (10) | ⊕⊕⊕⊝ |
| Exit‐site/tunnel infection rate (patient‐months) | 27 per 1,000 | 28 per 1,000 | RR 1.05 | 5286 (4) | ⊕⊕⊕⊝ |
| Catheter removal or replacement | 249 per 1,000 | 276 per 1,000 | RR 1.11 | 713 (9) | ⊕⊝⊝⊝ |
| Technique failure | 131 per 1,000 | 108 per 1,000 | RR 0.82 | 442 (4) | ⊕⊕⊕⊝ |
| Death (all causes) | 124 per 1,000 | 117 per 1,000 | RR 0.95 | 703 (8) | ⊕⊕⊝⊝ |
| *The risk in the intervention group (and its 95% confidence interval) is based on the assumed risk in the comparison group and the relative effect of the intervention (and its 95% CI). | |||||
| GRADE Working Group grades of evidence | |||||
| 1 Downgraded one level: most studies are of suboptimal quality 2 Downgrade one level: inconsistency 3 Downgraded one level: publication bias | |||||
| Tenckhoff catheter with artificial curve at tunnel tract versus swan‐neck for preventing catheter‐related infections in chronic peritoneal dialysis patients | |||||
| Patient or population: preventing catheter‐related infections in chronic peritoneal dialysis patients | |||||
| Outcomes | Anticipated absolute effects* (95% CI) | Relative effect | No. of participants or patient‐months | Certainty of the evidence | |
| Risk with swan‐neck | Risk with Tenckhoff | ||||
| Peritonitis | 329 per 1,000 | 424 per 1,000 | RR 1.29 | 140 (2) | ⊕⊕⊝⊝ |
| Peritonitis rate (patient‐months) | 47 per 1,000 | 57 per 1,000 | RR 1.22 | 2535 (2) | ⊕⊕⊝⊝ |
| Exit‐site/tunnel infection | 671 per 1,000 | 645 per 1,000 | RR 0.96 | 140 (2) | ⊕⊕⊕⊝ |
| Exit‐site/tunnel infection rate (patient‐months) | 83 per 1,000 | 55 per 1,000 | RR 0.67 | 2535 (2) | ⊕⊕⊕⊝ |
| Catheter removal or replacement | 229 per 1,000 | 194 per 1,000 | RR 0.85 | 140 (2) | ⊕⊕⊕⊝ |
| Technique failure | 157 per 1,000 | 101 per 1,000 | RR 0.64 | 140 (2) | ⊕⊕⊕⊝ |
| Death (all causes) | 114 per 1,000 | 85 per 1,000 | RR 0.74 | 140 (2) | ⊕⊕⊝⊝ |
| *The risk in the intervention group (and its 95% confidence interval) is based on the assumed risk in the comparison group and the relative effect of the intervention (and its 95% CI). | |||||
| GRADE Working Group grades of evidence | |||||
| 1 Downgraded two levels: suboptimal quality of studies and imprecision 2 Downgraded two levels: suboptimal quality of studies and inconsistency 3 Downgraded one level: suboptimal quality of studies | |||||
| Self‐locating versus straight Tenckhoff catheter for preventing catheter‐related infections in chronic peritoneal dialysis patients | |||||
| Patient or population: chronic peritoneal dialysis patients | |||||
| Outcomes | Anticipated absolute effects* (95% CI) | Relative effect | No. of participants | Certainty of the evidence | |
| Risk with straight Tenckhoff | Risk with self‐locating | ||||
| Peritonitis | 684 per 1,000 | 773 per 1,000 | RR 1.13 | 78 (1) | ⊕⊝⊝⊝ |
| Exit‐site/tunnel infection | 184 per 1,000 | 175 per 1,000 | RR 0.95 | 78 (1) | ⊕⊝⊝⊝ |
| Catheter removal or replacement | 343 per 1,000 | 110 per 1,000 | RR 0.32 | 139 (2) | ⊕⊝⊝⊝ |
| Technique failure | 414 per 1,000 | 265 per 1,000 | RR 0.64 | 139 (2) | ⊕⊕⊕⊝ |
| Death (all causes) | 71 per 1,000 | 73 per 1,000 | RR 1.02 | 139 (2) | ⊕⊕⊝⊝ |
| *The risk in the intervention group (and its 95% confidence interval) is based on the assumed risk in the comparison group and the relative effect of the intervention (and its 95% CI). | |||||
| GRADE Working Group grades of evidence | |||||
| 1 Downgraded three levels: single study, suboptimal quality, and imprecision 2 Downgraded three levels: suboptimal quality, imprecision and inconsistency 3 Downgraded one level: suboptimal quality of study 4 Downgraded two levels: suboptimal quality and imprecision | |||||
| Study ID | Intervention | Control group | ||
| Events | Total | Events | Total | |
| Haematoma or haemoperitoneum | ||||
| 1 | 31 | 4 | 30 | |
| 7 | 34 | 4 | 32 | |
| 7 | 40 | 6 | 38 | |
| 0 | 36 | 0 | 37 | |
| 0 | 18 | 2 | 17 | |
| 3 | 99 | 2 | 90 | |
| 0 | 20 | 0 | 20 | |
| 0 | 20 | 0 | 20 | |
| 14 | 20 | 22 | 19 | |
| 1 | 48 | 1 | 35 | |
| 0 | 30 | 1 | 59 | |
| 1 | 103 | 0 | 49 | |
| Dialysate leak | ||||
| 2 | 34 | 1 | 32 | |
| 9 | 40 | 7 | 38 | |
| 7 | 40 | 6 | 37 | |
| 1 | 31 | 1 | 30 | |
| 2 | 36 | 3 | 37 | |
| 2 | 10 | 4 | 12 | |
| 0 | 20 | 2 | 20 | |
| 0 | 20 | 4 | 20 | |
| 0 | 20 | 0 | 20 | |
| 1 | 38 | 0 | 34 | |
| 0 | 99 | 3 | 90 | |
| 0 | 14 | 1 | 15 | |
| 6 | 48 | 3 | 35 | |
| 2 | 30 | 0 | 59 | |
| 1 | 29 | 3 | 32 | |
| 4 | 57 | 10 | 56 | |
| 2 | 11 | 0 | 11 | |
| 2 | 21 | 0 | 24 | |
| 1 | 40 | 0 | 40 | |
| 0 | 50 | 0 | 51 | |
| 0 | 103 | 1 | 49 | |
| Viscus perforation | ||||
| Nielsen 1995 (bladder perforation) | 0 | 38 | 1 | 34 |
| Al‐Hwiesh 2016 (bowel perforation) | 0 | 36 | 0 | 37 |
| Merrikhi 2014 (hollow viscus perforation) | 0 | 18 | 0 | 17 |
| 0 | 31 | 0 | 30 | |
| Outflow failure or catheter tip migration | ||||
| 1 | 31 | 4 | 30 | |
| 2 | 20 | 1 | 19 | |
| 12 | 40 | 25 | 38 | |
| 3 | 57 | 4 | 56 | |
| 1 | 36 | 11 | 37 | |
| 1 | 30 | 2 | 59 | |
| 3 | 20 | 1 | 20 | |
| 0 | 14 | 1 | 15 | |
| 1 | 10 | 3 | 12 | |
| 1 | 11 | 1 | 11 | |
| Hernia | ||||
| 0 | 34 | 1 | 32 | |
| 2 | 40 | 1 | 37 | |
| 7 | 40 | 7 | 38 | |
| 4 | 99 | 6 | 90 | |
| 2 | 40 | 2 | 40 | |
| 4 | 57 | 8 | 56 | |
| 0 | 103 | 1 | 49 | |
| Name of studies | Relative risk | 95% CI | P value |
| Peritonitis | |||
| Methods of catheter implantation | |||
| 1.41 | 0.25 to 7.91 | 0.69 | |
| 1.20 | 0.59 to 2.42 | 0.61 | |
| 0.93 | 0.48 to 1.80 | 0.82 | |
| 0.39 | 0.11 to 1.42 | 0.15 | |
| 0.81 | 0.41 to 1.61 | 0.55 | |
| 0.21 | 0.03 to 1.61 | 0.13 | |
| 0.60 | 0.20 to 1.81 | 0.36 | |
| Types of catheter | |||
| 0.82 | 0.50 to 1.35 | 0.44 | |
| 0.34 | 0.07 to 1.59 | 0.17 | |
| 0.80 | 0.29 to 2.21 | 0.67 | |
| 0.78 | 0.6 to 1.69 | 0.53 | |
| Other intervention | |||
| 0.90 | 0.49 to 1.66 | 0.73 | |
| 1.20 | 0.59 to 2.42 | 0.61 | |
| Peritonitis rate (patient‐month) | |||
| Methods of catheter implantation | |||
| 1.40 | 0.23 to 8.34 | 0.71 | |
| 0.67 | 0.38 to 1.18 | 0.16 | |
| Types of catheters | |||
| 0.34 | 0.07 to 1.69 | 0.19 | |
| 0.69 | 0.19 to 2.53 | 0.57 | |
| CI: confidence interval | |||
| Outcome or subgroup title | No. of studies | No. of participants | Statistical method | Effect size |
| 1 Peritonitis Show forest plot | 4 | 315 | Risk Ratio (M‐H, Random, 95% CI) | 0.90 [0.59, 1.35] |
| 2 Peritonitis rate (patient‐months) Show forest plot | 1 | Risk Ratio (M‐H, Random, 95% CI) | Totals not selected | |
| 3 Exit‐site/tunnel infection Show forest plot | 3 | 270 | Risk Ratio (M‐H, Random, 95% CI) | 1.00 [0.43, 2.31] |
| 4 Catheter removal or replacement Show forest plot | 3 | 167 | Risk Ratio (M‐H, Random, 95% CI) | 1.20 [0.77, 1.86] |
| 5 Technique failure Show forest plot | 4 | 283 | Risk Ratio (M‐H, Random, 95% CI) | 0.71 [0.47, 1.08] |
| 6 Death (all causes) Show forest plot | 3 | 270 | Risk Ratio (M‐H, Random, 95% CI) | 1.26 [0.72, 2.20] |
| 7 Dialysate leak Show forest plot | 3 | 167 | Risk Ratio (M‐H, Random, 95% CI) | 0.85 [0.10, 6.97] |
| Outcome or subgroup title | No. of studies | No. of participants | Statistical method | Effect size |
| 1 Peritonitis rate (patient‐months) Show forest plot | 2 | 2511 | Risk Ratio (M‐H, Random, 95% CI) | 1.16 [0.37, 3.60] |
| 2 Exit‐site/tunnel infection rate (patient‐months) Show forest plot | 2 | 2511 | Risk Ratio (M‐H, Random, 95% CI) | 1.15 [0.39, 3.42] |
| 3 Technique failure Show forest plot | 1 | Risk Ratio (M‐H, Random, 95% CI) | Totals not selected | |
| 4 Death (all causes) Show forest plot | 2 | 119 | Risk Ratio (M‐H, Random, 95% CI) | 0.90 [0.39, 2.08] |
| Outcome or subgroup title | No. of studies | No. of participants | Statistical method | Effect size |
| 1 Peritonitis Show forest plot | 2 | 120 | Risk Ratio (M‐H, Random, 95% CI) | 0.65 [0.32, 1.33] |
| 2 Exit‐site/tunnel infection Show forest plot | 2 | 120 | Risk Ratio (M‐H, Random, 95% CI) | 0.56 [0.12, 2.58] |
| 3 Catheter removal or replacement Show forest plot | 1 | Risk Ratio (M‐H, Random, 95% CI) | Totals not selected | |
| 4 Death (all causes) Show forest plot | 1 | Risk Ratio (M‐H, Random, 95% CI) | Totals not selected | |
| Outcome or subgroup title | No. of studies | No. of participants | Statistical method | Effect size |
| 1 Exit‐site/tunnel infection Show forest plot | 2 | 96 | Risk Ratio (M‐H, Random, 95% CI) | 0.16 [0.02, 1.30] |
| 2 Catheter removal or replacement Show forest plot | 1 | Risk Ratio (M‐H, Random, 95% CI) | Totals not selected | |
| 3 Postoperative bleed (haematoma or haemoperitoneum) Show forest plot | 2 | 96 | Risk Ratio (M‐H, Random, 95% CI) | 0.22 [0.04, 1.26] |
| Outcome or subgroup title | No. of studies | No. of participants | Statistical method | Effect size |
| 1 Peritonitis Show forest plot | 9 | 818 | Risk Ratio (M‐H, Random, 95% CI) | 1.04 [0.82, 1.31] |
| 2 Peritonitis rate (patient‐months) Show forest plot | 5 | 5882 | Risk Ratio (M‐H, Random, 95% CI) | 0.91 [0.68, 1.21] |
| 3 Exit‐site/tunnel infection Show forest plot | 10 | 826 | Risk Ratio (M‐H, Random, 95% CI) | 1.12 [0.94, 1.34] |
| 4 Exit‐site/tunnel infection rate (patient‐months) Show forest plot | 4 | 5286 | Risk Ratio (M‐H, Random, 95% CI) | 1.05 [0.77, 1.43] |
| 5 Catheter removal or replacement Show forest plot | 9 | 713 | Risk Ratio (M‐H, Random, 95% CI) | 1.11 [0.73, 1.66] |
| 6 Technique failure Show forest plot | 4 | 442 | Risk Ratio (M‐H, Random, 95% CI) | 0.82 [0.51, 1.31] |
| 7 Death (all causes) Show forest plot | 8 | 703 | Risk Ratio (M‐H, Random, 95% CI) | 0.95 [0.62, 1.46] |
| 8 Peritonitis (studies with low risk of attrition bias) Show forest plot | 4 | 345 | Risk Ratio (M‐H, Random, 95% CI) | 0.93 [0.69, 1.26] |
| 9 Peritonitis rate (patient‐months) (studies with low risk of attrition bias) Show forest plot | 3 | 1771 | Risk Ratio (M‐H, Random, 95% CI) | 0.91 [0.61, 1.35] |
| 10 Exit‐site/tunnel infection (studies with low risk of attrition bias) Show forest plot | 6 | 425 | Risk Ratio (M‐H, Random, 95% CI) | 1.14 [0.94, 1.39] |
| 11 Exit‐site/tunnel infection rate (patient‐months) (studies with low risk of attrition bias) Show forest plot | 2 | 1175 | Risk Ratio (M‐H, Random, 95% CI) | 1.18 [0.76, 1.82] |
| 12 Catheter removal or replacement (studies with low risk of attrition bias) Show forest plot | 5 | 329 | Risk Ratio (M‐H, Random, 95% CI) | 0.78 [0.45, 1.33] |
| 13 Dialysate leak Show forest plot | 7 | 550 | Risk Ratio (M‐H, Random, 95% CI) | 0.74 [0.16, 3.49] |
| 14 Postoperative bleeding (haematoma or haemoperitoneum) Show forest plot | 4 | 358 | Risk Ratio (M‐H, Random, 95% CI) | 1.14 [0.24, 5.34] |
| Outcome or subgroup title | No. of studies | No. of participants | Statistical method | Effect size |
| 1 Peritonitis Show forest plot | 2 | 140 | Risk Ratio (M‐H, Random, 95% CI) | 1.29 [0.85, 1.96] |
| 2 Peritonitis rate (patient‐months) Show forest plot | 2 | 2535 | Risk Ratio (M‐H, Random, 95% CI) | 1.22 [0.54, 2.75] |
| 3 Exit‐site/tunnel infection Show forest plot | 2 | 140 | Risk Ratio (M‐H, Random, 95% CI) | 0.96 [0.77, 1.21] |
| 4 Exit‐site/tunnel infection rate (patient‐months) Show forest plot | 2 | 2535 | Risk Ratio (M‐H, Random, 95% CI) | 0.67 [0.50, 0.90] |
| 5 Catheter removal or replacement Show forest plot | 2 | 140 | Risk Ratio (M‐H, Random, 95% CI) | 0.85 [0.42, 1.72] |
| 6 Technique failure Show forest plot | 2 | 140 | Risk Ratio (M‐H, Random, 95% CI) | 0.64 [0.26, 1.58] |
| 7 Death (all causes) Show forest plot | 2 | 140 | Risk Ratio (M‐H, Random, 95% CI) | 0.74 [0.27, 2.03] |
| Outcome or subgroup title | No. of studies | No. of participants | Statistical method | Effect size |
| 1 Peritonitis Show forest plot | 1 | Risk Ratio (M‐H, Random, 95% CI) | Totals not selected | |
| 2 Exit‐site/tunnel infection Show forest plot | 1 | Risk Ratio (M‐H, Random, 95% CI) | Totals not selected | |
| 3 Catheter removal or replacement Show forest plot | 2 | 139 | Risk Ratio (M‐H, Random, 95% CI) | 0.32 [0.03, 3.06] |
| 4 Technique failure Show forest plot | 2 | 139 | Risk Ratio (M‐H, Random, 95% CI) | 0.64 [0.39, 1.04] |
| 5 Death (all causes) Show forest plot | 2 | 139 | Risk Ratio (M‐H, Random, 95% CI) | 1.02 [0.11, 9.75] |
| 6 Dialysate leak Show forest plot | 2 | 139 | Risk Ratio (M‐H, Random, 95% CI) | 1.04 [0.46, 2.35] |
| Outcome or subgroup title | No. of studies | No. of participants | Statistical method | Effect size |
| 1 Peritonitis Show forest plot | 1 | Risk Ratio (M‐H, Random, 95% CI) | Totals not selected | |
| 2 Peritonitis rate (patient‐months) Show forest plot | 1 | Risk Ratio (M‐H, Random, 95% CI) | Totals not selected | |
| 3 Exit‐site/tunnel infection Show forest plot | 1 | Risk Ratio (M‐H, Random, 95% CI) | Totals not selected | |
| 4 Exit‐site/tunnel infection rate (patient‐month) Show forest plot | 1 | Risk Ratio (M‐H, Random, 95% CI) | Totals not selected | |
| 5 Catheter removal or replacement Show forest plot | 1 | Risk Ratio (M‐H, Random, 95% CI) | Totals not selected | |
| 6 Technique failure Show forest plot | 1 | Risk Ratio (M‐H, Random, 95% CI) | Totals not selected | |
| 7 Death (all causes) Show forest plot | 1 | Risk Ratio (M‐H, Random, 95% CI) | Totals not selected | |
| 8 Dialysate leak Show forest plot | 1 | Risk Ratio (M‐H, Random, 95% CI) | Totals not selected | |
| 9 Postoperative bleed (haematoma or haemoperitoneum) Show forest plot | 1 | Risk Ratio (M‐H, Random, 95% CI) | Totals not selected | |
| Outcome or subgroup title | No. of studies | No. of participants | Statistical method | Effect size |
| 1 Peritonitis Show forest plot | 1 | Risk Ratio (M‐H, Random, 95% CI) | Totals not selected | |
| 2 Exit‐site/tunnel infection Show forest plot | 1 | Risk Ratio (M‐H, Random, 95% CI) | Totals not selected | |
| 3 Catheter removal or replacement Show forest plot | 1 | Risk Ratio (M‐H, Random, 95% CI) | Totals not selected | |
| 4 Dialysate leak Show forest plot | 1 | Risk Ratio (M‐H, Random, 95% CI) | Totals not selected | |
| 5 Postoperative bleed (haematoma or haemoperitoneum) Show forest plot | 1 | Risk Ratio (M‐H, Random, 95% CI) | Totals not selected | |
| Outcome or subgroup title | No. of studies | No. of participants | Statistical method | Effect size |
| 1 Peritonitis Show forest plot | 1 | Risk Ratio (M‐H, Random, 95% CI) | Totals not selected | |
| 2 Exit‐site/tunnel infection Show forest plot | 1 | Risk Ratio (M‐H, Random, 95% CI) | Totals not selected | |
| 3 Death (all causes) Show forest plot | 1 | Risk Ratio (M‐H, Random, 95% CI) | Totals not selected | |
| Outcome or subgroup title | No. of studies | No. of participants | Statistical method | Effect size |
| 1 Peritonitis rate (patient‐month) Show forest plot | 1 | Risk Ratio (M‐H, Random, 95% CI) | Totals not selected | |
| 2 Exit‐site/tunnel infection (patient‐months) Show forest plot | 1 | Risk Ratio (M‐H, Random, 95% CI) | Totals not selected | |
| 3 Catheter removal or replacement Show forest plot | 1 | Risk Ratio (M‐H, Random, 95% CI) | Totals not selected | |
| 4 Death (all causes) Show forest plot | 1 | Risk Ratio (M‐H, Random, 95% CI) | Totals not selected | |
| 5 Dialysate leak Show forest plot | 1 | Risk Ratio (M‐H, Random, 95% CI) | Totals not selected | |
| Outcome or subgroup title | No. of studies | No. of participants | Statistical method | Effect size |
| 1 Peritonitis Show forest plot | 1 | Risk Ratio (M‐H, Random, 95% CI) | Totals not selected | |
| 2 Exit‐site/tunnel infection Show forest plot | 1 | Risk Ratio (M‐H, Random, 95% CI) | Totals not selected | |
| 3 Dialysate leak Show forest plot | 1 | Risk Ratio (M‐H, Random, 95% CI) | Totals not selected | |
| Outcome or subgroup title | No. of studies | No. of participants | Statistical method | Effect size |
| 1 Peritonitis Show forest plot | 1 | Risk Ratio (M‐H, Random, 95% CI) | Totals not selected | |
| 2 Exit‐site infection Show forest plot | 1 | Risk Ratio (M‐H, Random, 95% CI) | Totals not selected | |
| 3 Dialysate leak Show forest plot | 1 | Risk Ratio (M‐H, Random, 95% CI) | Totals not selected | |
| Outcome or subgroup title | No. of studies | No. of participants | Statistical method | Effect size |
| 1 Peritonitis Show forest plot | 1 | Risk Ratio (M‐H, Random, 95% CI) | Totals not selected | |
| 2 Exit‐site/tunnel infection Show forest plot | 1 | Risk Ratio (M‐H, Random, 95% CI) | Totals not selected | |
| 3 Catheter removal or replacement Show forest plot | 1 | Risk Ratio (M‐H, Random, 95% CI) | Totals not selected | |
| 4 Technique failure Show forest plot | 1 | Risk Ratio (M‐H, Random, 95% CI) | Totals not selected | |
| 5 Death (all causes) Show forest plot | 1 | Risk Ratio (M‐H, Random, 95% CI) | Totals not selected | |
| Outcome or subgroup title | No. of studies | No. of participants | Statistical method | Effect size |
| 1 Peritonitis Show forest plot | 1 | Risk Ratio (M‐H, Random, 95% CI) | Totals not selected | |
| 2 Peritonitis rate (patient‐months) Show forest plot | 1 | Risk Ratio (M‐H, Random, 95% CI) | Totals not selected | |
| 3 Exit‐site/tunnel infection Show forest plot | 1 | Risk Ratio (M‐H, Random, 95% CI) | Totals not selected | |
| 4 Exit‐site/tunnel infection (patient‐months) Show forest plot | 1 | Risk Ratio (M‐H, Random, 95% CI) | Totals not selected | |
| 5 Catheter removal or replacement Show forest plot | 1 | Risk Ratio (M‐H, Random, 95% CI) | Totals not selected | |
| 6 Dialysate leak Show forest plot | 1 | Risk Ratio (M‐H, Random, 95% CI) | Totals not selected | |
| Outcome or subgroup title | No. of studies | No. of participants | Statistical method | Effect size |
| 1 Peritonitis Show forest plot | 1 | Risk Ratio (M‐H, Random, 95% CI) | Totals not selected | |
| 2 Peritonitis rate (patient‐months) Show forest plot | 1 | Risk Ratio (M‐H, Random, 95% CI) | Totals not selected | |
| 3 Exit‐site/tunnel infection Show forest plot | 1 | Risk Ratio (M‐H, Random, 95% CI) | Totals not selected | |
| 4 Exit‐site/tunnel infection rate (patient‐months) Show forest plot | 1 | Risk Ratio (M‐H, Random, 95% CI) | Totals not selected | |
| 5 Technique failure Show forest plot | 1 | Risk Ratio (M‐H, Random, 95% CI) | Totals not selected | |
| 6 Dialysate leak Show forest plot | 1 | Risk Ratio (M‐H, Random, 95% CI) | Totals not selected | |
| Outcome or subgroup title | No. of studies | No. of participants | Statistical method | Effect size |
| 1 Peritonitis Show forest plot | 1 | Risk Ratio (M‐H, Random, 95% CI) | Totals not selected | |
| 2 Exit‐site/tunnel infection Show forest plot | 1 | Risk Ratio (M‐H, Random, 95% CI) | Totals not selected | |
| 3 Catheter removal or replacement Show forest plot | 1 | Risk Ratio (M‐H, Random, 95% CI) | Totals not selected | |
| 4 Death (all causes) Show forest plot | 1 | Risk Ratio (M‐H, Random, 95% CI) | Totals not selected | |
| Outcome or subgroup title | No. of studies | No. of participants | Statistical method | Effect size |
| 1 Peritonitis Show forest plot | 1 | Risk Ratio (M‐H, Random, 95% CI) | Totals not selected | |
| 2 Exit‐site/tunnel infection Show forest plot | 1 | Risk Ratio (M‐H, Random, 95% CI) | Totals not selected | |
| 3 Technique failure Show forest plot | 1 | Risk Ratio (M‐H, Random, 95% CI) | Totals not selected | |
| 4 Death (all causes) Show forest plot | 1 | Risk Ratio (M‐H, Random, 95% CI) | Totals not selected | |