Tipo de catéter y técnicas de colocación e inserción para la prevención de infecciones relacionadas con el catéter en pacientes en diálisis peritoneal crónica
Resumen
Antecedentes
La peritonitis es uno de los factores limitantes para el desarrollo de la diálisis peritoneal (DP) en todo el mundo y es una de las principales causas de fracaso de la técnica. Varios estudios han examinado la efectividad de diversas intervenciones relacionadas con el catéter para reducir el riesgo de peritonitis relacionada con la DP. Ésta es una actualización de una revisión publicada por primera vez en 2004.
Objetivos
Evaluar la función de las diferentes técnicas de implantación y tipos de catéter en la reducción del riesgo de peritonitis relacionada con la DP en pacientes en DP.
Métodos de búsqueda
Se realizaron búsquedas en el registro de estudios del Grupo Cochrane de Riñón y Trasplante hasta el 15 de enero 2019, mediante el contacto con el especialista en información y el uso de términos de búsqueda relevantes para esta revisión. Los estudios en el registro se identifican mediante búsquedas en CENTRAL, MEDLINE y EMBASE, en actas de congresos, en el International Clinical Trials Register (ICTRP) Search Portal, y en ClinicalTrials.gov.
Criterios de selección
Se incluyeron los estudios que compararon diferentes técnicas de inserción, tipos de catéter, uso de técnicas de inmovilización y diferentes períodos de adaptación. Se excluyeron los estudios de diferentes conjuntos de DP.
Obtención y análisis de los datos
Dos autores evaluaron de forma independiente la calidad de los estudios y extrajeron los datos. Se realizaron análisis estadísticos con el modelo de efectos aleatorizados, y los resultados se expresaron como cocientes de riesgos (CR) con intervalos de confianza (IC) del 95%.
Resultados principales
Se incluyeron 42 estudios (3 144 participantes): 18 evaluaron técnicas de implantación del catéter, 22 examinaron los tipos de catéteres, uno evaluó un dispositivo inmovilizador y uno examinó el período de adaptación. En general, la calidad de los estudios fue variable y casi todos los aspectos del diseño del estudio no cumplieron con los estándares CONSORT para la presentación de informes.
La inserción del catéter por laparoscopia comparada con la laparotomía probablemente implique poca o ninguna diferencia en los riesgos de peritonitis (CR 0,90; IC del 95%: 0,59 a 1,35; evidencia de certeza moderada), infección del sitio de salida/túnel (CR 1,00; IC del 95%: 0,43 a 2,31; evidencia de certeza baja), extracción/reemplazo del catéter (CR 1,20; IC del 95%: 0,77 a 1,86; evidencia de certeza baja), fracaso de la técnica (CR 0,71; IC del 95%: 0,47 a 1,08; evidencia de certeza baja) y muerte (todas las causas) (CR 1,26; IC del 95%: 0,72 a 2,20; evidencia de certeza moderada). No se sabe si la inserción subcutánea profunda del catéter aumenta la peritonitis (CR 1,16; IC del 95%: 0,37 a 3,60; evidencia de certeza muy baja). La inserción en la línea media en comparación con la inserción lateral probablemente implique poca o ninguna diferencia en los riesgos de peritonitis (CR 0,65; IC del 95%: 0,32 a 1,33; evidencia de certeza moderada) y puede hacer poca o ninguna diferencia en la infección del sitio de salida/túnel (CR 0,56; IC del 95%: 0,12 a 2,58; evidencia de certeza baja). La inserción percutánea comparada con la cirugía abierta probablemente implique poca o ninguna diferencia en la infección del sitio de salida/túnel (CR 0,16; IC del 95%: 0,02 a 1,30; evidencia de certeza moderada).
Los catéteres rectos probablemente resulten en poca o ninguna diferencia en el riesgo de peritonitis (CR 1,04; IC del 95%: 0,82 a 1,31; evidencia de certeza moderada), tasa de peritonitis (CR 0,91; IC del 95%: 0,68 a 1).21; evidencia de certeza moderada), riesgo de infección del sitio de salida (CR 1,12; IC del 95%: 0,94 a 1,34; evidencia de certeza moderada) y tasa de infección del sitio de salida (CR 1,05; IC del 95%: 0,77 a 1,43; evidencia de certeza moderada) en comparación con el catéter en espiral. No está claro si los catéteres rectos previenen la extracción o el reemplazo del catéter (CR 1,11; IC del 95%: 0,73 a 1,66; evidencia de certeza muy baja), pero los catéteres rectos probablemente resulten en poca o ninguna diferencia en el fracaso de la técnica (CR 0,82; IC del 95%: 0,51 a 1,31; evidencia de certeza moderada) y la muerte (todas las causas) (CR 0,95; IC del 95%: 0,62 a 1,46; evidencia de certeza baja) en comparación con los catéteres en espiral. El catéter Tenckhoff con curva artificial en el tracto subcutáneo comparado con el catéter de cuello de cisne puede resultar en poca o ninguna diferencia en la peritonitis (CR 1,29; IC del 95%: 0,85 a 1,96; evidencia de certeza baja) y la incidencia de infección en el sitio de salida/túnel (CR 0,96; IC del 95%: 0,77 a 1,21; evidencia de certeza baja), pero puede mejorar levemente la tasa de infección en el sitio de salida (CR 0,67; IC del 95%: 0,50 a 0,90; evidencia de certeza baja).
Conclusiones de los autores
No existe evidencia sólida de que cualquier intervención relacionada con el catéter, incluido el uso de diferentes tipos o diferentes técnicas de inserción, reduzca los riesgos de peritonitis por DP u otras infecciones relacionadas con la DP, fracaso de la técnica o muerte (todas las causas). Sin embargo, el número y el tamaño de los estudios fueron generalmente pequeños y la calidad metodológica de los estudios disponibles fue subóptima, de manera que la posibilidad de que una intervención particular relacionada con el uso del catéter pueda tener un efecto beneficioso no se puede descartar con seguridad.
PICOs
Resumen en términos sencillos
Tipo de catéter y técnicas de colocación e inserción para la prevención de la peritonitis en pacientes en diálisis peritoneal
¿Cuál es el problema?
Los pacientes con insuficiencia renal pueden ser tratados con diálisis peritoneal, que consiste en insertar un catéter permanente en el peritoneo (revestimiento alrededor del contenido abdominal) a través de la pared abdominal y hacer circular líquido estéril hacia fuera y hacia adentro varias veces al día. La complicación grave más frecuente es la infección del peritoneo, la peritonitis. Esta infección puede ser causada por gérmenes que se introducen accidentalmente a través del catéter en el peritoneo, lo que lleva a la peritonitis.
¿Qué se hizo?
Se realizó una revisión de la bibliografía para examinar los efectos de diferentes métodos de inserción y diferentes tipos de catéter en la prevención de la peritonitis en pacientes en DP.
¿Qué se encontró?
Se identificaron 42 estudios (3144 participantes) que examinaron los efectos de diferentes métodos de inserción y tipos de catéter sobre la peritonitis. El riesgo de peritonitis no se vio afectado por los diferentes métodos de inserción ni por el tipo de catéter insertado.
Conclusions
No existe evidencia para apoyar una técnica específica de inserción o un tipo de catéter con el objetivo de prevenir la peritonitis en pacientes en diálisis peritoneal.
Conclusiones de los autores
Summary of findings
| Laparoscopy versus laparotomy for preventing catheter‐related infections in chronic peritoneal dialysis patients | |||||
| Patient or population: chronic peritoneal dialysis patients | |||||
| Outcomes | Anticipated absolute effects* (95% CI) | Relative effect | No. of participants or patient‐months | Certainty of the evidence | |
| Risk with laparotomy | Risk with laparoscopy | ||||
| Peritonitis | 242 per 1,000 | 218 per 1,000 | RR 0.90 | 315 (4) | ⊕⊕⊕⊝ |
| Peritonitis rate (patient‐months) | 59 per 1,000 | 52 per 1,000 | RR 0.89 | 375 (1) | ⊕⊝⊝⊝ |
| Exit‐site/tunnel infection | 125 per 1,000 | 125 per 1,000 | RR 1.00 | 270 (3) | ⊕⊕⊝⊝ |
| Catheter removal or replacement | 281 per 1,000 | 337 per 1,000 | RR 1.20 | 167 (3) | ⊕⊕⊝⊝ |
| Technique failure | 293 per 1,000 | 208 per 1,000 | RR 0.71 | 283 (4) | ⊕⊕⊝⊝ |
| Death (all causes) | 140 per 1,000 | 176 per 1,000 | RR 1.26 | 270 (3) | ⊕⊕⊕⊝ |
| *The risk in the intervention group (and its 95% confidence interval) is based on the assumed risk in the comparison group and the relative effect of the intervention (and its 95% CI). | |||||
| GRADE Working Group grades of evidence | |||||
| 1 Downgraded one level: suboptimal quality of studies 2 Downgraded two levels: single study with suboptimal quality and imprecision 3 Downgraded two levels: suboptimal quality and imprecision | |||||
| Buried (subcutaneous) versus non‐buried catheter for preventing catheter‐related infections in chronic peritoneal dialysis patients | |||||
| Patient or population: chronic peritoneal dialysis patients | |||||
| Outcomes | Anticipated absolute effects* (95% CI) | Relative effect | No. of participants or patient‐months | Certainty of the evidence | |
| Risk with non‐buried | Risk with buried (subcutaneous) | ||||
| Peritonitis rate (patient‐months) | 37 per 1,000 | 43 per 1,000 | RR 1.16 | 2511 (2) | ⊕⊝⊝⊝ |
| Exit‐site/tunnel infection rate (patient‐months) | 31 per 1,000 | 36 per 1,000 | RR 1.15 | 2511 (2) | ⊕⊝⊝⊝ |
| Technique failure | 367 per 1,000 | 268 per 1,000 | RR 0.73 | 60 (1) | ⊕⊝⊝⊝ |
| Death (all causes) | 169 per 1,000 | 153 per 1,000 | RR 0.90 | 119 (2) | ⊕⊕⊕⊝ |
| *The risk in the intervention group (and its 95% confidence interval) is based on the assumed risk in the comparison group and the relative effect of the intervention (and its 95% CI). | |||||
| GRADE Working Group grades of evidence | |||||
| 1 Downgraded three levels: suboptimal quality, inconsistency, and imprecision 2 Downgraded three levels: single study, suboptimal quality, and imprecision 3 Downgraded two levels: suboptimal quality of studies and imprecision | |||||
| Midline versus lateral insertion for preventing catheter‐related infections in chronic peritoneal dialysis patients | |||||
| Patient or population: chronic peritoneal dialysis patients | |||||
| Outcomes | Anticipated absolute effects* (95% CI) | Relative effect | No. of participants | Certainty of the evidence | |
| Risk with lateral | Risk with midline | ||||
| Peritonitis | 255 per 1,000 | 166 per 1,000 | RR 0.65 | 120 (2) | ⊕⊕⊕⊝ |
| Exit‐site/tunnel infection | 78 per 1,000 | 44 per 1,000 | RR 0.56 | 120 (2) | ⊕⊕⊝⊝ |
| Catheter removal or replacement | 514 per 1,000 | 293 per 1,000 | RR 0.57 | 83 (1) | ⊕⊝⊝⊝ VERY LOW 3 |
| Death (all causes) | 0 per 1,000 | 0 per 1,000 | RR 8.50 | 37 (1) | ⊕⊝⊝⊝ |
| *The risk in the intervention group (and its 95% confidence interval) is based on the assumed risk in the comparison group and the relative effect of the intervention (and its 95% CI). | |||||
| GRADE Working Group grades of evidence | |||||
| 1 Downgraded one level: suboptimal quality of studies 2 Downgraded two levels: suboptimal quality and imprecision 3 Downgraded three levels: single study, suboptimal quality study, and imprecision | |||||
| Percutaneous insertion versus open surgery for preventing catheter‐related infections in chronic peritoneal dialysis patients | |||||
| Patient or population: chronic peritoneal dialysis patients | |||||
| Outcomes | Anticipated absolute effects* (95% CI) | Relative effect | No. of participants | Certainty of the evidence | |
| Risk with open surgery | Risk with percutaneous insertion | ||||
| Exit‐site/tunnel infection | 106 per 1,000 | 17 per 1,000 | RR 0.16 | 96 | ⊕⊕⊕⊝ |
| Catheter removal or replacement | 133 per 1,000 | 32 per 1,000 | RR 0.24 | 61 | ⊕⊝⊝⊝ |
| *The risk in the intervention group (and its 95% confidence interval) is based on the assumed risk in the comparison group and the relative effect of the intervention (and its 95% CI). | |||||
| GRADE Working Group grades of evidence | |||||
| 1 Downgraded one level: suboptimal quality of studies 2 Downgraded two levels: single study with suboptimal quality and imprecision | |||||
| Straight versus coiled catheters for preventing catheter‐related infections in chronic peritoneal dialysis patients | |||||
| Patient or population: chronic peritoneal dialysis patients | |||||
| Outcomes | Anticipated absolute effects* (95% CI) | Relative effect | No. of participants or patient‐months | Certainty of the evidence | |
| Risk with coiled | Risk with straight | ||||
| Peritonitis | 217 per 1,000 | 225 per 1,000 | RR 1.04 | 818 (9) | ⊕⊕⊕⊝ |
| Peritonitis rate (patient‐months) | 32 per 1,000 | 29 per 1,000 | RR 0.91 | 5882 (5) | ⊕⊕⊕⊝ |
| Exit‐site/tunnel infection | 281 per 1,000 | 314 per 1,000 | RR 1.12 | 826 (10) | ⊕⊕⊕⊝ |
| Exit‐site/tunnel infection rate (patient‐months) | 27 per 1,000 | 28 per 1,000 | RR 1.05 | 5286 (4) | ⊕⊕⊕⊝ |
| Catheter removal or replacement | 249 per 1,000 | 276 per 1,000 | RR 1.11 | 713 (9) | ⊕⊝⊝⊝ |
| Technique failure | 131 per 1,000 | 108 per 1,000 | RR 0.82 | 442 (4) | ⊕⊕⊕⊝ |
| Death (all causes) | 124 per 1,000 | 117 per 1,000 | RR 0.95 | 703 (8) | ⊕⊕⊝⊝ |
| *The risk in the intervention group (and its 95% confidence interval) is based on the assumed risk in the comparison group and the relative effect of the intervention (and its 95% CI). | |||||
| GRADE Working Group grades of evidence | |||||
| 1 Downgraded one level: most studies are of suboptimal quality 2 Downgrade one level: inconsistency 3 Downgraded one level: publication bias | |||||
| Tenckhoff catheter with artificial curve at tunnel tract versus swan‐neck for preventing catheter‐related infections in chronic peritoneal dialysis patients | |||||
| Patient or population: preventing catheter‐related infections in chronic peritoneal dialysis patients | |||||
| Outcomes | Anticipated absolute effects* (95% CI) | Relative effect | No. of participants or patient‐months | Certainty of the evidence | |
| Risk with swan‐neck | Risk with Tenckhoff | ||||
| Peritonitis | 329 per 1,000 | 424 per 1,000 | RR 1.29 | 140 (2) | ⊕⊕⊝⊝ |
| Peritonitis rate (patient‐months) | 47 per 1,000 | 57 per 1,000 | RR 1.22 | 2535 (2) | ⊕⊕⊝⊝ |
| Exit‐site/tunnel infection | 671 per 1,000 | 645 per 1,000 | RR 0.96 | 140 (2) | ⊕⊕⊕⊝ |
| Exit‐site/tunnel infection rate (patient‐months) | 83 per 1,000 | 55 per 1,000 | RR 0.67 | 2535 (2) | ⊕⊕⊕⊝ |
| Catheter removal or replacement | 229 per 1,000 | 194 per 1,000 | RR 0.85 | 140 (2) | ⊕⊕⊕⊝ |
| Technique failure | 157 per 1,000 | 101 per 1,000 | RR 0.64 | 140 (2) | ⊕⊕⊕⊝ |
| Death (all causes) | 114 per 1,000 | 85 per 1,000 | RR 0.74 | 140 (2) | ⊕⊕⊝⊝ |
| *The risk in the intervention group (and its 95% confidence interval) is based on the assumed risk in the comparison group and the relative effect of the intervention (and its 95% CI). | |||||
| GRADE Working Group grades of evidence | |||||
| 1 Downgraded two levels: suboptimal quality of studies and imprecision 2 Downgraded two levels: suboptimal quality of studies and inconsistency 3 Downgraded one level: suboptimal quality of studies | |||||
| Self‐locating versus straight Tenckhoff catheter for preventing catheter‐related infections in chronic peritoneal dialysis patients | |||||
| Patient or population: chronic peritoneal dialysis patients | |||||
| Outcomes | Anticipated absolute effects* (95% CI) | Relative effect | No. of participants | Certainty of the evidence | |
| Risk with straight Tenckhoff | Risk with self‐locating | ||||
| Peritonitis | 684 per 1,000 | 773 per 1,000 | RR 1.13 | 78 (1) | ⊕⊝⊝⊝ |
| Exit‐site/tunnel infection | 184 per 1,000 | 175 per 1,000 | RR 0.95 | 78 (1) | ⊕⊝⊝⊝ |
| Catheter removal or replacement | 343 per 1,000 | 110 per 1,000 | RR 0.32 | 139 (2) | ⊕⊝⊝⊝ |
| Technique failure | 414 per 1,000 | 265 per 1,000 | RR 0.64 | 139 (2) | ⊕⊕⊕⊝ |
| Death (all causes) | 71 per 1,000 | 73 per 1,000 | RR 1.02 | 139 (2) | ⊕⊕⊝⊝ |
| *The risk in the intervention group (and its 95% confidence interval) is based on the assumed risk in the comparison group and the relative effect of the intervention (and its 95% CI). | |||||
| GRADE Working Group grades of evidence | |||||
| 1 Downgraded three levels: single study, suboptimal quality, and imprecision 2 Downgraded three levels: suboptimal quality, imprecision and inconsistency 3 Downgraded one level: suboptimal quality of study 4 Downgraded two levels: suboptimal quality and imprecision | |||||
Antecedentes
Descripción de la afección
La peritonitis es una complicación grave de la diálisis peritoneal (DP) que se asocia con tasas apreciablemente más altas de hospitalización (Barraclough 2010; Edey 2010; Htay 2018), fracaso técnico (Htay 2017; Kolesnyk 2010) y muerte (Boudville 2012). Además, un estudio anterior (Campbell 2016) ha demostrado que la peritonitis tiene graves repercusiones en el estilo de vida de los pacientes (carga para la familia, carga económica) y en la calidad de vida (sensación de dolor, pérdida de control y dignidad). Asimismo, la peritonitis y sus complicaciones pueden aumentar potencialmente la carga económica de los sistemas sanitarios (Li 2017).
Varios factores pueden contribuir a un mayor riesgo de peritonitis, como la edad avanzada (Kotsanas 2007; McDonald 2004), el grupo étnico (Lim 2011; McDonald 2004; Piraino 2002; Shen 2013), el índice de masa corporal (Jegatheesan 2018); McDonald 2004), enfermedades coexistentes (por ejemplo, diabetes mellitus) (Chow 2005), portador nasal de Staphylococcus aureus (Schaefer 2003; Ong 2016), estado inmunológico comprometido y metodología de conexión (Strippoli 2004a). Sin embargo, la infección relacionada con la DP puede prevenirse con medidas como la administración de profilaxis antibiótica antes de la implantación del catéter (Strippoli 2004a), la aplicación de un agente antimicrobiano tópico en el lugar de salida del catéter (Xu 2009) y la profilaxis antibiótica antes de los procedimientos gastrointestinales y ginecológicos invasivos (Wu 2013).
Un estudio observacional previo informó que los catéteres de dos piezas se asociaron con un menor riesgo de infección en el sitio de salida en comparación con los catéteres de una sola pieza (Lindblad 1988). Sin embargo, esta asociación no pudo confirmarse en un ECA (Eklund 1997) ni en un metanálisis (Strippoli 2004; Strippoli 2004b). La International Society for Peritoneal Dialysis (ISPD) ha publicado recientemente las guías actualizadas para la prevención de la peritonitis relacionada con la DP, en que no recomiendan ningún método específico de implantación ni ningún tipo de catéter (Li 2016; Szeto 2017). Estas guías se basan en gran medida en la revisión Cochrane anterior (Strippoli 2004). Desde la última revisión, se han publicado varios ECA sobre los diferentes tipos de catéteres y técnicas de implantación en pacientes en DP. Esta revisión examinó la función de las intervenciones relacionadas con los catéteres, incluidos diferentes tipos de catéteres, técnicas de colocación e inserción, para mitigar el riesgo de peritonitis en pacientes en DP.
Descripción de la intervención
Una de las estrategias clave empleadas para prevenir la peritonitis relacionada con la DP es reducir el riesgo de contaminación microbiana a través de los catéteres para la DP. En la revisión se examinaron diferentes intervenciones relacionadas con el catéter, incluidos diversos métodos de implantación (inserción laparoscópica, cirugía abierta, inserción percutánea, inserción asistida por ureteroscopio, inserción asistida por cistoscopia, inserción radiológica, inserción en la línea media o lateral, implantación e inserción profunda subcutánea del catéter con un período de reposo antes del uso, cirugía modificada con fijación del catéter), diferentes tipos (catéteres de una, dos, tres piezas, recto, en espiral, autolocalizable, catéter de cuello de cisne, catéter Moncrief‐Popovich, catéter tratado con antibióticos), uso de anillos de plata en los sitios de salida, inmovilización de catéteres de DP y períodos de adaptación.
De qué manera podría funcionar la intervención
Un estudio aleatorizado de Gadallah 1999 informó que los episodios de peritonitis precoz (dentro de las dos semanas de colocación del catéter) fueron significativamente inferiores en 76 pacientes que se sometieron a la inserción del catéter mediante un abordaje peritoneoscópico en comparación con 72 pacientes con catéteres colocados quirúrgicamente (2,6% versus 12,5%, p = 0,02). La revisión sistemática anterior realizada en 2004 (Strippoli 2004) informó que ninguna técnica específica de implantación de catéteres fue beneficiosa para reducir el riesgo de peritonitis. Desde entonces, han evolucionado los enfoques de la técnica de inserción y los tipos de catéteres disponibles, lo que puede haber repercutido en el riesgo de peritonitis y a su vez se ha traducido en mejoras en la supervivencia del catéter o de la técnica
Por qué es importante realizar esta revisión
Las guías ISPD no recomiendan ningún método específico de implantación ni ningún tipo específico de catéter para la prevención de la peritonitis en pacientes en DP. Esta recomendación se basó principalmente en los resultados de la revisión anterior. Desde entonces, se han publicado más ensayos controlados aleatorizados (ECA) sobre este tema, que se incluirá en esta actualización.
Objetivos
Evaluar la función de las diferentes técnicas de implantación y tipos de catéter en la reducción del riesgo de peritonitis relacionada con la DP en pacientes en DP.
Métodos
Criterios de inclusión de estudios para esta revisión
Tipos de estudios
Todos los ECA y ensayos controlados cuasialeatorizados (ECA en que la asignación al tratamiento se obtuvo mediante la alternancia, el uso de registros médicos alternativos, la fecha de nacimiento u otros métodos predecibles) que investigaron el efecto de diferentes tipos de catéter, técnicas de colocación e inserción para la prevención de la peritonitis en pacientes en DP.
Tipos de participantes
Criterios de inclusion
Adultos y niños sometidos a tratamiento de DP para la enfermedad renal terminal.
Criterios de exclusión
Pacientes que no están en DP.
Tipos de intervenciones
-
Técnicas quirúrgicas de inserción del catéter (laparoscopia, laparotomía, inserción subcutánea profunda y reposo del catéter, inserción estándar con reposo pero sin inserción subcutánea profunda del catéter, inserción en la línea media, inserción lateral)
-
Tipos de catéteres (recto, en espiral, autolocalizable, catéter Tenckhoff con una curva artificial en el tracto subcutáneo, catéter de una sola pieza, de doble pieza, de triple pieza, tratado con antibióticos
-
Uso de técnicas de inmovilización
-
Períodos de adaptación
-
Uso del anillo de plata en el sitio de salida (nueva intervención identificada durante la búsqueda actualizada).
Tipos de medida de resultado
Resultados primarios
-
Peritonitis: número de pacientes con peritonitis (peritonitis definida como recuento de dializado de > 100 células/mm3, con > 50% leucocitos polimorfonucleares) y tasa de peritonitis
-
Infección en el lugar de salida y en el túnel: número de pacientes con infección en el lugar de salida y en el túnel, y tasas de infección en el lugar de salida y en el túnel.
Resultados secundarios
-
Retiro del catéter / reemplazo del catéter
-
Fallo de la técnica (transferencia de la DP a la hemodiálisis)
-
Muerte (por todas las causas)
-
Recaída de la peritonitis
-
Muerte relacionada con la peritonitis
-
Tiempo hasta el primer episodio de peritonitis.
Métodos de búsqueda para la identificación de los estudios
Búsquedas electrónicas
We searched the Cochrane Kidney and Transplant Register of Studies up to 15 January 2019 through contact with the Information Specialist using search terms relevant to this review. The Register contains studies identified from the following sources.
-
Monthly searches of the Cochrane Central Register of Controlled Trials (CENTRAL)
-
Weekly searches of MEDLINE OVID SP
-
Handsearching of kidney‐related journals and the proceedings of major kidney and transplant conferences
-
Searching of the current year of EMBASE OVID SP
-
Weekly current awareness alerts for selected kidney and transplant journals
-
Searches of the International Clinical Trials Register (ICTRP) Search Portal and ClinicalTrials.gov.
Studies contained in the Register are identified through searches of CENTRAL, MEDLINE, and EMBASE based on the scope of Cochrane Kidney and Transplant. Details of search strategies, as well as a list of handsearched journals, conference proceedings and current awareness alerts, are available in the Specialised Register section of information about Cochrane Kidney and Transplant.
See Appendix 1 for search terms used in strategies for this review.
Búsqueda de otros recursos
-
Reference lists of review articles, relevant studies and clinical practice guidelines.
-
Letters seeking information about unpublished or incomplete studies to investigators known to be involved in previous studies.
Obtención y análisis de los datos
Selección de los estudios
The search strategies described were used to obtain titles and abstracts of studies that may be relevant to the review. The titles and abstracts were screened independently by two authors, who discarded studies that were not applicable, however studies and reviews that may have included relevant data or information on studies were retained initially. Two authors independently assessed retrieved abstracts and, where necessary the full text, of these studies to determine which studies satisfied the inclusion criteria.
Extracción y manejo de los datos
Data extraction was carried out independently by two authors using standard data extraction forms. It was planned that studies reported in non‐English language journals would be translated before assessment. Where more than one publication of one study existed, reports were grouped together and the publication with the most complete data was included.
Evaluación del riesgo de sesgo de los estudios incluidos
The following items were assessed independently by two authors using the risk of bias assessment tool (Higgins 2011) (see Appendix 2).
-
Was there adequate sequence generation (selection bias)?
-
Was allocation adequately concealed (selection bias)?
-
Was knowledge of the allocated interventions adequately prevented during the study?
-
Participants and personnel (performance bias)
-
Outcome assessors (detection bias)
-
-
Were incomplete outcome data adequately addressed (attrition bias)?
-
Are reports of the study free of suggestion of selective outcome reporting (reporting bias)?
-
Was the study apparently free of other problems that could put it at a risk of bias?
Medidas del efecto del tratamiento
Data from individual studies were analysed using the risk ratio (RR) measure and its 95% confidence intervals (CI). Subgroup analysis was planned to explore potential sources of variability in observed treatment effect where possible (children versus adult population, diabetic versus non‐diabetic, study quality, timing of peritonitis or other outcome). Absolute effects were reported where appropriate.
Cuestiones relativas a la unidad de análisis
Where data on the number of subjects with events (e.g. number of participants with one or more episodes of peritonitis) were available, the RR was calculated as the ratio of the incidence of the event (one or more episodes) in the experimental treatment group over the incidence in the control group. Where data on the number of episodes were available, then the RR was calculated as the ratio of the rate of the outcome (e.g. the peritonitis rate) in the experimental treatment group (given by number of episodes of the outcome over total patient months on PD) over the rate in the control group.
Manejo de los datos faltantes
Any further information or clarification required from the authors was requested by written or electronic correspondence and relevant information obtained in this manner was included in the review. Disagreements were resolved in consultation with the other two authors.
Evaluación de la heterogeneidad
We first assessed the heterogeneity by visual inspection of the forest plot. We then quantified statistical heterogeneity using the I2 statistic, which describes the percentage of total variation across studies that is due to heterogeneity rather than sampling error (Higgins 2003). A guide to the interpretation of I2 values was as follows.
-
0% to 40%: might not be important
-
30% to 60%: may represent moderate heterogeneity
-
50% to 90%: may represent substantial heterogeneity
-
75% to 100%: considerable heterogeneity.
The importance of the observed value of I2 depends on the magnitude and direction of treatment effects and the strength of evidence for heterogeneity (e.g. P‐value from the Chi2 test, or a confidence interval for I2) (Higgins 2011).
Evaluación de los sesgos de notificación
It was also planned that if sufficient RCTs were identified, an attempt would be made to assess for publication bias using a funnel plot (Egger 1997).
Síntesis de los datos
When appropriate, summary estimators of treatment effects were calculated using a random effects model with RR and its 95% CI.
Análisis de subgrupos e investigación de la heterogeneidad
Subgroup analysis was used to explore possible sources of heterogeneity (e.g. study duration, participants, interventions and study quality). Heterogeneity among participants may have been related to age and co‐existing conditions, for example diabetes mellitus. Heterogeneity in interventions may have been related to prior prophylactic antibiotics used and the type and dose of therapy. If subgroup analysis was unable to be performed due to absence of other similar studies, this limitation was acknowledged and discussed in the manuscript.
Análisis de sensibilidad
Where sufficient studies were available we investigated the following:
-
Studies with data from RCTs only or quasi RCTs only
-
Studies with different risks of bias together, for example, studies with low attrition bias risk and studies with high attrition bias risk.
Summary of findings' tables
We presented the main results of the review in 'Summary of findings' tables. These tables present key information concerning the quality of the evidence, the magnitude of the effects of the interventions examined, and the sum of the available data for the main outcomes (Schünemann 2011a). The 'Summary of findings' tables also include an overall grading of the evidence related to each of the main outcomes using the GRADE (Grades of Recommendation, Assessment, Development and Evaluation) approach (GRADE 2008; GRADE 2011). The GRADE approach defines the quality of a body of evidence as the extent to which one can be confident that an estimate of effect or association is close to the true quantity of specific interest. The quality of a body of evidence involves consideration of within‐trial risk of bias (methodological quality), directness of evidence, heterogeneity, precision of effect estimates and risk of publication bias (Schünemann 2011b). We presented the following outcomes in the 'Summary of findings' tables.
-
Incidence of peritonitis (defined as number of patients with peritonitis)
-
Peritonitis rate (episode/patient‐months)
-
Incidence of exit‐site/tunnel infection (defined as number of patients of exit‐site/tunnel infection)
-
Exit‐site/tunnel infection rate (episode/patient‐months)
-
Catheter removal/replacement
-
Technique failure (death‐censored)
-
Death (all causes).
Results
Description of studies
Results of the search
The original Cochrane review contained 17 included studies (Akyol 1990; Danielsson 2002; Dasgupta 1998; Ejlersen 1990; Eklund 1994; Eklund 1995; Eklund 1997; Gadallah 1999; Lye 1996; Moncrief 1998; Nielsen 1995; Park 1998; Rubin 1990; Scott 1994; Tsimoyiannis 2000; Turner 1992; Wright 1999) and two ongoing studies.
For this update we searched Cochrane Kidney and Transplant's Specialised Register up to January 2019 and identified 49 new reports. After full‐text assessment 34 new studies were identified: 25 new studies (34 reports) were included (Akcicek 1995; Al‐Hwiesh 2016; Atapour 2011; Buijsen 1994; Chen 2014a; Johnson 2006; Jwo 2010; Li 2009e; Lo 2003b; Merrikhi 2014; Ouyang 2015; Qian 2014; Sanchez‐Canel 2016; SIPROCE 1997; Stegmayr 2005a; Stegmayr 2015; Sun 2015a; Timely PD 2010; Trooskin 1990; Voss 2012; Winch 2000; Xie 2011a; Yip 2010; Zhang 2016; Zhu 2015), 6 studies (6 reports) were excluded (Crabtree 2003; ISRCTN87054124; Moncrief 1994; N0547061060; O'Dwyer 2005; Williams 1989), and two ongoing studies were identified (NCT01023191; NCT02479295). Three studies are awaiting assessment (no data available and awaiting author response) (Ahmad 2010; LOCI 2011; Wong 2004b). We also identified three new reports of three existing included studies.
For this update a total of 42 studies (54 reports, 3144 participants) (Figure 1) were included.
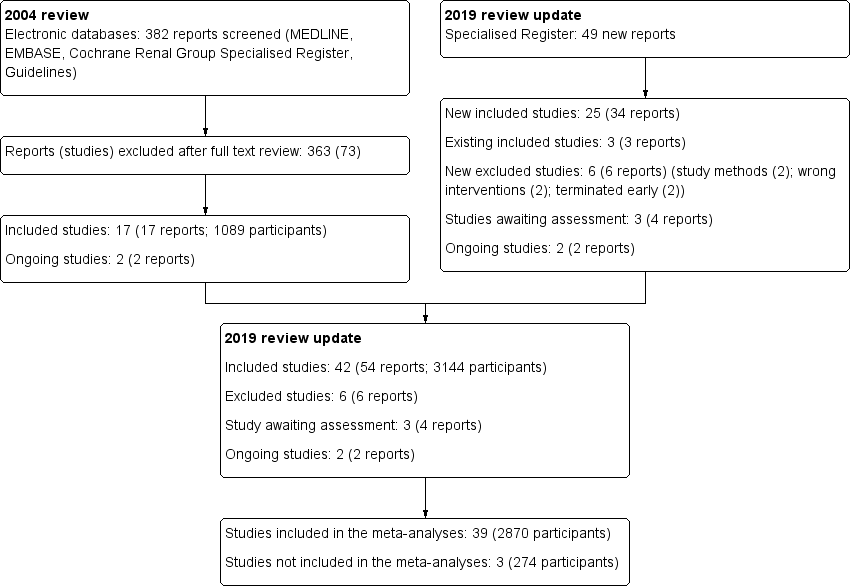
Study flow diagram.
Included studies
Eighteen studies (1314 randomised participants) examined different methods of catheter insertion.
-
Laparoscopy versus laparotomy: 4 studies (320 participants) (Gadallah 1999; Jwo 2010; Tsimoyiannis 2000; Wright 1999)
-
Subcutaneous burying with a period of resting of the catheter versus standard insertion: 3 studies (232 participants) (Danielsson 2002; Moncrief 1998; Park 1998)
-
Midline versus lateral insertion: 2 studies (122 participants) (Ejlersen 1990; Rubin 1990)
-
Open surgery versus percutaneous implantation: 2 studies (96 participants) (Atapour 2011; Merrikhi 2014)
-
Open surgery versus open surgery with omentum folding: 1 study (67 participants) (Chen 2014a)
-
Radiological versus surgical implantation: 1 study (113 participants) (Voss 2012)
-
Open surgery versus modified open surgery with or without catheter fixation: 1 study (152 participants) (Zhang 2016)
-
Conventional open surgery versus vertical tunnel‐based low‐site implantation: 1 study (89 participant) (Sun 2015a)
-
Open surgery versus ureteroscopic‐assisted surgery: 1 study (72 participants) (Zhu 2015)
-
Cystoscopy‐assisted surgery versus open surgery: 1 study (29 participants) (Qian 2014)
-
Laparoscopic Moncrief‐Popovich technique versus blind trocar technique: 1 study (22 participants) (Akcicek 1995).
Twenty‐one studies (1447 randomised participants) examined different types of PD catheters.
-
Straight versus coiled catheters: 12 studies (878 participants) (Akyol 1990; Dasgupta 1998; Eklund 1994; Eklund 1995; Johnson 2006; Lo 2003b; Lye 1996; Nielsen 1995; Ouyang 2015; Scott 1994; Stegmayr 2005a; Xie 2011a)
-
Straight‐tip versus self‐locating tip catheters: 2 studies (139 participants) (Sanchez‐Canel 2016; Stegmayr 2015)
-
Swan‐neck straight‐tip versus straight‐tip with artificial curve at subcutaneous tunnel tract: 2 studies (140 participants) (Li 2009e; Yip 2010)
-
Single versus double cuff catheters: 2 studies (109 participants) (Buijsen 1994; Eklund 1997)
-
Double versus triple cuff catheters: 1 study (73 participants) (Al‐Hwiesh 2016)
-
Swan‐neck versus straight curled catheter: 1 study (22 participants) (Winch 2000)
-
Antibiotic‐treated versus standard catheters: 1 study (86 participants) (Trooskin 1990).
There were two additional studies that examined other interventions: one study (195 participants) (SIPROCE 1997) compared a silver ring versus no silver ring at the exit‐site, and one study (66 participants) (Turner 1992) compared immobilisation versus non‐immobilisation of PD catheters.
There was one study examining the different break‐in periods (122 participants) (Timely PD 2010).
Three studies could not be included in the meta‐analyses (Dasgupta 1998; Moncrief 1998; Timely PD 2010).
Excluded studies
Six studies did not meet our inclusion criteria and were excluded (Figure 1). The reasons for exclusion were wrong study methods (Crabtree 2003; N0547061060), wrong interventions (O'Dwyer 2005; Williams 1989), or terminated early (ISRCTN87054124; Moncrief 1994).
Risk of bias in included studies
The quality of the studies was difficult to assess because many details such as the use of intention‐to‐treat analysis and the number of patients lost to follow‐up were difficult to ascertain or were not provided. In general, study quality was variable and almost all aspects of study design did not fulfil CONSORT standards for reporting (CONSORT 2001). Risk of bias for the individual studies is presented in Figure 2 and the summary is presented in Figure 3.

Risk of bias summary: review authors' judgements about each risk of bias item for each included study.

Risk of bias graph: review authors' judgements about each risk of bias item presented as percentages across all included studies.
Allocation
Random sequence generation
Random sequence generation was judged to be at low risk of bias in seven studies (Atapour 2011; Johnson 2006; Li 2009e; Timely PD 2010; Voss 2012; Xie 2011a; Zhang 2016) and at high risk of bias in three studies (Gadallah 1999; Jwo 2010; Lye 1996). The risk of bias was unclear for the remaining 32 studies.
Allocation concealment
Allocation concealment was judged to be at low risk of bias in 11 studies (Atapour 2011; Eklund 1994; Eklund 1995; Eklund 1997; Johnson 2006; Nielsen 1995; Timely PD 2010; Tsimoyiannis 2000; Voss 2012; Wright 1999; Xie 2011a) and at high risk of bias in two studies (Gadallah 1999; Lye 1996). The risk of bias was unclear in the remaining 29 studies.
Blinding
Performance bias (blinding of participants and investigators) was judged to be at low risk of bias in six studies (Akyol 1990; Eklund 1994; Eklund 1995; Nielsen 1995; Trooskin 1990; Wright 1999) and at high risk of bias in nine studies (Lye 1996; Park 1998; Rubin 1990; SIPROCE 1997; Timely PD 2010; Tsimoyiannis 2000; Turner 1992; Voss 2012; Yip 2010). The risk of bias was unclear in the remaining 27 studies.
Detection bias (blinding of outcome assessors) was judged to be at high risk of bias in six studies (Park 1998; Rubin 1990; Timely PD 2010; Tsimoyiannis 2000; Voss 2012; Yip 2010). The risk of bias was unclear in the remaining 36 studies.
Incomplete outcome data
Attrition bias was judged to be at low risk of bias in 24 studies (Akyol 1990; Al‐Hwiesh 2016; Atapour 2011; Chen 2014a; Danielsson 2002; Ejlersen 1990; Eklund 1994; Eklund 1997; Gadallah 1999; Johnson 2006; Jwo 2010; Li 2009e; Lo 2003b; Lye 1996; Merrikhi 2014; Park 1998; Stegmayr 2005a; Sun 2015a; Timely PD 2010; Tsimoyiannis 2000; Voss 2012; Xie 2011a; Yip 2010; Zhang 2016) and at high risk of bias in six studies (Eklund 1995; Nielsen 1995; Ouyang 2015; SIPROCE 1997; Stegmayr 2015; Winch 2000). The risk of bias was unclear in the remaining 12 studies.
Selective reporting
Reporting bias was judged to be at low risk of bias in 22 studies (Al‐Hwiesh 2016; Chen 2014a; Danielsson 2002; Ejlersen 1990; Eklund 1994; Eklund 1995; Eklund 1997; Gadallah 1999; Johnson 2006; Jwo 2010; Li 2009e; Merrikhi 2014; Ouyang 2015; SIPROCE 1997; Timely PD 2010; Trooskin 1990; Voss 2012; Winch 2000; Wright 1999; Yip 2010; Zhang 2016; Zhu 2015) and at high risk of bias in 20 studies (Akcicek 1995; Akyol 1990; Atapour 2011; Buijsen 1994; Dasgupta 1998; Lo 2003b; Lye 1996; Moncrief 1998; Nielsen 1995; Park 1998; Qian 2014; Rubin 1990; Sanchez‐Canel 2016; Scott 1994; Stegmayr 2005a; Stegmayr 2015; Sun 2015a; Tsimoyiannis 2000; Turner 1992; Xie 2011a).
Other potential sources of bias
Ten studies (23%) were identified as high risk for other potential sources of bias. The potential sources of other risks of bias included: different baseline characteristics between the two groups (Johnson 2006; Jwo 2010; Sanchez‐Canel 2016; Zhang 2016; Zhu 2015; 511 participants); use of a different definition for peritonitis (Eklund 1994; 40 participants); premature study closure due to insufficient supply of the intervention (Li 2009e; 39 participants); examination of two distinct interventions (the new method of insertion and new catheter or new method insertion (Rubin 1990) and different connection methods (Chen 2014a)) in the treatment arm (152 participants); and violation of study protocols (Timely PD 2010; 122 participants).
Effects of interventions
See: Summary of findings for the main comparison Laparoscopy versus laparotomy for preventing catheter‐related infections in chronic peritoneal dialysis patients; Summary of findings 2 Buried (subcutaneous) versus non‐buried catheter for preventing catheter‐related infections in chronic peritoneal dialysis patients; Summary of findings 3 Midline versus lateral insertion for preventing catheter‐related infections in chronic peritoneal dialysis patients; Summary of findings 4 Percutaneous insertion versus open surgery for preventing catheter‐related infections in chronic peritoneal dialysis patients; Summary of findings 5 Straight versus coiled catheters for preventing catheter‐related infections in chronic peritoneal dialysis patients; Summary of findings 6 Tenckhoff catheter with artificial curve at tunnel tract versus swan‐neck for preventing catheter‐related infections in chronic peritoneal dialysis patients; Summary of findings 7 Self‐locating versus straight Tenckhoff catheter for preventing catheter‐related infections in chronic peritoneal dialysis patients
Laparoscopy versus laparotomy
Laparoscopy insertion compared with laparotomy probably makes little or no difference to the incidence of peritonitis (Analysis 1.1 (4 studies, 315 participants): RR 0.90, 95% CI 0.59 to 1.35, P = 0.60; I2 = 5%; moderate certainty evidence; 24 fewer per 1000), exit site/tunnel infection (Analysis 1.3 (3 studies, 270 participants): RR 1.00, 95% CI 0.43 to 2.31, P = 0.99; I2 = 30%; low certainty evidence; 0 fewer per 1000), catheter removal or replacement (Analysis 1.4 (3 studies, 167 participants): RR 1.20, 95% CI 0.77 to 1.86, P = 0.42; I2 = 0%; low certainty evidence), technique failure (Analysis 1.5 (4 studies, 283 participants): RR 0.71, 95% CI 0.47 to 1.08, P = 0.11, I2 = 5%; low certainty evidence), and death (all causes) (Analysis 1.6 (3 studies, 270 participants): RR 1.26, 95% CI 0.72 to 2.20, P = 0.42; I2 = 0%; moderate certainty evidence) (summary of findings Table for the main comparison). Wright 1999 reported no difference in peritonitis rate between laparoscopy and laparotomy (Analysis 1.2 (375 patient‐months): RR 0.89, 95% CI 0.39 to 2.07). Laparoscopy may make little or no difference to dialysate leak compared with laparotomy insertion (Analysis 1.7 (3 studies, 167 participants): RR 0.85, 95% CI 0.10 to 6.97, P = 0.88; I2 = 63%; low certainty evidence).
Moderate heterogeneity was resolved by subgroup analysis with different break‐in periods. Jwo 2010 reported 3 post‐operative bleeding (haematoma or haemoperitoneum) and 2 hernia in laparoscopic insertion compared with 8 bleed and 1 hernia in laparotomy (Table 1).
| Study ID | Intervention | Control group | ||
| Events | Total | Events | Total | |
| Haematoma or haemoperitoneum | ||||
| 1 | 31 | 4 | 30 | |
| 7 | 34 | 4 | 32 | |
| 7 | 40 | 6 | 38 | |
| 0 | 36 | 0 | 37 | |
| 0 | 18 | 2 | 17 | |
| 3 | 99 | 2 | 90 | |
| 0 | 20 | 0 | 20 | |
| 0 | 20 | 0 | 20 | |
| 14 | 20 | 22 | 19 | |
| 1 | 48 | 1 | 35 | |
| 0 | 30 | 1 | 59 | |
| 1 | 103 | 0 | 49 | |
| Dialysate leak | ||||
| 2 | 34 | 1 | 32 | |
| 9 | 40 | 7 | 38 | |
| 7 | 40 | 6 | 37 | |
| 1 | 31 | 1 | 30 | |
| 2 | 36 | 3 | 37 | |
| 2 | 10 | 4 | 12 | |
| 0 | 20 | 2 | 20 | |
| 0 | 20 | 4 | 20 | |
| 0 | 20 | 0 | 20 | |
| 1 | 38 | 0 | 34 | |
| 0 | 99 | 3 | 90 | |
| 0 | 14 | 1 | 15 | |
| 6 | 48 | 3 | 35 | |
| 2 | 30 | 0 | 59 | |
| 1 | 29 | 3 | 32 | |
| 4 | 57 | 10 | 56 | |
| 2 | 11 | 0 | 11 | |
| 2 | 21 | 0 | 24 | |
| 1 | 40 | 0 | 40 | |
| 0 | 50 | 0 | 51 | |
| 0 | 103 | 1 | 49 | |
| Viscus perforation | ||||
| Nielsen 1995 (bladder perforation) | 0 | 38 | 1 | 34 |
| Al‐Hwiesh 2016 (bowel perforation) | 0 | 36 | 0 | 37 |
| Merrikhi 2014 (hollow viscus perforation) | 0 | 18 | 0 | 17 |
| 0 | 31 | 0 | 30 | |
| Outflow failure or catheter tip migration | ||||
| 1 | 31 | 4 | 30 | |
| 2 | 20 | 1 | 19 | |
| 12 | 40 | 25 | 38 | |
| 3 | 57 | 4 | 56 | |
| 1 | 36 | 11 | 37 | |
| 1 | 30 | 2 | 59 | |
| 3 | 20 | 1 | 20 | |
| 0 | 14 | 1 | 15 | |
| 1 | 10 | 3 | 12 | |
| 1 | 11 | 1 | 11 | |
| Hernia | ||||
| 0 | 34 | 1 | 32 | |
| 2 | 40 | 1 | 37 | |
| 7 | 40 | 7 | 38 | |
| 4 | 99 | 6 | 90 | |
| 2 | 40 | 2 | 40 | |
| 4 | 57 | 8 | 56 | |
| 0 | 103 | 1 | 49 | |
Implantation and subcutaneous burying of the catheter versus standard insertion with resting but no subcutaneous burying of the catheter
It is uncertain whether the subcutaneous burying of a PD catheter 6 weeks before initiation of PD prevents peritonitis rates (Analysis 2.1 (2 studies, 2511 patient‐months): RR 1.16, 95% CI 0.37 to 3.60, P = 0.80; I2 = 84%; very low certainty evidence). Subcutaneous burying of catheter may make little or no difference to exit site/tunnel infection (Analysis 2.2 (2 studies, 2511 patient‐months): RR 1.15, 95% CI 0.39 to 3.42, P = 0.80; I2 = 67%; low certainty evidence) and probably makes little or no difference to death (all causes) (Analysis 2.4 (2 studies, 119 participants): RR 0.90, 95% CI 0.39 to 2.08, P = 0.81; I2 = 0%; moderate certainty evidence) compared with standard PD catheter insertion. Danielsson 2002 reported no difference in technique failure between the two groups (Analysis 2.3 (60 participants): RR 0.33, 95% CI 0.04 to 3.03) (summary of findings Table 2).
There was considerable heterogeneity in the analysis of peritonitis rate and exit‐site/tunnel infection rate. A detailed subgroup analysis was unable to be performed given that only two studies were included. There were differences in study design (single versus multicentre study), catheter types (Moncrief‐Popovich catheter versus swan‐neck catheter), connection methodology (double bag versus either Y connector or standard spike), and follow‐up periods (0.4 to 44 months versus 12 months) between the two studies that could have introduced heterogeneity. Park 1998 reported no difference in post‐operative bleeding and dialysate leak between the two groups.
Midline versus lateral insertion of the PD catheter
The midline insertion compared with lateral insertion of PD catheters probably makes little or no difference to the risks of peritonitis (Analysis 3.1 (2 studies, 120 participants): RR 0.65, 95% CI 0.32 to 1.33, P = 0.24; I2 = 0%; moderate certainty evidence) and may make little or no difference to exit‐site/tunnel infection (Analysis 3.2 (2 studies, 120 participants): RR 0.56, 95% CI 0.12 to 2.58, P = 0.45; I2= 5%; low certainty evidence) compared with lateral insertion of PD catheter. Rubin 1990 reported midline insertion reduced the risk of catheter removal or replacement compared with lateral insertion (Analysis 3.3 (83 participants): RR 0.57, 95% CI 0.33 to 0.98, P = 0.04). Ejlersen 1990 reported no difference in death (all causes) between midline versus lateral insertion of catheter (Analysis 3.4 (37 participants): RR 8.50, 95% CI 0.50 to 143.32) (summary of findings Table 3). Rubin 1990 reported 6 dialysate leaks in the midline compared with 3 leaks in the lateral insertion group and 1 haematoma at the exit‐site in each group.
Percutaneous insertion versus open surgery
Percutaneous insertion compared with open surgical insertion of a PD catheter probably makes little or no difference to exit‐site/tunnel infection (Analysis 4.1 (2 studies, 96 participants): RR 0.16, 95% CI 0.02 to 1.30, P = 0.08; I2 = 0%; moderate certainty evidence). Atapour 2011 reported no episodes of early peritonitis in either group and similar risks of catheter removal or replacement between the two groups (Analysis 4.2 (1 study, 61 participants): RR 0.24, 95% CI 0.03 to 2.04) (summary of findings Table 4). Percutaneous insertion makes little or no difference to post‐operative bleeding (haematoma or haemoperitoneum) compared to open surgery (Analysis 4.3 (2 studies, 96 participants) RR 0.22, 95% CI 0.04 to 1.26, I2= 0%; low certainty evidence). Atapour 2011) reported 1 outflow failure with percutaneous insertion compared with 4 with open surgery. Two studies (Atapour 2011; Merrikhi 2014) reported no viscus perforation or dialysate leak in either group.
Straight versus coiled PD catheter
A straight catheter probably makes little or no difference to the risk of peritonitis (Analysis 5.1 (9 studies, 818 participants): RR 1.04, 95% CI 0.82 to 1.31, P = 0.74; I2 = 0%; moderate certainty evidence; 9 more per 1000), peritonitis rate (Analysis 5.2 (5 studies, 5882 patient‐months): RR 0.91, 95% CI 0.68 to 1.21, P = 0.51, I2 = 0% moderate certainty evidence), the risk of exit‐site/tunnel infection (Analysis 5.3 (10 studies, 826 participants): RR 1.12, 95% CI 0.94 to 1.34, P = 0.22; I2 = 0%; moderate certainty evidence; 34 more per 1000), and exit‐site/tunnel infection rate (Analysis 5.4 (4 studies, 5286 patient‐months): RR 1.05, 95% CI 0.77 to 1.43, P = 0.78; I2 = 0%; moderate certainty evidence) compared with a coiled catheter. It is uncertain whether straight catheters prevent catheter removal or replacement (Analysis 5.5 (9 studies, 713 participants): RR 1.11, 95% CI 0.73 to 1.66, P = 0.63; I2 = 50%; very low certainty evidence), however, a straight catheter probably makes little or no difference to technique failure (Analysis 5.6 (4 studies, 442 participants): RR 0.82, 95% CI 0.51 to 1.31, P = 0.4; I2 = 0%; moderate certainty evidence) and death (all causes) (Analysis 5.7 (8 studies, 703 participants): RR 0.95, 95% CI 0.62 to 1.46, P = 0.82; I2 = 3%; low certainty evidence) compared with coiled catheters, (summary of findings Table 5). In a sensitivity analysis in which only studies with a low risk of attrition bias were included, similar results were observed for peritonitis (Analysis 5.8: RR 0.93, 95% CI 0.69 to 1.26), peritonitis rate (Analysis 5.9: RR 0.91, 95% CI 0.61 to 1.35), exit‐site infection (Analysis 5.10: RR 1.14, 95% CI 0.94 to 1.39), and exit‐site infection rate (Analysis 5.11; RR 1.18, 95% CI 0.76 to 1.82).
There was moderate heterogeneity (50%) in the analysis of catheter removal/replacement between the two groups. This heterogeneity largely disappeared in a subgroup analysis that only included studies with follow‐up durations of ≥ 2 years, but increased to 74% when studies with follow‐up durations of < 2 years were included in the analysis. The substantial heterogeneity among studies with short follow‐up durations might have been due to different catheter types (double cuff versus single cuff and Tenckhoff versus swan‐neck catheter) and different follow‐up durations (ranged from 12 to 19 months) among the studies. Another possible explanation for the heterogeneity may relate to risk of attrition bias. In sensitivity analysis including only studies with a low risk of attrition bias, the observed heterogeneity was reduced (Analysis 5.12: RR 0.78, 95% CI 0.45 to 1.33; I2 = 32%).
Straight catheter makes little or no difference to dialysate leak compared with coiled catheter (Analysis 5.13 (7 studies, 550 participants): RR 0.74, 95% CI 0.16 to 3.49, P = 0.70; I2 = 37%; low certainty evidence). It is uncertain whether straight catheter lead to post‐operative bleeding (haematoma or haemoperitoneum) compared with coiled catheter (Analysis 5.14 (4 studies, 358 participants): RR 1.14, 95% CI 0.24 to 5.34, P = 0.87; I2 = 0%; very low certainty evidence). Nielsen 1995 reported one case of bladder perforation with coiled catheter but none in the straight catheter group.
Tenckhoff catheter with artificial curve at subcutaneous tunnel tract versus swan‐neck catheter
Catheter with artificial curve at subcutaneous tract compared with swan‐neck catheter may make little or no difference to peritonitis risk (Analysis 6.1 (2 studies, 140 participants): RR 1.29, 95% CI 0.85 to 1.96, P = 0.24; I2 = 0%; low certainty evidence), peritonitis rate (Analysis 6.2 (2 studies, 2535 patient‐months): RR 1.22, 95% CI 0.54 to 2.75, P = 0.63; I2 = 47%; low certainty evidence), exit‐site/tunnel infection (Analysis 6.3 (2 studies, 140 participants): RR 0.96, 95% CI 0.77 to 1.21, P = 0.75; I2 = 0%; moderate certainty evidence), but may improve exit‐site infection rate (Analysis 6.4 (2 studies, 2535 patient‐months): RR 0.67, 95% CI 0.50 to 0.90, P = 0.007; I2 = 0%; low certainty evidence), and probably makes little or no difference to catheter removal or replacement (Analysis 6.5 (2 studies, 140 participants): RR 0.85, 95% CI 0.42 to 1.72, P = 0.65; I2 = 15%; moderate certainty evidence), technique failure (Analysis 6.6 (2 studies, 140 participants): RR 0.64, 95% CI 0.26 to 1.58, P = 0.3;, I2 = 0%; moderate certainty evidence), and death, all causes (Analysis 6.7 (2 studies, 140 participants): (RR 0.74, 95% CI 0.27 to 2.03, P = 0.57; I2 = 0%; moderate certainty evidence) compared with insertion of PD catheters with an artificial curve at the tunnel tract (summary of findings Table 6). Yip 2010 reported no dialysate leaks in either group but there was one superficial cuff extrusion in the swan‐neck catheter group but none in the other group. Li 2009e reported post‐operative bleeding from the main wound (5 versus 9) and exit‐site (9 versus 13) in Tenckhoff catheter and swan‐neck catheter respectively.
Self‐locating catheter versus straight catheter
It is uncertain whether self‐locating catheter reduces catheter removal or replacement (Analysis 7.3 (2 studies, 139 participants): RR 0.32, 95% CI 0.03 to 3.06, P = 0.32; I2 = 64%; very low certainty of evidence). Self‐locating catheter probably slightly reduces technique failure (Analysis 7.4 (2 studies, 139 participants): RR 0.64, 95% CI 0.39 to 1.04, P = 0.07; I2 = 0%; moderate certainty evidence), but may make little or no difference to death (all causes) (Analysis 7.5 (2 studies, 139 participants): RR 1.02, 95% CI 0.11 to 9.75, P = 0.99; I2 = 49%; low certainty evidence) compared to a straight catheter. Sanchez‐Canel 2016 reported no difference in the incidence of peritonitis (Analysis 7.1 (78 participants): RR 1.13, 95% CI 0.86 to 1.49) and exit‐site infection (Analysis 7.2 (78 participants): RR 0.95, 95% CI 0.37 to 2.45) (summary of findings Table 7). Moderate heterogeneity was observed with analysis for catheter removal/replacement and death (all causes), for which subgroup analysis was unable to be performed given the small number of studies. The potential explanation for heterogeneity might have related to the suboptimal quality of included studies, which did not report the method of randomisation, blinding and follow up duration. In addition, one study reported different baseline BMI values between the treatment and control groups and the other study interrupted recruitment early due to an observed significant reduction in the incidence of catheter removal/replacement in the treatment group. Self‐locating catheter makes little or no difference to dialysate leak compared with straight catheter (Analysis 7.6 (2 studies, 139 participants): RR 1.04, 95% CI 0.46 to 2.35, P = 0.93; I2 = 0%; low certainty evidence). Sanchez‐Canel 2016 reported post‐operative peritoneal bleed (7 versus 6) in self‐locating and straight catheter groups respectively.
Other interventions
The risk of peritonitis and/or peritonitis rate were examined using:
-
Different insertion techniques: open surgery versus open surgery with omentum folding (Analysis 8.1), open surgery versus modified surgery with or without catheter fixation (Analysis 9.1), open surgery versus vertical tunnel‐based low‐site implantation (Analysis 10.1), open surgery versus ureteroscopic‐assisted surgery (Analysis 11.1), radiological versus surgical implantation (Analysis 12.1), cystoscopy‐assisted surgery versus open surgery (Analysis 13.1), laparoscopic Moncrief‐Popovich technique versus blind trocar technique (Analysis 14.1)
-
Different catheter types: single–cuff versus double‐cuff catheter (Analysis 15.1), double‐cuff versus triple‐cuff catheter (Analysis 16.1), swan‐neck versus straight curled catheter (Analysis 17.1), antibiotic‐treated catheters versus standard catheter (Analysis 18.1)
-
Immobilizer device versus no immobilizer device (Analysis 19.1)
-
Silver ring at exit‐site versus no silver ring (Analysis 20.1)
See (Table 2).
| Name of studies | Relative risk | 95% CI | P value |
| Peritonitis | |||
| Methods of catheter implantation | |||
| 1.41 | 0.25 to 7.91 | 0.69 | |
| 1.20 | 0.59 to 2.42 | 0.61 | |
| 0.93 | 0.48 to 1.80 | 0.82 | |
| 0.39 | 0.11 to 1.42 | 0.15 | |
| 0.81 | 0.41 to 1.61 | 0.55 | |
| 0.21 | 0.03 to 1.61 | 0.13 | |
| 0.60 | 0.20 to 1.81 | 0.36 | |
| Types of catheter | |||
| 0.82 | 0.50 to 1.35 | 0.44 | |
| 0.34 | 0.07 to 1.59 | 0.17 | |
| 0.80 | 0.29 to 2.21 | 0.67 | |
| 0.78 | 0.6 to 1.69 | 0.53 | |
| Other intervention | |||
| 0.90 | 0.49 to 1.66 | 0.73 | |
| 1.20 | 0.59 to 2.42 | 0.61 | |
| Peritonitis rate (patient‐month) | |||
| Methods of catheter implantation | |||
| 1.40 | 0.23 to 8.34 | 0.71 | |
| 0.67 | 0.38 to 1.18 | 0.16 | |
| Types of catheters | |||
| 0.34 | 0.07 to 1.69 | 0.19 | |
| 0.69 | 0.19 to 2.53 | 0.57 | |
CI: confidence interval
Dasgupta 1998 reported 14 episodes of peritonitis in 19 patients using Moncrief‐Popovich catheter compared with 22 episodes of peritonitis in 20 patients using Tenckhoff catheter. The other outcomes were not different among these studies except that Zhang 2016 reported that catheter removal/replacement was lower with modified surgery with or without catheter fixation compared with open surgery (Analysis 9.3 (152 participants): RR 0.16, 95% CI 0.03 to 0.76).
Break‐in periods
Timely PD 2010 (122 participants) examined the effect of different break‐in periods (1 week versus 2 weeks versus 4 weeks post catheter insertion) on the composite PD‐related infection (defined as exit‐site/tunnel infection and/or peritonitis) at 4 weeks after PD initiation and 8 weeks after catheter insertion reported that there was no difference across 3 groups. The study reported higher risk of dialysate leak in break‐in period of 1 week compared with 4 weeks (11 versus 1 respectively). There was one post‐operative wound haematoma observed in the break‐in period of 2 weeks but none in the other groups.
Discusión
Resumen de los resultados principales
La revisión demostró que ninguna técnica específica de implantación de catéteres para la DP o tipo de catéter redujo significativamente el riesgo de peritonitis por DP. En un solo estudio con un número pequeño de participantes, la inserción del catéter en la línea media resultó en un menor riesgo de extracción/reemplazo en comparación con la inserción lateral, y en otro estudio pequeño, de un solo centro, la cirugía abierta modificada con o sin fijación del catéter resultó en un menor riesgo de extracción/reemplazo en comparación con la cirugía abierta. De manera similar, en otros dos pequeños estudios metodológicamente subóptimos con 140 participantes, un catéter de cuello de cisne se asoció con una tasa más alta de infección en el sitio de salida/túnel que un catéter Tenckhoff con una curva artificial en el tracto subcutáneo.
Compleción y aplicabilidad general de las pruebas
Desde la última revisión en 2004, hubo ECA limitados que examinaron las diferentes técnicas quirúrgicas nuevas o tipos de catéter para la DP en la última década, pero ninguno ha demostrado ser superior en la reducción de la peritonitis. Sin embargo, también se debe reconocer que hubo mejorías generales en las tasas de peritonitis a nivel mundial desde el momento de la última revisión sistemática (Li 2017; Mehrotra 2016). La tendencia general en la mejora de las tasas de peritonitis podría dificultar que cualquier intervención en esta área logre una mejora importante adicional.
La comparación entre las diferentes técnicas de implantación del catéter para la DP demostró que ninguna técnica específica era superior en la prevención de la peritonitis y la infección del túnel/sitio de salida. En general, la mayoría de los estudios procedían de centros únicos e incluían poblaciones de estudio pequeñas a las que se siguió durante períodos de tiempo variables. No hubo un método estandarizado para informar los resultados relacionados con la infección (peritonitis e infección del sitio de salida/túnel); un estudio informó de infección precoz y total (Gadallah 1999), dos estudios informaron de infección precoz y tardía por separado (Jwo 2010; Wright 1999), y el resto de los estudios informaron de infección total. Las definiciones de infección precoz (≤ 2 semanas a ≤ 6 semanas) y de infección tardía (> 2 semanas a > 6 semanas) también variaron entre los estudios. Gadallah 1999 postuló que la mayor tasa de peritonitis precoz (dentro de las dos semanas de la colocación del catéter) probablemente se debió a una mayor incidencia de pérdidas en el sitio de salida relacionada con la técnica de inserción del catéter. En esta revisión, la mayoría de los estudios incluidos informaron de infección general (peritonitis o infección del sitio de salida/túnel) en lugar de informar por separado sobre infecciones precoces y tardías. El beneficio potencial de la técnica de inserción del catéter en la prevención de la infección relacionada con el mismo, especialmente en el período inicial de inserción, no pudo ser evaluado de forma exhaustiva en esta revisión.
Además, la mayoría de estos estudios solo informaron sobre la incidencia de peritonitis o la tasa de peritonitis, pero no ambas. Asimismo, algunos estudios no informaron de detalles sobre el uso de antibióticos profilácticos antes de la implantación del catéter, que es una intervención clave que ha demostrado reducir de forma convincente el riesgo de peritonitis temprana en pacientes en DP en el metanálisis anterior (Strippoli 2004a).
Cinco estudios examinaron los efectos de la laparoscopia versus laparotomía y demostraron que los riesgos de peritonitis e infección del sitio de salida/túnel no fueron significativamente diferentes entre los dos métodos.
Moncrief 1998 informó que la implantación del catéter con inserción subcutánea profunda durante tres a cinco semanas se asoció con una menor incidencia de peritonitis. Sin embargo, en esta revisión, la inserción subcutánea profunda de un catéter para la DP durante seis semanas antes de la iniciación de la DP ejerció efectos comparables sobre la peritonitis, la infección del túnel/sitio de salida y la muerte (todas las causas) en comparación con la técnica de inserción estándar. En vista de la calidad metodológica subóptima y del pequeño número de estudios y participantes, no hubo datos suficientes para establecer conclusiones con respecto al valor de esta técnica.
Spence 1985 informó que la inserción paramediana se asoció con una reducción en la incidencia de pérdida y extrusión del manguito en comparación con la inserción en la línea media del catéter de DP. En esta revisión, la inserción del catéter de DP en la línea media versus la inserción lateral no afectó significativamente los riesgos de peritonitis, infección en el sitio de salida/túnel y muerte (todas las causas). Sin embargo, en un solo estudio pequeño, la inserción en la línea media resultó en un menor riesgo de extracción/reemplazo del catéter que la inserción lateral. En ese estudio en particular, hubo un sesgo potencial ya que el estudio introdujo dos intervenciones diferentes (catéteres en espiral versus catéteres rectos y técnicas de inserción lateral versus línea media) al mismo tiempo. En otro ECA que examinó la inserción de catéteres en la línea media versus lateral (Ejlersen 1990), las tasas de supervivencia con el catéter de un año fueron comparables entre los dos grupos (línea media 59% versus lateral 51%). En vista de la calidad metodológica subóptima y del escaso número de estudios disponibles, no hay datos suficientes para establecer conclusiones definitivas con respecto a los efectos de la inserción en la línea media versus la inserción lateral sobre los resultados examinados en esta revisión.
En un estudio pequeño de centro único, Zhang 2016 informó que un método modificado de colocación del catéter, que se caracterizó por un sitio de implante bajo, un segmento de catéter intraabdominal corto y un túnel subcutáneo recto ascendente, redujo significativamente la incidencia de extracción/reemplazo del catéter en comparación con la cirugía abierta. Los autores postularon que un segmento largo de catéter intraabdominal con un método quirúrgico abierto tradicional podría llevar a un mayor riesgo de migración de la punta del catéter y envoltura epiploica. Sin embargo, en ese estudio, hubo una tendencia hacia una alta incidencia de participantes con cirugía abdominal previa en el grupo de cirugía abierta (20,4%) versus el grupo de cirugía abierta modificada con o sin fijación del catéter (11,7%). En vista del diseño de centro único, la población de estudio pequeña y la calidad metodológica subóptima, no se puede establecer una conclusión firme con respecto al efecto de la cirugía abierta versus la cirugía abierta modificada con o sin fijación del catéter sobre la incidencia de la extracción/reemplazo del catéter.
El tipo de catéter examinado con mayor frecuencia fue el catéter recto versus el catéter en espiral, que no demostró diferencias significativas en la peritonitis, la infección en el sitio de salida/túnel y la extracción/reemplazo del catéter o la muerte (todas las causas). Hubo heterogeneidad moderada en el análisis de la extracción/reemplazo del catéter entre los dos grupos. La heterogeneidad se resolvió cuando solo se incluyeron en el análisis los estudios con un seguimiento de ≥ 2 años, pero aumentó cuando se incluyeron adicionalmente los estudios con seguimiento de < 2 años. La heterogeneidad significativa entre los estudios con seguimiento de corta duración podría deberse a diferentes tipos de catéteres (dos piezas versus una pieza y Tenckhoff versus catéter de cuello de cisne) y diferentes duraciones de seguimiento (de 12 a 19 meses).
Dos estudios pequeños que compararon los catéteres de cuello de cisne y los catéteres de DP con curvas artificiales en el tracto subcutáneo no mostraron diferencias significativas en el riesgo de peritonitis, la tasa de peritonitis, el riesgo de infección en el sitio de salida/túnel, la extracción/reemplazo del catéter, el fracaso de la técnica y la muerte (todas las causas). Aunque el análisis del riesgo de infección del sitio de salida/túnel no encontró diferencias significativas entre los dos grupos, la tasa de infección del sitio de salida/túnel fue significativamente mayor en el grupo con catéter de cuello de cisne. Este hallazgo podría explicarse por un mayor número de participantes con infección repetida/recurrente en el sitio de salida/túnel en el grupo de cuello de cisne. Alternativamente, el resultado podría haber sido un hallazgo fortuito o estar relacionado con un sesgo derivado de una calidad metodológica subóptima. De manera tranquilizadora, no hubo diferencias en el riesgo de extracción del catéter o de fracaso de la técnica.
Calidad de la evidencia
La calidad metodológica de la evidencia para la mayoría de los estudios se consideró subóptima. Los métodos de asignación al azar y de ocultación de la asignación no se describieron claramente en la mayoría de los estudios. La mayoría de los estudios incluidos fueron de un solo centro con tamaños de muestra pequeños y tuvieron períodos de seguimiento ampliamente variables. Un pequeño número de estudios (33%) analizó los datos mediante el método de intención de tratar. Además, la mayoría de los estudios no se registraron en las bases de datos de ensayos clínicos, no habían publicado un protocolo del estudio y no informaron sobre muchos resultados de los pacientes que podrían haber contribuido al riesgo de sesgo de informe selectivo. Timely PD 2010 solo informó de un resultado compuesto de infección del sitio de salida y peritonitis por lo que no pudo realizarse el análisis de los resultados individuales. Además, los tipos de intervenciones examinadas fueron numerosos, con muy pocos estudios (uno o dos estudios) en cada categoría, de manera que no se pudieron establecer conclusiones definitivas. Finalmente, el riesgo de peritonitis puede haber sido modificado por otras cointervenciones no informadas, como el protocolo del centro para antibióticos profilácticos antes de la implantación del catéter, el protocolo de entrenamiento para la DP y la atención en el sitio de salida, otros factores específicos del centro y la habilidad y experiencia de los profesionales, que no pudieron ser ajustados para la revisión.
Sesgos potenciales en el proceso de revisión
Esta revisión se realizó según la metodología Cochrane estandarizada publicada. La revisión incluyó las publicaciones actualizadas a través de búsquedas en MEDLINE, EMBASE y CENTRAL con la asistencia del Especialista en Información. La revisión incluyó ECA y ensayos controlados cuasialeatorizados. Todas las publicaciones potenciales fueron evaluadas por dos autores independientes que realizaron la extracción de datos, el análisis de datos y la evaluación de la calidad de los estudios de forma independiente. Cualquier desacuerdo o preocupación acerca de los datos entre los dos autores se resolvió con dos autores adicionales. Se estableció contacto con los autores primarios para buscar los datos adicionales para el análisis por parte de los autores. Unos pocos resúmenes/publicaciones, que se publicaron hace una década, no pudieron incluirse en esta revisión porque no fue posible establecer contacto con los autores principales para obtener información adicional. Finalmente, existe un potencial de sesgo, ya que uno de los investigadores de esta revisión (DWJ) también fue autor de un estudio incluido (Johnson 2006).
Acuerdos y desacuerdos con otros estudios o revisiones
De forma similar a la revisión publicada anteriormente (Strippoli 2004), este estudio ha demostrado que ningún tipo específico de catéter o método de implantación fue superior para reducir el riesgo de peritonitis por DP. El metanálisis anterior de Xie 2011a no informó de diferencias significativas en la peritonitis (7 estudios): CR 1,12; IC del 95%: 0,83 a 1,50) o infección del sitio de salida/túnel (6 estudios: CR 1,05; IC del 95%: 0,79 a 1,39) entre los catéteres rectos versus en espiral. Los resultados de esta revisión actualizada apoyan los hallazgos de las revisiones anteriores.
Un metanálisis de Hagen 2014 que incluyó ECA y estudios de cohortes, en que se comparó la inserción laparoscópica y la laparotomía, tampoco informó de diferencias significativas en la peritonitis (9 estudios): OR 0,83; IC del 95%: 0,48 a 1,42) e infección del sitio de salida/túnel (7 estudios: OR 0,80; IC del 95%: 0,47 a 1,37) entre los dos grupos. Esta revisión solo incluyó ECA de laparoscopia versus laparotomía e informó de hallazgos similares.
La revisión también demostró que la extracción o el reemplazo del catéter y el fracaso de la técnica no fueron significativamente diferentes entre los diferentes métodos de implantación, incluidos los catéteres colocados mediante cirugía o por vía laparoscópica. El hallazgo fue contrario al de un metanálisis anterior (Hagen 2014), que incluyó ECA y estudios de cohorte, e informó que la supervivencia a un año del catéter fue significativamente mayor en el grupo de laparoscopia en comparación con el grupo de laparotomía. El resultado del metanálisis anterior puede haber sido sesgado debido a que la mayoría de los estudios incluidos no eran ECA (ocho estudios de cohortes comparados con tres ECA). Hasta la fecha, solo hubo cuatro ECA que compararon métodos laparoscópicos versus laparotomía: los cuatro estudios fueron diseñados en un solo centro, solo un estudio fue analizado por el método de intención de tratar, todos los estudios practicaron diferentes regímenes de profilaxis antibiótica con dosis variables (2 g de vancomicina versus 0,5 a 1 g de cefazolina) antes del procedimiento y todos iniciaron la DP en diferentes momentos después del procedimiento quirúrgico (desde inmediatamente después del procedimiento hasta varios días después). Los datos disponibles en la actualidad sugieren que la inserción laparoscópica resulta en poca o ninguna diferencia en la infección relacionada con la DP, la extracción o sustitución del catéter, la técnica o la supervivencia del paciente en comparación con la laparotomía.
En esta revisión, los diferentes tipos de catéteres, incluidos los catéteres rectos versus los catéteres en espiral/curvados (ya sea en la punta o en el tracto subcutáneo), no se asociaron significativamente con la extracción/reemplazo del catéter y el fracaso de la técnica en pacientes en DP. Hubo heterogeneidad moderada en el análisis de la extracción/reemplazo de catéteres en la revisión, lo cual pudo deberse a que diferentes estudios utilizaron distintos tipos de catéteres, incluidos distintos productos de compañías fabricantes, catéteres de una o dos piezas y diferentes métodos de colocación (métodos quirúrgicos percutáneos versus abiertos). La heterogeneidad disminuyó pero no se resolvió totalmente después del análisis de subgrupos con catéteres de punta recta versus catéteres de punta en espiral/curvada y catéteres de punta recta versus catéteres curvados en el tracto subcutáneo, método quirúrgico abierto versus método de inserción percutánea y catéteres de una pieza versus catéteres de dos piezas. De manera similar, el metanálisis anterior de Xie 2011a, que comparó los catéteres de punta recta versus los catéteres de punta en espiral, informó que aunque hubo un riesgo significativamente mayor de migración de la punta del catéter con catéteres en espiral, el fracaso general del catéter no fue significativamente diferente entre los dos grupos.
Esta revisión demostró que no hubo diferencias significativas en la muerte (todas las causas) entre los catéteres rectos y en espiral. En cambio, la revisión anterior (Strippoli 2004) informó que hubo una ventaja de supervivencia con los catéteres rectos en comparación con los catéteres curvos. La discrepancia en los resultados entre las dos revisiones puede explicarse porque esta revisión incluyó un mayor número de estudios (ocho ECA versus cuatro ECA) y más estudios bien diseñados en comparación con la revisión anterior.
Risk of bias summary: review authors' judgements about each risk of bias item for each included study.
Risk of bias graph: review authors' judgements about each risk of bias item presented as percentages across all included studies.

Comparison 1 Laparoscopy versus laparotomy, Outcome 1 Peritonitis.

Comparison 1 Laparoscopy versus laparotomy, Outcome 2 Peritonitis rate (patient‐months).

Comparison 1 Laparoscopy versus laparotomy, Outcome 3 Exit‐site/tunnel infection.

Comparison 1 Laparoscopy versus laparotomy, Outcome 4 Catheter removal or replacement.

Comparison 1 Laparoscopy versus laparotomy, Outcome 5 Technique failure.

Comparison 1 Laparoscopy versus laparotomy, Outcome 6 Death (all causes).

Comparison 1 Laparoscopy versus laparotomy, Outcome 7 Dialysate leak.

Comparison 2 Buried (subcutaneous) versus non‐buried catheter, Outcome 1 Peritonitis rate (patient‐months).

Comparison 2 Buried (subcutaneous) versus non‐buried catheter, Outcome 2 Exit‐site/tunnel infection rate (patient‐months).

Comparison 2 Buried (subcutaneous) versus non‐buried catheter, Outcome 3 Technique failure.

Comparison 2 Buried (subcutaneous) versus non‐buried catheter, Outcome 4 Death (all causes).

Comparison 3 Midline versus lateral insertion, Outcome 1 Peritonitis.

Comparison 3 Midline versus lateral insertion, Outcome 2 Exit‐site/tunnel infection.

Comparison 3 Midline versus lateral insertion, Outcome 3 Catheter removal or replacement.

Comparison 3 Midline versus lateral insertion, Outcome 4 Death (all causes).

Comparison 4 Percutaneous insertion versus open surgery, Outcome 1 Exit‐site/tunnel infection.

Comparison 4 Percutaneous insertion versus open surgery, Outcome 2 Catheter removal or replacement.

Comparison 4 Percutaneous insertion versus open surgery, Outcome 3 Postoperative bleed (haematoma or haemoperitoneum).

Comparison 5 Straight versus coiled catheters, Outcome 1 Peritonitis.

Comparison 5 Straight versus coiled catheters, Outcome 2 Peritonitis rate (patient‐months).

Comparison 5 Straight versus coiled catheters, Outcome 3 Exit‐site/tunnel infection.

Comparison 5 Straight versus coiled catheters, Outcome 4 Exit‐site/tunnel infection rate (patient‐months).

Comparison 5 Straight versus coiled catheters, Outcome 5 Catheter removal or replacement.

Comparison 5 Straight versus coiled catheters, Outcome 6 Technique failure.

Comparison 5 Straight versus coiled catheters, Outcome 7 Death (all causes).

Comparison 5 Straight versus coiled catheters, Outcome 8 Peritonitis (studies with low risk of attrition bias).

Comparison 5 Straight versus coiled catheters, Outcome 9 Peritonitis rate (patient‐months) (studies with low risk of attrition bias).

Comparison 5 Straight versus coiled catheters, Outcome 10 Exit‐site/tunnel infection (studies with low risk of attrition bias).

Comparison 5 Straight versus coiled catheters, Outcome 11 Exit‐site/tunnel infection rate (patient‐months) (studies with low risk of attrition bias).

Comparison 5 Straight versus coiled catheters, Outcome 12 Catheter removal or replacement (studies with low risk of attrition bias).

Comparison 5 Straight versus coiled catheters, Outcome 13 Dialysate leak.

Comparison 5 Straight versus coiled catheters, Outcome 14 Postoperative bleeding (haematoma or haemoperitoneum).

Comparison 6 Tenckhoff catheter with artificial curve at tunnel tract versus Swan‐neck, Outcome 1 Peritonitis.

Comparison 6 Tenckhoff catheter with artificial curve at tunnel tract versus Swan‐neck, Outcome 2 Peritonitis rate (patient‐months).

Comparison 6 Tenckhoff catheter with artificial curve at tunnel tract versus Swan‐neck, Outcome 3 Exit‐site/tunnel infection.

Comparison 6 Tenckhoff catheter with artificial curve at tunnel tract versus Swan‐neck, Outcome 4 Exit‐site/tunnel infection rate (patient‐months).

Comparison 6 Tenckhoff catheter with artificial curve at tunnel tract versus Swan‐neck, Outcome 5 Catheter removal or replacement.

Comparison 6 Tenckhoff catheter with artificial curve at tunnel tract versus Swan‐neck, Outcome 6 Technique failure.

Comparison 6 Tenckhoff catheter with artificial curve at tunnel tract versus Swan‐neck, Outcome 7 Death (all causes).

Comparison 7 Self‐locating catheter versus straight tenckhoff catheter, Outcome 1 Peritonitis.

Comparison 7 Self‐locating catheter versus straight tenckhoff catheter, Outcome 2 Exit‐site/tunnel infection.

Comparison 7 Self‐locating catheter versus straight tenckhoff catheter, Outcome 3 Catheter removal or replacement.

Comparison 7 Self‐locating catheter versus straight tenckhoff catheter, Outcome 4 Technique failure.

Comparison 7 Self‐locating catheter versus straight tenckhoff catheter, Outcome 5 Death (all causes).

Comparison 7 Self‐locating catheter versus straight tenckhoff catheter, Outcome 6 Dialysate leak.

Comparison 8 Open insertion with omentum folding versus open surgery, Outcome 1 Peritonitis.

Comparison 8 Open insertion with omentum folding versus open surgery, Outcome 2 Peritonitis rate (patient‐months).

Comparison 8 Open insertion with omentum folding versus open surgery, Outcome 3 Exit‐site/tunnel infection.

Comparison 8 Open insertion with omentum folding versus open surgery, Outcome 4 Exit‐site/tunnel infection rate (patient‐month).

Comparison 8 Open insertion with omentum folding versus open surgery, Outcome 5 Catheter removal or replacement.

Comparison 8 Open insertion with omentum folding versus open surgery, Outcome 6 Technique failure.

Comparison 8 Open insertion with omentum folding versus open surgery, Outcome 7 Death (all causes).

Comparison 8 Open insertion with omentum folding versus open surgery, Outcome 8 Dialysate leak.

Comparison 8 Open insertion with omentum folding versus open surgery, Outcome 9 Postoperative bleed (haematoma or haemoperitoneum).

Comparison 9 Modified surgery with or without catheter fixation versus open surgery, Outcome 1 Peritonitis.

Comparison 9 Modified surgery with or without catheter fixation versus open surgery, Outcome 2 Exit‐site/tunnel infection.

Comparison 9 Modified surgery with or without catheter fixation versus open surgery, Outcome 3 Catheter removal or replacement.

Comparison 9 Modified surgery with or without catheter fixation versus open surgery, Outcome 4 Dialysate leak.

Comparison 9 Modified surgery with or without catheter fixation versus open surgery, Outcome 5 Postoperative bleed (haematoma or haemoperitoneum).

Comparison 10 Vertical tunnel‐based low‐site insertion versus open surgery, Outcome 1 Peritonitis.

Comparison 10 Vertical tunnel‐based low‐site insertion versus open surgery, Outcome 2 Exit‐site/tunnel infection.

Comparison 11 Ureteroscope‐assisted technique versus modified open surgery, Outcome 1 Peritonitis.

Comparison 11 Ureteroscope‐assisted technique versus modified open surgery, Outcome 2 Exit‐site/tunnel infection.

Comparison 11 Ureteroscope‐assisted technique versus modified open surgery, Outcome 3 Death (all causes).

Comparison 12 Radiological versus surgical implantation, Outcome 1 Peritonitis rate (patient‐month).

Comparison 12 Radiological versus surgical implantation, Outcome 2 Exit‐site/tunnel infection (patient‐months).

Comparison 12 Radiological versus surgical implantation, Outcome 3 Catheter removal or replacement.

Comparison 12 Radiological versus surgical implantation, Outcome 4 Death (all causes).

Comparison 12 Radiological versus surgical implantation, Outcome 5 Dialysate leak.

Comparison 13 Cystoscopy‐assisted surgery versus open surgery, Outcome 1 Peritonitis.

Comparison 13 Cystoscopy‐assisted surgery versus open surgery, Outcome 2 Exit‐site/tunnel infection.

Comparison 13 Cystoscopy‐assisted surgery versus open surgery, Outcome 3 Dialysate leak.

Comparison 14 Laparoscopic Moncrief‐Popovich versus Trocar technique, Outcome 1 Peritonitis.

Comparison 14 Laparoscopic Moncrief‐Popovich versus Trocar technique, Outcome 2 Exit‐site infection.

Comparison 14 Laparoscopic Moncrief‐Popovich versus Trocar technique, Outcome 3 Dialysate leak.

Comparison 15 Single versus double cuff, Outcome 1 Peritonitis.

Comparison 15 Single versus double cuff, Outcome 2 Exit‐site/tunnel infection.

Comparison 15 Single versus double cuff, Outcome 3 Catheter removal or replacement.

Comparison 15 Single versus double cuff, Outcome 4 Technique failure.

Comparison 15 Single versus double cuff, Outcome 5 Death (all causes).

Comparison 16 Triple cuff versus double catheter, Outcome 1 Peritonitis.

Comparison 16 Triple cuff versus double catheter, Outcome 2 Peritonitis rate (patient‐months).

Comparison 16 Triple cuff versus double catheter, Outcome 3 Exit‐site/tunnel infection.

Comparison 16 Triple cuff versus double catheter, Outcome 4 Exit‐site/tunnel infection (patient‐months).

Comparison 16 Triple cuff versus double catheter, Outcome 5 Catheter removal or replacement.

Comparison 16 Triple cuff versus double catheter, Outcome 6 Dialysate leak.

Comparison 17 Swan‐neck versus straight curled catheter, Outcome 1 Peritonitis.

Comparison 17 Swan‐neck versus straight curled catheter, Outcome 2 Peritonitis rate (patient‐months).

Comparison 17 Swan‐neck versus straight curled catheter, Outcome 3 Exit‐site/tunnel infection.

Comparison 17 Swan‐neck versus straight curled catheter, Outcome 4 Exit‐site/tunnel infection rate (patient‐months).

Comparison 17 Swan‐neck versus straight curled catheter, Outcome 5 Technique failure.

Comparison 17 Swan‐neck versus straight curled catheter, Outcome 6 Dialysate leak.

Comparison 18 Antibiotic‐treated catheter versus none, Outcome 1 Peritonitis.

Comparison 18 Antibiotic‐treated catheter versus none, Outcome 2 Exit‐site/tunnel infection.

Comparison 18 Antibiotic‐treated catheter versus none, Outcome 3 Catheter removal or replacement.

Comparison 18 Antibiotic‐treated catheter versus none, Outcome 4 Death (all causes).

Comparison 19 Immobilisation versus no immobilisation, Outcome 1 Peritonitis.

Comparison 19 Immobilisation versus no immobilisation, Outcome 2 Exit‐site/tunnel infection.

Comparison 20 Silver ring versus no silver ring, Outcome 1 Peritonitis.

Comparison 20 Silver ring versus no silver ring, Outcome 2 Exit‐site/tunnel infection.

Comparison 20 Silver ring versus no silver ring, Outcome 3 Technique failure.

Comparison 20 Silver ring versus no silver ring, Outcome 4 Death (all causes).
| Laparoscopy versus laparotomy for preventing catheter‐related infections in chronic peritoneal dialysis patients | |||||
| Patient or population: chronic peritoneal dialysis patients | |||||
| Outcomes | Anticipated absolute effects* (95% CI) | Relative effect | No. of participants or patient‐months | Certainty of the evidence | |
| Risk with laparotomy | Risk with laparoscopy | ||||
| Peritonitis | 242 per 1,000 | 218 per 1,000 | RR 0.90 | 315 (4) | ⊕⊕⊕⊝ |
| Peritonitis rate (patient‐months) | 59 per 1,000 | 52 per 1,000 | RR 0.89 | 375 (1) | ⊕⊝⊝⊝ |
| Exit‐site/tunnel infection | 125 per 1,000 | 125 per 1,000 | RR 1.00 | 270 (3) | ⊕⊕⊝⊝ |
| Catheter removal or replacement | 281 per 1,000 | 337 per 1,000 | RR 1.20 | 167 (3) | ⊕⊕⊝⊝ |
| Technique failure | 293 per 1,000 | 208 per 1,000 | RR 0.71 | 283 (4) | ⊕⊕⊝⊝ |
| Death (all causes) | 140 per 1,000 | 176 per 1,000 | RR 1.26 | 270 (3) | ⊕⊕⊕⊝ |
| *The risk in the intervention group (and its 95% confidence interval) is based on the assumed risk in the comparison group and the relative effect of the intervention (and its 95% CI). | |||||
| GRADE Working Group grades of evidence | |||||
| 1 Downgraded one level: suboptimal quality of studies 2 Downgraded two levels: single study with suboptimal quality and imprecision 3 Downgraded two levels: suboptimal quality and imprecision | |||||
| Buried (subcutaneous) versus non‐buried catheter for preventing catheter‐related infections in chronic peritoneal dialysis patients | |||||
| Patient or population: chronic peritoneal dialysis patients | |||||
| Outcomes | Anticipated absolute effects* (95% CI) | Relative effect | No. of participants or patient‐months | Certainty of the evidence | |
| Risk with non‐buried | Risk with buried (subcutaneous) | ||||
| Peritonitis rate (patient‐months) | 37 per 1,000 | 43 per 1,000 | RR 1.16 | 2511 (2) | ⊕⊝⊝⊝ |
| Exit‐site/tunnel infection rate (patient‐months) | 31 per 1,000 | 36 per 1,000 | RR 1.15 | 2511 (2) | ⊕⊝⊝⊝ |
| Technique failure | 367 per 1,000 | 268 per 1,000 | RR 0.73 | 60 (1) | ⊕⊝⊝⊝ |
| Death (all causes) | 169 per 1,000 | 153 per 1,000 | RR 0.90 | 119 (2) | ⊕⊕⊕⊝ |
| *The risk in the intervention group (and its 95% confidence interval) is based on the assumed risk in the comparison group and the relative effect of the intervention (and its 95% CI). | |||||
| GRADE Working Group grades of evidence | |||||
| 1 Downgraded three levels: suboptimal quality, inconsistency, and imprecision 2 Downgraded three levels: single study, suboptimal quality, and imprecision 3 Downgraded two levels: suboptimal quality of studies and imprecision | |||||
| Midline versus lateral insertion for preventing catheter‐related infections in chronic peritoneal dialysis patients | |||||
| Patient or population: chronic peritoneal dialysis patients | |||||
| Outcomes | Anticipated absolute effects* (95% CI) | Relative effect | No. of participants | Certainty of the evidence | |
| Risk with lateral | Risk with midline | ||||
| Peritonitis | 255 per 1,000 | 166 per 1,000 | RR 0.65 | 120 (2) | ⊕⊕⊕⊝ |
| Exit‐site/tunnel infection | 78 per 1,000 | 44 per 1,000 | RR 0.56 | 120 (2) | ⊕⊕⊝⊝ |
| Catheter removal or replacement | 514 per 1,000 | 293 per 1,000 | RR 0.57 | 83 (1) | ⊕⊝⊝⊝ VERY LOW 3 |
| Death (all causes) | 0 per 1,000 | 0 per 1,000 | RR 8.50 | 37 (1) | ⊕⊝⊝⊝ |
| *The risk in the intervention group (and its 95% confidence interval) is based on the assumed risk in the comparison group and the relative effect of the intervention (and its 95% CI). | |||||
| GRADE Working Group grades of evidence | |||||
| 1 Downgraded one level: suboptimal quality of studies 2 Downgraded two levels: suboptimal quality and imprecision 3 Downgraded three levels: single study, suboptimal quality study, and imprecision | |||||
| Percutaneous insertion versus open surgery for preventing catheter‐related infections in chronic peritoneal dialysis patients | |||||
| Patient or population: chronic peritoneal dialysis patients | |||||
| Outcomes | Anticipated absolute effects* (95% CI) | Relative effect | No. of participants | Certainty of the evidence | |
| Risk with open surgery | Risk with percutaneous insertion | ||||
| Exit‐site/tunnel infection | 106 per 1,000 | 17 per 1,000 | RR 0.16 | 96 | ⊕⊕⊕⊝ |
| Catheter removal or replacement | 133 per 1,000 | 32 per 1,000 | RR 0.24 | 61 | ⊕⊝⊝⊝ |
| *The risk in the intervention group (and its 95% confidence interval) is based on the assumed risk in the comparison group and the relative effect of the intervention (and its 95% CI). | |||||
| GRADE Working Group grades of evidence | |||||
| 1 Downgraded one level: suboptimal quality of studies 2 Downgraded two levels: single study with suboptimal quality and imprecision | |||||
| Straight versus coiled catheters for preventing catheter‐related infections in chronic peritoneal dialysis patients | |||||
| Patient or population: chronic peritoneal dialysis patients | |||||
| Outcomes | Anticipated absolute effects* (95% CI) | Relative effect | No. of participants or patient‐months | Certainty of the evidence | |
| Risk with coiled | Risk with straight | ||||
| Peritonitis | 217 per 1,000 | 225 per 1,000 | RR 1.04 | 818 (9) | ⊕⊕⊕⊝ |
| Peritonitis rate (patient‐months) | 32 per 1,000 | 29 per 1,000 | RR 0.91 | 5882 (5) | ⊕⊕⊕⊝ |
| Exit‐site/tunnel infection | 281 per 1,000 | 314 per 1,000 | RR 1.12 | 826 (10) | ⊕⊕⊕⊝ |
| Exit‐site/tunnel infection rate (patient‐months) | 27 per 1,000 | 28 per 1,000 | RR 1.05 | 5286 (4) | ⊕⊕⊕⊝ |
| Catheter removal or replacement | 249 per 1,000 | 276 per 1,000 | RR 1.11 | 713 (9) | ⊕⊝⊝⊝ |
| Technique failure | 131 per 1,000 | 108 per 1,000 | RR 0.82 | 442 (4) | ⊕⊕⊕⊝ |
| Death (all causes) | 124 per 1,000 | 117 per 1,000 | RR 0.95 | 703 (8) | ⊕⊕⊝⊝ |
| *The risk in the intervention group (and its 95% confidence interval) is based on the assumed risk in the comparison group and the relative effect of the intervention (and its 95% CI). | |||||
| GRADE Working Group grades of evidence | |||||
| 1 Downgraded one level: most studies are of suboptimal quality 2 Downgrade one level: inconsistency 3 Downgraded one level: publication bias | |||||
| Tenckhoff catheter with artificial curve at tunnel tract versus swan‐neck for preventing catheter‐related infections in chronic peritoneal dialysis patients | |||||
| Patient or population: preventing catheter‐related infections in chronic peritoneal dialysis patients | |||||
| Outcomes | Anticipated absolute effects* (95% CI) | Relative effect | No. of participants or patient‐months | Certainty of the evidence | |
| Risk with swan‐neck | Risk with Tenckhoff | ||||
| Peritonitis | 329 per 1,000 | 424 per 1,000 | RR 1.29 | 140 (2) | ⊕⊕⊝⊝ |
| Peritonitis rate (patient‐months) | 47 per 1,000 | 57 per 1,000 | RR 1.22 | 2535 (2) | ⊕⊕⊝⊝ |
| Exit‐site/tunnel infection | 671 per 1,000 | 645 per 1,000 | RR 0.96 | 140 (2) | ⊕⊕⊕⊝ |
| Exit‐site/tunnel infection rate (patient‐months) | 83 per 1,000 | 55 per 1,000 | RR 0.67 | 2535 (2) | ⊕⊕⊕⊝ |
| Catheter removal or replacement | 229 per 1,000 | 194 per 1,000 | RR 0.85 | 140 (2) | ⊕⊕⊕⊝ |
| Technique failure | 157 per 1,000 | 101 per 1,000 | RR 0.64 | 140 (2) | ⊕⊕⊕⊝ |
| Death (all causes) | 114 per 1,000 | 85 per 1,000 | RR 0.74 | 140 (2) | ⊕⊕⊝⊝ |
| *The risk in the intervention group (and its 95% confidence interval) is based on the assumed risk in the comparison group and the relative effect of the intervention (and its 95% CI). | |||||
| GRADE Working Group grades of evidence | |||||
| 1 Downgraded two levels: suboptimal quality of studies and imprecision 2 Downgraded two levels: suboptimal quality of studies and inconsistency 3 Downgraded one level: suboptimal quality of studies | |||||
| Self‐locating versus straight Tenckhoff catheter for preventing catheter‐related infections in chronic peritoneal dialysis patients | |||||
| Patient or population: chronic peritoneal dialysis patients | |||||
| Outcomes | Anticipated absolute effects* (95% CI) | Relative effect | No. of participants | Certainty of the evidence | |
| Risk with straight Tenckhoff | Risk with self‐locating | ||||
| Peritonitis | 684 per 1,000 | 773 per 1,000 | RR 1.13 | 78 (1) | ⊕⊝⊝⊝ |
| Exit‐site/tunnel infection | 184 per 1,000 | 175 per 1,000 | RR 0.95 | 78 (1) | ⊕⊝⊝⊝ |
| Catheter removal or replacement | 343 per 1,000 | 110 per 1,000 | RR 0.32 | 139 (2) | ⊕⊝⊝⊝ |
| Technique failure | 414 per 1,000 | 265 per 1,000 | RR 0.64 | 139 (2) | ⊕⊕⊕⊝ |
| Death (all causes) | 71 per 1,000 | 73 per 1,000 | RR 1.02 | 139 (2) | ⊕⊕⊝⊝ |
| *The risk in the intervention group (and its 95% confidence interval) is based on the assumed risk in the comparison group and the relative effect of the intervention (and its 95% CI). | |||||
| GRADE Working Group grades of evidence | |||||
| 1 Downgraded three levels: single study, suboptimal quality, and imprecision 2 Downgraded three levels: suboptimal quality, imprecision and inconsistency 3 Downgraded one level: suboptimal quality of study 4 Downgraded two levels: suboptimal quality and imprecision | |||||
| Study ID | Intervention | Control group | ||
| Events | Total | Events | Total | |
| Haematoma or haemoperitoneum | ||||
| 1 | 31 | 4 | 30 | |
| 7 | 34 | 4 | 32 | |
| 7 | 40 | 6 | 38 | |
| 0 | 36 | 0 | 37 | |
| 0 | 18 | 2 | 17 | |
| 3 | 99 | 2 | 90 | |
| 0 | 20 | 0 | 20 | |
| 0 | 20 | 0 | 20 | |
| 14 | 20 | 22 | 19 | |
| 1 | 48 | 1 | 35 | |
| 0 | 30 | 1 | 59 | |
| 1 | 103 | 0 | 49 | |
| Dialysate leak | ||||
| 2 | 34 | 1 | 32 | |
| 9 | 40 | 7 | 38 | |
| 7 | 40 | 6 | 37 | |
| 1 | 31 | 1 | 30 | |
| 2 | 36 | 3 | 37 | |
| 2 | 10 | 4 | 12 | |
| 0 | 20 | 2 | 20 | |
| 0 | 20 | 4 | 20 | |
| 0 | 20 | 0 | 20 | |
| 1 | 38 | 0 | 34 | |
| 0 | 99 | 3 | 90 | |
| 0 | 14 | 1 | 15 | |
| 6 | 48 | 3 | 35 | |
| 2 | 30 | 0 | 59 | |
| 1 | 29 | 3 | 32 | |
| 4 | 57 | 10 | 56 | |
| 2 | 11 | 0 | 11 | |
| 2 | 21 | 0 | 24 | |
| 1 | 40 | 0 | 40 | |
| 0 | 50 | 0 | 51 | |
| 0 | 103 | 1 | 49 | |
| Viscus perforation | ||||
| Nielsen 1995 (bladder perforation) | 0 | 38 | 1 | 34 |
| Al‐Hwiesh 2016 (bowel perforation) | 0 | 36 | 0 | 37 |
| Merrikhi 2014 (hollow viscus perforation) | 0 | 18 | 0 | 17 |
| 0 | 31 | 0 | 30 | |
| Outflow failure or catheter tip migration | ||||
| 1 | 31 | 4 | 30 | |
| 2 | 20 | 1 | 19 | |
| 12 | 40 | 25 | 38 | |
| 3 | 57 | 4 | 56 | |
| 1 | 36 | 11 | 37 | |
| 1 | 30 | 2 | 59 | |
| 3 | 20 | 1 | 20 | |
| 0 | 14 | 1 | 15 | |
| 1 | 10 | 3 | 12 | |
| 1 | 11 | 1 | 11 | |
| Hernia | ||||
| 0 | 34 | 1 | 32 | |
| 2 | 40 | 1 | 37 | |
| 7 | 40 | 7 | 38 | |
| 4 | 99 | 6 | 90 | |
| 2 | 40 | 2 | 40 | |
| 4 | 57 | 8 | 56 | |
| 0 | 103 | 1 | 49 | |
| Name of studies | Relative risk | 95% CI | P value |
| Peritonitis | |||
| Methods of catheter implantation | |||
| 1.41 | 0.25 to 7.91 | 0.69 | |
| 1.20 | 0.59 to 2.42 | 0.61 | |
| 0.93 | 0.48 to 1.80 | 0.82 | |
| 0.39 | 0.11 to 1.42 | 0.15 | |
| 0.81 | 0.41 to 1.61 | 0.55 | |
| 0.21 | 0.03 to 1.61 | 0.13 | |
| 0.60 | 0.20 to 1.81 | 0.36 | |
| Types of catheter | |||
| 0.82 | 0.50 to 1.35 | 0.44 | |
| 0.34 | 0.07 to 1.59 | 0.17 | |
| 0.80 | 0.29 to 2.21 | 0.67 | |
| 0.78 | 0.6 to 1.69 | 0.53 | |
| Other intervention | |||
| 0.90 | 0.49 to 1.66 | 0.73 | |
| 1.20 | 0.59 to 2.42 | 0.61 | |
| Peritonitis rate (patient‐month) | |||
| Methods of catheter implantation | |||
| 1.40 | 0.23 to 8.34 | 0.71 | |
| 0.67 | 0.38 to 1.18 | 0.16 | |
| Types of catheters | |||
| 0.34 | 0.07 to 1.69 | 0.19 | |
| 0.69 | 0.19 to 2.53 | 0.57 | |
| CI: confidence interval | |||
| Outcome or subgroup title | No. of studies | No. of participants | Statistical method | Effect size |
| 1 Peritonitis Show forest plot | 4 | 315 | Risk Ratio (M‐H, Random, 95% CI) | 0.90 [0.59, 1.35] |
| 2 Peritonitis rate (patient‐months) Show forest plot | 1 | Risk Ratio (M‐H, Random, 95% CI) | Totals not selected | |
| 3 Exit‐site/tunnel infection Show forest plot | 3 | 270 | Risk Ratio (M‐H, Random, 95% CI) | 1.00 [0.43, 2.31] |
| 4 Catheter removal or replacement Show forest plot | 3 | 167 | Risk Ratio (M‐H, Random, 95% CI) | 1.20 [0.77, 1.86] |
| 5 Technique failure Show forest plot | 4 | 283 | Risk Ratio (M‐H, Random, 95% CI) | 0.71 [0.47, 1.08] |
| 6 Death (all causes) Show forest plot | 3 | 270 | Risk Ratio (M‐H, Random, 95% CI) | 1.26 [0.72, 2.20] |
| 7 Dialysate leak Show forest plot | 3 | 167 | Risk Ratio (M‐H, Random, 95% CI) | 0.85 [0.10, 6.97] |
| Outcome or subgroup title | No. of studies | No. of participants | Statistical method | Effect size |
| 1 Peritonitis rate (patient‐months) Show forest plot | 2 | 2511 | Risk Ratio (M‐H, Random, 95% CI) | 1.16 [0.37, 3.60] |
| 2 Exit‐site/tunnel infection rate (patient‐months) Show forest plot | 2 | 2511 | Risk Ratio (M‐H, Random, 95% CI) | 1.15 [0.39, 3.42] |
| 3 Technique failure Show forest plot | 1 | Risk Ratio (M‐H, Random, 95% CI) | Totals not selected | |
| 4 Death (all causes) Show forest plot | 2 | 119 | Risk Ratio (M‐H, Random, 95% CI) | 0.90 [0.39, 2.08] |
| Outcome or subgroup title | No. of studies | No. of participants | Statistical method | Effect size |
| 1 Peritonitis Show forest plot | 2 | 120 | Risk Ratio (M‐H, Random, 95% CI) | 0.65 [0.32, 1.33] |
| 2 Exit‐site/tunnel infection Show forest plot | 2 | 120 | Risk Ratio (M‐H, Random, 95% CI) | 0.56 [0.12, 2.58] |
| 3 Catheter removal or replacement Show forest plot | 1 | Risk Ratio (M‐H, Random, 95% CI) | Totals not selected | |
| 4 Death (all causes) Show forest plot | 1 | Risk Ratio (M‐H, Random, 95% CI) | Totals not selected | |
| Outcome or subgroup title | No. of studies | No. of participants | Statistical method | Effect size |
| 1 Exit‐site/tunnel infection Show forest plot | 2 | 96 | Risk Ratio (M‐H, Random, 95% CI) | 0.16 [0.02, 1.30] |
| 2 Catheter removal or replacement Show forest plot | 1 | Risk Ratio (M‐H, Random, 95% CI) | Totals not selected | |
| 3 Postoperative bleed (haematoma or haemoperitoneum) Show forest plot | 2 | 96 | Risk Ratio (M‐H, Random, 95% CI) | 0.22 [0.04, 1.26] |
| Outcome or subgroup title | No. of studies | No. of participants | Statistical method | Effect size |
| 1 Peritonitis Show forest plot | 9 | 818 | Risk Ratio (M‐H, Random, 95% CI) | 1.04 [0.82, 1.31] |
| 2 Peritonitis rate (patient‐months) Show forest plot | 5 | 5882 | Risk Ratio (M‐H, Random, 95% CI) | 0.91 [0.68, 1.21] |
| 3 Exit‐site/tunnel infection Show forest plot | 10 | 826 | Risk Ratio (M‐H, Random, 95% CI) | 1.12 [0.94, 1.34] |
| 4 Exit‐site/tunnel infection rate (patient‐months) Show forest plot | 4 | 5286 | Risk Ratio (M‐H, Random, 95% CI) | 1.05 [0.77, 1.43] |
| 5 Catheter removal or replacement Show forest plot | 9 | 713 | Risk Ratio (M‐H, Random, 95% CI) | 1.11 [0.73, 1.66] |
| 6 Technique failure Show forest plot | 4 | 442 | Risk Ratio (M‐H, Random, 95% CI) | 0.82 [0.51, 1.31] |
| 7 Death (all causes) Show forest plot | 8 | 703 | Risk Ratio (M‐H, Random, 95% CI) | 0.95 [0.62, 1.46] |
| 8 Peritonitis (studies with low risk of attrition bias) Show forest plot | 4 | 345 | Risk Ratio (M‐H, Random, 95% CI) | 0.93 [0.69, 1.26] |
| 9 Peritonitis rate (patient‐months) (studies with low risk of attrition bias) Show forest plot | 3 | 1771 | Risk Ratio (M‐H, Random, 95% CI) | 0.91 [0.61, 1.35] |
| 10 Exit‐site/tunnel infection (studies with low risk of attrition bias) Show forest plot | 6 | 425 | Risk Ratio (M‐H, Random, 95% CI) | 1.14 [0.94, 1.39] |
| 11 Exit‐site/tunnel infection rate (patient‐months) (studies with low risk of attrition bias) Show forest plot | 2 | 1175 | Risk Ratio (M‐H, Random, 95% CI) | 1.18 [0.76, 1.82] |
| 12 Catheter removal or replacement (studies with low risk of attrition bias) Show forest plot | 5 | 329 | Risk Ratio (M‐H, Random, 95% CI) | 0.78 [0.45, 1.33] |
| 13 Dialysate leak Show forest plot | 7 | 550 | Risk Ratio (M‐H, Random, 95% CI) | 0.74 [0.16, 3.49] |
| 14 Postoperative bleeding (haematoma or haemoperitoneum) Show forest plot | 4 | 358 | Risk Ratio (M‐H, Random, 95% CI) | 1.14 [0.24, 5.34] |
| Outcome or subgroup title | No. of studies | No. of participants | Statistical method | Effect size |
| 1 Peritonitis Show forest plot | 2 | 140 | Risk Ratio (M‐H, Random, 95% CI) | 1.29 [0.85, 1.96] |
| 2 Peritonitis rate (patient‐months) Show forest plot | 2 | 2535 | Risk Ratio (M‐H, Random, 95% CI) | 1.22 [0.54, 2.75] |
| 3 Exit‐site/tunnel infection Show forest plot | 2 | 140 | Risk Ratio (M‐H, Random, 95% CI) | 0.96 [0.77, 1.21] |
| 4 Exit‐site/tunnel infection rate (patient‐months) Show forest plot | 2 | 2535 | Risk Ratio (M‐H, Random, 95% CI) | 0.67 [0.50, 0.90] |
| 5 Catheter removal or replacement Show forest plot | 2 | 140 | Risk Ratio (M‐H, Random, 95% CI) | 0.85 [0.42, 1.72] |
| 6 Technique failure Show forest plot | 2 | 140 | Risk Ratio (M‐H, Random, 95% CI) | 0.64 [0.26, 1.58] |
| 7 Death (all causes) Show forest plot | 2 | 140 | Risk Ratio (M‐H, Random, 95% CI) | 0.74 [0.27, 2.03] |
| Outcome or subgroup title | No. of studies | No. of participants | Statistical method | Effect size |
| 1 Peritonitis Show forest plot | 1 | Risk Ratio (M‐H, Random, 95% CI) | Totals not selected | |
| 2 Exit‐site/tunnel infection Show forest plot | 1 | Risk Ratio (M‐H, Random, 95% CI) | Totals not selected | |
| 3 Catheter removal or replacement Show forest plot | 2 | 139 | Risk Ratio (M‐H, Random, 95% CI) | 0.32 [0.03, 3.06] |
| 4 Technique failure Show forest plot | 2 | 139 | Risk Ratio (M‐H, Random, 95% CI) | 0.64 [0.39, 1.04] |
| 5 Death (all causes) Show forest plot | 2 | 139 | Risk Ratio (M‐H, Random, 95% CI) | 1.02 [0.11, 9.75] |
| 6 Dialysate leak Show forest plot | 2 | 139 | Risk Ratio (M‐H, Random, 95% CI) | 1.04 [0.46, 2.35] |
| Outcome or subgroup title | No. of studies | No. of participants | Statistical method | Effect size |
| 1 Peritonitis Show forest plot | 1 | Risk Ratio (M‐H, Random, 95% CI) | Totals not selected | |
| 2 Peritonitis rate (patient‐months) Show forest plot | 1 | Risk Ratio (M‐H, Random, 95% CI) | Totals not selected | |
| 3 Exit‐site/tunnel infection Show forest plot | 1 | Risk Ratio (M‐H, Random, 95% CI) | Totals not selected | |
| 4 Exit‐site/tunnel infection rate (patient‐month) Show forest plot | 1 | Risk Ratio (M‐H, Random, 95% CI) | Totals not selected | |
| 5 Catheter removal or replacement Show forest plot | 1 | Risk Ratio (M‐H, Random, 95% CI) | Totals not selected | |
| 6 Technique failure Show forest plot | 1 | Risk Ratio (M‐H, Random, 95% CI) | Totals not selected | |
| 7 Death (all causes) Show forest plot | 1 | Risk Ratio (M‐H, Random, 95% CI) | Totals not selected | |
| 8 Dialysate leak Show forest plot | 1 | Risk Ratio (M‐H, Random, 95% CI) | Totals not selected | |
| 9 Postoperative bleed (haematoma or haemoperitoneum) Show forest plot | 1 | Risk Ratio (M‐H, Random, 95% CI) | Totals not selected | |
| Outcome or subgroup title | No. of studies | No. of participants | Statistical method | Effect size |
| 1 Peritonitis Show forest plot | 1 | Risk Ratio (M‐H, Random, 95% CI) | Totals not selected | |
| 2 Exit‐site/tunnel infection Show forest plot | 1 | Risk Ratio (M‐H, Random, 95% CI) | Totals not selected | |
| 3 Catheter removal or replacement Show forest plot | 1 | Risk Ratio (M‐H, Random, 95% CI) | Totals not selected | |
| 4 Dialysate leak Show forest plot | 1 | Risk Ratio (M‐H, Random, 95% CI) | Totals not selected | |
| 5 Postoperative bleed (haematoma or haemoperitoneum) Show forest plot | 1 | Risk Ratio (M‐H, Random, 95% CI) | Totals not selected | |
| Outcome or subgroup title | No. of studies | No. of participants | Statistical method | Effect size |
| 1 Peritonitis Show forest plot | 1 | Risk Ratio (M‐H, Random, 95% CI) | Totals not selected | |
| 2 Exit‐site/tunnel infection Show forest plot | 1 | Risk Ratio (M‐H, Random, 95% CI) | Totals not selected | |
| 3 Death (all causes) Show forest plot | 1 | Risk Ratio (M‐H, Random, 95% CI) | Totals not selected | |
| Outcome or subgroup title | No. of studies | No. of participants | Statistical method | Effect size |
| 1 Peritonitis rate (patient‐month) Show forest plot | 1 | Risk Ratio (M‐H, Random, 95% CI) | Totals not selected | |
| 2 Exit‐site/tunnel infection (patient‐months) Show forest plot | 1 | Risk Ratio (M‐H, Random, 95% CI) | Totals not selected | |
| 3 Catheter removal or replacement Show forest plot | 1 | Risk Ratio (M‐H, Random, 95% CI) | Totals not selected | |
| 4 Death (all causes) Show forest plot | 1 | Risk Ratio (M‐H, Random, 95% CI) | Totals not selected | |
| 5 Dialysate leak Show forest plot | 1 | Risk Ratio (M‐H, Random, 95% CI) | Totals not selected | |
| Outcome or subgroup title | No. of studies | No. of participants | Statistical method | Effect size |
| 1 Peritonitis Show forest plot | 1 | Risk Ratio (M‐H, Random, 95% CI) | Totals not selected | |
| 2 Exit‐site/tunnel infection Show forest plot | 1 | Risk Ratio (M‐H, Random, 95% CI) | Totals not selected | |
| 3 Dialysate leak Show forest plot | 1 | Risk Ratio (M‐H, Random, 95% CI) | Totals not selected | |
| Outcome or subgroup title | No. of studies | No. of participants | Statistical method | Effect size |
| 1 Peritonitis Show forest plot | 1 | Risk Ratio (M‐H, Random, 95% CI) | Totals not selected | |
| 2 Exit‐site infection Show forest plot | 1 | Risk Ratio (M‐H, Random, 95% CI) | Totals not selected | |
| 3 Dialysate leak Show forest plot | 1 | Risk Ratio (M‐H, Random, 95% CI) | Totals not selected | |
| Outcome or subgroup title | No. of studies | No. of participants | Statistical method | Effect size |
| 1 Peritonitis Show forest plot | 1 | Risk Ratio (M‐H, Random, 95% CI) | Totals not selected | |
| 2 Exit‐site/tunnel infection Show forest plot | 1 | Risk Ratio (M‐H, Random, 95% CI) | Totals not selected | |
| 3 Catheter removal or replacement Show forest plot | 1 | Risk Ratio (M‐H, Random, 95% CI) | Totals not selected | |
| 4 Technique failure Show forest plot | 1 | Risk Ratio (M‐H, Random, 95% CI) | Totals not selected | |
| 5 Death (all causes) Show forest plot | 1 | Risk Ratio (M‐H, Random, 95% CI) | Totals not selected | |
| Outcome or subgroup title | No. of studies | No. of participants | Statistical method | Effect size |
| 1 Peritonitis Show forest plot | 1 | Risk Ratio (M‐H, Random, 95% CI) | Totals not selected | |
| 2 Peritonitis rate (patient‐months) Show forest plot | 1 | Risk Ratio (M‐H, Random, 95% CI) | Totals not selected | |
| 3 Exit‐site/tunnel infection Show forest plot | 1 | Risk Ratio (M‐H, Random, 95% CI) | Totals not selected | |
| 4 Exit‐site/tunnel infection (patient‐months) Show forest plot | 1 | Risk Ratio (M‐H, Random, 95% CI) | Totals not selected | |
| 5 Catheter removal or replacement Show forest plot | 1 | Risk Ratio (M‐H, Random, 95% CI) | Totals not selected | |
| 6 Dialysate leak Show forest plot | 1 | Risk Ratio (M‐H, Random, 95% CI) | Totals not selected | |
| Outcome or subgroup title | No. of studies | No. of participants | Statistical method | Effect size |
| 1 Peritonitis Show forest plot | 1 | Risk Ratio (M‐H, Random, 95% CI) | Totals not selected | |
| 2 Peritonitis rate (patient‐months) Show forest plot | 1 | Risk Ratio (M‐H, Random, 95% CI) | Totals not selected | |
| 3 Exit‐site/tunnel infection Show forest plot | 1 | Risk Ratio (M‐H, Random, 95% CI) | Totals not selected | |
| 4 Exit‐site/tunnel infection rate (patient‐months) Show forest plot | 1 | Risk Ratio (M‐H, Random, 95% CI) | Totals not selected | |
| 5 Technique failure Show forest plot | 1 | Risk Ratio (M‐H, Random, 95% CI) | Totals not selected | |
| 6 Dialysate leak Show forest plot | 1 | Risk Ratio (M‐H, Random, 95% CI) | Totals not selected | |
| Outcome or subgroup title | No. of studies | No. of participants | Statistical method | Effect size |
| 1 Peritonitis Show forest plot | 1 | Risk Ratio (M‐H, Random, 95% CI) | Totals not selected | |
| 2 Exit‐site/tunnel infection Show forest plot | 1 | Risk Ratio (M‐H, Random, 95% CI) | Totals not selected | |
| 3 Catheter removal or replacement Show forest plot | 1 | Risk Ratio (M‐H, Random, 95% CI) | Totals not selected | |
| 4 Death (all causes) Show forest plot | 1 | Risk Ratio (M‐H, Random, 95% CI) | Totals not selected | |
| Outcome or subgroup title | No. of studies | No. of participants | Statistical method | Effect size |
| 1 Peritonitis Show forest plot | 1 | Risk Ratio (M‐H, Random, 95% CI) | Totals not selected | |
| 2 Exit‐site/tunnel infection Show forest plot | 1 | Risk Ratio (M‐H, Random, 95% CI) | Totals not selected | |
| 3 Technique failure Show forest plot | 1 | Risk Ratio (M‐H, Random, 95% CI) | Totals not selected | |
| 4 Death (all causes) Show forest plot | 1 | Risk Ratio (M‐H, Random, 95% CI) | Totals not selected | |