Abdominal surgical incisions for caesarean section
Información
- DOI:
- https://doi.org/10.1002/14651858.CD004453.pub3Copiar DOI

- Base de datos:
-
- Cochrane Database of Systematic Reviews
- Versión publicada:
-
- 31 mayo 2013see what's new
- Tipo:
-
- Intervention
- Etapa:
-
- Review
- Grupo Editorial Cochrane:
-
Grupo Cochrane de Embarazo y parto
- Copyright:
-
- Copyright © 2013 The Cochrane Collaboration. Published by John Wiley & Sons, Ltd.
Cifras del artículo
Altmetric:
Citado por:
Autores
Contributions of authors
M Mathai produced the first draft of the protocol and performed the first data extraction and analysis of the final review. GJ Hofmeyr revised the drafts, independently assessed trials for inclusion, and checked the data extraction. M Mathai and NE Mathai worked on the updated review and GJ Hofmeyr revised the updated draft and independently assessed the new data for inclusion.
Declarations of interest
Matthews Mathai is the author of one of the included trials.
Acknowledgements
As part of the pre‐publication editorial process, this review has been commented on by three peers (an editor and two referees who are external to the editorial team), one or more members of the Pregnancy and Childbirth Group's international panel of consumers and the Group's Statistical Adviser.
The National Institute for Health Research (NIHR) is the largest single funder of the Cochrane Pregnancy and Childbirth Group. The views and opinions expressed therein are those of the authors and do not necessarily reflect those of the NIHR, NHS or the Department of Health.
Version history
| Published | Title | Stage | Authors | Version |
| 2013 May 31 | Abdominal surgical incisions for caesarean section | Review | Matthews Mathai, G Justus Hofmeyr, Namratha E Mathai | |
| 2007 Jan 24 | Abdominal surgical incisions for caesarean section | Review | Matthews Mathai, G Justus Hofmeyr | |
| 2003 Oct 20 | Abdominal surgical incisions for caesarean section | Protocol | Matthews Mathai, G Justus Hofmeyr | |
Keywords
MeSH
Medical Subject Headings (MeSH) Keywords
Medical Subject Headings Check Words
Female; Humans; Pregnancy;
PICO
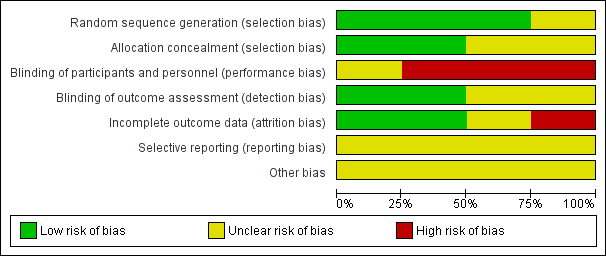
'Risk of bias' graph: review authors' judgements about each risk of bias item presented as percentages across all included studies.

'Risk of bias' summary: review authors' judgements about each risk of bias item for each included study.

Comparison 1 Joel‐Cohen versus Pfannenstiel incision, Outcome 1 Postoperative febrile morbidity.

Comparison 1 Joel‐Cohen versus Pfannenstiel incision, Outcome 2 Postoperative analgesia on demand.

Comparison 1 Joel‐Cohen versus Pfannenstiel incision, Outcome 3 Time between surgery and first dose of analgesic (hours).

Comparison 1 Joel‐Cohen versus Pfannenstiel incision, Outcome 4 Total dose of analgesics in 24 hours.

Comparison 1 Joel‐Cohen versus Pfannenstiel incision, Outcome 8 Estimated blood loss (mL).

Comparison 1 Joel‐Cohen versus Pfannenstiel incision, Outcome 10 Blood transfusion.
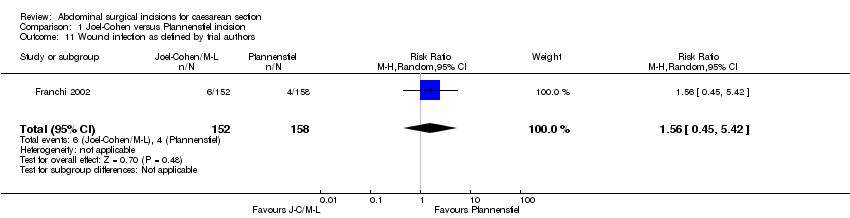
Comparison 1 Joel‐Cohen versus Pfannenstiel incision, Outcome 11 Wound infection as defined by trial authors.

Comparison 1 Joel‐Cohen versus Pfannenstiel incision, Outcome 16 Time (hours) from surgery to start of breastfeeding.
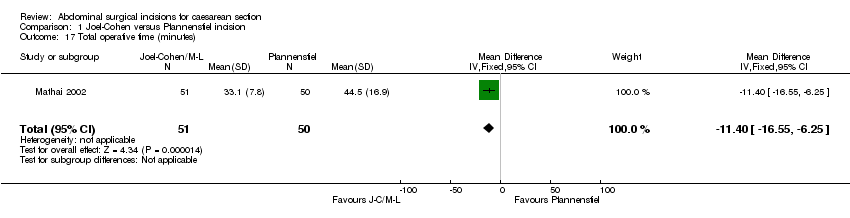
Comparison 1 Joel‐Cohen versus Pfannenstiel incision, Outcome 17 Total operative time (minutes).
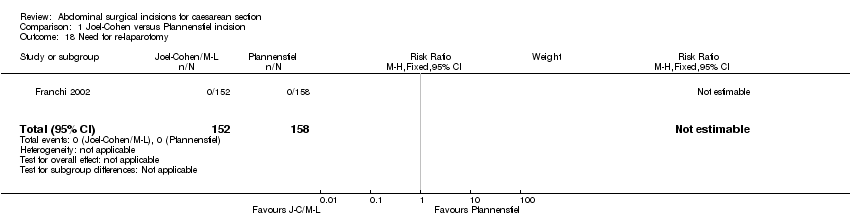
Comparison 1 Joel‐Cohen versus Pfannenstiel incision, Outcome 18 Need for re‐laparotomy.

Comparison 1 Joel‐Cohen versus Pfannenstiel incision, Outcome 21 Delivery time (minutes).

Comparison 1 Joel‐Cohen versus Pfannenstiel incision, Outcome 23 Admissions to special care baby unit ‐ all types.
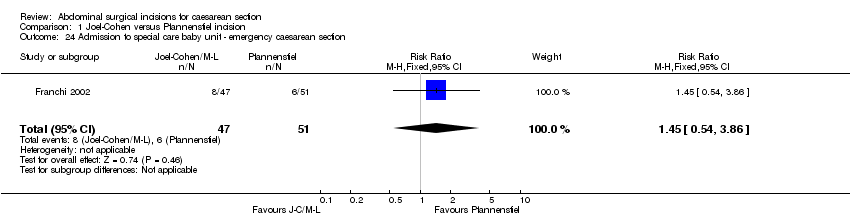
Comparison 1 Joel‐Cohen versus Pfannenstiel incision, Outcome 24 Admission to special care baby unit ‐ emergency caesarean section.

Comparison 1 Joel‐Cohen versus Pfannenstiel incision, Outcome 25 Postoperative hospital stay for mother (days).

Comparison 1 Joel‐Cohen versus Pfannenstiel incision, Outcome 26 Stay in special care nursery (days).

Comparison 2 Muscle‐cutting/Maylard versus Pfannenstiel incision, Outcome 1 Postoperative febrile morbidity.
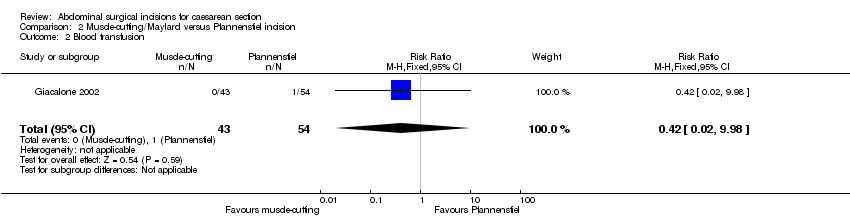
Comparison 2 Muscle‐cutting/Maylard versus Pfannenstiel incision, Outcome 2 Blood transfusion.

Comparison 2 Muscle‐cutting/Maylard versus Pfannenstiel incision, Outcome 3 Wound infection as defined by trial authors.

Comparison 2 Muscle‐cutting/Maylard versus Pfannenstiel incision, Outcome 4 Long‐term complication ‐ physical test at 3 months (Janda's test).
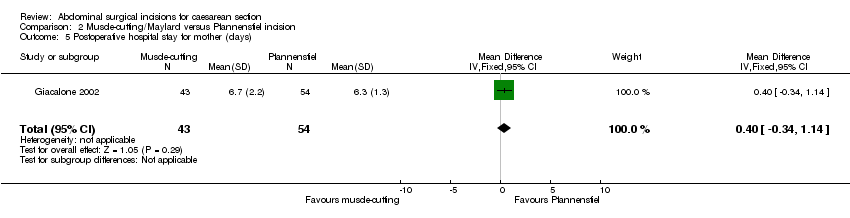
Comparison 2 Muscle‐cutting/Maylard versus Pfannenstiel incision, Outcome 5 Postoperative hospital stay for mother (days).
| Outcome or subgroup title | No. of studies | No. of participants | Statistical method | Effect size |
| 1 Postoperative febrile morbidity Show forest plot | 2 | 411 | Risk Ratio (M‐H, Fixed, 95% CI) | 0.35 [0.14, 0.87] |
| 1.1 Joel‐Cohen versus Pfannenstiel incision | 2 | 411 | Risk Ratio (M‐H, Fixed, 95% CI) | 0.35 [0.14, 0.87] |
| 2 Postoperative analgesia on demand Show forest plot | 1 | 101 | Risk Ratio (M‐H, Fixed, 95% CI) | 0.55 [0.40, 0.76] |
| 3 Time between surgery and first dose of analgesic (hours) Show forest plot | 1 | 101 | Mean Difference (IV, Fixed, 95% CI) | 0.80 [0.12, 1.48] |
| 4 Total dose of analgesics in 24 hours Show forest plot | 1 | 101 | Mean Difference (IV, Fixed, 95% CI) | ‐0.89 [‐1.19, ‐0.59] |
| 5 Number of analgesic injections required | 0 | 0 | Mean Difference (IV, Fixed, 95% CI) | 0.0 [0.0, 0.0] |
| 6 Duration of analgesics (hours) | 0 | 0 | Mean Difference (IV, Fixed, 95% CI) | 0.0 [0.0, 0.0] |
| 7 Number of analgesic doses required | 0 | 0 | Mean Difference (IV, Fixed, 95% CI) | 0.0 [0.0, 0.0] |
| 8 Estimated blood loss (mL) Show forest plot | 1 | 101 | Mean Difference (IV, Fixed, 95% CI) | ‐58.0 [‐108.51, ‐7.49] |
| 9 Change in pre‐ and postoperative haemoglobin levels (g) | 0 | 0 | Mean Difference (IV, Fixed, 95% CI) | 0.0 [0.0, 0.0] |
| 10 Blood transfusion Show forest plot | 1 | 310 | Risk Ratio (M‐H, Fixed, 95% CI) | 0.0 [0.0, 0.0] |
| 11 Wound infection as defined by trial authors Show forest plot | 1 | 310 | Risk Ratio (M‐H, Random, 95% CI) | 1.56 [0.45, 5.42] |
| 12 Wound haematoma | 0 | 0 | Risk Ratio (M‐H, Fixed, 95% CI) | 0.0 [0.0, 0.0] |
| 13 Postoperative pain absent on day 1 | 0 | 0 | Risk Ratio (M‐H, Fixed, 95% CI) | 0.0 [0.0, 0.0] |
| 14 Postoperative pain absent on day 2 | 0 | 0 | Risk Ratio (M‐H, Fixed, 95% CI) | 0.0 [0.0, 0.0] |
| 15 "Significant" postoperative pain by visual analogue score | 0 | 0 | Risk Ratio (M‐H, Fixed, 95% CI) | 0.0 [0.0, 0.0] |
| 16 Time (hours) from surgery to start of breastfeeding Show forest plot | 1 | 101 | Mean Difference (IV, Fixed, 95% CI) | ‐5.5 [‐13.62, 2.62] |
| 17 Total operative time (minutes) Show forest plot | 1 | 101 | Mean Difference (IV, Fixed, 95% CI) | ‐11.40 [‐16.55, ‐6.25] |
| 18 Need for re‐laparotomy Show forest plot | 1 | 310 | Risk Ratio (M‐H, Fixed, 95% CI) | 0.0 [0.0, 0.0] |
| 19 Long‐term "significant" wound pain assessed by visual analogue score | 0 | 0 | Risk Ratio (M‐H, Fixed, 95% CI) | 0.0 [0.0, 0.0] |
| 20 Not satisfied with wound | 0 | 0 | Risk Ratio (M‐H, Fixed, 95% CI) | 0.0 [0.0, 0.0] |
| 21 Delivery time (minutes) Show forest plot | 1 | 101 | Mean Difference (IV, Fixed, 95% CI) | ‐1.90 [‐2.53, ‐1.27] |
| 22 5‐minute Apgar score less than 7 | 0 | 0 | Risk Ratio (M‐H, Fixed, 95% CI) | 0.0 [0.0, 0.0] |
| 23 Admissions to special care baby unit ‐ all types Show forest plot | 1 | 310 | Risk Ratio (M‐H, Fixed, 95% CI) | 1.19 [0.44, 3.20] |
| 24 Admission to special care baby unit ‐ emergency caesarean section Show forest plot | 1 | 98 | Risk Ratio (M‐H, Fixed, 95% CI) | 1.45 [0.54, 3.86] |
| 25 Postoperative hospital stay for mother (days) Show forest plot | 1 | 101 | Mean Difference (IV, Fixed, 95% CI) | ‐1.5 [‐2.16, ‐0.84] |
| 26 Stay in special care nursery (days) Show forest plot | 1 | 101 | Mean Difference (IV, Fixed, 95% CI) | ‐0.46 [‐0.95, 0.03] |
| Outcome or subgroup title | No. of studies | No. of participants | Statistical method | Effect size |
| 1 Postoperative febrile morbidity Show forest plot | 1 | 97 | Risk Ratio (M‐H, Fixed, 95% CI) | 1.26 [0.08, 19.50] |
| 2 Blood transfusion Show forest plot | 1 | 97 | Risk Ratio (M‐H, Fixed, 95% CI) | 0.42 [0.02, 9.98] |
| 3 Wound infection as defined by trial authors Show forest plot | 1 | 97 | Risk Ratio (M‐H, Fixed, 95% CI) | 1.26 [0.27, 5.91] |
| 4 Long‐term complication ‐ physical test at 3 months (Janda's test) Show forest plot | 1 | 54 | Mean Difference (IV, Fixed, 95% CI) | 0.10 [‐0.73, 0.93] |
| 5 Postoperative hospital stay for mother (days) Show forest plot | 1 | 97 | Mean Difference (IV, Fixed, 95% CI) | 0.40 [‐0.34, 1.14] |