| 1 Postoperative febrile morbidity Show forest plot | 2 | 411 | Risk Ratio (M‐H, Fixed, 95% CI) | 0.35 [0.14, 0.87] |
|
| 1.1 Joel‐Cohen versus Pfannenstiel incision | 2 | 411 | Risk Ratio (M‐H, Fixed, 95% CI) | 0.35 [0.14, 0.87] |
| 2 Postoperative analgesia on demand Show forest plot | 1 | 101 | Risk Ratio (M‐H, Fixed, 95% CI) | 0.55 [0.40, 0.76] |
|
| 3 Time between surgery and first dose of analgesic (hours) Show forest plot | 1 | 101 | Mean Difference (IV, Fixed, 95% CI) | 0.80 [0.12, 1.48] |
|
| 4 Total dose of analgesics in 24 hours Show forest plot | 1 | 101 | Mean Difference (IV, Fixed, 95% CI) | ‐0.89 [‐1.19, ‐0.59] |
|
| 5 Number of analgesic injections required | 0 | 0 | Mean Difference (IV, Fixed, 95% CI) | 0.0 [0.0, 0.0] |
| 6 Duration of analgesics (hours) | 0 | 0 | Mean Difference (IV, Fixed, 95% CI) | 0.0 [0.0, 0.0] |
| 7 Number of analgesic doses required | 0 | 0 | Mean Difference (IV, Fixed, 95% CI) | 0.0 [0.0, 0.0] |
| 8 Estimated blood loss (mL) Show forest plot | 1 | 101 | Mean Difference (IV, Fixed, 95% CI) | ‐58.0 [‐108.51, ‐7.49] |
|
| 9 Change in pre‐ and postoperative haemoglobin levels (g) | 0 | 0 | Mean Difference (IV, Fixed, 95% CI) | 0.0 [0.0, 0.0] |
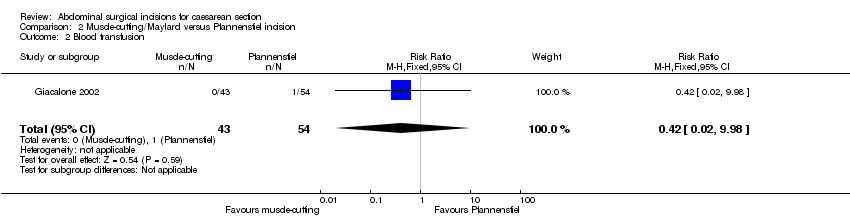
| 10 Blood transfusion Show forest plot | 1 | 310 | Risk Ratio (M‐H, Fixed, 95% CI) | 0.0 [0.0, 0.0] |
|
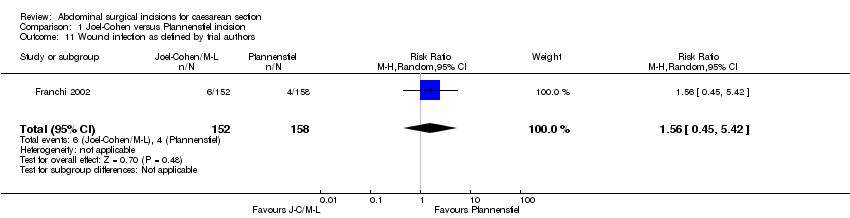
| 11 Wound infection as defined by trial authors Show forest plot | 1 | 310 | Risk Ratio (M‐H, Random, 95% CI) | 1.56 [0.45, 5.42] |
|
| 12 Wound haematoma | 0 | 0 | Risk Ratio (M‐H, Fixed, 95% CI) | 0.0 [0.0, 0.0] |
| 13 Postoperative pain absent on day 1 | 0 | 0 | Risk Ratio (M‐H, Fixed, 95% CI) | 0.0 [0.0, 0.0] |
| 14 Postoperative pain absent on day 2 | 0 | 0 | Risk Ratio (M‐H, Fixed, 95% CI) | 0.0 [0.0, 0.0] |
| 15 "Significant" postoperative pain by visual analogue score | 0 | 0 | Risk Ratio (M‐H, Fixed, 95% CI) | 0.0 [0.0, 0.0] |
| 16 Time (hours) from surgery to start of breastfeeding Show forest plot | 1 | 101 | Mean Difference (IV, Fixed, 95% CI) | ‐5.5 [‐13.62, 2.62] |
|
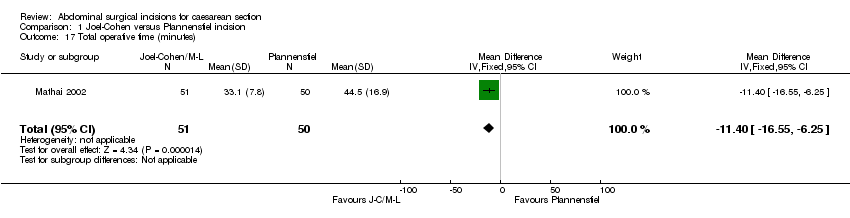
| 17 Total operative time (minutes) Show forest plot | 1 | 101 | Mean Difference (IV, Fixed, 95% CI) | ‐11.40 [‐16.55, ‐6.25] |
|
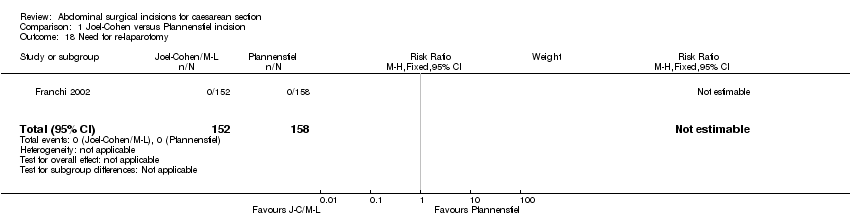
| 18 Need for re‐laparotomy Show forest plot | 1 | 310 | Risk Ratio (M‐H, Fixed, 95% CI) | 0.0 [0.0, 0.0] |
|
| 19 Long‐term "significant" wound pain assessed by visual analogue score | 0 | 0 | Risk Ratio (M‐H, Fixed, 95% CI) | 0.0 [0.0, 0.0] |
| 20 Not satisfied with wound | 0 | 0 | Risk Ratio (M‐H, Fixed, 95% CI) | 0.0 [0.0, 0.0] |
| 21 Delivery time (minutes) Show forest plot | 1 | 101 | Mean Difference (IV, Fixed, 95% CI) | ‐1.90 [‐2.53, ‐1.27] |
|
| 22 5‐minute Apgar score less than 7 | 0 | 0 | Risk Ratio (M‐H, Fixed, 95% CI) | 0.0 [0.0, 0.0] |
| 23 Admissions to special care baby unit ‐ all types Show forest plot | 1 | 310 | Risk Ratio (M‐H, Fixed, 95% CI) | 1.19 [0.44, 3.20] |
|
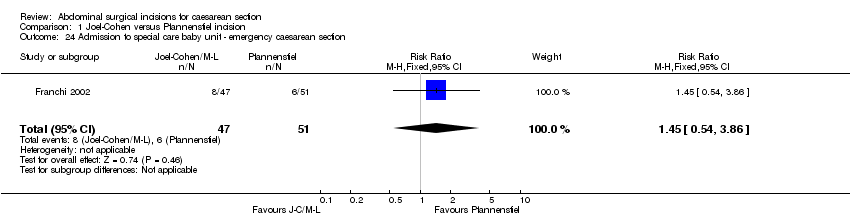
| 24 Admission to special care baby unit ‐ emergency caesarean section Show forest plot | 1 | 98 | Risk Ratio (M‐H, Fixed, 95% CI) | 1.45 [0.54, 3.86] |
|
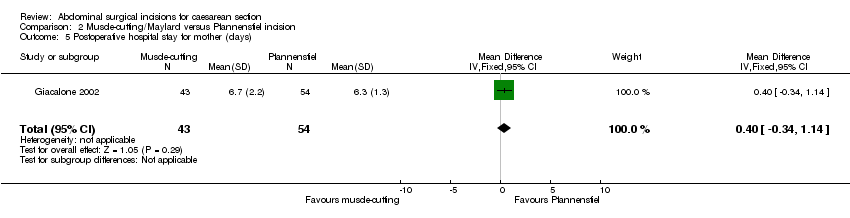
| 25 Postoperative hospital stay for mother (days) Show forest plot | 1 | 101 | Mean Difference (IV, Fixed, 95% CI) | ‐1.5 [‐2.16, ‐0.84] |
|
| 26 Stay in special care nursery (days) Show forest plot | 1 | 101 | Mean Difference (IV, Fixed, 95% CI) | ‐0.46 [‐0.95, 0.03] |
|