Surgical management of pelvic organ prolapse in women
Referencias
References to studies included in this review
References to studies excluded from this review
References to studies awaiting assessment
References to ongoing studies
Additional references
Characteristics of studies
Characteristics of included studies [ordered by study ID]
| Methods | Single centre RCT for uterine or vault prolapse | |
| Participants | 101 randomised | |
| Interventions | A (40): Abdominal group: sacral colpopexy (mesh not specified), paravaginal repair, Halban, posterior vaginal wall repair with colposuspension or sling for stress urinary incontinence, non standardised continence surgery | |
| Outcomes | Optimal: asymptomatic vaginal apex > levator plate: no vaginal tissue beyond the hymen A: 22/38, B: 12/42 | |
| Notes | After interim analysis study ceased early | |
| Risk of bias | ||
| Bias | Authors' judgement | Support for judgement |
| Allocation concealment (selection bias) | Low risk | A ‐ Adequate |
| Methods | Dual centre RCT: needle suspension or plication of urethrovesical junction endopelvic fascia for cystocele and potential stress incontinence | |
| Participants | 32 women | |
| Interventions | A (14): Needle suspension according to Muzsnai with non‐absorbable sutures | |
| Outcomes | Definition of cure: no stress urinary incontinence, no overactive bladder symptoms, no voiding dysfunction | |
| Notes | No blinding | |
| Risk of bias | ||
| Bias | Authors' judgement | Support for judgement |
| Allocation concealment (selection bias) | Low risk | A ‐ Adequate |
| Methods | Single centre RCT (computer generated, unclear if allocation concealed) | |
| Participants | 107 randomised | |
| Interventions | A (52): Cystopexy alone: interrupted non‐absorbable sutures of fascia | |
| Outcomes | Objective cure of cystocele less than grade 2: A: 50/52, B: 48/50 | |
| Notes | No blinding | |
| Risk of bias | ||
| Bias | Authors' judgement | Support for judgement |
| Allocation concealment (selection bias) | Unclear risk | B ‐ Unclear |
| Methods | Single centre RCT (computer generated, allocation concealment unclear) | |
| Participants | 109 randomised | |
| Interventions | A (55): Cystopexy with interrupted non‐absorbable sutures of fascia pubourethral ligament plication with absorbable sutures | |
| Outcomes | Objective cure of cystocele less than grade 2: A 55/55, B 52/54 | |
| Notes | No blinding | |
| Risk of bias | ||
| Bias | Authors' judgement | Support for judgement |
| Allocation concealment (selection bias) | Unclear risk | B ‐ Unclear |
| Methods | Single centre RCT (computer generated open number list ) | |
| Participants | 71 randomised | |
| Interventions | A (35): Burch group: total abdominal hysterectomy and vault to uterosacral ligament, Moschcowitz, Burch with 3‐4 Ethibond | |
| Outcomes | Definition of cure: no subjective stress urinary incontinence, or no positive stress test | |
| Notes | No blinding | |
| Risk of bias | ||
| Bias | Authors' judgement | Support for judgement |
| Allocation concealment (selection bias) | High risk | C ‐ Inadequate |
| Methods | Single centre RCT (number table randomisation, concealment unclear) | |
| Participants | 63 randomised | |
| Interventions | A (24): posterior colporrhaphy with levator plication, enterocele repair, hysterectomy, anterior repair as required | |
| Outcomes | Objective cure of recto/enterocele: A: 21/24, B: 23/33 | |
| Notes | No blinding | |
| Risk of bias | ||
| Bias | Authors' judgement | Support for judgement |
| Allocation concealment (selection bias) | Unclear risk | B ‐ Unclear |
| Methods | Single centre RCT (using random number tables) | |
| Participants | 138 randomised, 20 withdrew due to age or not willing to be followed up | |
| Interventions | A (52): abdominal sacral colpopexy with Mersiline mesh: + 7 posterior repair; + 12 posterior repair and abdominal hysterectomy; + 21 abdominal hysterectomy | |
| Outcomes | Success defined as ICS grade II or less | |
| Notes | Groups stated to be comparable at baseline on age, parity, weight and previous pelvic surgery | |
| Risk of bias | ||
| Bias | Authors' judgement | Support for judgement |
| Allocation concealment (selection bias) | Unclear risk | B ‐ Unclear |
| Methods | RCT (stratified by SUI) | |
| Participants | 95 women | |
| Interventions | A (46): abdominal group = sacral colpopexy prolene mesh, paravaginal repair, Moschcowitz, posterior vaginal repair and colposuspension for SUI Both groups: colposuspension for occult or potential SUI | |
| Outcomes | Subjective cure (no prolapse symptoms): A: 43/46, B: 39/43 | |
| Notes | No blinding | |
| Risk of bias | ||
| Bias | Authors' judgement | Support for judgement |
| Allocation concealment (selection bias) | Low risk | A ‐ Adequate |
| Methods | RCT (computer generated number table, opaque envelopes) comparing intravaginal slingplasty and sacrospinous colpopexy for uterine or vault prolapse | |
| Participants | 47 women | |
| Interventions | A (23): sacrospinous colpopexy | |
| Outcomes | Objective cure of pelvic organ prolapse: | |
| Notes | Abstract only | |
| Risk of bias | ||
| Bias | Authors' judgement | Support for judgement |
| Allocation concealment (selection bias) | Low risk | A ‐ Adequate |
| Methods | RCT (sealed envelopes with numbers assigned from a computer‐generated random number list) | |
| Participants | 50 women | |
| Interventions | A (25): prolapse repair and TVT (with Prolene tape) | |
| Outcomes | Subjective prolapse symptoms, failure rate: A: 4/25, B: 8/25 | |
| Notes | Power calculation provided | |
| Risk of bias | ||
| Bias | Authors' judgement | Support for judgement |
| Allocation concealment (selection bias) | Low risk | A ‐ Adequate |
| Methods | Single centre RCT (nurse took card from envelope with 15 vaginal and 15 transanal cards) | |
| Participants | 30 women | |
| Interventions | A (15): midline rectovaginal fascia plication Vicryl repair | |
| Outcomes | Improvement symptoms A: 14/15: B 11/15 (P=0.08) | |
| Notes | Full text as yet unpublished | |
| Risk of bias | ||
| Bias | Authors' judgement | Support for judgement |
| Allocation concealment (selection bias) | Unclear risk | B ‐ Unclear |
| Methods | RCT (computer‐ generated random number table, allocation concealed) | |
| Participants | 82 women | |
| Interventions | A (41): Abdominal: sacrocolpopexy with preservation uterus | |
| Outcomes | Reoperation performed or planned: A 9/41, B 1/41 | |
| Notes | RCT compared vaginal hysterectomy in vaginal group with uterine preservation in abdominal group | |
| Risk of bias | ||
| Bias | Authors' judgement | Support for judgement |
| Allocation concealment (selection bias) | Low risk | A ‐ Adequate |
| Methods | Single centre RCT (computer generated number table) | |
| Participants | 143 women | |
| Interventions | A (70): No mesh: Vicryl plication of anterior endopelvic fascia | |
| Outcomes | Cure: POP‐Q less than grade 2 | |
| Notes | No subjective success | |
| Risk of bias | ||
| Bias | Authors' judgement | Support for judgement |
| Allocation concealment (selection bias) | Unclear risk | B ‐ Unclear |
| Methods | RCT (computer‐ generated random number tables. Sealed envelopes concealed assignment) comparing 3 surgical techniques | |
| Participants | 83 women | |
| Interventions | A (33): anterior repair: midline plication without tension 0 PDS | |
| Outcomes | Objective Aa & Ba less than or at 1 cm from introitus: A 10/33, B 11/24, C 11/26 | |
| Notes | Number and level of surgeons unknown | |
| Risk of bias | ||
| Bias | Authors' judgement | Support for judgement |
| Allocation concealment (selection bias) | Low risk | A ‐ Adequate |
BMI = Body Mass Index
Hb = Haemoglobin
ICS = International Continence Society
MUCP = Maximum urethral catheter pressure
OAB = Overactive bladder
PDS = Absorbable Polydioxanone Surgical Suture (PDS)
POP = Pelvic organ prolapse
POP‐Q = Pelvic organ prolapse quantification (according to ICS)
QoL = Quality of Life
RCT = Randomised controlled trial
SUI = Stress Urinary Incontinence (symptom diagnosis)
TVT = Tension‐free vaginal tape
UDI = Urogenital Distress Inventory
UTI = Urinary tract infection
Characteristics of excluded studies [ordered by study ID]
| Study | Reason for exclusion |
| RCT on anterior colporrhaphy, Pereyra or Burch colposuspension, no data on pelvic organ prolapse given | |
| RCT on mesh versus vaginal wall sling for stress incontinence. Not all women had pelvic organ prolapse before the operation | |
| RCT on Burch colposuspension and paravaginal defect repair for stress incontinence, no report on treatment of associated anterior vaginal wall prolapse | |
| RCT on three operations for prevention of enterocele. Study does not include treatment of prolapse | |
| Comparison of two different procedures for stress incontinence and prolapse but no results on pelvic organ prolapse are reported postoperatively | |
| Comparison of two different procedures for stress incontinence and prolapse but no results on pelvic organ prolapse are reported postoperatively | |
| Poster presentation at ICS 2002. Preliminary data, subgroup of an ongoing RCT on additional transvaginal sling for prevention of recurrent anterior vaginal wall prolapse |
RCT = Randomised Controlled Trial
ICS = International Continence Society
Characteristics of ongoing studies [ordered by study ID]
| Trial name or title | CARE trial |
| Methods | |
| Participants | Women with prolapse and occult (potential) urinary incontinence |
| Interventions | Abdominal sacrocolpopexy with or without prophylactic Burch colposuspension |
| Outcomes | Stress urinary incontinence, need for further operations |
| Starting date | April 2002, recruiting for 3 years |
| Contact information | |
| Notes |
| Trial name or title | TVT and Colposuspension |
| Methods | |
| Participants | Women with urodynamic stress incontinence and anterior vaginal wall prolapse of at least Stage 2 on POPQ |
| Interventions | TVT or |
| Outcomes | 3 day urinary diary, 24 hour pad test, King's Health questionnaire, POPQ assessment |
| Starting date | 2004 |
| Contact information | |
| Notes |
CARE =
TVT = tension‐free vaginal tape
Data and analyses
| Outcome or subgroup title | No. of studies | No. of participants | Statistical method | Effect size |
| 1 Number of women with prolapse symptoms (subjective failure) Show forest plot | 3 | Risk Ratio (M‐H, Fixed, 95% CI) | Subtotals only | |
| Analysis 1.1  Comparison 1 Surgery for upper vaginal (vault/uterine) prolapse, Outcome 1 Number of women with prolapse symptoms (subjective failure). | ||||
| 1.1 abdominal sacral colpopexy vs vaginal sacrospinous colpopexy | 2 | 169 | Risk Ratio (M‐H, Fixed, 95% CI) | 0.53 [0.25, 1.09] |
| 1.2 abdominal sacrohysteropexy with Gore‐Tex vs vaginal hysterectomy, vaginal repair, uterosacral ligament plicati | 1 | 82 | Risk Ratio (M‐H, Fixed, 95% CI) | 3.2 [1.29, 7.92] |
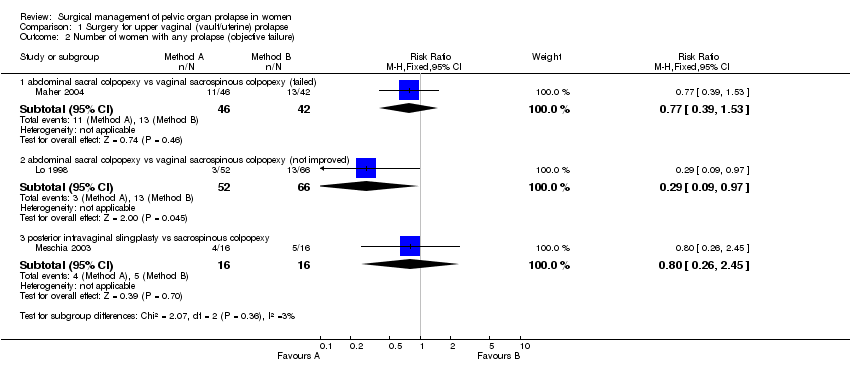
| 2 Number of women with any prolapse (objective failure) Show forest plot | 3 | Risk Ratio (M‐H, Fixed, 95% CI) | Subtotals only | |
| Analysis 1.2  Comparison 1 Surgery for upper vaginal (vault/uterine) prolapse, Outcome 2 Number of women with any prolapse (objective failure). | ||||
| 2.1 abdominal sacral colpopexy vs vaginal sacrospinous colpopexy (failed) | 1 | 88 | Risk Ratio (M‐H, Fixed, 95% CI) | 0.77 [0.39, 1.53] |
| 2.2 abdominal sacral colpopexy vs vaginal sacrospinous colpopexy (not improved) | 1 | 118 | Risk Ratio (M‐H, Fixed, 95% CI) | 0.29 [0.09, 0.97] |
| 2.3 posterior intravaginal slingplasty vs sacrospinous colpopexy | 1 | 32 | Risk Ratio (M‐H, Fixed, 95% CI) | 0.8 [0.26, 2.45] |
| 3 Number of women with recurrent vault prolapse (objective) Show forest plot | 2 | Risk Ratio (M‐H, Fixed, 95% CI) | Subtotals only | |
| Analysis 1.3  Comparison 1 Surgery for upper vaginal (vault/uterine) prolapse, Outcome 3 Number of women with recurrent vault prolapse (objective). | ||||
| 3.1 abdominal sacral colpopexy vs vaginal sacrospinous colpopexy | 2 | 169 | Risk Ratio (M‐H, Fixed, 95% CI) | 0.23 [0.07, 0.77] |
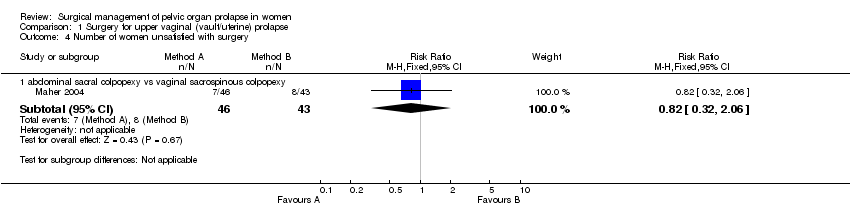
| 4 Number of women unsatisfied with surgery Show forest plot | 1 | Risk Ratio (M‐H, Fixed, 95% CI) | Subtotals only | |
| Analysis 1.4  Comparison 1 Surgery for upper vaginal (vault/uterine) prolapse, Outcome 4 Number of women unsatisfied with surgery. | ||||
| 4.1 abdominal sacral colpopexy vs vaginal sacrospinous colpopexy | 1 | 89 | Risk Ratio (M‐H, Fixed, 95% CI) | 0.82 [0.32, 2.06] |
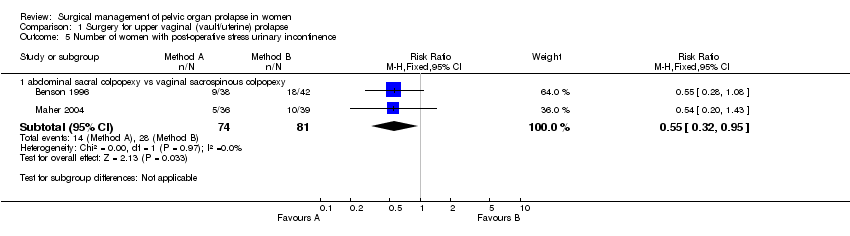
| 5 Number of women with post‐operative stress urinary incontinence Show forest plot | 2 | Risk Ratio (M‐H, Fixed, 95% CI) | Subtotals only | |
| Analysis 1.5  Comparison 1 Surgery for upper vaginal (vault/uterine) prolapse, Outcome 5 Number of women with post‐operative stress urinary incontinence. | ||||
| 5.1 abdominal sacral colpopexy vs vaginal sacrospinous colpopexy | 2 | 155 | Risk Ratio (M‐H, Fixed, 95% CI) | 0.55 [0.32, 0.95] |
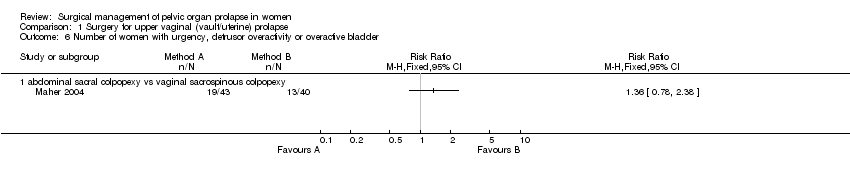
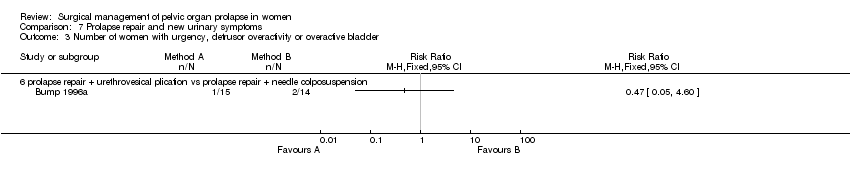
| 6 Number of women with urgency, detrusor overactivity or overactive bladder Show forest plot | 1 | Risk Ratio (M‐H, Fixed, 95% CI) | Totals not selected | |
| Analysis 1.6  Comparison 1 Surgery for upper vaginal (vault/uterine) prolapse, Outcome 6 Number of women with urgency, detrusor overactivity or overactive bladder. | ||||
| 6.1 abdominal sacral colpopexy vs vaginal sacrospinous colpopexy | 1 | Risk Ratio (M‐H, Fixed, 95% CI) | 0.0 [0.0, 0.0] | |
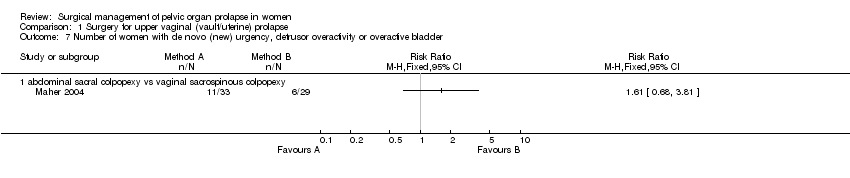
| 7 Number of women with de novo (new) urgency, detrusor overactivity or overactive bladder Show forest plot | 1 | Risk Ratio (M‐H, Fixed, 95% CI) | Totals not selected | |
| Analysis 1.7  Comparison 1 Surgery for upper vaginal (vault/uterine) prolapse, Outcome 7 Number of women with de novo (new) urgency, detrusor overactivity or overactive bladder. | ||||
| 7.1 abdominal sacral colpopexy vs vaginal sacrospinous colpopexy | 1 | Risk Ratio (M‐H, Fixed, 95% CI) | 0.0 [0.0, 0.0] | |
| 8 Number of women with persistent voiding dysfunction Show forest plot | 1 | Risk Ratio (M‐H, Fixed, 95% CI) | Totals not selected | |
| Analysis 1.8  Comparison 1 Surgery for upper vaginal (vault/uterine) prolapse, Outcome 8 Number of women with persistent voiding dysfunction. | ||||
| 8.1 abdominal sacral colpopexy vs vaginal sacrospinous colpopexy | 1 | Risk Ratio (M‐H, Fixed, 95% CI) | 0.0 [0.0, 0.0] | |
| 9 Number of women with new voiding dysfunction Show forest plot | 1 | Risk Ratio (M‐H, Fixed, 95% CI) | Totals not selected | |
| Analysis 1.9  Comparison 1 Surgery for upper vaginal (vault/uterine) prolapse, Outcome 9 Number of women with new voiding dysfunction. | ||||
| 9.1 abdominal sacral colpopexy vs vaginal sacrospinous colpopexy | 1 | Risk Ratio (M‐H, Fixed, 95% CI) | 0.0 [0.0, 0.0] | |
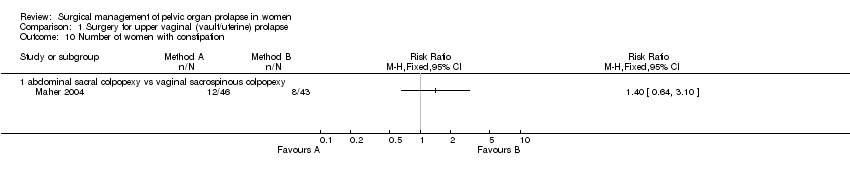
| 10 Number of women with constipation Show forest plot | 1 | Risk Ratio (M‐H, Fixed, 95% CI) | Totals not selected | |
| Analysis 1.10  Comparison 1 Surgery for upper vaginal (vault/uterine) prolapse, Outcome 10 Number of women with constipation. | ||||
| 10.1 abdominal sacral colpopexy vs vaginal sacrospinous colpopexy | 1 | Risk Ratio (M‐H, Fixed, 95% CI) | 0.0 [0.0, 0.0] | |
| 11 Number of women with faecal incontinence Show forest plot | 2 | Risk Ratio (M‐H, Fixed, 95% CI) | Totals not selected | |
| Analysis 1.11  Comparison 1 Surgery for upper vaginal (vault/uterine) prolapse, Outcome 11 Number of women with faecal incontinence. | ||||
| 11.1 abdominal sacral colpopexy vs vaginal sacrospinous colpopexy | 1 | Risk Ratio (M‐H, Fixed, 95% CI) | 0.0 [0.0, 0.0] | |
| 11.2 posterior intravaginal slingplasty vs sacrospinous colpopexy | 1 | Risk Ratio (M‐H, Fixed, 95% CI) | 0.0 [0.0, 0.0] | |
| 12 Number of women with obstructed defecation Show forest plot | 1 | Risk Ratio (M‐H, Fixed, 95% CI) | Totals not selected | |
| Analysis 1.12  Comparison 1 Surgery for upper vaginal (vault/uterine) prolapse, Outcome 12 Number of women with obstructed defecation. | ||||
| 12.1 abdominal sacral colpopexy vs vaginal sacrospinous colpopexy | 1 | Risk Ratio (M‐H, Fixed, 95% CI) | 0.0 [0.0, 0.0] | |
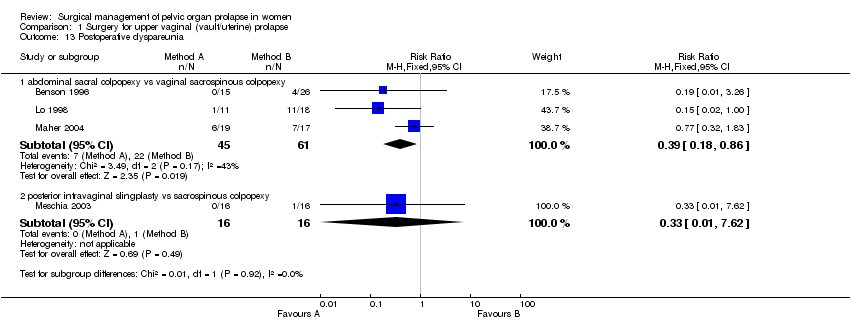
| 13 Postoperative dyspareunia Show forest plot | 4 | Risk Ratio (M‐H, Fixed, 95% CI) | Subtotals only | |
| Analysis 1.13  Comparison 1 Surgery for upper vaginal (vault/uterine) prolapse, Outcome 13 Postoperative dyspareunia. | ||||
| 13.1 abdominal sacral colpopexy vs vaginal sacrospinous colpopexy | 3 | 106 | Risk Ratio (M‐H, Fixed, 95% CI) | 0.39 [0.18, 0.86] |
| 13.2 posterior intravaginal slingplasty vs sacrospinous colpopexy | 1 | 32 | Risk Ratio (M‐H, Fixed, 95% CI) | 0.33 [0.01, 7.62] |
| 14 Women with de novo (new) postoperative dyspareunia Show forest plot | 1 | Risk Ratio (M‐H, Fixed, 95% CI) | Totals not selected | |
| Analysis 1.14  Comparison 1 Surgery for upper vaginal (vault/uterine) prolapse, Outcome 14 Women with de novo (new) postoperative dyspareunia. | ||||
| 14.1 abdominal sacral colpopexy vs vaginal sacrospinous colpopexy | 1 | Risk Ratio (M‐H, Fixed, 95% CI) | 0.0 [0.0, 0.0] | |
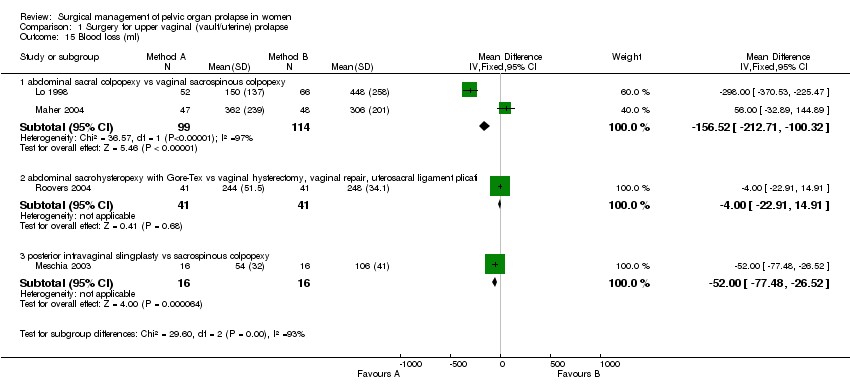
| 15 Blood loss (ml) Show forest plot | 4 | Mean Difference (IV, Fixed, 95% CI) | Subtotals only | |
| Analysis 1.15  Comparison 1 Surgery for upper vaginal (vault/uterine) prolapse, Outcome 15 Blood loss (ml). | ||||
| 15.1 abdominal sacral colpopexy vs vaginal sacrospinous colpopexy | 2 | 213 | Mean Difference (IV, Fixed, 95% CI) | ‐156.52 [‐212.71, ‐100.32] |
| 15.2 abdominal sacrohysteropexy with Gore‐Tex vs vaginal hysterectomy, vaginal repair, uterosacral ligament plicati | 1 | 82 | Mean Difference (IV, Fixed, 95% CI) | ‐4.0 [‐22.91, 14.91] |
| 15.3 posterior intravaginal slingplasty vs sacrospinous colpopexy | 1 | 32 | Mean Difference (IV, Fixed, 95% CI) | ‐50.00 [‐77.48, ‐26.52] |
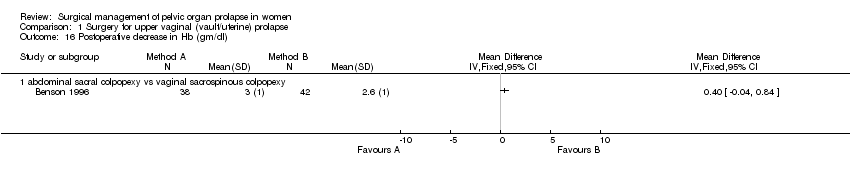
| 16 Postoperative decrease in Hb (gm/dl) Show forest plot | 1 | Mean Difference (IV, Fixed, 95% CI) | Totals not selected | |
| Analysis 1.16  Comparison 1 Surgery for upper vaginal (vault/uterine) prolapse, Outcome 16 Postoperative decrease in Hb (gm/dl). | ||||
| 16.1 abdominal sacral colpopexy vs vaginal sacrospinous colpopexy | 1 | Mean Difference (IV, Fixed, 95% CI) | 0.0 [0.0, 0.0] | |
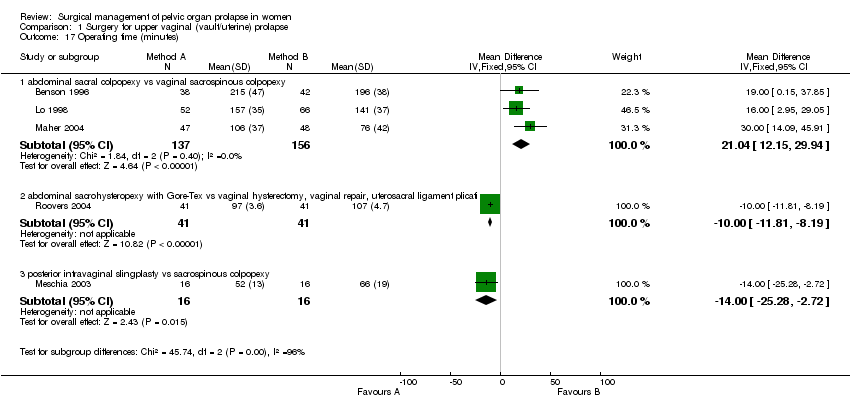
| 17 Operating time (minutes) Show forest plot | 5 | Mean Difference (IV, Fixed, 95% CI) | Subtotals only | |
| Analysis 1.17  Comparison 1 Surgery for upper vaginal (vault/uterine) prolapse, Outcome 17 Operating time (minutes). | ||||
| 17.1 abdominal sacral colpopexy vs vaginal sacrospinous colpopexy | 3 | 293 | Mean Difference (IV, Fixed, 95% CI) | 21.04 [12.15, 29.94] |
| 17.2 abdominal sacrohysteropexy with Gore‐Tex vs vaginal hysterectomy, vaginal repair, uterosacral ligament plicati | 1 | 82 | Mean Difference (IV, Fixed, 95% CI) | ‐10.0 [‐11.81, ‐8.19] |
| 17.3 posterior intravaginal slingplasty vs sacrospinous colpopexy | 1 | 32 | Mean Difference (IV, Fixed, 95% CI) | ‐14.0 [‐25.28, ‐2.72] |
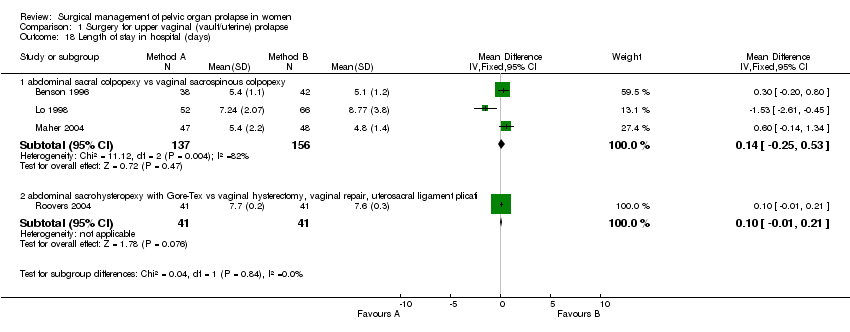
| 18 Length of stay in hospital (days) Show forest plot | 4 | Mean Difference (IV, Fixed, 95% CI) | Subtotals only | |
| Analysis 1.18  Comparison 1 Surgery for upper vaginal (vault/uterine) prolapse, Outcome 18 Length of stay in hospital (days). | ||||
| 18.1 abdominal sacral colpopexy vs vaginal sacrospinous colpopexy | 3 | 293 | Mean Difference (IV, Fixed, 95% CI) | 0.14 [‐0.25, 0.53] |
| 18.2 abdominal sacrohysteropexy with Gore‐Tex vs vaginal hysterectomy, vaginal repair, uterosacral ligament plicati | 1 | 82 | Mean Difference (IV, Fixed, 95% CI) | 0.10 [‐0.01, 0.21] |
| 19 Time to return to normal activity (days) Show forest plot | 1 | Mean Difference (IV, Fixed, 95% CI) | Totals not selected | |
| Analysis 1.19  Comparison 1 Surgery for upper vaginal (vault/uterine) prolapse, Outcome 19 Time to return to normal activity (days). | ||||
| 19.1 abdominal sacral colpopexy vs vaginal sacrospinous colpopexy | 1 | Mean Difference (IV, Fixed, 95% CI) | 0.0 [0.0, 0.0] | |
| 20 Cost (US dollars) Show forest plot | 2 | Mean Difference (IV, Fixed, 95% CI) | Subtotals only | |
| Analysis 1.20  Comparison 1 Surgery for upper vaginal (vault/uterine) prolapse, Outcome 20 Cost (US dollars). | ||||
| 20.1 abdominal sacral colpopexy vs vaginal sacrospinous colpopexy | 2 | 169 | Mean Difference (IV, Fixed, 95% CI) | 1333.95 [1027.24, 1640.65] |
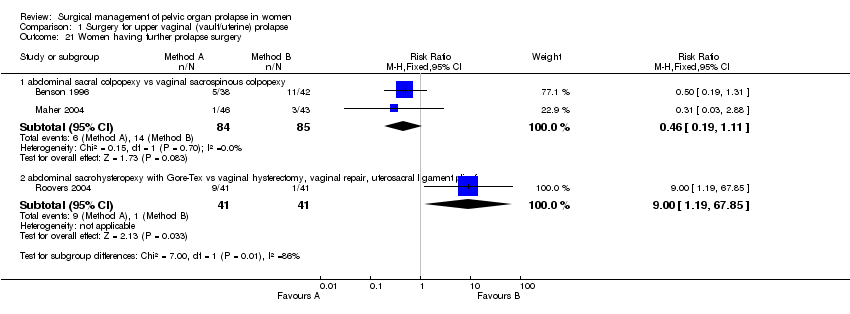
| 21 Women having further prolapse surgery Show forest plot | 3 | Risk Ratio (M‐H, Fixed, 95% CI) | Subtotals only | |
| Analysis 1.21  Comparison 1 Surgery for upper vaginal (vault/uterine) prolapse, Outcome 21 Women having further prolapse surgery. | ||||
| 21.1 abdominal sacral colpopexy vs vaginal sacrospinous colpopexy | 2 | 169 | Risk Ratio (M‐H, Fixed, 95% CI) | 0.46 [0.19, 1.11] |
| 21.2 abdominal sacrohysteropexy with Gore‐Tex vs vaginal hysterectomy, vaginal repair, uterosacral ligament plicati | 1 | 82 | Risk Ratio (M‐H, Fixed, 95% CI) | 9.0 [1.19, 67.85] |
| 22 Women having further continence surgery Show forest plot | 3 | Risk Ratio (M‐H, Fixed, 95% CI) | Subtotals only | |
| Analysis 1.22  Comparison 1 Surgery for upper vaginal (vault/uterine) prolapse, Outcome 22 Women having further continence surgery. | ||||
| 22.1 abdominal sacral colpopexy vs vaginal sacrospinous colpopexy | 3 | 287 | Risk Ratio (M‐H, Fixed, 95% CI) | 0.60 [0.21, 1.73] |
| 23 Women having further prolapse or continence surgery Show forest plot | 2 | Risk Ratio (M‐H, Fixed, 95% CI) | Subtotals only | |
| Analysis 1.23  Comparison 1 Surgery for upper vaginal (vault/uterine) prolapse, Outcome 23 Women having further prolapse or continence surgery. | ||||
| 23.1 abdominal sacral colpopexy vs vaginal sacrospinous colpopexy | 2 | 169 | Risk Ratio (M‐H, Fixed, 95% CI) | 0.47 [0.23, 0.97] |
| 24 Time to recurrence of prolapse (months) Show forest plot | 1 | Mean Difference (IV, Fixed, 95% CI) | Totals not selected | |
| Analysis 1.24  Comparison 1 Surgery for upper vaginal (vault/uterine) prolapse, Outcome 24 Time to recurrence of prolapse (months). | ||||
| 24.1 abdominal sacral colpopexy vs vaginal sacrospinous colpopexy | 1 | Mean Difference (IV, Fixed, 95% CI) | 0.0 [0.0, 0.0] | |
| 25 Adverse events Show forest plot | 5 | Risk Ratio (M‐H, Fixed, 95% CI) | Subtotals only | |
| Analysis 1.25  Comparison 1 Surgery for upper vaginal (vault/uterine) prolapse, Outcome 25 Adverse events. | ||||
| 25.1 abdominal sacral colpopexy vs vaginal sacrospinous colpopexy | 3 | 287 | Risk Ratio (M‐H, Fixed, 95% CI) | 1.30 [0.63, 2.69] |
| 25.2 abdominal sacrohysteropexy with Gore‐Tex vs vaginal hysterectomy, vaginal repair, uterosacral ligament plicati | 1 | 82 | Risk Ratio (M‐H, Fixed, 95% CI) | 1.2 [0.40, 3.62] |
| 25.3 posterior intravaginal slingplasty vs sacrospinous colpopexy | 1 | 47 | Risk Ratio (M‐H, Fixed, 95% CI) | 1.28 [0.32, 5.10] |
| 26 Number of women with recurrent rectocele (objective) Show forest plot | 1 | Risk Ratio (M‐H, Fixed, 95% CI) | Subtotals only | |
| Analysis 1.26  Comparison 1 Surgery for upper vaginal (vault/uterine) prolapse, Outcome 26 Number of women with recurrent rectocele (objective). | ||||
| 26.1 abdominal sacral colpopexy vs vaginal sacrospinous colpopexy | 1 | 89 | Risk Ratio (M‐H, Fixed, 95% CI) | 2.49 [0.71, 8.79] |
| 27 Number of women with recurrent cystocele (objective) Show forest plot | 1 | Risk Ratio (M‐H, Fixed, 95% CI) | Subtotals only | |
| Analysis 1.27  Comparison 1 Surgery for upper vaginal (vault/uterine) prolapse, Outcome 27 Number of women with recurrent cystocele (objective). | ||||
| 27.1 abdominal sacral colpopexy vs vaginal sacrospinous colpopexy | 1 | 89 | Risk Ratio (M‐H, Fixed, 95% CI) | 0.47 [0.12, 1.75] |
| Outcome or subgroup title | No. of studies | No. of participants | Statistical method | Effect size |
| 1 Number of women with prolapse symptoms (subjective failure) Show forest plot | 3 | Risk Ratio (M‐H, Fixed, 95% CI) | Totals not selected | |
| Analysis 2.1  Comparison 2 One method of anterior prolapse repair versus another surgical method, Outcome 1 Number of women with prolapse symptoms (subjective failure). | ||||
| 1.3 traditional anterior colporraphy vs abdominal Burch colposuspension | 1 | Risk Ratio (M‐H, Fixed, 95% CI) | 0.0 [0.0, 0.0] | |
| 1.4 prolapse repair + urethrovesical plication vs prolapse repair + needle colposuspension | 1 | Risk Ratio (M‐H, Fixed, 95% CI) | 0.0 [0.0, 0.0] | |
| 1.8 prolapse repair + urethrovesical endopelvic fascia repair vs prolapse repair + TVT | 1 | Risk Ratio (M‐H, Fixed, 95% CI) | 0.0 [0.0, 0.0] | |
| 2 Number of women with prolapse (objective failure) Show forest plot | 4 | Risk Ratio (M‐H, Fixed, 95% CI) | Subtotals only | |
| Analysis 2.2  Comparison 2 One method of anterior prolapse repair versus another surgical method, Outcome 2 Number of women with prolapse (objective failure). | ||||
| 2.3 traditional anterior colporraphy vs abdominal Burch colposuspension | 1 | 68 | Risk Ratio (M‐H, Fixed, 95% CI) | 0.06 [0.01, 0.39] |
| 2.4 prolapse repair + urethrovesical plication vs prolapse repair + needle colposuspension | 2 | 138 | Risk Ratio (M‐H, Fixed, 95% CI) | 0.66 [0.34, 1.27] |
| 2.8 prolapse repair + urethrovesical endopelvic fascia repair vs prolapse repair + TVT | 1 | 50 | Risk Ratio (M‐H, Fixed, 95% CI) | 0.88 [0.37, 2.05] |
| 3 Number of women with anterior prolapse / cystocele (objective failure) Show forest plot | 7 | Risk Ratio (M‐H, Fixed, 95% CI) | Subtotals only | |
| Analysis 2.3  Comparison 2 One method of anterior prolapse repair versus another surgical method, Outcome 3 Number of women with anterior prolapse / cystocele (objective failure). | ||||
| 3.1 traditonal anterior colporrhaphy vs abdominal paravaginal repair | 0 | 0 | Risk Ratio (M‐H, Fixed, 95% CI) | 0.0 [0.0, 0.0] |
| 3.2 traditional anterior colporraphy vs ultralateral anterior colporraphy | 1 | 57 | Risk Ratio (M‐H, Fixed, 95% CI) | 1.29 [0.84, 1.98] |
| 3.3 traditional anterior colporraphy vs anterior colporraphy + mesh reinforcement | 2 | 202 | Risk Ratio (M‐H, Fixed, 95% CI) | 1.48 [1.07, 2.04] |
| 3.4 ultralateral anterior colporraphy vs anterior colporraphy + mesh reinforcement | 1 | 50 | Risk Ratio (M‐H, Fixed, 95% CI) | 0.94 [0.57, 1.54] |
| 3.5 traditional anterior colporraphy vs abdominal Burch colposuspension | 1 | 68 | Risk Ratio (M‐H, Fixed, 95% CI) | 0.09 [0.01, 0.64] |
| 3.6 prolapse repair + urethrovesical plication vs prolapse repair + needle colposuspension | 2 | 138 | Risk Ratio (M‐H, Fixed, 95% CI) | 0.55 [0.23, 1.29] |
| 3.7 cystopexy vs cystopexy + pubourethral ligament plication | 1 | 102 | Risk Ratio (M‐H, Fixed, 95% CI) | 0.96 [0.14, 6.57] |
| 3.8 prolapse repair + urethrovesical endopelvic fascia repair vs prolapse repair + TVT | 1 | 50 | Risk Ratio (M‐H, Fixed, 95% CI) | 1.17 [0.46, 2.98] |
| 4 Number of women with posterior prolapse / rectocele (objective failure) Show forest plot | 2 | Risk Ratio (M‐H, Fixed, 95% CI) | Totals not selected | |
| Analysis 2.4  Comparison 2 One method of anterior prolapse repair versus another surgical method, Outcome 4 Number of women with posterior prolapse / rectocele (objective failure). | ||||
| 4.1 traditional anterior colporraphy vs anterior colporraphy + mesh reinforcement | 1 | Risk Ratio (M‐H, Fixed, 95% CI) | 0.0 [0.0, 0.0] | |
| 4.8 prolapse repair + urethrovesical endopelvic fascia repair vs prolapse repair + TVT | 1 | Risk Ratio (M‐H, Fixed, 95% CI) | 0.0 [0.0, 0.0] | |
| 6 Number of women with pre‐operative stress incontinence not cured Show forest plot | 2 | Risk Ratio (M‐H, Fixed, 95% CI) | Totals not selected | |
| Analysis 2.6  Comparison 2 One method of anterior prolapse repair versus another surgical method, Outcome 6 Number of women with pre‐operative stress incontinence not cured. | ||||
| 6.3 traditional anterior colporraphy vs abdominal Burch colposuspension | 1 | Risk Ratio (M‐H, Fixed, 95% CI) | 0.0 [0.0, 0.0] | |
| 6.4 prolapse repair + urethrovesical plication vs prolapse repair + needle colposuspension | 1 | Risk Ratio (M‐H, Fixed, 95% CI) | 0.0 [0.0, 0.0] | |
| 7 Number of women with de novo (new) stress urinary incontinence Show forest plot | 4 | Risk Ratio (M‐H, Fixed, 95% CI) | Subtotals only | |
| Analysis 2.7  Comparison 2 One method of anterior prolapse repair versus another surgical method, Outcome 7 Number of women with de novo (new) stress urinary incontinence. | ||||
| 7.3 cystopexy vs cystopexy + pubourethral ligament plication | 1 | 102 | Risk Ratio (M‐H, Fixed, 95% CI) | 0.96 [0.25, 3.64] |
| 7.5 prolapse repair + urethrovesical plication vs prolapse repair + needle colposuspension | 2 | 102 | Risk Ratio (M‐H, Fixed, 95% CI) | 2.62 [0.63, 10.91] |
| 7.8 prolapse repair + urethrovesical endopelvic fascia repair vs prolapse repair + TVT | 1 | 50 | Risk Ratio (M‐H, Fixed, 95% CI) | 9.0 [1.23, 65.85] |
| 8 Number of women with urgency, detrusor overactivity or overactive bladder Show forest plot | 5 | Risk Ratio (M‐H, Fixed, 95% CI) | Subtotals only | |
| Analysis 2.8  Comparison 2 One method of anterior prolapse repair versus another surgical method, Outcome 8 Number of women with urgency, detrusor overactivity or overactive bladder. | ||||
| 8.3 traditional anterior colporraphy vs abdominal Burch colposuspension | 1 | 68 | Risk Ratio (M‐H, Fixed, 95% CI) | 1.06 [0.07, 16.27] |
| 8.4 prolapse repair + urethrovesical plication vs prolapse repair + needle colposuspension | 2 | 138 | Risk Ratio (M‐H, Fixed, 95% CI) | 0.96 [0.20, 4.49] |
| 8.5 cystopexy vs cystopexy + pubourethral ligament plication | 1 | 102 | Risk Ratio (M‐H, Fixed, 95% CI) | 0.96 [0.06, 14.96] |
| 8.8 prolapse repair + urethrovesical endopelvic fascia repair vs prolapse repair + TVT | 1 | 50 | Risk Ratio (M‐H, Fixed, 95% CI) | 0.33 [0.04, 2.99] |
| 9 Number of women with dyspareunia Show forest plot | 2 | Risk Ratio (M‐H, Fixed, 95% CI) | Totals not selected | |
| Analysis 2.9  Comparison 2 One method of anterior prolapse repair versus another surgical method, Outcome 9 Number of women with dyspareunia. | ||||
| 9.3 traditional anterior colporraphy vs abdominal Burch colposuspension | 1 | Risk Ratio (M‐H, Fixed, 95% CI) | 0.0 [0.0, 0.0] | |
| 9.4 cystopexy vs cystopexy + pubourethral ligament plication | 1 | Risk Ratio (M‐H, Fixed, 95% CI) | 0.0 [0.0, 0.0] | |
| 10 Operating time (minutes) Show forest plot | 1 | Mean Difference (IV, Fixed, 95% CI) | Totals not selected | |
| Analysis 2.10  Comparison 2 One method of anterior prolapse repair versus another surgical method, Outcome 10 Operating time (minutes). | ||||
| 10.8 prolapse repair + urethrovesical endopelvic fascia repair vs prolapse repair + TVT | 1 | Mean Difference (IV, Fixed, 95% CI) | 0.0 [0.0, 0.0] | |
| 11 Blood loss (ml) Show forest plot | 1 | Mean Difference (IV, Fixed, 95% CI) | Totals not selected | |
| Analysis 2.11  Comparison 2 One method of anterior prolapse repair versus another surgical method, Outcome 11 Blood loss (ml). | ||||
| 11.8 prolapse repair + urethrovesical endopelvic fascia repair vs prolapse repair + TVT | 1 | Mean Difference (IV, Fixed, 95% CI) | 0.0 [0.0, 0.0] | |
| 12 Haemoglobin change Show forest plot | 1 | Mean Difference (IV, Fixed, 95% CI) | Totals not selected | |
| Analysis 2.12  Comparison 2 One method of anterior prolapse repair versus another surgical method, Outcome 12 Haemoglobin change. | ||||
| 12.8 prolapse repair + urethrovesical endopelvic fascia repair vs prolapse repair + TVT | 1 | Mean Difference (IV, Fixed, 95% CI) | 0.0 [0.0, 0.0] | |
| 13 Time to return to spontaneous voiding (days) Show forest plot | 1 | Mean Difference (IV, Fixed, 95% CI) | Totals not selected | |
| Analysis 2.13  Comparison 2 One method of anterior prolapse repair versus another surgical method, Outcome 13 Time to return to spontaneous voiding (days). | ||||
| 13.8 prolapse repair + urethrovesical endopelvic fascia repair vs prolapse repair + TVT | 1 | Mean Difference (IV, Fixed, 95% CI) | 0.0 [0.0, 0.0] | |
| 14 Number of women with postoperative complications Show forest plot | 6 | Risk Ratio (M‐H, Fixed, 95% CI) | Totals not selected | |
| Analysis 2.14  Comparison 2 One method of anterior prolapse repair versus another surgical method, Outcome 14 Number of women with postoperative complications. | ||||
| 14.2 traditional anterior colporraphy vs ultralateral anterior colporraphy | 1 | Risk Ratio (M‐H, Fixed, 95% CI) | 0.0 [0.0, 0.0] | |
| 14.3 traditional anterior colporraphy vs anterior colporraphy + mesh reinforcement | 2 | Risk Ratio (M‐H, Fixed, 95% CI) | 0.0 [0.0, 0.0] | |
| 14.4 ultralateral anterior colporraphy vs anterior colporraphy + mesh reinforcement | 1 | Risk Ratio (M‐H, Fixed, 95% CI) | 0.0 [0.0, 0.0] | |
| 14.5 traditional anterior colporraphy vs abdominal Burch colposuspension | 1 | Risk Ratio (M‐H, Fixed, 95% CI) | 0.0 [0.0, 0.0] | |
| 14.6 prolapse repair + urethrovesical plication vs prolapse repair + needle colposuspension | 1 | Risk Ratio (M‐H, Fixed, 95% CI) | 0.0 [0.0, 0.0] | |
| 14.7 cystopexy vs cystopexy + pubourethral ligament plication | 1 | Risk Ratio (M‐H, Fixed, 95% CI) | 0.0 [0.0, 0.0] | |
| 14.8 prolapse repair + urethrovesical endopelvic fascia repair vs prolapse repair + TVT | 1 | Risk Ratio (M‐H, Fixed, 95% CI) | 0.0 [0.0, 0.0] | |
| 15 Length of stay in hospital (days) Show forest plot | 3 | Mean Difference (IV, Fixed, 95% CI) | Totals not selected | |
| Analysis 2.15  Comparison 2 One method of anterior prolapse repair versus another surgical method, Outcome 15 Length of stay in hospital (days). | ||||
| 15.3 prolapse repair + urethrovesical plication vs prolapse repair + needle colposuspension | 1 | Mean Difference (IV, Fixed, 95% CI) | 0.0 [0.0, 0.0] | |
| 15.4 cystopexy vs cystopexy + pubourethral ligament plication | 1 | Mean Difference (IV, Fixed, 95% CI) | 0.0 [0.0, 0.0] | |
| 15.8 prolapse repair + urethrovesical endopelvic fascia repair vs prolapse repair + TVT | 1 | Mean Difference (IV, Fixed, 95% CI) | 0.0 [0.0, 0.0] | |
| 18 Number of women having further prolapse surgery Show forest plot | 4 | Risk Ratio (M‐H, Fixed, 95% CI) | Subtotals only | |
| Analysis 2.18  Comparison 2 One method of anterior prolapse repair versus another surgical method, Outcome 18 Number of women having further prolapse surgery. | ||||
| 18.3 traditional anterior colporraphy vs abdominal Burch colposuspension | 1 | 68 | Risk Ratio (M‐H, Fixed, 95% CI) | 0.0 [0.0, 0.0] |
| 18.4 prolapse repair + urethrovesical plication vs prolapse repair + needle colposuspension | 2 | 138 | Risk Ratio (M‐H, Fixed, 95% CI) | 0.41 [0.06, 2.71] |
| 18.5 cystopexy vs cystopexy + pubourethral ligament plication | 1 | 102 | Risk Ratio (M‐H, Fixed, 95% CI) | 0.0 [0.0, 0.0] |
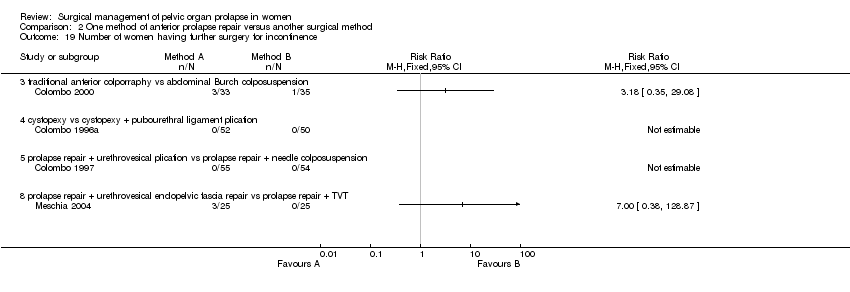
| 19 Number of women having further surgery for incontinence Show forest plot | 4 | Risk Ratio (M‐H, Fixed, 95% CI) | Totals not selected | |
| Analysis 2.19  Comparison 2 One method of anterior prolapse repair versus another surgical method, Outcome 19 Number of women having further surgery for incontinence. | ||||
| 19.3 traditional anterior colporraphy vs abdominal Burch colposuspension | 1 | Risk Ratio (M‐H, Fixed, 95% CI) | 0.0 [0.0, 0.0] | |
| 19.4 cystopexy vs cystopexy + pubourethral ligament plication | 1 | Risk Ratio (M‐H, Fixed, 95% CI) | 0.0 [0.0, 0.0] | |
| 19.5 prolapse repair + urethrovesical plication vs prolapse repair + needle colposuspension | 1 | Risk Ratio (M‐H, Fixed, 95% CI) | 0.0 [0.0, 0.0] | |
| 19.8 prolapse repair + urethrovesical endopelvic fascia repair vs prolapse repair + TVT | 1 | Risk Ratio (M‐H, Fixed, 95% CI) | 0.0 [0.0, 0.0] | |
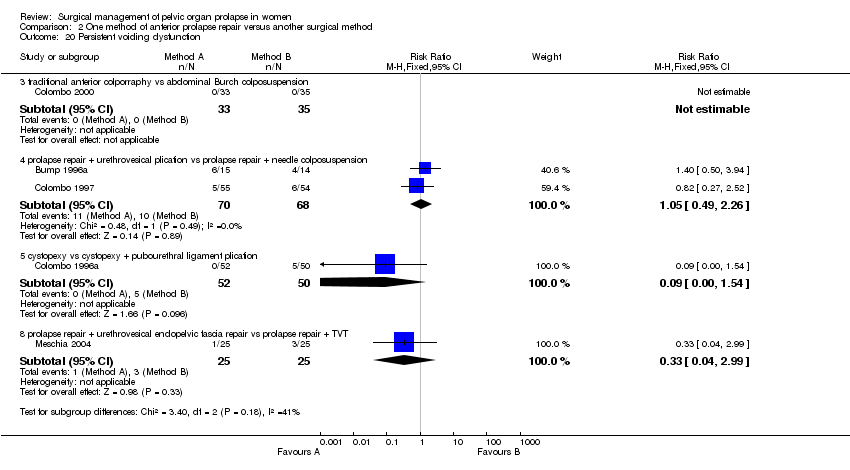
| 20 Persistent voiding dysfunction Show forest plot | 5 | Risk Ratio (M‐H, Fixed, 95% CI) | Subtotals only | |
| Analysis 2.20  Comparison 2 One method of anterior prolapse repair versus another surgical method, Outcome 20 Persistent voiding dysfunction. | ||||
| 20.3 traditional anterior colporraphy vs abdominal Burch colposuspension | 1 | 68 | Risk Ratio (M‐H, Fixed, 95% CI) | 0.0 [0.0, 0.0] |
| 20.4 prolapse repair + urethrovesical plication vs prolapse repair + needle colposuspension | 2 | 138 | Risk Ratio (M‐H, Fixed, 95% CI) | 1.05 [0.49, 2.26] |
| 20.5 cystopexy vs cystopexy + pubourethral ligament plication | 1 | 102 | Risk Ratio (M‐H, Fixed, 95% CI) | 0.09 [0.00, 1.54] |
| 20.8 prolapse repair + urethrovesical endopelvic fascia repair vs prolapse repair + TVT | 1 | 50 | Risk Ratio (M‐H, Fixed, 95% CI) | 0.33 [0.04, 2.99] |
| 21 Number of women with worse bowel function Show forest plot | 1 | Risk Ratio (M‐H, Fixed, 95% CI) | Totals not selected | |
| Analysis 2.21  Comparison 2 One method of anterior prolapse repair versus another surgical method, Outcome 21 Number of women with worse bowel function. | ||||
| 21.1 prolapse repair + urethrovesical plication vs prolapse repair + needle colposuspension | 1 | Risk Ratio (M‐H, Fixed, 95% CI) | 0.0 [0.0, 0.0] | |
| 23 Death Show forest plot | 1 | Risk Ratio (M‐H, Fixed, 95% CI) | Totals not selected | |
| Analysis 2.23  Comparison 2 One method of anterior prolapse repair versus another surgical method, Outcome 23 Death. | ||||
| 23.1 traditional anterior colporraphy vs ultralateral anterior colporraphy | 1 | Risk Ratio (M‐H, Fixed, 95% CI) | 0.0 [0.0, 0.0] | |
| 23.2 traditional anterior colporraphy vs anterior colporraphy + mesh reinforcement | 1 | Risk Ratio (M‐H, Fixed, 95% CI) | 0.0 [0.0, 0.0] | |
| 23.3 ultralateral anterior colporraphy vs anterior colporraphy + mesh reinforcement | 1 | Risk Ratio (M‐H, Fixed, 95% CI) | 0.0 [0.0, 0.0] | |
| Outcome or subgroup title | No. of studies | No. of participants | Statistical method | Effect size |
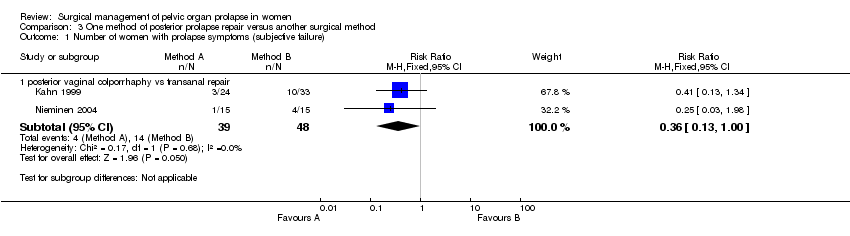
| 1 Number of women with prolapse symptoms (subjective failure) Show forest plot | 2 | Risk Ratio (M‐H, Fixed, 95% CI) | Subtotals only | |
| Analysis 3.1  Comparison 3 One method of posterior prolapse repair versus another surgical method, Outcome 1 Number of women with prolapse symptoms (subjective failure). | ||||
| 1.1 posterior vaginal colporrhaphy vs transanal repair | 2 | 87 | Risk Ratio (M‐H, Fixed, 95% CI) | 0.36 [0.13, 1.00] |
| 2 Number of women with prolapse (objective failure) Show forest plot | 3 | Risk Ratio (M‐H, Fixed, 95% CI) | Subtotals only | |
| Analysis 3.2  Comparison 3 One method of posterior prolapse repair versus another surgical method, Outcome 2 Number of women with prolapse (objective failure). | ||||
| 2.1 posterior vaginal colporrhaphy vs transanal repair (rectocele) | 2 | 87 | Risk Ratio (M‐H, Fixed, 95% CI) | 0.32 [0.07, 1.34] |
| 2.2 posterior vaginal colporrhaphy vs transanal repair (enterocele) | 2 | 87 | Risk Ratio (M‐H, Fixed, 95% CI) | 0.23 [0.07, 0.83] |
| 2.3 posterior vaginal colporrhaphy vs transanal repair (rectocele or enterocele)) | 2 | 87 | Risk Ratio (M‐H, Fixed, 95% CI) | 0.24 [0.09, 0.64] |
| 2.4 posterior vaginal colporraphy vs posterior colporraphy with mesh reinforcement for rectocele | 1 | 132 | Risk Ratio (M‐H, Fixed, 95% CI) | 1.13 [0.40, 3.19] |
| 4 Number of women with faecal incontinence after operation Show forest plot | 1 | Risk Ratio (M‐H, Fixed, 95% CI) | Totals not selected | |
| Analysis 3.4  Comparison 3 One method of posterior prolapse repair versus another surgical method, Outcome 4 Number of women with faecal incontinence after operation. | ||||
| 4.1 posterior vaginal colporrhaphy vs transanal repair | 1 | Risk Ratio (M‐H, Fixed, 95% CI) | 0.0 [0.0, 0.0] | |
| 5 Number of women with anal incontinence to flatus after operation Show forest plot | 1 | Risk Ratio (M‐H, Fixed, 95% CI) | Totals not selected | |
| Analysis 3.5  Comparison 3 One method of posterior prolapse repair versus another surgical method, Outcome 5 Number of women with anal incontinence to flatus after operation. | ||||
| 5.1 posterior vaginal colporrhaphy vs transanal repair | 1 | Risk Ratio (M‐H, Fixed, 95% CI) | 0.0 [0.0, 0.0] | |
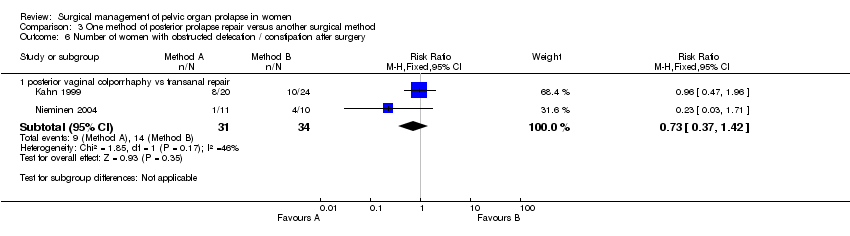
| 6 Number of women with obstructed defecation / constipation after surgery Show forest plot | 2 | Risk Ratio (M‐H, Fixed, 95% CI) | Subtotals only | |
| Analysis 3.6  Comparison 3 One method of posterior prolapse repair versus another surgical method, Outcome 6 Number of women with obstructed defecation / constipation after surgery. | ||||
| 6.1 posterior vaginal colporrhaphy vs transanal repair | 2 | 65 | Risk Ratio (M‐H, Fixed, 95% CI) | 0.73 [0.37, 1.42] |
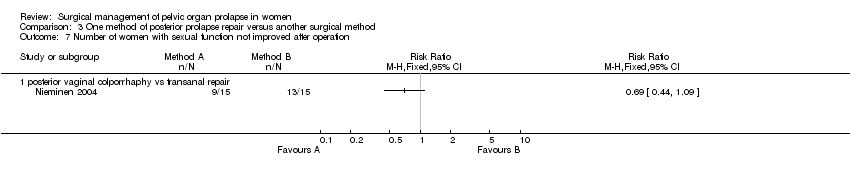
| 7 Number of women with sexual function not improved after operation Show forest plot | 1 | Risk Ratio (M‐H, Fixed, 95% CI) | Totals not selected | |
| Analysis 3.7  Comparison 3 One method of posterior prolapse repair versus another surgical method, Outcome 7 Number of women with sexual function not improved after operation. | ||||
| 7.1 posterior vaginal colporrhaphy vs transanal repair | 1 | Risk Ratio (M‐H, Fixed, 95% CI) | 0.0 [0.0, 0.0] | |
| 8 Number of women with dyspareunia Show forest plot | 2 | Risk Ratio (M‐H, Fixed, 95% CI) | Subtotals only | |
| Analysis 3.8  Comparison 3 One method of posterior prolapse repair versus another surgical method, Outcome 8 Number of women with dyspareunia. | ||||
| 8.1 posterior vaginal colporrhaphy vs transanal repair | 2 | 80 | Risk Ratio (M‐H, Fixed, 95% CI) | 3.13 [0.87, 11.23] |
| 9 Blood loss (ml) Show forest plot | 2 | Mean Difference (IV, Fixed, 95% CI) | Subtotals only | |
| Analysis 3.9  Comparison 3 One method of posterior prolapse repair versus another surgical method, Outcome 9 Blood loss (ml). | ||||
| 9.1 posterior vaginal colporrhaphy vs transanal repair | 2 | 87 | Mean Difference (IV, Fixed, 95% CI) | 79.38 [39.69, 119.08] |
| 10 Difference in haemoglobin Show forest plot | 1 | Mean Difference (IV, Fixed, 95% CI) | Totals not selected | |
| Analysis 3.10  Comparison 3 One method of posterior prolapse repair versus another surgical method, Outcome 10 Difference in haemoglobin. | ||||
| 10.1 posterior vaginal colporrhaphy vs transanal repair | 1 | Mean Difference (IV, Fixed, 95% CI) | 0.0 [0.0, 0.0] | |
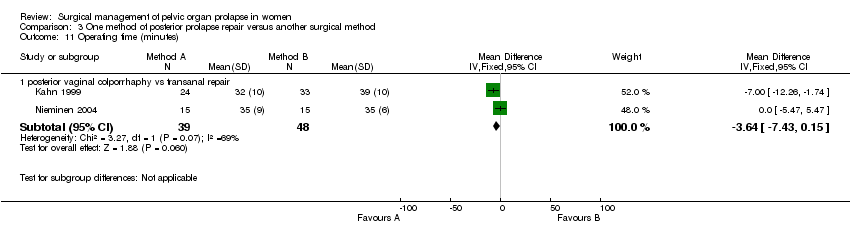
| 11 Operating time (minutes) Show forest plot | 2 | Mean Difference (IV, Fixed, 95% CI) | Subtotals only | |
| Analysis 3.11  Comparison 3 One method of posterior prolapse repair versus another surgical method, Outcome 11 Operating time (minutes). | ||||
| 11.1 posterior vaginal colporrhaphy vs transanal repair | 2 | 87 | Mean Difference (IV, Fixed, 95% CI) | ‐3.64 [‐7.43, 0.15] |
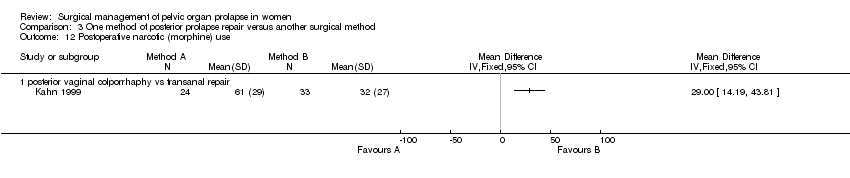
| 12 Postoperative narcotic (morphine) use Show forest plot | 1 | Mean Difference (IV, Fixed, 95% CI) | Totals not selected | |
| Analysis 3.12  Comparison 3 One method of posterior prolapse repair versus another surgical method, Outcome 12 Postoperative narcotic (morphine) use. | ||||
| 12.1 posterior vaginal colporrhaphy vs transanal repair | 1 | Mean Difference (IV, Fixed, 95% CI) | 0.0 [0.0, 0.0] | |
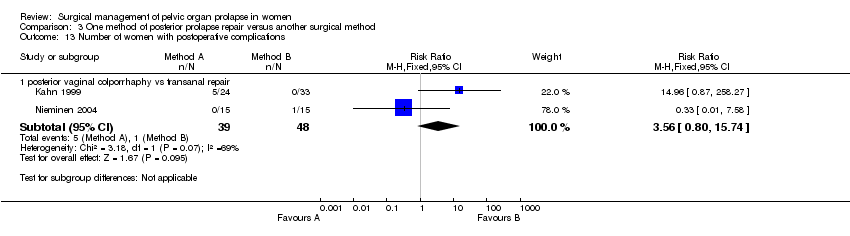
| 13 Number of women with postoperative complications Show forest plot | 2 | Risk Ratio (M‐H, Fixed, 95% CI) | Subtotals only | |
| Analysis 3.13  Comparison 3 One method of posterior prolapse repair versus another surgical method, Outcome 13 Number of women with postoperative complications. | ||||
| 13.1 posterior vaginal colporrhaphy vs transanal repair | 2 | 87 | Risk Ratio (M‐H, Fixed, 95% CI) | 3.56 [0.80, 15.74] |
| 14 Persistent postoperative pain Show forest plot | 1 | Risk Ratio (M‐H, Fixed, 95% CI) | Totals not selected | |
| Analysis 3.14  Comparison 3 One method of posterior prolapse repair versus another surgical method, Outcome 14 Persistent postoperative pain. | ||||
| 14.1 posterior vaginal colporrhaphy vs transanal repair | 1 | Risk Ratio (M‐H, Fixed, 95% CI) | 0.0 [0.0, 0.0] | |
| 15 Length of stay in hospital (days) Show forest plot | 1 | Mean Difference (IV, Fixed, 95% CI) | Totals not selected | |
| Analysis 3.15  Comparison 3 One method of posterior prolapse repair versus another surgical method, Outcome 15 Length of stay in hospital (days). | ||||
| 15.1 posterior vaginal colporrhaphy vs transanal repair | 1 | Mean Difference (IV, Fixed, 95% CI) | 0.0 [0.0, 0.0] | |
| Outcome or subgroup title | No. of studies | No. of participants | Statistical method | Effect size |
| 1 Number of women with de novo (new) stress urinary incontinence (subjective diagnosis) Show forest plot | 5 | Risk Ratio (M‐H, Fixed, 95% CI) | Subtotals only | |
| Analysis 7.1  Comparison 7 Prolapse repair and new urinary symptoms, Outcome 1 Number of women with de novo (new) stress urinary incontinence (subjective diagnosis). | ||||
| 1.1 cystopexy vs cystopexy + pubourethral ligament plication | 1 | 102 | Risk Ratio (M‐H, Fixed, 95% CI) | 0.96 [0.25, 3.64] |
| 1.2 prolapse repair + urethrovesical plication vs prolapse repair + needle colposuspension | 2 | 102 | Risk Ratio (M‐H, Fixed, 95% CI) | 2.62 [0.63, 10.91] |
| 1.4 abdominal colpopexy vs vaginal colpopexy | 1 | 46 | Risk Ratio (M‐H, Fixed, 95% CI) | 0.27 [0.06, 1.15] |
| 1.8 prolapse repair + urethrovesical endopelvic fascia repair vs prolapse repair + TVT | 1 | 50 | Risk Ratio (M‐H, Fixed, 95% CI) | 9.0 [1.23, 65.85] |
| 2 Number of women with de novo (new) stress urinary incontinence (objective diagnosis) Show forest plot | 2 | Risk Ratio (M‐H, Fixed, 95% CI) | Totals not selected | |
| Analysis 7.2  Comparison 7 Prolapse repair and new urinary symptoms, Outcome 2 Number of women with de novo (new) stress urinary incontinence (objective diagnosis). | ||||
| 2.2 prolapse repair + urethrovesical plication vs prolapse repair + needle colposuspension | 1 | Risk Ratio (M‐H, Fixed, 95% CI) | 0.0 [0.0, 0.0] | |
| 2.8 prolapse repair + urethrovesical endopelvic fascia repair vs prolapse repair + TVT | 1 | Risk Ratio (M‐H, Fixed, 95% CI) | 0.0 [0.0, 0.0] | |
| 3 Number of women with urgency, detrusor overactivity or overactive bladder Show forest plot | 1 | Risk Ratio (M‐H, Fixed, 95% CI) | Totals not selected | |
| Analysis 7.3  Comparison 7 Prolapse repair and new urinary symptoms, Outcome 3 Number of women with urgency, detrusor overactivity or overactive bladder. | ||||
| 3.6 prolapse repair + urethrovesical plication vs prolapse repair + needle colposuspension | 1 | Risk Ratio (M‐H, Fixed, 95% CI) | 0.0 [0.0, 0.0] | |
| 4 Number of women with de novo (new) urgency, detrusor overactivity or overactive bladder Show forest plot | 4 | Risk Ratio (M‐H, Fixed, 95% CI) | Totals not selected | |
| Analysis 7.4  Comparison 7 Prolapse repair and new urinary symptoms, Outcome 4 Number of women with de novo (new) urgency, detrusor overactivity or overactive bladder. | ||||
| 4.1 abdominal colpopexy vs vaginal colpopexy | 1 | Risk Ratio (M‐H, Fixed, 95% CI) | 0.0 [0.0, 0.0] | |
| 4.2 cystopexy vs cystopexy + pubourethral ligament plication | 1 | Risk Ratio (M‐H, Fixed, 95% CI) | 0.0 [0.0, 0.0] | |
| 4.3 prolapse repair + urethrovesical plication vs prolapse repair + needle colposuspension | 1 | Risk Ratio (M‐H, Fixed, 95% CI) | 0.0 [0.0, 0.0] | |
| 4.8 prolapse repair + urethrovesical endopelvic fascia repair vs prolapse repair + TVT | 1 | Risk Ratio (M‐H, Fixed, 95% CI) | 0.0 [0.0, 0.0] | |
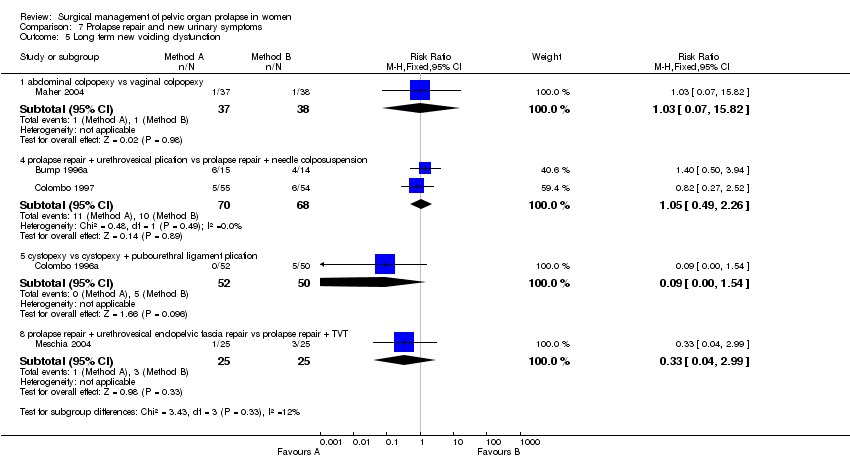
| 5 Long term new voiding dysfunction Show forest plot | 5 | Risk Ratio (M‐H, Fixed, 95% CI) | Subtotals only | |
| Analysis 7.5  Comparison 7 Prolapse repair and new urinary symptoms, Outcome 5 Long term new voiding dysfunction. | ||||
| 5.1 abdominal colpopexy vs vaginal colpopexy | 1 | 75 | Risk Ratio (M‐H, Fixed, 95% CI) | 1.03 [0.07, 15.82] |
| 5.4 prolapse repair + urethrovesical plication vs prolapse repair + needle colposuspension | 2 | 138 | Risk Ratio (M‐H, Fixed, 95% CI) | 1.05 [0.49, 2.26] |
| 5.5 cystopexy vs cystopexy + pubourethral ligament plication | 1 | 102 | Risk Ratio (M‐H, Fixed, 95% CI) | 0.09 [0.00, 1.54] |
| 5.8 prolapse repair + urethrovesical endopelvic fascia repair vs prolapse repair + TVT | 1 | 50 | Risk Ratio (M‐H, Fixed, 95% CI) | 0.33 [0.04, 2.99] |
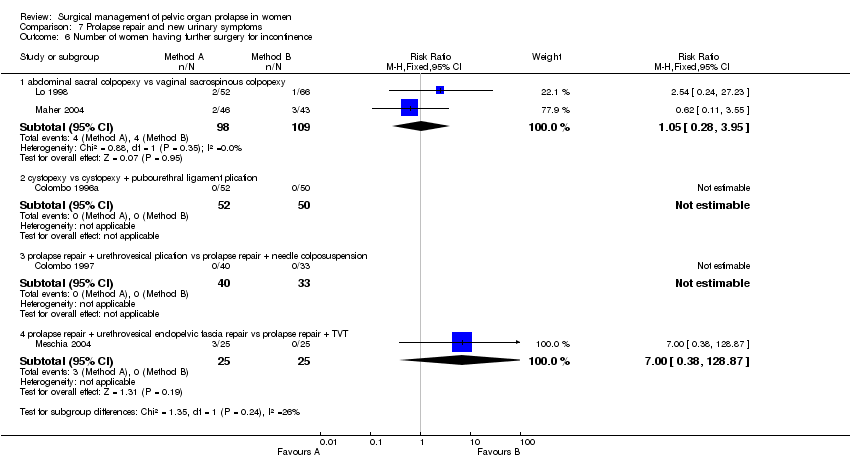
| 6 Number of women having further surgery for incontinence Show forest plot | 5 | Risk Ratio (M‐H, Fixed, 95% CI) | Subtotals only | |
| Analysis 7.6  Comparison 7 Prolapse repair and new urinary symptoms, Outcome 6 Number of women having further surgery for incontinence. | ||||
| 6.1 abdominal sacral colpopexy vs vaginal sacrospinous colpopexy | 2 | 207 | Risk Ratio (M‐H, Fixed, 95% CI) | 1.05 [0.28, 3.95] |
| 6.2 cystopexy vs cystopexy + pubourethral ligament plication | 1 | 102 | Risk Ratio (M‐H, Fixed, 95% CI) | 0.0 [0.0, 0.0] |
| 6.3 prolapse repair + urethrovesical plication vs prolapse repair + needle colposuspension | 1 | 73 | Risk Ratio (M‐H, Fixed, 95% CI) | 0.0 [0.0, 0.0] |
| 6.4 prolapse repair + urethrovesical endopelvic fascia repair vs prolapse repair + TVT | 1 | 50 | Risk Ratio (M‐H, Fixed, 95% CI) | 7.0 [0.38, 128.87] |
| Outcome or subgroup title | No. of studies | No. of participants | Statistical method | Effect size |
| 1 Number of women with anterior prolapse / cystocele (objective failure) Show forest plot | 2 | Risk Ratio (M‐H, Fixed, 95% CI) | Subtotals only | |
| Analysis 8.1  Comparison 8 Use of native tissue versus mesh or foreign material, Outcome 1 Number of women with anterior prolapse / cystocele (objective failure). | ||||
| 1.1 traditional or ultralateral anterior colporraphy vs anterior colporraphy + mesh reinforcement | 2 | 226 | Risk Ratio (M‐H, Fixed, 95% CI) | 1.39 [1.02, 1.90] |
| 2 Number of women with posterior prolapse / rectocele (objective failure) Show forest plot | 1 | Risk Ratio (M‐H, Fixed, 95% CI) | Totals not selected | |
| Analysis 8.2  Comparison 8 Use of native tissue versus mesh or foreign material, Outcome 2 Number of women with posterior prolapse / rectocele (objective failure). | ||||
| 2.1 traditional anterior colporraphy vs anterior colporraphy + mesh reinforcement | 1 | Risk Ratio (M‐H, Fixed, 95% CI) | 0.0 [0.0, 0.0] | |
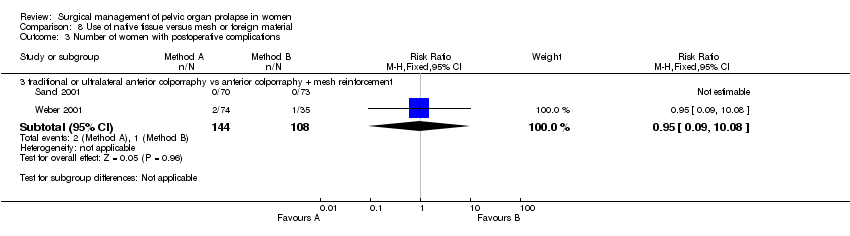
| 3 Number of women with postoperative complications Show forest plot | 2 | Risk Ratio (M‐H, Fixed, 95% CI) | Subtotals only | |
| Analysis 8.3  Comparison 8 Use of native tissue versus mesh or foreign material, Outcome 3 Number of women with postoperative complications. | ||||
| 3.3 traditional or ultralateral anterior colporraphy vs anterior colporraphy + mesh reinforcement | 2 | 252 | Risk Ratio (M‐H, Fixed, 95% CI) | 0.95 [0.09, 10.08] |
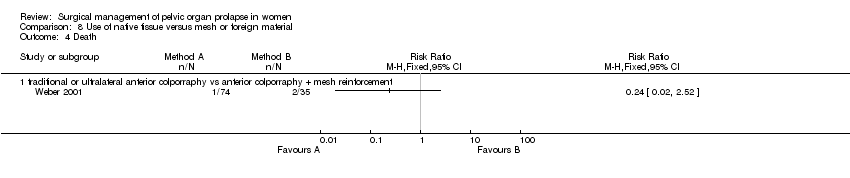
| 4 Death Show forest plot | 1 | Risk Ratio (M‐H, Fixed, 95% CI) | Totals not selected | |
| Analysis 8.4  Comparison 8 Use of native tissue versus mesh or foreign material, Outcome 4 Death. | ||||
| 4.1 traditional or ultralateral anterior colporraphy vs anterior colporraphy + mesh reinforcement | 1 | Risk Ratio (M‐H, Fixed, 95% CI) | 0.0 [0.0, 0.0] | |

Comparison 1 Surgery for upper vaginal (vault/uterine) prolapse, Outcome 1 Number of women with prolapse symptoms (subjective failure).
Comparison 1 Surgery for upper vaginal (vault/uterine) prolapse, Outcome 2 Number of women with any prolapse (objective failure).

Comparison 1 Surgery for upper vaginal (vault/uterine) prolapse, Outcome 3 Number of women with recurrent vault prolapse (objective).
Comparison 1 Surgery for upper vaginal (vault/uterine) prolapse, Outcome 4 Number of women unsatisfied with surgery.
Comparison 1 Surgery for upper vaginal (vault/uterine) prolapse, Outcome 5 Number of women with post‐operative stress urinary incontinence.
Comparison 1 Surgery for upper vaginal (vault/uterine) prolapse, Outcome 6 Number of women with urgency, detrusor overactivity or overactive bladder.
Comparison 1 Surgery for upper vaginal (vault/uterine) prolapse, Outcome 7 Number of women with de novo (new) urgency, detrusor overactivity or overactive bladder.

Comparison 1 Surgery for upper vaginal (vault/uterine) prolapse, Outcome 8 Number of women with persistent voiding dysfunction.

Comparison 1 Surgery for upper vaginal (vault/uterine) prolapse, Outcome 9 Number of women with new voiding dysfunction.
Comparison 1 Surgery for upper vaginal (vault/uterine) prolapse, Outcome 10 Number of women with constipation.

Comparison 1 Surgery for upper vaginal (vault/uterine) prolapse, Outcome 11 Number of women with faecal incontinence.

Comparison 1 Surgery for upper vaginal (vault/uterine) prolapse, Outcome 12 Number of women with obstructed defecation.
Comparison 1 Surgery for upper vaginal (vault/uterine) prolapse, Outcome 13 Postoperative dyspareunia.

Comparison 1 Surgery for upper vaginal (vault/uterine) prolapse, Outcome 14 Women with de novo (new) postoperative dyspareunia.
Comparison 1 Surgery for upper vaginal (vault/uterine) prolapse, Outcome 15 Blood loss (ml).
Comparison 1 Surgery for upper vaginal (vault/uterine) prolapse, Outcome 16 Postoperative decrease in Hb (gm/dl).
Comparison 1 Surgery for upper vaginal (vault/uterine) prolapse, Outcome 17 Operating time (minutes).
Comparison 1 Surgery for upper vaginal (vault/uterine) prolapse, Outcome 18 Length of stay in hospital (days).

Comparison 1 Surgery for upper vaginal (vault/uterine) prolapse, Outcome 19 Time to return to normal activity (days).

Comparison 1 Surgery for upper vaginal (vault/uterine) prolapse, Outcome 20 Cost (US dollars).
Comparison 1 Surgery for upper vaginal (vault/uterine) prolapse, Outcome 21 Women having further prolapse surgery.
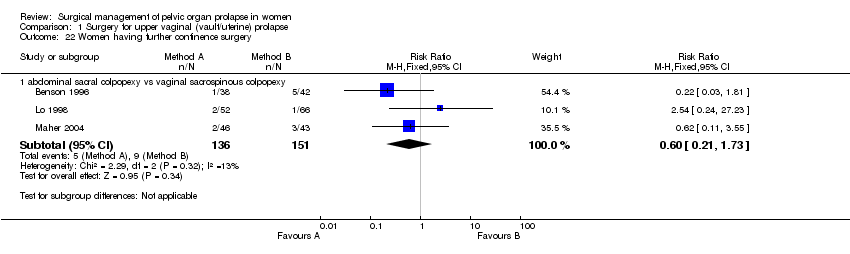
Comparison 1 Surgery for upper vaginal (vault/uterine) prolapse, Outcome 22 Women having further continence surgery.

Comparison 1 Surgery for upper vaginal (vault/uterine) prolapse, Outcome 23 Women having further prolapse or continence surgery.

Comparison 1 Surgery for upper vaginal (vault/uterine) prolapse, Outcome 24 Time to recurrence of prolapse (months).

Comparison 1 Surgery for upper vaginal (vault/uterine) prolapse, Outcome 25 Adverse events.

Comparison 1 Surgery for upper vaginal (vault/uterine) prolapse, Outcome 26 Number of women with recurrent rectocele (objective).

Comparison 1 Surgery for upper vaginal (vault/uterine) prolapse, Outcome 27 Number of women with recurrent cystocele (objective).
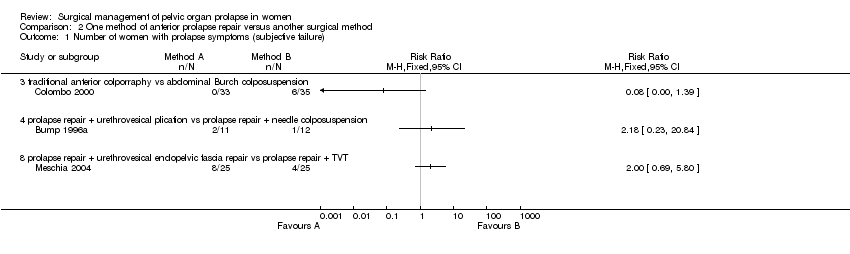
Comparison 2 One method of anterior prolapse repair versus another surgical method, Outcome 1 Number of women with prolapse symptoms (subjective failure).

Comparison 2 One method of anterior prolapse repair versus another surgical method, Outcome 2 Number of women with prolapse (objective failure).

Comparison 2 One method of anterior prolapse repair versus another surgical method, Outcome 3 Number of women with anterior prolapse / cystocele (objective failure).

Comparison 2 One method of anterior prolapse repair versus another surgical method, Outcome 4 Number of women with posterior prolapse / rectocele (objective failure).

Comparison 2 One method of anterior prolapse repair versus another surgical method, Outcome 6 Number of women with pre‐operative stress incontinence not cured.

Comparison 2 One method of anterior prolapse repair versus another surgical method, Outcome 7 Number of women with de novo (new) stress urinary incontinence.

Comparison 2 One method of anterior prolapse repair versus another surgical method, Outcome 8 Number of women with urgency, detrusor overactivity or overactive bladder.

Comparison 2 One method of anterior prolapse repair versus another surgical method, Outcome 9 Number of women with dyspareunia.
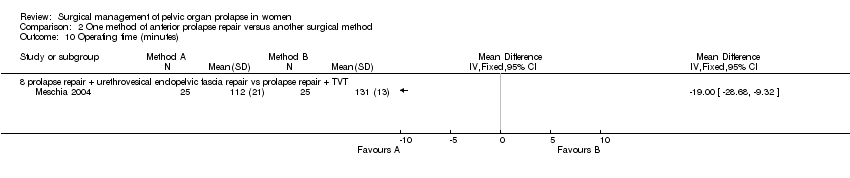
Comparison 2 One method of anterior prolapse repair versus another surgical method, Outcome 10 Operating time (minutes).

Comparison 2 One method of anterior prolapse repair versus another surgical method, Outcome 11 Blood loss (ml).

Comparison 2 One method of anterior prolapse repair versus another surgical method, Outcome 12 Haemoglobin change.

Comparison 2 One method of anterior prolapse repair versus another surgical method, Outcome 13 Time to return to spontaneous voiding (days).
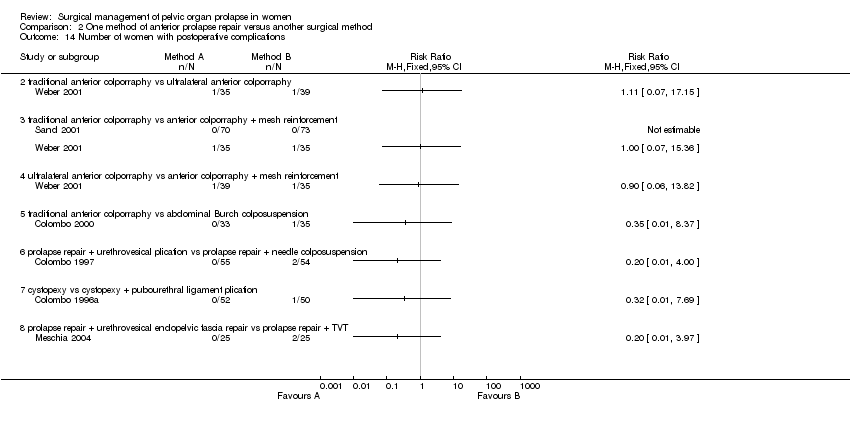
Comparison 2 One method of anterior prolapse repair versus another surgical method, Outcome 14 Number of women with postoperative complications.

Comparison 2 One method of anterior prolapse repair versus another surgical method, Outcome 15 Length of stay in hospital (days).

Comparison 2 One method of anterior prolapse repair versus another surgical method, Outcome 18 Number of women having further prolapse surgery.
Comparison 2 One method of anterior prolapse repair versus another surgical method, Outcome 19 Number of women having further surgery for incontinence.
Comparison 2 One method of anterior prolapse repair versus another surgical method, Outcome 20 Persistent voiding dysfunction.

Comparison 2 One method of anterior prolapse repair versus another surgical method, Outcome 21 Number of women with worse bowel function.

Comparison 2 One method of anterior prolapse repair versus another surgical method, Outcome 23 Death.
Comparison 3 One method of posterior prolapse repair versus another surgical method, Outcome 1 Number of women with prolapse symptoms (subjective failure).

Comparison 3 One method of posterior prolapse repair versus another surgical method, Outcome 2 Number of women with prolapse (objective failure).

Comparison 3 One method of posterior prolapse repair versus another surgical method, Outcome 4 Number of women with faecal incontinence after operation.

Comparison 3 One method of posterior prolapse repair versus another surgical method, Outcome 5 Number of women with anal incontinence to flatus after operation.
Comparison 3 One method of posterior prolapse repair versus another surgical method, Outcome 6 Number of women with obstructed defecation / constipation after surgery.
Comparison 3 One method of posterior prolapse repair versus another surgical method, Outcome 7 Number of women with sexual function not improved after operation.

Comparison 3 One method of posterior prolapse repair versus another surgical method, Outcome 8 Number of women with dyspareunia.

Comparison 3 One method of posterior prolapse repair versus another surgical method, Outcome 9 Blood loss (ml).

Comparison 3 One method of posterior prolapse repair versus another surgical method, Outcome 10 Difference in haemoglobin.
Comparison 3 One method of posterior prolapse repair versus another surgical method, Outcome 11 Operating time (minutes).
Comparison 3 One method of posterior prolapse repair versus another surgical method, Outcome 12 Postoperative narcotic (morphine) use.
Comparison 3 One method of posterior prolapse repair versus another surgical method, Outcome 13 Number of women with postoperative complications.

Comparison 3 One method of posterior prolapse repair versus another surgical method, Outcome 14 Persistent postoperative pain.

Comparison 3 One method of posterior prolapse repair versus another surgical method, Outcome 15 Length of stay in hospital (days).

Comparison 7 Prolapse repair and new urinary symptoms, Outcome 1 Number of women with de novo (new) stress urinary incontinence (subjective diagnosis).

Comparison 7 Prolapse repair and new urinary symptoms, Outcome 2 Number of women with de novo (new) stress urinary incontinence (objective diagnosis).
Comparison 7 Prolapse repair and new urinary symptoms, Outcome 3 Number of women with urgency, detrusor overactivity or overactive bladder.

Comparison 7 Prolapse repair and new urinary symptoms, Outcome 4 Number of women with de novo (new) urgency, detrusor overactivity or overactive bladder.
Comparison 7 Prolapse repair and new urinary symptoms, Outcome 5 Long term new voiding dysfunction.
Comparison 7 Prolapse repair and new urinary symptoms, Outcome 6 Number of women having further surgery for incontinence.

Comparison 8 Use of native tissue versus mesh or foreign material, Outcome 1 Number of women with anterior prolapse / cystocele (objective failure).

Comparison 8 Use of native tissue versus mesh or foreign material, Outcome 2 Number of women with posterior prolapse / rectocele (objective failure).
Comparison 8 Use of native tissue versus mesh or foreign material, Outcome 3 Number of women with postoperative complications.
Comparison 8 Use of native tissue versus mesh or foreign material, Outcome 4 Death.
| Outcome or subgroup title | No. of studies | No. of participants | Statistical method | Effect size |
| 1 Number of women with prolapse symptoms (subjective failure) Show forest plot | 3 | Risk Ratio (M‐H, Fixed, 95% CI) | Subtotals only | |
| 1.1 abdominal sacral colpopexy vs vaginal sacrospinous colpopexy | 2 | 169 | Risk Ratio (M‐H, Fixed, 95% CI) | 0.53 [0.25, 1.09] |
| 1.2 abdominal sacrohysteropexy with Gore‐Tex vs vaginal hysterectomy, vaginal repair, uterosacral ligament plicati | 1 | 82 | Risk Ratio (M‐H, Fixed, 95% CI) | 3.2 [1.29, 7.92] |
| 2 Number of women with any prolapse (objective failure) Show forest plot | 3 | Risk Ratio (M‐H, Fixed, 95% CI) | Subtotals only | |
| 2.1 abdominal sacral colpopexy vs vaginal sacrospinous colpopexy (failed) | 1 | 88 | Risk Ratio (M‐H, Fixed, 95% CI) | 0.77 [0.39, 1.53] |
| 2.2 abdominal sacral colpopexy vs vaginal sacrospinous colpopexy (not improved) | 1 | 118 | Risk Ratio (M‐H, Fixed, 95% CI) | 0.29 [0.09, 0.97] |
| 2.3 posterior intravaginal slingplasty vs sacrospinous colpopexy | 1 | 32 | Risk Ratio (M‐H, Fixed, 95% CI) | 0.8 [0.26, 2.45] |
| 3 Number of women with recurrent vault prolapse (objective) Show forest plot | 2 | Risk Ratio (M‐H, Fixed, 95% CI) | Subtotals only | |
| 3.1 abdominal sacral colpopexy vs vaginal sacrospinous colpopexy | 2 | 169 | Risk Ratio (M‐H, Fixed, 95% CI) | 0.23 [0.07, 0.77] |
| 4 Number of women unsatisfied with surgery Show forest plot | 1 | Risk Ratio (M‐H, Fixed, 95% CI) | Subtotals only | |
| 4.1 abdominal sacral colpopexy vs vaginal sacrospinous colpopexy | 1 | 89 | Risk Ratio (M‐H, Fixed, 95% CI) | 0.82 [0.32, 2.06] |
| 5 Number of women with post‐operative stress urinary incontinence Show forest plot | 2 | Risk Ratio (M‐H, Fixed, 95% CI) | Subtotals only | |
| 5.1 abdominal sacral colpopexy vs vaginal sacrospinous colpopexy | 2 | 155 | Risk Ratio (M‐H, Fixed, 95% CI) | 0.55 [0.32, 0.95] |
| 6 Number of women with urgency, detrusor overactivity or overactive bladder Show forest plot | 1 | Risk Ratio (M‐H, Fixed, 95% CI) | Totals not selected | |
| 6.1 abdominal sacral colpopexy vs vaginal sacrospinous colpopexy | 1 | Risk Ratio (M‐H, Fixed, 95% CI) | 0.0 [0.0, 0.0] | |
| 7 Number of women with de novo (new) urgency, detrusor overactivity or overactive bladder Show forest plot | 1 | Risk Ratio (M‐H, Fixed, 95% CI) | Totals not selected | |
| 7.1 abdominal sacral colpopexy vs vaginal sacrospinous colpopexy | 1 | Risk Ratio (M‐H, Fixed, 95% CI) | 0.0 [0.0, 0.0] | |
| 8 Number of women with persistent voiding dysfunction Show forest plot | 1 | Risk Ratio (M‐H, Fixed, 95% CI) | Totals not selected | |
| 8.1 abdominal sacral colpopexy vs vaginal sacrospinous colpopexy | 1 | Risk Ratio (M‐H, Fixed, 95% CI) | 0.0 [0.0, 0.0] | |
| 9 Number of women with new voiding dysfunction Show forest plot | 1 | Risk Ratio (M‐H, Fixed, 95% CI) | Totals not selected | |
| 9.1 abdominal sacral colpopexy vs vaginal sacrospinous colpopexy | 1 | Risk Ratio (M‐H, Fixed, 95% CI) | 0.0 [0.0, 0.0] | |
| 10 Number of women with constipation Show forest plot | 1 | Risk Ratio (M‐H, Fixed, 95% CI) | Totals not selected | |
| 10.1 abdominal sacral colpopexy vs vaginal sacrospinous colpopexy | 1 | Risk Ratio (M‐H, Fixed, 95% CI) | 0.0 [0.0, 0.0] | |
| 11 Number of women with faecal incontinence Show forest plot | 2 | Risk Ratio (M‐H, Fixed, 95% CI) | Totals not selected | |
| 11.1 abdominal sacral colpopexy vs vaginal sacrospinous colpopexy | 1 | Risk Ratio (M‐H, Fixed, 95% CI) | 0.0 [0.0, 0.0] | |
| 11.2 posterior intravaginal slingplasty vs sacrospinous colpopexy | 1 | Risk Ratio (M‐H, Fixed, 95% CI) | 0.0 [0.0, 0.0] | |
| 12 Number of women with obstructed defecation Show forest plot | 1 | Risk Ratio (M‐H, Fixed, 95% CI) | Totals not selected | |
| 12.1 abdominal sacral colpopexy vs vaginal sacrospinous colpopexy | 1 | Risk Ratio (M‐H, Fixed, 95% CI) | 0.0 [0.0, 0.0] | |
| 13 Postoperative dyspareunia Show forest plot | 4 | Risk Ratio (M‐H, Fixed, 95% CI) | Subtotals only | |
| 13.1 abdominal sacral colpopexy vs vaginal sacrospinous colpopexy | 3 | 106 | Risk Ratio (M‐H, Fixed, 95% CI) | 0.39 [0.18, 0.86] |
| 13.2 posterior intravaginal slingplasty vs sacrospinous colpopexy | 1 | 32 | Risk Ratio (M‐H, Fixed, 95% CI) | 0.33 [0.01, 7.62] |
| 14 Women with de novo (new) postoperative dyspareunia Show forest plot | 1 | Risk Ratio (M‐H, Fixed, 95% CI) | Totals not selected | |
| 14.1 abdominal sacral colpopexy vs vaginal sacrospinous colpopexy | 1 | Risk Ratio (M‐H, Fixed, 95% CI) | 0.0 [0.0, 0.0] | |
| 15 Blood loss (ml) Show forest plot | 4 | Mean Difference (IV, Fixed, 95% CI) | Subtotals only | |
| 15.1 abdominal sacral colpopexy vs vaginal sacrospinous colpopexy | 2 | 213 | Mean Difference (IV, Fixed, 95% CI) | ‐156.52 [‐212.71, ‐100.32] |
| 15.2 abdominal sacrohysteropexy with Gore‐Tex vs vaginal hysterectomy, vaginal repair, uterosacral ligament plicati | 1 | 82 | Mean Difference (IV, Fixed, 95% CI) | ‐4.0 [‐22.91, 14.91] |
| 15.3 posterior intravaginal slingplasty vs sacrospinous colpopexy | 1 | 32 | Mean Difference (IV, Fixed, 95% CI) | ‐50.00 [‐77.48, ‐26.52] |
| 16 Postoperative decrease in Hb (gm/dl) Show forest plot | 1 | Mean Difference (IV, Fixed, 95% CI) | Totals not selected | |
| 16.1 abdominal sacral colpopexy vs vaginal sacrospinous colpopexy | 1 | Mean Difference (IV, Fixed, 95% CI) | 0.0 [0.0, 0.0] | |
| 17 Operating time (minutes) Show forest plot | 5 | Mean Difference (IV, Fixed, 95% CI) | Subtotals only | |
| 17.1 abdominal sacral colpopexy vs vaginal sacrospinous colpopexy | 3 | 293 | Mean Difference (IV, Fixed, 95% CI) | 21.04 [12.15, 29.94] |
| 17.2 abdominal sacrohysteropexy with Gore‐Tex vs vaginal hysterectomy, vaginal repair, uterosacral ligament plicati | 1 | 82 | Mean Difference (IV, Fixed, 95% CI) | ‐10.0 [‐11.81, ‐8.19] |
| 17.3 posterior intravaginal slingplasty vs sacrospinous colpopexy | 1 | 32 | Mean Difference (IV, Fixed, 95% CI) | ‐14.0 [‐25.28, ‐2.72] |
| 18 Length of stay in hospital (days) Show forest plot | 4 | Mean Difference (IV, Fixed, 95% CI) | Subtotals only | |
| 18.1 abdominal sacral colpopexy vs vaginal sacrospinous colpopexy | 3 | 293 | Mean Difference (IV, Fixed, 95% CI) | 0.14 [‐0.25, 0.53] |
| 18.2 abdominal sacrohysteropexy with Gore‐Tex vs vaginal hysterectomy, vaginal repair, uterosacral ligament plicati | 1 | 82 | Mean Difference (IV, Fixed, 95% CI) | 0.10 [‐0.01, 0.21] |
| 19 Time to return to normal activity (days) Show forest plot | 1 | Mean Difference (IV, Fixed, 95% CI) | Totals not selected | |
| 19.1 abdominal sacral colpopexy vs vaginal sacrospinous colpopexy | 1 | Mean Difference (IV, Fixed, 95% CI) | 0.0 [0.0, 0.0] | |
| 20 Cost (US dollars) Show forest plot | 2 | Mean Difference (IV, Fixed, 95% CI) | Subtotals only | |
| 20.1 abdominal sacral colpopexy vs vaginal sacrospinous colpopexy | 2 | 169 | Mean Difference (IV, Fixed, 95% CI) | 1333.95 [1027.24, 1640.65] |
| 21 Women having further prolapse surgery Show forest plot | 3 | Risk Ratio (M‐H, Fixed, 95% CI) | Subtotals only | |
| 21.1 abdominal sacral colpopexy vs vaginal sacrospinous colpopexy | 2 | 169 | Risk Ratio (M‐H, Fixed, 95% CI) | 0.46 [0.19, 1.11] |
| 21.2 abdominal sacrohysteropexy with Gore‐Tex vs vaginal hysterectomy, vaginal repair, uterosacral ligament plicati | 1 | 82 | Risk Ratio (M‐H, Fixed, 95% CI) | 9.0 [1.19, 67.85] |
| 22 Women having further continence surgery Show forest plot | 3 | Risk Ratio (M‐H, Fixed, 95% CI) | Subtotals only | |
| 22.1 abdominal sacral colpopexy vs vaginal sacrospinous colpopexy | 3 | 287 | Risk Ratio (M‐H, Fixed, 95% CI) | 0.60 [0.21, 1.73] |
| 23 Women having further prolapse or continence surgery Show forest plot | 2 | Risk Ratio (M‐H, Fixed, 95% CI) | Subtotals only | |
| 23.1 abdominal sacral colpopexy vs vaginal sacrospinous colpopexy | 2 | 169 | Risk Ratio (M‐H, Fixed, 95% CI) | 0.47 [0.23, 0.97] |
| 24 Time to recurrence of prolapse (months) Show forest plot | 1 | Mean Difference (IV, Fixed, 95% CI) | Totals not selected | |
| 24.1 abdominal sacral colpopexy vs vaginal sacrospinous colpopexy | 1 | Mean Difference (IV, Fixed, 95% CI) | 0.0 [0.0, 0.0] | |
| 25 Adverse events Show forest plot | 5 | Risk Ratio (M‐H, Fixed, 95% CI) | Subtotals only | |
| 25.1 abdominal sacral colpopexy vs vaginal sacrospinous colpopexy | 3 | 287 | Risk Ratio (M‐H, Fixed, 95% CI) | 1.30 [0.63, 2.69] |
| 25.2 abdominal sacrohysteropexy with Gore‐Tex vs vaginal hysterectomy, vaginal repair, uterosacral ligament plicati | 1 | 82 | Risk Ratio (M‐H, Fixed, 95% CI) | 1.2 [0.40, 3.62] |
| 25.3 posterior intravaginal slingplasty vs sacrospinous colpopexy | 1 | 47 | Risk Ratio (M‐H, Fixed, 95% CI) | 1.28 [0.32, 5.10] |
| 26 Number of women with recurrent rectocele (objective) Show forest plot | 1 | Risk Ratio (M‐H, Fixed, 95% CI) | Subtotals only | |
| 26.1 abdominal sacral colpopexy vs vaginal sacrospinous colpopexy | 1 | 89 | Risk Ratio (M‐H, Fixed, 95% CI) | 2.49 [0.71, 8.79] |
| 27 Number of women with recurrent cystocele (objective) Show forest plot | 1 | Risk Ratio (M‐H, Fixed, 95% CI) | Subtotals only | |
| 27.1 abdominal sacral colpopexy vs vaginal sacrospinous colpopexy | 1 | 89 | Risk Ratio (M‐H, Fixed, 95% CI) | 0.47 [0.12, 1.75] |
| Outcome or subgroup title | No. of studies | No. of participants | Statistical method | Effect size |
| 1 Number of women with prolapse symptoms (subjective failure) Show forest plot | 3 | Risk Ratio (M‐H, Fixed, 95% CI) | Totals not selected | |
| 1.3 traditional anterior colporraphy vs abdominal Burch colposuspension | 1 | Risk Ratio (M‐H, Fixed, 95% CI) | 0.0 [0.0, 0.0] | |
| 1.4 prolapse repair + urethrovesical plication vs prolapse repair + needle colposuspension | 1 | Risk Ratio (M‐H, Fixed, 95% CI) | 0.0 [0.0, 0.0] | |
| 1.8 prolapse repair + urethrovesical endopelvic fascia repair vs prolapse repair + TVT | 1 | Risk Ratio (M‐H, Fixed, 95% CI) | 0.0 [0.0, 0.0] | |
| 2 Number of women with prolapse (objective failure) Show forest plot | 4 | Risk Ratio (M‐H, Fixed, 95% CI) | Subtotals only | |
| 2.3 traditional anterior colporraphy vs abdominal Burch colposuspension | 1 | 68 | Risk Ratio (M‐H, Fixed, 95% CI) | 0.06 [0.01, 0.39] |
| 2.4 prolapse repair + urethrovesical plication vs prolapse repair + needle colposuspension | 2 | 138 | Risk Ratio (M‐H, Fixed, 95% CI) | 0.66 [0.34, 1.27] |
| 2.8 prolapse repair + urethrovesical endopelvic fascia repair vs prolapse repair + TVT | 1 | 50 | Risk Ratio (M‐H, Fixed, 95% CI) | 0.88 [0.37, 2.05] |
| 3 Number of women with anterior prolapse / cystocele (objective failure) Show forest plot | 7 | Risk Ratio (M‐H, Fixed, 95% CI) | Subtotals only | |
| 3.1 traditonal anterior colporrhaphy vs abdominal paravaginal repair | 0 | 0 | Risk Ratio (M‐H, Fixed, 95% CI) | 0.0 [0.0, 0.0] |
| 3.2 traditional anterior colporraphy vs ultralateral anterior colporraphy | 1 | 57 | Risk Ratio (M‐H, Fixed, 95% CI) | 1.29 [0.84, 1.98] |
| 3.3 traditional anterior colporraphy vs anterior colporraphy + mesh reinforcement | 2 | 202 | Risk Ratio (M‐H, Fixed, 95% CI) | 1.48 [1.07, 2.04] |
| 3.4 ultralateral anterior colporraphy vs anterior colporraphy + mesh reinforcement | 1 | 50 | Risk Ratio (M‐H, Fixed, 95% CI) | 0.94 [0.57, 1.54] |
| 3.5 traditional anterior colporraphy vs abdominal Burch colposuspension | 1 | 68 | Risk Ratio (M‐H, Fixed, 95% CI) | 0.09 [0.01, 0.64] |
| 3.6 prolapse repair + urethrovesical plication vs prolapse repair + needle colposuspension | 2 | 138 | Risk Ratio (M‐H, Fixed, 95% CI) | 0.55 [0.23, 1.29] |
| 3.7 cystopexy vs cystopexy + pubourethral ligament plication | 1 | 102 | Risk Ratio (M‐H, Fixed, 95% CI) | 0.96 [0.14, 6.57] |
| 3.8 prolapse repair + urethrovesical endopelvic fascia repair vs prolapse repair + TVT | 1 | 50 | Risk Ratio (M‐H, Fixed, 95% CI) | 1.17 [0.46, 2.98] |
| 4 Number of women with posterior prolapse / rectocele (objective failure) Show forest plot | 2 | Risk Ratio (M‐H, Fixed, 95% CI) | Totals not selected | |
| 4.1 traditional anterior colporraphy vs anterior colporraphy + mesh reinforcement | 1 | Risk Ratio (M‐H, Fixed, 95% CI) | 0.0 [0.0, 0.0] | |
| 4.8 prolapse repair + urethrovesical endopelvic fascia repair vs prolapse repair + TVT | 1 | Risk Ratio (M‐H, Fixed, 95% CI) | 0.0 [0.0, 0.0] | |
| 6 Number of women with pre‐operative stress incontinence not cured Show forest plot | 2 | Risk Ratio (M‐H, Fixed, 95% CI) | Totals not selected | |
| 6.3 traditional anterior colporraphy vs abdominal Burch colposuspension | 1 | Risk Ratio (M‐H, Fixed, 95% CI) | 0.0 [0.0, 0.0] | |
| 6.4 prolapse repair + urethrovesical plication vs prolapse repair + needle colposuspension | 1 | Risk Ratio (M‐H, Fixed, 95% CI) | 0.0 [0.0, 0.0] | |
| 7 Number of women with de novo (new) stress urinary incontinence Show forest plot | 4 | Risk Ratio (M‐H, Fixed, 95% CI) | Subtotals only | |
| 7.3 cystopexy vs cystopexy + pubourethral ligament plication | 1 | 102 | Risk Ratio (M‐H, Fixed, 95% CI) | 0.96 [0.25, 3.64] |
| 7.5 prolapse repair + urethrovesical plication vs prolapse repair + needle colposuspension | 2 | 102 | Risk Ratio (M‐H, Fixed, 95% CI) | 2.62 [0.63, 10.91] |
| 7.8 prolapse repair + urethrovesical endopelvic fascia repair vs prolapse repair + TVT | 1 | 50 | Risk Ratio (M‐H, Fixed, 95% CI) | 9.0 [1.23, 65.85] |
| 8 Number of women with urgency, detrusor overactivity or overactive bladder Show forest plot | 5 | Risk Ratio (M‐H, Fixed, 95% CI) | Subtotals only | |
| 8.3 traditional anterior colporraphy vs abdominal Burch colposuspension | 1 | 68 | Risk Ratio (M‐H, Fixed, 95% CI) | 1.06 [0.07, 16.27] |
| 8.4 prolapse repair + urethrovesical plication vs prolapse repair + needle colposuspension | 2 | 138 | Risk Ratio (M‐H, Fixed, 95% CI) | 0.96 [0.20, 4.49] |
| 8.5 cystopexy vs cystopexy + pubourethral ligament plication | 1 | 102 | Risk Ratio (M‐H, Fixed, 95% CI) | 0.96 [0.06, 14.96] |
| 8.8 prolapse repair + urethrovesical endopelvic fascia repair vs prolapse repair + TVT | 1 | 50 | Risk Ratio (M‐H, Fixed, 95% CI) | 0.33 [0.04, 2.99] |
| 9 Number of women with dyspareunia Show forest plot | 2 | Risk Ratio (M‐H, Fixed, 95% CI) | Totals not selected | |
| 9.3 traditional anterior colporraphy vs abdominal Burch colposuspension | 1 | Risk Ratio (M‐H, Fixed, 95% CI) | 0.0 [0.0, 0.0] | |
| 9.4 cystopexy vs cystopexy + pubourethral ligament plication | 1 | Risk Ratio (M‐H, Fixed, 95% CI) | 0.0 [0.0, 0.0] | |
| 10 Operating time (minutes) Show forest plot | 1 | Mean Difference (IV, Fixed, 95% CI) | Totals not selected | |
| 10.8 prolapse repair + urethrovesical endopelvic fascia repair vs prolapse repair + TVT | 1 | Mean Difference (IV, Fixed, 95% CI) | 0.0 [0.0, 0.0] | |
| 11 Blood loss (ml) Show forest plot | 1 | Mean Difference (IV, Fixed, 95% CI) | Totals not selected | |
| 11.8 prolapse repair + urethrovesical endopelvic fascia repair vs prolapse repair + TVT | 1 | Mean Difference (IV, Fixed, 95% CI) | 0.0 [0.0, 0.0] | |
| 12 Haemoglobin change Show forest plot | 1 | Mean Difference (IV, Fixed, 95% CI) | Totals not selected | |
| 12.8 prolapse repair + urethrovesical endopelvic fascia repair vs prolapse repair + TVT | 1 | Mean Difference (IV, Fixed, 95% CI) | 0.0 [0.0, 0.0] | |
| 13 Time to return to spontaneous voiding (days) Show forest plot | 1 | Mean Difference (IV, Fixed, 95% CI) | Totals not selected | |
| 13.8 prolapse repair + urethrovesical endopelvic fascia repair vs prolapse repair + TVT | 1 | Mean Difference (IV, Fixed, 95% CI) | 0.0 [0.0, 0.0] | |
| 14 Number of women with postoperative complications Show forest plot | 6 | Risk Ratio (M‐H, Fixed, 95% CI) | Totals not selected | |
| 14.2 traditional anterior colporraphy vs ultralateral anterior colporraphy | 1 | Risk Ratio (M‐H, Fixed, 95% CI) | 0.0 [0.0, 0.0] | |
| 14.3 traditional anterior colporraphy vs anterior colporraphy + mesh reinforcement | 2 | Risk Ratio (M‐H, Fixed, 95% CI) | 0.0 [0.0, 0.0] | |
| 14.4 ultralateral anterior colporraphy vs anterior colporraphy + mesh reinforcement | 1 | Risk Ratio (M‐H, Fixed, 95% CI) | 0.0 [0.0, 0.0] | |
| 14.5 traditional anterior colporraphy vs abdominal Burch colposuspension | 1 | Risk Ratio (M‐H, Fixed, 95% CI) | 0.0 [0.0, 0.0] | |
| 14.6 prolapse repair + urethrovesical plication vs prolapse repair + needle colposuspension | 1 | Risk Ratio (M‐H, Fixed, 95% CI) | 0.0 [0.0, 0.0] | |
| 14.7 cystopexy vs cystopexy + pubourethral ligament plication | 1 | Risk Ratio (M‐H, Fixed, 95% CI) | 0.0 [0.0, 0.0] | |
| 14.8 prolapse repair + urethrovesical endopelvic fascia repair vs prolapse repair + TVT | 1 | Risk Ratio (M‐H, Fixed, 95% CI) | 0.0 [0.0, 0.0] | |
| 15 Length of stay in hospital (days) Show forest plot | 3 | Mean Difference (IV, Fixed, 95% CI) | Totals not selected | |
| 15.3 prolapse repair + urethrovesical plication vs prolapse repair + needle colposuspension | 1 | Mean Difference (IV, Fixed, 95% CI) | 0.0 [0.0, 0.0] | |
| 15.4 cystopexy vs cystopexy + pubourethral ligament plication | 1 | Mean Difference (IV, Fixed, 95% CI) | 0.0 [0.0, 0.0] | |
| 15.8 prolapse repair + urethrovesical endopelvic fascia repair vs prolapse repair + TVT | 1 | Mean Difference (IV, Fixed, 95% CI) | 0.0 [0.0, 0.0] | |
| 18 Number of women having further prolapse surgery Show forest plot | 4 | Risk Ratio (M‐H, Fixed, 95% CI) | Subtotals only | |
| 18.3 traditional anterior colporraphy vs abdominal Burch colposuspension | 1 | 68 | Risk Ratio (M‐H, Fixed, 95% CI) | 0.0 [0.0, 0.0] |
| 18.4 prolapse repair + urethrovesical plication vs prolapse repair + needle colposuspension | 2 | 138 | Risk Ratio (M‐H, Fixed, 95% CI) | 0.41 [0.06, 2.71] |
| 18.5 cystopexy vs cystopexy + pubourethral ligament plication | 1 | 102 | Risk Ratio (M‐H, Fixed, 95% CI) | 0.0 [0.0, 0.0] |
| 19 Number of women having further surgery for incontinence Show forest plot | 4 | Risk Ratio (M‐H, Fixed, 95% CI) | Totals not selected | |
| 19.3 traditional anterior colporraphy vs abdominal Burch colposuspension | 1 | Risk Ratio (M‐H, Fixed, 95% CI) | 0.0 [0.0, 0.0] | |
| 19.4 cystopexy vs cystopexy + pubourethral ligament plication | 1 | Risk Ratio (M‐H, Fixed, 95% CI) | 0.0 [0.0, 0.0] | |
| 19.5 prolapse repair + urethrovesical plication vs prolapse repair + needle colposuspension | 1 | Risk Ratio (M‐H, Fixed, 95% CI) | 0.0 [0.0, 0.0] | |
| 19.8 prolapse repair + urethrovesical endopelvic fascia repair vs prolapse repair + TVT | 1 | Risk Ratio (M‐H, Fixed, 95% CI) | 0.0 [0.0, 0.0] | |
| 20 Persistent voiding dysfunction Show forest plot | 5 | Risk Ratio (M‐H, Fixed, 95% CI) | Subtotals only | |
| 20.3 traditional anterior colporraphy vs abdominal Burch colposuspension | 1 | 68 | Risk Ratio (M‐H, Fixed, 95% CI) | 0.0 [0.0, 0.0] |
| 20.4 prolapse repair + urethrovesical plication vs prolapse repair + needle colposuspension | 2 | 138 | Risk Ratio (M‐H, Fixed, 95% CI) | 1.05 [0.49, 2.26] |
| 20.5 cystopexy vs cystopexy + pubourethral ligament plication | 1 | 102 | Risk Ratio (M‐H, Fixed, 95% CI) | 0.09 [0.00, 1.54] |
| 20.8 prolapse repair + urethrovesical endopelvic fascia repair vs prolapse repair + TVT | 1 | 50 | Risk Ratio (M‐H, Fixed, 95% CI) | 0.33 [0.04, 2.99] |
| 21 Number of women with worse bowel function Show forest plot | 1 | Risk Ratio (M‐H, Fixed, 95% CI) | Totals not selected | |
| 21.1 prolapse repair + urethrovesical plication vs prolapse repair + needle colposuspension | 1 | Risk Ratio (M‐H, Fixed, 95% CI) | 0.0 [0.0, 0.0] | |
| 23 Death Show forest plot | 1 | Risk Ratio (M‐H, Fixed, 95% CI) | Totals not selected | |
| 23.1 traditional anterior colporraphy vs ultralateral anterior colporraphy | 1 | Risk Ratio (M‐H, Fixed, 95% CI) | 0.0 [0.0, 0.0] | |
| 23.2 traditional anterior colporraphy vs anterior colporraphy + mesh reinforcement | 1 | Risk Ratio (M‐H, Fixed, 95% CI) | 0.0 [0.0, 0.0] | |
| 23.3 ultralateral anterior colporraphy vs anterior colporraphy + mesh reinforcement | 1 | Risk Ratio (M‐H, Fixed, 95% CI) | 0.0 [0.0, 0.0] | |
| Outcome or subgroup title | No. of studies | No. of participants | Statistical method | Effect size |
| 1 Number of women with prolapse symptoms (subjective failure) Show forest plot | 2 | Risk Ratio (M‐H, Fixed, 95% CI) | Subtotals only | |
| 1.1 posterior vaginal colporrhaphy vs transanal repair | 2 | 87 | Risk Ratio (M‐H, Fixed, 95% CI) | 0.36 [0.13, 1.00] |
| 2 Number of women with prolapse (objective failure) Show forest plot | 3 | Risk Ratio (M‐H, Fixed, 95% CI) | Subtotals only | |
| 2.1 posterior vaginal colporrhaphy vs transanal repair (rectocele) | 2 | 87 | Risk Ratio (M‐H, Fixed, 95% CI) | 0.32 [0.07, 1.34] |
| 2.2 posterior vaginal colporrhaphy vs transanal repair (enterocele) | 2 | 87 | Risk Ratio (M‐H, Fixed, 95% CI) | 0.23 [0.07, 0.83] |
| 2.3 posterior vaginal colporrhaphy vs transanal repair (rectocele or enterocele)) | 2 | 87 | Risk Ratio (M‐H, Fixed, 95% CI) | 0.24 [0.09, 0.64] |
| 2.4 posterior vaginal colporraphy vs posterior colporraphy with mesh reinforcement for rectocele | 1 | 132 | Risk Ratio (M‐H, Fixed, 95% CI) | 1.13 [0.40, 3.19] |
| 4 Number of women with faecal incontinence after operation Show forest plot | 1 | Risk Ratio (M‐H, Fixed, 95% CI) | Totals not selected | |
| 4.1 posterior vaginal colporrhaphy vs transanal repair | 1 | Risk Ratio (M‐H, Fixed, 95% CI) | 0.0 [0.0, 0.0] | |
| 5 Number of women with anal incontinence to flatus after operation Show forest plot | 1 | Risk Ratio (M‐H, Fixed, 95% CI) | Totals not selected | |
| 5.1 posterior vaginal colporrhaphy vs transanal repair | 1 | Risk Ratio (M‐H, Fixed, 95% CI) | 0.0 [0.0, 0.0] | |
| 6 Number of women with obstructed defecation / constipation after surgery Show forest plot | 2 | Risk Ratio (M‐H, Fixed, 95% CI) | Subtotals only | |
| 6.1 posterior vaginal colporrhaphy vs transanal repair | 2 | 65 | Risk Ratio (M‐H, Fixed, 95% CI) | 0.73 [0.37, 1.42] |
| 7 Number of women with sexual function not improved after operation Show forest plot | 1 | Risk Ratio (M‐H, Fixed, 95% CI) | Totals not selected | |
| 7.1 posterior vaginal colporrhaphy vs transanal repair | 1 | Risk Ratio (M‐H, Fixed, 95% CI) | 0.0 [0.0, 0.0] | |
| 8 Number of women with dyspareunia Show forest plot | 2 | Risk Ratio (M‐H, Fixed, 95% CI) | Subtotals only | |
| 8.1 posterior vaginal colporrhaphy vs transanal repair | 2 | 80 | Risk Ratio (M‐H, Fixed, 95% CI) | 3.13 [0.87, 11.23] |
| 9 Blood loss (ml) Show forest plot | 2 | Mean Difference (IV, Fixed, 95% CI) | Subtotals only | |
| 9.1 posterior vaginal colporrhaphy vs transanal repair | 2 | 87 | Mean Difference (IV, Fixed, 95% CI) | 79.38 [39.69, 119.08] |
| 10 Difference in haemoglobin Show forest plot | 1 | Mean Difference (IV, Fixed, 95% CI) | Totals not selected | |
| 10.1 posterior vaginal colporrhaphy vs transanal repair | 1 | Mean Difference (IV, Fixed, 95% CI) | 0.0 [0.0, 0.0] | |
| 11 Operating time (minutes) Show forest plot | 2 | Mean Difference (IV, Fixed, 95% CI) | Subtotals only | |
| 11.1 posterior vaginal colporrhaphy vs transanal repair | 2 | 87 | Mean Difference (IV, Fixed, 95% CI) | ‐3.64 [‐7.43, 0.15] |
| 12 Postoperative narcotic (morphine) use Show forest plot | 1 | Mean Difference (IV, Fixed, 95% CI) | Totals not selected | |
| 12.1 posterior vaginal colporrhaphy vs transanal repair | 1 | Mean Difference (IV, Fixed, 95% CI) | 0.0 [0.0, 0.0] | |
| 13 Number of women with postoperative complications Show forest plot | 2 | Risk Ratio (M‐H, Fixed, 95% CI) | Subtotals only | |
| 13.1 posterior vaginal colporrhaphy vs transanal repair | 2 | 87 | Risk Ratio (M‐H, Fixed, 95% CI) | 3.56 [0.80, 15.74] |
| 14 Persistent postoperative pain Show forest plot | 1 | Risk Ratio (M‐H, Fixed, 95% CI) | Totals not selected | |
| 14.1 posterior vaginal colporrhaphy vs transanal repair | 1 | Risk Ratio (M‐H, Fixed, 95% CI) | 0.0 [0.0, 0.0] | |
| 15 Length of stay in hospital (days) Show forest plot | 1 | Mean Difference (IV, Fixed, 95% CI) | Totals not selected | |
| 15.1 posterior vaginal colporrhaphy vs transanal repair | 1 | Mean Difference (IV, Fixed, 95% CI) | 0.0 [0.0, 0.0] | |
| Outcome or subgroup title | No. of studies | No. of participants | Statistical method | Effect size |
| 1 Number of women with de novo (new) stress urinary incontinence (subjective diagnosis) Show forest plot | 5 | Risk Ratio (M‐H, Fixed, 95% CI) | Subtotals only | |
| 1.1 cystopexy vs cystopexy + pubourethral ligament plication | 1 | 102 | Risk Ratio (M‐H, Fixed, 95% CI) | 0.96 [0.25, 3.64] |
| 1.2 prolapse repair + urethrovesical plication vs prolapse repair + needle colposuspension | 2 | 102 | Risk Ratio (M‐H, Fixed, 95% CI) | 2.62 [0.63, 10.91] |
| 1.4 abdominal colpopexy vs vaginal colpopexy | 1 | 46 | Risk Ratio (M‐H, Fixed, 95% CI) | 0.27 [0.06, 1.15] |
| 1.8 prolapse repair + urethrovesical endopelvic fascia repair vs prolapse repair + TVT | 1 | 50 | Risk Ratio (M‐H, Fixed, 95% CI) | 9.0 [1.23, 65.85] |
| 2 Number of women with de novo (new) stress urinary incontinence (objective diagnosis) Show forest plot | 2 | Risk Ratio (M‐H, Fixed, 95% CI) | Totals not selected | |
| 2.2 prolapse repair + urethrovesical plication vs prolapse repair + needle colposuspension | 1 | Risk Ratio (M‐H, Fixed, 95% CI) | 0.0 [0.0, 0.0] | |
| 2.8 prolapse repair + urethrovesical endopelvic fascia repair vs prolapse repair + TVT | 1 | Risk Ratio (M‐H, Fixed, 95% CI) | 0.0 [0.0, 0.0] | |
| 3 Number of women with urgency, detrusor overactivity or overactive bladder Show forest plot | 1 | Risk Ratio (M‐H, Fixed, 95% CI) | Totals not selected | |
| 3.6 prolapse repair + urethrovesical plication vs prolapse repair + needle colposuspension | 1 | Risk Ratio (M‐H, Fixed, 95% CI) | 0.0 [0.0, 0.0] | |
| 4 Number of women with de novo (new) urgency, detrusor overactivity or overactive bladder Show forest plot | 4 | Risk Ratio (M‐H, Fixed, 95% CI) | Totals not selected | |
| 4.1 abdominal colpopexy vs vaginal colpopexy | 1 | Risk Ratio (M‐H, Fixed, 95% CI) | 0.0 [0.0, 0.0] | |
| 4.2 cystopexy vs cystopexy + pubourethral ligament plication | 1 | Risk Ratio (M‐H, Fixed, 95% CI) | 0.0 [0.0, 0.0] | |
| 4.3 prolapse repair + urethrovesical plication vs prolapse repair + needle colposuspension | 1 | Risk Ratio (M‐H, Fixed, 95% CI) | 0.0 [0.0, 0.0] | |
| 4.8 prolapse repair + urethrovesical endopelvic fascia repair vs prolapse repair + TVT | 1 | Risk Ratio (M‐H, Fixed, 95% CI) | 0.0 [0.0, 0.0] | |
| 5 Long term new voiding dysfunction Show forest plot | 5 | Risk Ratio (M‐H, Fixed, 95% CI) | Subtotals only | |
| 5.1 abdominal colpopexy vs vaginal colpopexy | 1 | 75 | Risk Ratio (M‐H, Fixed, 95% CI) | 1.03 [0.07, 15.82] |
| 5.4 prolapse repair + urethrovesical plication vs prolapse repair + needle colposuspension | 2 | 138 | Risk Ratio (M‐H, Fixed, 95% CI) | 1.05 [0.49, 2.26] |
| 5.5 cystopexy vs cystopexy + pubourethral ligament plication | 1 | 102 | Risk Ratio (M‐H, Fixed, 95% CI) | 0.09 [0.00, 1.54] |
| 5.8 prolapse repair + urethrovesical endopelvic fascia repair vs prolapse repair + TVT | 1 | 50 | Risk Ratio (M‐H, Fixed, 95% CI) | 0.33 [0.04, 2.99] |
| 6 Number of women having further surgery for incontinence Show forest plot | 5 | Risk Ratio (M‐H, Fixed, 95% CI) | Subtotals only | |
| 6.1 abdominal sacral colpopexy vs vaginal sacrospinous colpopexy | 2 | 207 | Risk Ratio (M‐H, Fixed, 95% CI) | 1.05 [0.28, 3.95] |
| 6.2 cystopexy vs cystopexy + pubourethral ligament plication | 1 | 102 | Risk Ratio (M‐H, Fixed, 95% CI) | 0.0 [0.0, 0.0] |
| 6.3 prolapse repair + urethrovesical plication vs prolapse repair + needle colposuspension | 1 | 73 | Risk Ratio (M‐H, Fixed, 95% CI) | 0.0 [0.0, 0.0] |
| 6.4 prolapse repair + urethrovesical endopelvic fascia repair vs prolapse repair + TVT | 1 | 50 | Risk Ratio (M‐H, Fixed, 95% CI) | 7.0 [0.38, 128.87] |
| Outcome or subgroup title | No. of studies | No. of participants | Statistical method | Effect size |
| 1 Number of women with anterior prolapse / cystocele (objective failure) Show forest plot | 2 | Risk Ratio (M‐H, Fixed, 95% CI) | Subtotals only | |
| 1.1 traditional or ultralateral anterior colporraphy vs anterior colporraphy + mesh reinforcement | 2 | 226 | Risk Ratio (M‐H, Fixed, 95% CI) | 1.39 [1.02, 1.90] |
| 2 Number of women with posterior prolapse / rectocele (objective failure) Show forest plot | 1 | Risk Ratio (M‐H, Fixed, 95% CI) | Totals not selected | |
| 2.1 traditional anterior colporraphy vs anterior colporraphy + mesh reinforcement | 1 | Risk Ratio (M‐H, Fixed, 95% CI) | 0.0 [0.0, 0.0] | |
| 3 Number of women with postoperative complications Show forest plot | 2 | Risk Ratio (M‐H, Fixed, 95% CI) | Subtotals only | |
| 3.3 traditional or ultralateral anterior colporraphy vs anterior colporraphy + mesh reinforcement | 2 | 252 | Risk Ratio (M‐H, Fixed, 95% CI) | 0.95 [0.09, 10.08] |
| 4 Death Show forest plot | 1 | Risk Ratio (M‐H, Fixed, 95% CI) | Totals not selected | |
| 4.1 traditional or ultralateral anterior colporraphy vs anterior colporraphy + mesh reinforcement | 1 | Risk Ratio (M‐H, Fixed, 95% CI) | 0.0 [0.0, 0.0] | |