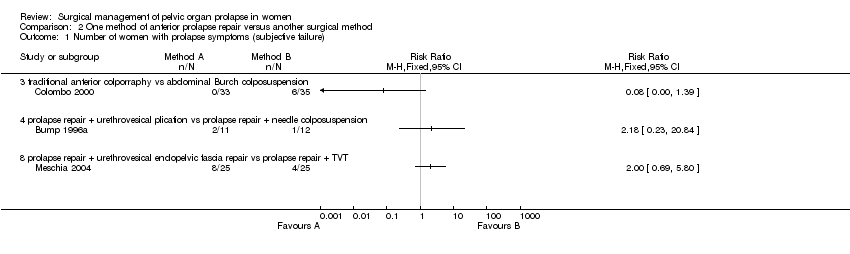
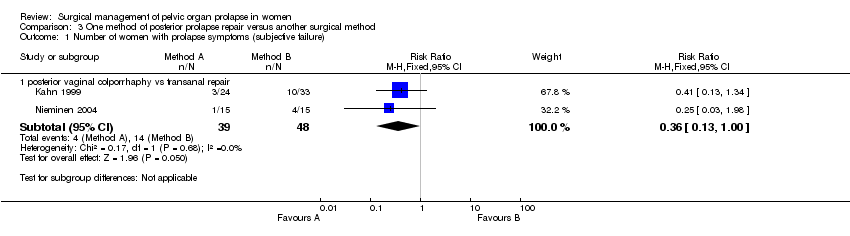
| 1 Number of women with prolapse symptoms (subjective failure) Show forest plot | 3 | | Risk Ratio (M‐H, Fixed, 95% CI) | Totals not selected |
|
| 1.3 traditional anterior colporraphy vs abdominal Burch colposuspension | 1 | | Risk Ratio (M‐H, Fixed, 95% CI) | 0.0 [0.0, 0.0] |
| 1.4 prolapse repair + urethrovesical plication vs prolapse repair + needle colposuspension | 1 | | Risk Ratio (M‐H, Fixed, 95% CI) | 0.0 [0.0, 0.0] |
| 1.8 prolapse repair + urethrovesical endopelvic fascia repair vs prolapse repair + TVT | 1 | | Risk Ratio (M‐H, Fixed, 95% CI) | 0.0 [0.0, 0.0] |
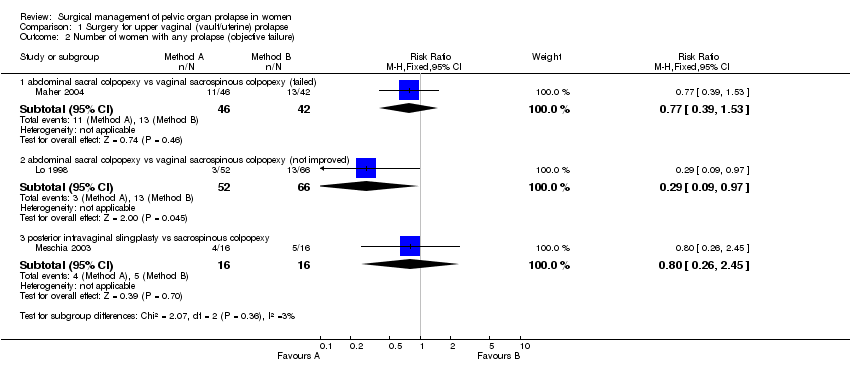
| 2 Number of women with prolapse (objective failure) Show forest plot | 4 | | Risk Ratio (M‐H, Fixed, 95% CI) | Subtotals only |
|
| 2.3 traditional anterior colporraphy vs abdominal Burch colposuspension | 1 | 68 | Risk Ratio (M‐H, Fixed, 95% CI) | 0.06 [0.01, 0.39] |
| 2.4 prolapse repair + urethrovesical plication vs prolapse repair + needle colposuspension | 2 | 138 | Risk Ratio (M‐H, Fixed, 95% CI) | 0.66 [0.34, 1.27] |
| 2.8 prolapse repair + urethrovesical endopelvic fascia repair vs prolapse repair + TVT | 1 | 50 | Risk Ratio (M‐H, Fixed, 95% CI) | 0.88 [0.37, 2.05] |
| 3 Number of women with anterior prolapse / cystocele (objective failure) Show forest plot | 7 | | Risk Ratio (M‐H, Fixed, 95% CI) | Subtotals only |
|
| 3.1 traditonal anterior colporrhaphy vs abdominal paravaginal repair | 0 | 0 | Risk Ratio (M‐H, Fixed, 95% CI) | 0.0 [0.0, 0.0] |
| 3.2 traditional anterior colporraphy vs ultralateral anterior colporraphy | 1 | 57 | Risk Ratio (M‐H, Fixed, 95% CI) | 1.29 [0.84, 1.98] |
| 3.3 traditional anterior colporraphy vs anterior colporraphy + mesh reinforcement | 2 | 202 | Risk Ratio (M‐H, Fixed, 95% CI) | 1.48 [1.07, 2.04] |
| 3.4 ultralateral anterior colporraphy vs anterior colporraphy + mesh reinforcement | 1 | 50 | Risk Ratio (M‐H, Fixed, 95% CI) | 0.94 [0.57, 1.54] |
| 3.5 traditional anterior colporraphy vs abdominal Burch colposuspension | 1 | 68 | Risk Ratio (M‐H, Fixed, 95% CI) | 0.09 [0.01, 0.64] |
| 3.6 prolapse repair + urethrovesical plication vs prolapse repair + needle colposuspension | 2 | 138 | Risk Ratio (M‐H, Fixed, 95% CI) | 0.55 [0.23, 1.29] |
| 3.7 cystopexy vs cystopexy + pubourethral ligament plication | 1 | 102 | Risk Ratio (M‐H, Fixed, 95% CI) | 0.96 [0.14, 6.57] |
| 3.8 prolapse repair + urethrovesical endopelvic fascia repair vs prolapse repair + TVT | 1 | 50 | Risk Ratio (M‐H, Fixed, 95% CI) | 1.17 [0.46, 2.98] |
| 4 Number of women with posterior prolapse / rectocele (objective failure) Show forest plot | 2 | | Risk Ratio (M‐H, Fixed, 95% CI) | Totals not selected |
|
| 4.1 traditional anterior colporraphy vs anterior colporraphy + mesh reinforcement | 1 | | Risk Ratio (M‐H, Fixed, 95% CI) | 0.0 [0.0, 0.0] |
| 4.8 prolapse repair + urethrovesical endopelvic fascia repair vs prolapse repair + TVT | 1 | | Risk Ratio (M‐H, Fixed, 95% CI) | 0.0 [0.0, 0.0] |
| 6 Number of women with pre‐operative stress incontinence not cured Show forest plot | 2 | | Risk Ratio (M‐H, Fixed, 95% CI) | Totals not selected |
|
| 6.3 traditional anterior colporraphy vs abdominal Burch colposuspension | 1 | | Risk Ratio (M‐H, Fixed, 95% CI) | 0.0 [0.0, 0.0] |
| 6.4 prolapse repair + urethrovesical plication vs prolapse repair + needle colposuspension | 1 | | Risk Ratio (M‐H, Fixed, 95% CI) | 0.0 [0.0, 0.0] |
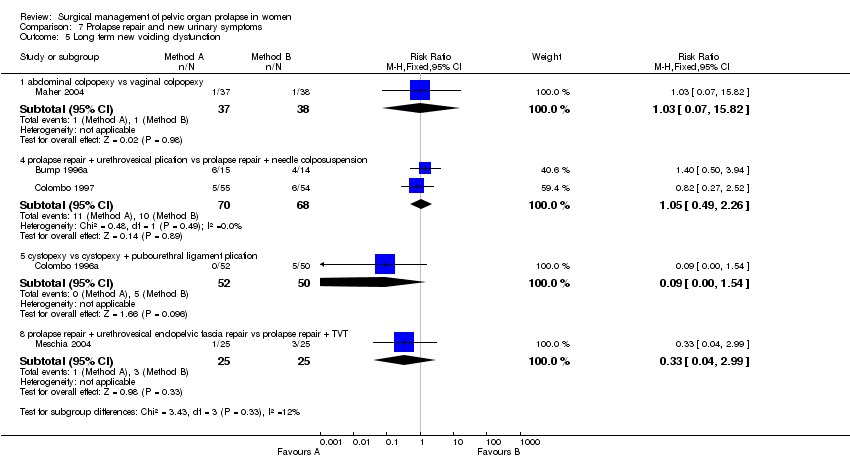
| 7 Number of women with de novo (new) stress urinary incontinence Show forest plot | 4 | | Risk Ratio (M‐H, Fixed, 95% CI) | Subtotals only |
|
| 7.3 cystopexy vs cystopexy + pubourethral ligament plication | 1 | 102 | Risk Ratio (M‐H, Fixed, 95% CI) | 0.96 [0.25, 3.64] |
| 7.5 prolapse repair + urethrovesical plication vs prolapse repair + needle colposuspension | 2 | 102 | Risk Ratio (M‐H, Fixed, 95% CI) | 2.62 [0.63, 10.91] |
| 7.8 prolapse repair + urethrovesical endopelvic fascia repair vs prolapse repair + TVT | 1 | 50 | Risk Ratio (M‐H, Fixed, 95% CI) | 9.0 [1.23, 65.85] |
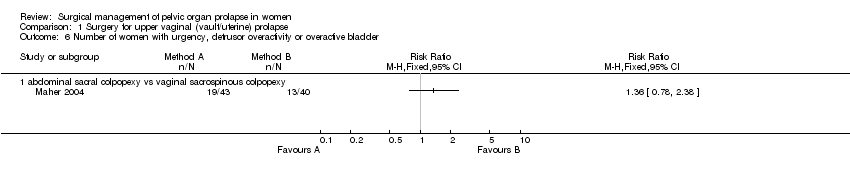
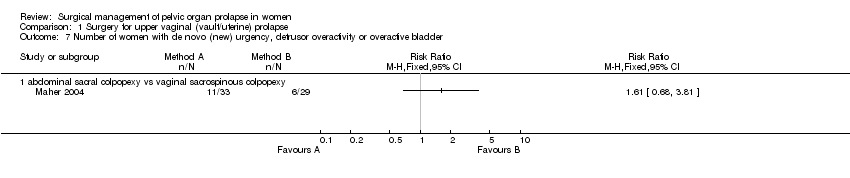
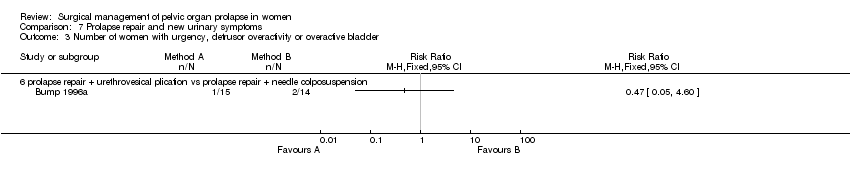
| 8 Number of women with urgency, detrusor overactivity or overactive bladder Show forest plot | 5 | | Risk Ratio (M‐H, Fixed, 95% CI) | Subtotals only |
|
| 8.3 traditional anterior colporraphy vs abdominal Burch colposuspension | 1 | 68 | Risk Ratio (M‐H, Fixed, 95% CI) | 1.06 [0.07, 16.27] |
| 8.4 prolapse repair + urethrovesical plication vs prolapse repair + needle colposuspension | 2 | 138 | Risk Ratio (M‐H, Fixed, 95% CI) | 0.96 [0.20, 4.49] |
| 8.5 cystopexy vs cystopexy + pubourethral ligament plication | 1 | 102 | Risk Ratio (M‐H, Fixed, 95% CI) | 0.96 [0.06, 14.96] |
| 8.8 prolapse repair + urethrovesical endopelvic fascia repair vs prolapse repair + TVT | 1 | 50 | Risk Ratio (M‐H, Fixed, 95% CI) | 0.33 [0.04, 2.99] |
| 9 Number of women with dyspareunia Show forest plot | 2 | | Risk Ratio (M‐H, Fixed, 95% CI) | Totals not selected |
|
| 9.3 traditional anterior colporraphy vs abdominal Burch colposuspension | 1 | | Risk Ratio (M‐H, Fixed, 95% CI) | 0.0 [0.0, 0.0] |
| 9.4 cystopexy vs cystopexy + pubourethral ligament plication | 1 | | Risk Ratio (M‐H, Fixed, 95% CI) | 0.0 [0.0, 0.0] |
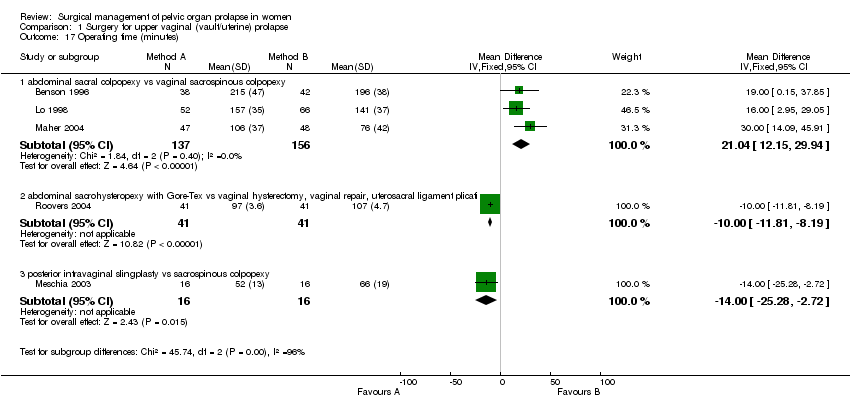
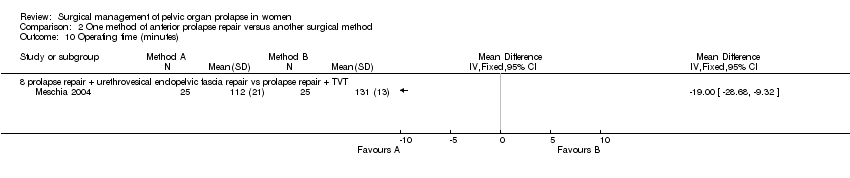
| 10 Operating time (minutes) Show forest plot | 1 | | Mean Difference (IV, Fixed, 95% CI) | Totals not selected |
|
| 10.8 prolapse repair + urethrovesical endopelvic fascia repair vs prolapse repair + TVT | 1 | | Mean Difference (IV, Fixed, 95% CI) | 0.0 [0.0, 0.0] |
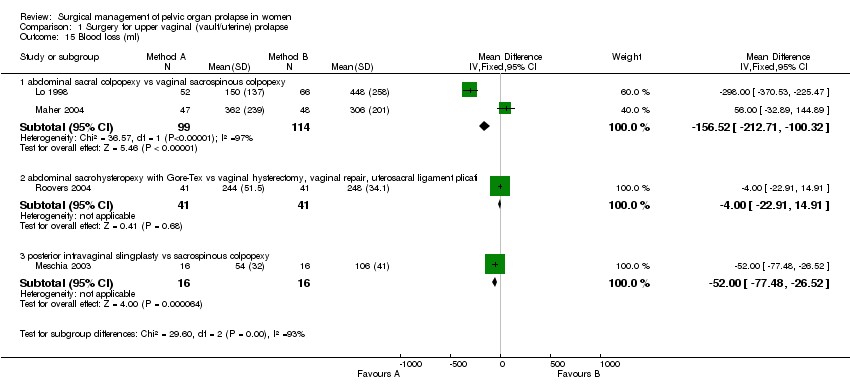
| 11 Blood loss (ml) Show forest plot | 1 | | Mean Difference (IV, Fixed, 95% CI) | Totals not selected |
|
| 11.8 prolapse repair + urethrovesical endopelvic fascia repair vs prolapse repair + TVT | 1 | | Mean Difference (IV, Fixed, 95% CI) | 0.0 [0.0, 0.0] |
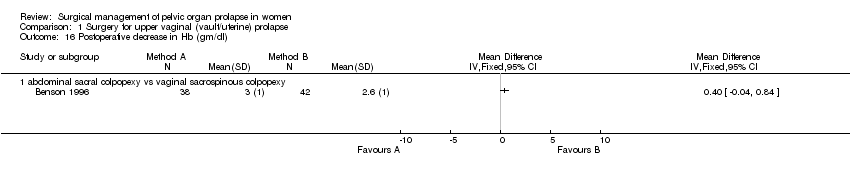
| 12 Haemoglobin change Show forest plot | 1 | | Mean Difference (IV, Fixed, 95% CI) | Totals not selected |
|
| 12.8 prolapse repair + urethrovesical endopelvic fascia repair vs prolapse repair + TVT | 1 | | Mean Difference (IV, Fixed, 95% CI) | 0.0 [0.0, 0.0] |
| 13 Time to return to spontaneous voiding (days) Show forest plot | 1 | | Mean Difference (IV, Fixed, 95% CI) | Totals not selected |
|
| 13.8 prolapse repair + urethrovesical endopelvic fascia repair vs prolapse repair + TVT | 1 | | Mean Difference (IV, Fixed, 95% CI) | 0.0 [0.0, 0.0] |
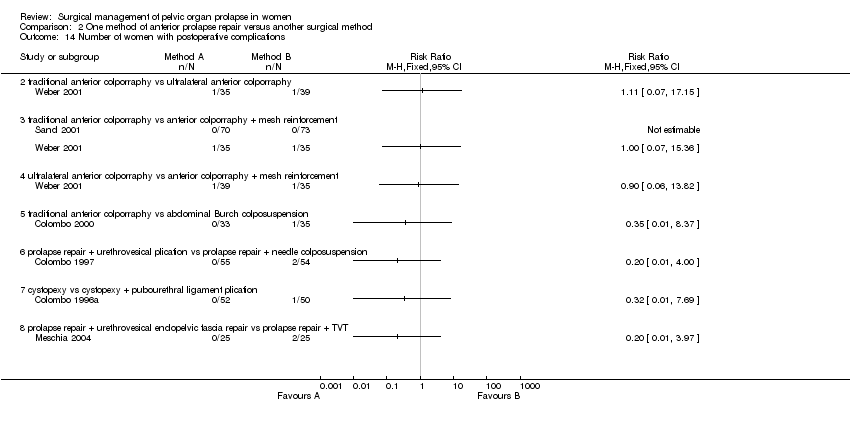
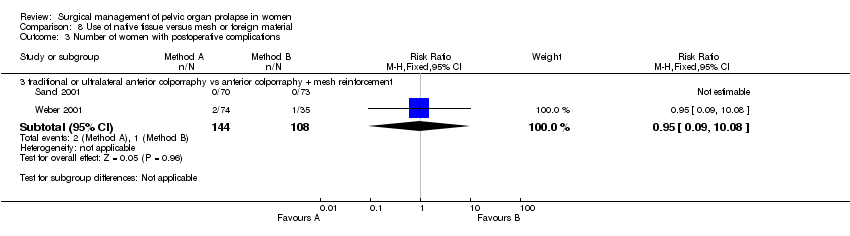
| 14 Number of women with postoperative complications Show forest plot | 6 | | Risk Ratio (M‐H, Fixed, 95% CI) | Totals not selected |
|
| 14.2 traditional anterior colporraphy vs ultralateral anterior colporraphy | 1 | | Risk Ratio (M‐H, Fixed, 95% CI) | 0.0 [0.0, 0.0] |
| 14.3 traditional anterior colporraphy vs anterior colporraphy + mesh reinforcement | 2 | | Risk Ratio (M‐H, Fixed, 95% CI) | 0.0 [0.0, 0.0] |
| 14.4 ultralateral anterior colporraphy vs anterior colporraphy + mesh reinforcement | 1 | | Risk Ratio (M‐H, Fixed, 95% CI) | 0.0 [0.0, 0.0] |
| 14.5 traditional anterior colporraphy vs abdominal Burch colposuspension | 1 | | Risk Ratio (M‐H, Fixed, 95% CI) | 0.0 [0.0, 0.0] |
| 14.6 prolapse repair + urethrovesical plication vs prolapse repair + needle colposuspension | 1 | | Risk Ratio (M‐H, Fixed, 95% CI) | 0.0 [0.0, 0.0] |
| 14.7 cystopexy vs cystopexy + pubourethral ligament plication | 1 | | Risk Ratio (M‐H, Fixed, 95% CI) | 0.0 [0.0, 0.0] |
| 14.8 prolapse repair + urethrovesical endopelvic fascia repair vs prolapse repair + TVT | 1 | | Risk Ratio (M‐H, Fixed, 95% CI) | 0.0 [0.0, 0.0] |
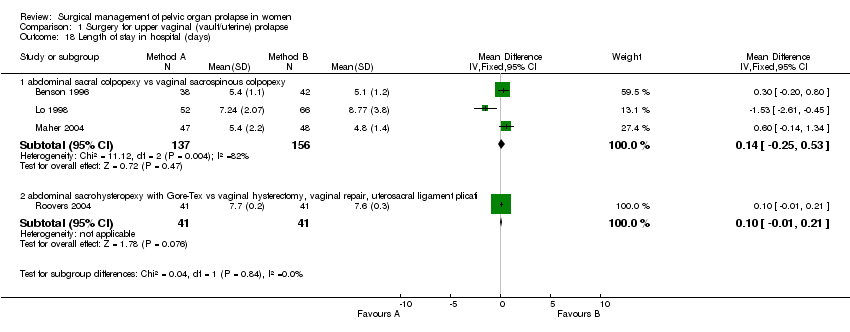
| 15 Length of stay in hospital (days) Show forest plot | 3 | | Mean Difference (IV, Fixed, 95% CI) | Totals not selected |
|
| 15.3 prolapse repair + urethrovesical plication vs prolapse repair + needle colposuspension | 1 | | Mean Difference (IV, Fixed, 95% CI) | 0.0 [0.0, 0.0] |
| 15.4 cystopexy vs cystopexy + pubourethral ligament plication | 1 | | Mean Difference (IV, Fixed, 95% CI) | 0.0 [0.0, 0.0] |
| 15.8 prolapse repair + urethrovesical endopelvic fascia repair vs prolapse repair + TVT | 1 | | Mean Difference (IV, Fixed, 95% CI) | 0.0 [0.0, 0.0] |
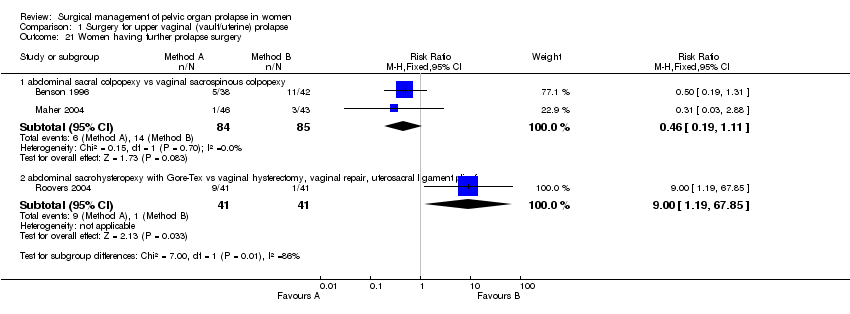
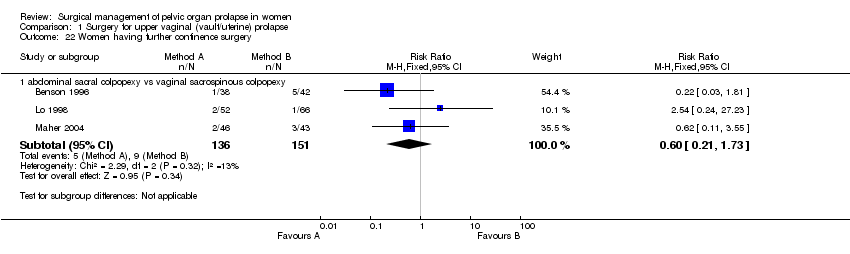
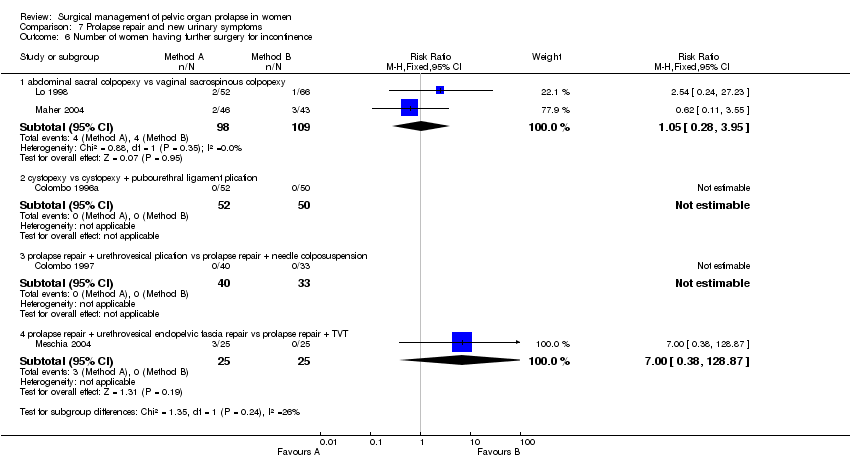
| 18 Number of women having further prolapse surgery Show forest plot | 4 | | Risk Ratio (M‐H, Fixed, 95% CI) | Subtotals only |
|
| 18.3 traditional anterior colporraphy vs abdominal Burch colposuspension | 1 | 68 | Risk Ratio (M‐H, Fixed, 95% CI) | 0.0 [0.0, 0.0] |
| 18.4 prolapse repair + urethrovesical plication vs prolapse repair + needle colposuspension | 2 | 138 | Risk Ratio (M‐H, Fixed, 95% CI) | 0.41 [0.06, 2.71] |
| 18.5 cystopexy vs cystopexy + pubourethral ligament plication | 1 | 102 | Risk Ratio (M‐H, Fixed, 95% CI) | 0.0 [0.0, 0.0] |
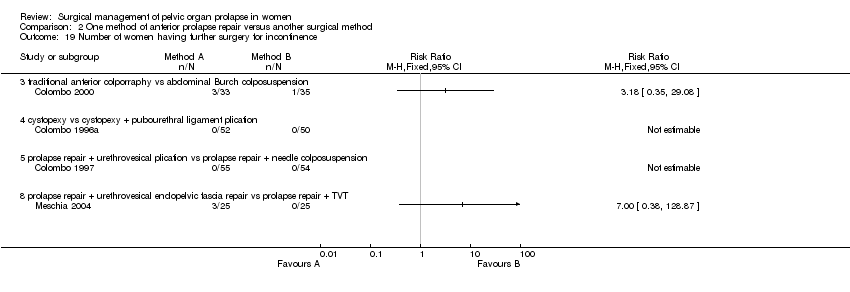
| 19 Number of women having further surgery for incontinence Show forest plot | 4 | | Risk Ratio (M‐H, Fixed, 95% CI) | Totals not selected |
|
| 19.3 traditional anterior colporraphy vs abdominal Burch colposuspension | 1 | | Risk Ratio (M‐H, Fixed, 95% CI) | 0.0 [0.0, 0.0] |
| 19.4 cystopexy vs cystopexy + pubourethral ligament plication | 1 | | Risk Ratio (M‐H, Fixed, 95% CI) | 0.0 [0.0, 0.0] |
| 19.5 prolapse repair + urethrovesical plication vs prolapse repair + needle colposuspension | 1 | | Risk Ratio (M‐H, Fixed, 95% CI) | 0.0 [0.0, 0.0] |
| 19.8 prolapse repair + urethrovesical endopelvic fascia repair vs prolapse repair + TVT | 1 | | Risk Ratio (M‐H, Fixed, 95% CI) | 0.0 [0.0, 0.0] |
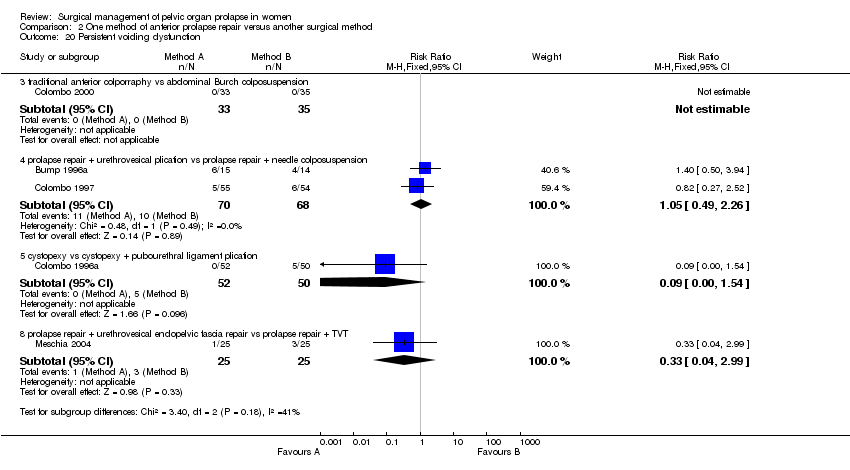
| 20 Persistent voiding dysfunction Show forest plot | 5 | | Risk Ratio (M‐H, Fixed, 95% CI) | Subtotals only |
|
| 20.3 traditional anterior colporraphy vs abdominal Burch colposuspension | 1 | 68 | Risk Ratio (M‐H, Fixed, 95% CI) | 0.0 [0.0, 0.0] |
| 20.4 prolapse repair + urethrovesical plication vs prolapse repair + needle colposuspension | 2 | 138 | Risk Ratio (M‐H, Fixed, 95% CI) | 1.05 [0.49, 2.26] |
| 20.5 cystopexy vs cystopexy + pubourethral ligament plication | 1 | 102 | Risk Ratio (M‐H, Fixed, 95% CI) | 0.09 [0.00, 1.54] |
| 20.8 prolapse repair + urethrovesical endopelvic fascia repair vs prolapse repair + TVT | 1 | 50 | Risk Ratio (M‐H, Fixed, 95% CI) | 0.33 [0.04, 2.99] |
| 21 Number of women with worse bowel function Show forest plot | 1 | | Risk Ratio (M‐H, Fixed, 95% CI) | Totals not selected |
|
| 21.1 prolapse repair + urethrovesical plication vs prolapse repair + needle colposuspension | 1 | | Risk Ratio (M‐H, Fixed, 95% CI) | 0.0 [0.0, 0.0] |
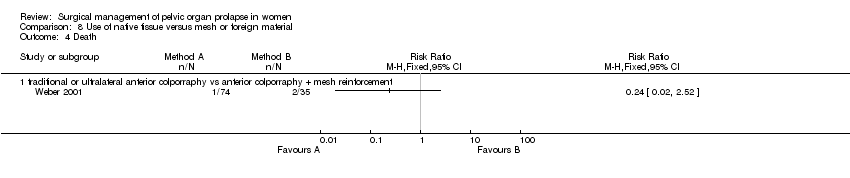
| 23 Death Show forest plot | 1 | | Risk Ratio (M‐H, Fixed, 95% CI) | Totals not selected |
|
| 23.1 traditional anterior colporraphy vs ultralateral anterior colporraphy | 1 | | Risk Ratio (M‐H, Fixed, 95% CI) | 0.0 [0.0, 0.0] |
| 23.2 traditional anterior colporraphy vs anterior colporraphy + mesh reinforcement | 1 | | Risk Ratio (M‐H, Fixed, 95% CI) | 0.0 [0.0, 0.0] |
| 23.3 ultralateral anterior colporraphy vs anterior colporraphy + mesh reinforcement | 1 | | Risk Ratio (M‐H, Fixed, 95% CI) | 0.0 [0.0, 0.0] |