Surgical management of pelvic organ prolapse in women
Abstract
Background
Pelvic organ prolapse may occur in up to 50% of parous women. A variety of urinary, bowel and sexual symptoms may be associated with prolapse.
Objectives
To determine the effects of surgery in the management of pelvic organ prolapse.
Search methods
We searched the Cochrane Incontinence Group trials register (8 June 2004) and reference lists of relevant articles. We also contacted researchers in the field.
Selection criteria
Randomised or quasi‐randomised controlled trials that included surgical operations for pelvic organ prolapse.
Data collection and analysis
Trials were assessed and data extracted independently by at least two reviewers. Four investigators were contacted for additional information with two responding.
Main results
Fourteen randomised controlled trials were identified evaluating 1004 women.
Abdominal sacral colpopexy was better than vaginal sacrospinous colpopexy in terms of a lower rate of recurrent vault prolapse (RR 0.23, 95% CI 0.07 to 0.77) and less dyspareunia (RR 0.39, 95% CI 0.18 to 0.86), but the trend towards a lower re‐operation rate for prolapse following abdominal sacrocolpopexy was not statistically significant (RR 0.46, 95% CI 0.19 to 1.11). However, the vaginal sacrospinous colpopexy was quicker and cheaper to perform and women had an earlier return to activities of daily living. The data were to evaluate other clinical outcomes and adverse events.
For the anterior vaginal wall prolapse, standard anterior repair was associated with more recurrent cystoceles than when supplemented by Vicryl mesh overlay (RR 1.39, 95% CI 1.02 to 1.90) but data on morbidity and other clinical outcomes were too few for reliable comparisons.
For posterior vaginal wall prolapse, the vaginal approach was associated with a lower rate of recurrent rectocele and/or enterocele than the transanal approach (RR 0.24, 95% CI 0.09 to 0.64), although there was a higher blood loss and postoperative narcotic use. However, data on the effect of surgery on bowel symptoms and the use of polyglactin mesh overlay on the risk of recurrent rectocele were insufficient for meta‐analysis.
Meta‐analysis on the impact of pelvic organ prolapse surgery on continence issues was limited and inconclusive, although about 10% of women developed new symptoms after surgery. However, more women with occult stress urinary incontinence developed postoperative stress urinary incontinence after endopelvic fascia plication alone than after endopelvic fascia plication and tension‐free vaginal tape (RR 5.5, 95% CI 1.36 to 22.32).
Authors' conclusions
Abdominal sacrocolpopexy is associated with a lower rate of recurrent vault prolapse and dyspareunia than the vaginal sacrospinous colpopexy. These benefits must be balanced against a longer operating time, longer time to return to activities of daily living and increased cost of the abdominal approach. The use of a polyglactin mesh overlay at the time of anterior vaginal wall repair may reduce the risk of recurrent cystocele. Posterior vaginal wall repair may be better than transanal repair in the management of rectoceles in terms of recurrence of prolapse. Adequately powered randomised controlled clinical trials are urgently needed.
PICO
Plain language summary
There was not enough evidence about the effects of different types of surgery for pelvic organ prolapse.
Pelvic organs, such as the uterus, bladder or bowel, may protrude into the vagina due to weakness in the tissues that normally support them. The symptoms that they cause vary, depending on the type of prolapse. The types of surgery also vary, depending on the type of prolapse and associated symptoms. The impact of pelvic organ prolapse surgery on bowel, bladder and sexual function can be unpredictable. The review of trials demonstrated that abdominal sacral colpopexy may be better than the vaginal sacrospinous colpopexy for uterine or vault prolapse. Limited evidence suggests that vaginal surgery may be better than transanal surgery for posterior vaginal wall prolapse. However, there was not enough evidence about most types of common prolapse surgery.
Authors' conclusions
Background
Pelvic organ prolapse is common and is seen in 50% of parous women (Beck 1991). The annual aggregated rate of associated surgery is in the range of 10 to 30 per 10,000 women (Brubaker 2002). Pelvic organ prolapse is the descent of one or more of the pelvic organs (uterus, vagina, bladder, bowel). The different types of prolapse include:
-
upper vaginal prolapse i.e. uterus, vaginal vault (after hysterectomy when the top of the vagina drops down);
-
anterior vaginal wall prolapse i.e. cystocele (bladder descends), urethrocele (urethra descends), paravaginal defect (pelvic fascia defect);
-
posterior vaginal wall prolapse i.e enterocele (bowel descends), rectocele (rectum descends), perineal deficiency.
A woman can present with prolapse of one or more of these sites.
The aetiology of pelvic organ prolapse is complex and multi‐factorial. Possible risk factors include pregnancy, childbirth, congenital or acquired connective tissue abnormalities, denervation or weakness of the pelvic floor, ageing, hysterectomy, menopause and factors associated with chronically raised intra‐abdominal pressure (Bump 1998; Gill 1998; MacLennan 2000).
Women with prolapse commonly have a variety of pelvic floor symptoms, only some of which are directly related to the prolapse. Generalised symptoms of prolapse include pelvic heaviness, bulge/lump or protrusion coming down from the vagina, dragging sensation in the vagina or backache. Symptoms of bladder, bowel or sexual dysfunction are frequently present. For example, women may need to reduce the prolapse to aid urinary voiding or defecation by using their fingers to push the prolapse up. These symptoms may be directly related to the prolapsed organ, e.g. poor urinary stream when a cystocele is present or obstructed defecation when a rectocele is present. They may also be independent of the prolapse, e.g. symptoms of overactive bladder when a cystocele is present.
Treatment of prolapse depends on the severity of the prolapse and its symptoms, and the woman's general health. Options available for treatment are conservative, mechanical or surgical.
Generally, conservative or mechanical treatments are considered for women with a mild degree of prolapse, for those who wish to have more children, the frail, or those unwilling to undergo surgery. Conservative and mechanical interventions have been considered in separate Cochrane reviews (Adams 2004; Hagen 2004). There was no evidence to guide management in either of these reviews as no randomised controlled trials of either type of intervention were found.
The aims of surgery in the management of pelvic organ prolapse include:
-
the restoration of normal vaginal anatomy;
-
the restoration or maintenance of normal bladder function;
-
the restoration or maintenance of normal bowel function;
-
the restoration or maintenance of normal sexual function.
A wide variety of abdominal and vaginal surgical techniques are available for the treatment of prolapse.
-
Vaginal approaches include vaginal hysterectomy, anterior or posterior vaginal wall repair, McCall culdoplasty, Manchester repair (amputation of the cervix with uterus suspension to the cardinal ligaments), prespinous and sacrospinous colpopexy, enterocele ligation, paravaginal repair, Le Fortes procedure and perineal reconstruction.
-
Abdominal approaches include sacral colpopexy, paravaginal repair, vault suspending and uterosacral ligament plication, enterocele ligation and posterior vaginal wall repair. Abdominal surgery can be performed through an open incision or with laparoscopy requiring small incisions.
A combination of some of these procedures may be employed in the surgical correction of prolapse.
In addition to the variety of prolapse operations, the surgeon must choose whether to use absorbable sutures such as polyglycolic acid based materials (eg polyglactin), delayed‐absorption sutures such as polydioxanone or non‐absorbable sutures such as polypropylene. Furthermore, some techniques require the routine use of grafts (e.g. sacral colpopexy, where different materials can be used to bridge the gap between the vaginal cuff and the hollow of the sacrum) whereas for others, grafts are optional. Graft material can be synthetic (e.g. mesh) or autologous (e.g. fascia).
The choice of operation depends on a number of factors which includes the nature, site and severity of the prolapse, whether there are additional symptoms affecting urinary, bowel or sexual function and the general health of the woman. To aid the assessment of the success of surgery, clear pre‐ and postoperative site specific vaginal grading and details of the operative intervention should be recorded.
The term de novo stress urinary incontinence is used to describe stress incontinence that develops following surgical correction of the prolapse amongst women who were continent prior to surgery. De novo stress urinary incontinence is clearly disappointing to women and will be one of the outcome measures considered in this review. Occult stress incontinence is the term used to describe stress urinary incontinence which is demonstrable only when the prolapse is reduced in otherwise continent women.
The wide variety of surgical treatments available for prolapse indicates the lack of consensus as to the optimal treatment. Guidelines using the available literature have been published but are based on studies of mixed type and quality (Carey 2001). Provided that sufficient numbers of trials of adequate quality have been conducted, the most reliable evidence is likely to come from the consideration of randomised controlled trials, and this is the basis for the review. The aim is to help identify optimal practice, and highlight where there is a need for further research.
Objectives
To determine the effects of surgery in the management of pelvic organ prolapse and associated bladder, bowel and sexual function.
The following specific hypotheses were tested, and trials that made other related comparisons were described:
A For the management of upper vaginal prolapse (uterine and vaginal vault)
1. Abdominal sacral colpopexy is better than vaginal sacrospinous colpopexy.
2. Vaginal hysterectomy is better than uterine preservation.
3. Vaginal hysterectomy with McCall culdoplasty is better than vaginal hysterectomy and sacrospinous colpopexy.
4. Vaginal McCall culdoplasty and uterosacral ligament plication is better than vaginal sacrospinous colpopexy and repair.
B For the management of anterior vaginal wall prolapse
5. Anterior vaginal wall repair is better than the abdominal paravaginal repair in the management of cystocele.
6. For midline cystocele defects, a traditional anterior vaginal wall repair is better than anterior vaginal wall repair with graft reinforcement.
C For the management of posterior vaginal wall prolapse.
7. Posterior vaginal wall repair is better than a transanal repair.
8. Posterior vaginal wall repair is better than an abdominal posterior repair.
9. Posterior vaginal wall repair is better than posterior vaginal wall repair with graft reinforcement.
D For the management of any type of prolapse
10. Surgical treatment is better than conservative treatment in the management of symptomatic pelvic organ prolapse.
11. Surgical treatment is better than mechanical devices in the management of pelvic organ prolapse.
12. Open abdominal surgery is better than the laparoscopic approach for the management of prolapse.
13. Potential stress urinary incontinence (e.g. detected on reduction of prolapse prior to surgery) is best treated with formal continence surgery at the time of prolapse surgery, rather than being left untreated.
14. Utilisation of mesh or synthetic grafts is better than native (autologous) tissue in the management of pelvic organ prolapse.
15. One type of suture is better than another type of suture.
Methods
Criteria for considering studies for this review
Types of studies
Randomised controlled trials (RCT) or quasi‐randomised controlled clinical trials (CCT) in which at least one arm is a surgical intervention for pelvic organ prolapse.
Types of participants
Adult women seeking treatment for symptomatic pelvic organ prolapse. Both primary and recurrent prolapse will be considered.
Pelvic organ prolapse includes:
-
upper vaginal prolapse (uterine or vaginal vault);
-
anterior vaginal wall prolapse (cystocele, urethrocele, paravaginal defect);
-
posterior vaginal wall prolapse (enterocele, rectocele, perineal deficiency).
Types of interventions
Trials including any type of abdominal or vaginal surgery for pelvic organ prolapse in at least one trial group. Comparison interventions may include no treatment, conservative management, a mechanical device or an alternative approach to surgery.
Types of outcome measures
Women's observations:
-
perceived improvement in prolapse symptoms;
-
acceptability of procedure/satisfaction with outcome.
Clinicians' observations:
Site‐specific grading of prolapse, for example:
-
Baden‐Walker (Baden 1972);
-
International Continence Society Pelvic Organ Prolapse Quantification System (POP‐Q) classification (Bump 1996b).
Quality of life:
-
prolapse‐specific quality of life questionnaire (e.g. Prolapse ‐ Quality of Life (P‐QOL), Sheffield Prolapse Symptoms Questionnaire);
-
generic quality of life or health status measures (e.g. Short‐Form 36, Ware 1992);
-
psychological outcome measures (e.g. Hospital Anxiety and Depression Scale (HADS), Zigmond 1983).
Measures of associated symptoms (objective or subjective):
-
bladder symptoms, including symptomatic and occult incontinence;
-
bowel symptoms;
-
sexual problems.
Surgical outcome measures:
-
operating time;
-
further pelvic floor repair;
-
further continence surgery.
Complications:
-
blood loss;
-
need for transfusion;
-
infection;
-
adverse effects (e.g. return to theatre, damage to surrounding viscera, mesh erosion);
-
other adverse effects.
Economic measures:
(For example, catheter days, inpatient days, days to return to activities of daily living)
-
use of resources;
-
costs of interventions or resources;
-
resource implications of effects of treatment;
-
formal economic evaluations.
Search methods for identification of studies
This review has drawn on the search strategy developed for the Incontinence Review Group. Relevant trials were identified from the Group's specialised register of controlled trials which is described, along with the group search strategy, under the Incontinence Group's details in The Cochrane Library. The register contains trials identified from MEDLINE, CINAHL, the Cochrane Central Register of Controlled Trials (CENTRAL) and hand searching of journals and conference proceedings. The Incontinence Group's trials register was searched using the Group's own keywording system, the search terms used were:
({design.cct*} OR {design.rct*})
AND
({topic.prolapse*})
AND
({intvent.surg*})
(All searches were of the keyword field of Reference Manager 9.5 N, ISI ResearchSoft).
Date of the most recent search of the register for this review: 8 June 2004.
The trials in the Incontinence Group's specialised register are also contained in the Cochrane Central Register of Controlled Trials (CENTRAL).
For this review extra specific searches were performed. These are detailed below.
We searched the reference lists of relevant articles and contacted researchers in the field.
No language or other limits were imposed on the searches.
Data collection and analysis
Titles and, if available, abstracts of all possibly eligible studies were assessed by two reviewers for their methodological quality (adequacy of concealment of randomisation process) and relevance to the review objectives. At least two reviewers assessed each trial independently using the Incontinence Group's assessment criteria. They agreed on whether or not to include the study according to the inclusion criteria for the review. Data extraction was undertaken independently by at least two reviewers and comparisons made to ensure accuracy. Discrepancies were resolved by discussion or by referral to a third party. Where trial data were not reported adequately, attempts were made to acquire the necessary information from the trialists.
Studies were excluded if they were not randomised or quasi‐randomised trials of surgery for women with pelvic organ prolapse. Excluded studies were listed with the reasons for their exclusion.
Included trial data were processed as described in the Cochrane Collaboration Reviewers' Handbook (Alderson 2004). Meta‐analyses were undertaken to synthesise trial data when appropriate. The method of meta‐analysis depended on the nature of the outcomes. For categorical outcomes we related the numbers reporting an outcome to the numbers at risk in each group to derive a relative risk (RR). For continuous variables we used means and standard deviations to derive a weighted mean difference (WMD). As a general rule, a fixed effects model was used for calculations of summary estimates and their 95% confidence intervals (CI).
Trials were only combined if the interventions were similar enough on clinical criteria. When important heterogeneity was then suspected from visual inspection of the results, the chi‐squared test for heterogeneity (at 10%) or the I‐squared statistic (Higgins 2003), this was investigated by looking for further differences between the trials. When concern about heterogeneity persisted, a random effects model could be used.
Results
Description of studies
Twenty one potentially eligible studies were screened. Seven studies were excluded from the review: full details are given in the Characteristics of Excluded Studies. Fourteen randomised controlled trials were identified on the surgical management of pelvic organ prolapse. These were conducted in seven countries (five from Italy, four from the United States of America, and one each from Australia, Netherlands, Great Britain, Taiwan and Finland) evaluating 1004 women, all of whom received a surgical intervention. All but one trial (Meschia 2003) reported median follow up of greater than one year but only two trials reported outcomes at greater than five years (Colombo 1997; Colombo 2000).
Given the diverse nature of pelvic organ prolapse, to allow a meaningful analysis of the data, the review was divided into subgroups related to the site of the prolapse: upper vaginal; anterior vaginal wall; posterior vaginal wall; and to continence issues following prolapse surgery in continent women.
Upper vaginal prolapse (Hypotheses 1, 2, 3 and 4)
Five trials compared the management of upper vaginal prolapse (Benson 1996; Lo 1998; Maher 2004; Meschia 2003; Roovers 2004).
-
Abdominal sacral colpopexy versus vaginal sacrospinous colpopexy
Benson's trial reported data for 80 of 101 randomised women with uterovaginal or vault prolapse: the women with uterovaginal prolapse all underwent hysterectomy (Benson 1996). Lo's trial reported follow up of 118 of 138 continent women who had at least Stage 3 prolapse: some underwent anterior or posterior repairs or abdominal or vaginal hysterectomy in addition to repair of the prolapse actually being compared in the trial (Lo 1998). Maher's trial included 89 women with posthysterectomy vaginal vault prolapse (Maher 2004). In Benson and Maher's trials, the abdominal group underwent sacral colpopexy with colposuspension, paravaginal repair or a vaginally performed posterior vaginal wall repair as required. In the vaginal arm of Benson's trial, a bilateral vaginal sacrospinous colpopexy was performed as compared to a unilateral sacrospinous colpopexy in Maher's trial: in Lo's trial this was not specified but Nichols' method was referenced.
Women with stress urinary incontinence were treated with a needle suspension in the vaginal arm (n=20) of Benson's trial and a colposuspension in the abdominal arm (n=14), as compared to women with stress urinary incontinence or occult incontinence (n=14 and 15 in the abdominal and vaginal arms respectively) receiving an abdominal colposuspension in both arms of Maher's trial. In Maher's trial, 27 women had symptoms of overactive bladder at baseline (n=13 and 14 respectively). Simple costs were calculated by Benson and Maher incorporating length of stay and operating theatre cost. Formal cost effectiveness was not reported in either study. All three trials were considered to be similar enough to be combined in a meta‐analysis. However, there was significant variation in the outcome measures (Benson and Lo: incomplete site specific prolapse reporting; Maher and Lo: failure to report time to recurrent prolapse; Lo: optimal surgical cure of prolapse was considered to be Stage 2 prolapse or less). These factors contributed to heterogeneity and prevented complete meta‐analysis of all variables.
-
Abdominal sacrohysteropexy versus vaginal hysterectomy and repair
Roovers' trial evaluated only women with uterine prolapse who underwent sacrohysteropexy (with uterine preservation) in the abdominal group (n=41) and vaginal hysterectomy and vaginal repair with the vault being fixed to the uterosacral cardinal ligament complex in the vaginal group (n=41) (Roovers 2004). Roovers' trial is analysed as a separate subcategory in the analyses as the vaginal arm did not include a sacrospinous colpopexy and the abdominal group included uterine preservation.
-
Posterior intravaginal slingplasty versus vaginal sacrospinous colpopexy
Meschia compared two vaginal procedures: the infracoccygeal sacropexy (posterior intravaginal slingplasty, n=24) and the sacrospinous colpopexy (n=23) for uterine or vault prolapse (Meschia 2003). Again, it was analysed as a separate subcategory.
Anterior vaginal wall prolapse (Hypotheses 5 and 6)
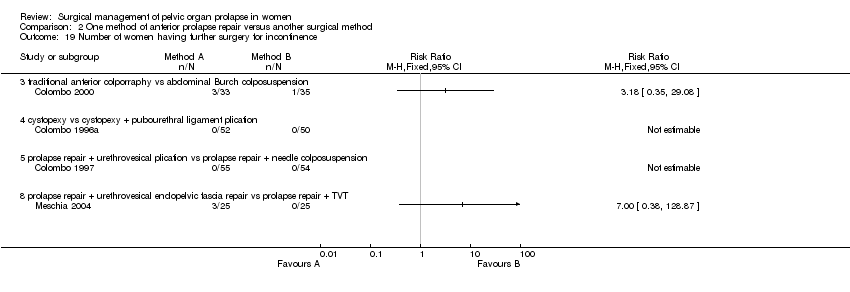
Seven trials included various surgical procedures for treating anterior vaginal wall prolapse, with or without stress urinary incontinence (Bump 1996a; Colombo 1996a; Colombo 1997; Colombo 2000; Meschia 2004; Sand 2001; Weber 2001). Due to clinical heterogeneity in stage of prolapse, types of operations and whether women with urinary incontinence or occult incontinence were included, only four of these could be combined for meta‐analysis (Sand 2001) with (Weber 2001); and (Bump 1996a) with (Colombo 1997).
-
Cystopexy without pubourethral ligament plication versus cystopexy with pubourethral ligament plication
Colombo enrolled only continent women with cystocele Stage 2 or more (Colombo 1996a). None of the women had preoperative detrusor overactivity. The trialists studied the prevention of de novo stress urinary incontinence after cystopexy with (n=50) or without (n=52) pubourethral ligament plication.
-
Cystopexy with posterior pubourethral ligament plication versus cystopexy with needle suspension
Columbo enrolled women with cystocele Stage 2 or more and either occult (n=73) or symptomatic (n=36) urinary incontinence (Colombo 1997). None of the women had preoperative detrusor overactivity. The trialists compared cystopexy with posterior pubourethral ligament plication (n=55) versus cystopexy plus Pereyra bladder neck suspension (n=54).
-
Anterior repair with urethrovesical plication versus anterior repair with needle colposuspension
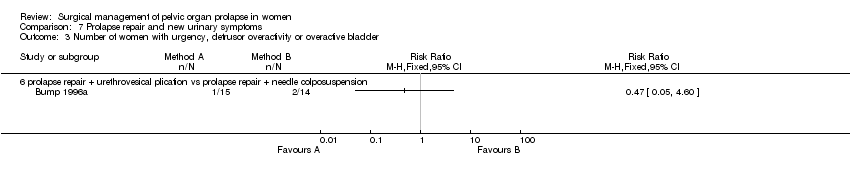
In Bump's trial, women were all continent but had bladder neck hypermobility in addition to Stage 3 or 4 prolapse. (pelvic organ prolapse quantification recommended by the International Continence Society (ICS)) (Bump 1996a). Six women had detrusor overactivity successfully treated before operation. All women had an anterior vaginal wall repair for anterior vaginal wall prolapse ICS Stage 3 or 4. The trialists compared the effects of needle colposuspension (n=14) with plication of the urethrovesical junction endopelvic fascia (n=15) on postoperative development of stress incontinence. They analysed 29 women; 10/15 in the fascia plication group and 10/14 in the needle colposuspension group had potential stress incontinence (defined as a mean pressure transmission ratio of less than 90% for the proximal three quarters of the urethra or a positive stress test during barrier testing). This trial was considered to be sufficiently similar to the previous one (Colombo 1997) to allow the data to be combined in meta‐analysis.
-
Anterior vaginal wall repair versus Burch colposuspension
In a third trial from Italy, women were studied who had primary Stage 2 or 3 cystocele and concomitant urodynamic urinary stress incontinence (Colombo 2000). None of the women had preoperative detrusor overactivity. The 68 women were randomised to receive either Burch colposuspension (n=35) or anterior vaginal wall repair (n=33).
Prolapse repair and urethrovesical endopelvic fascia plication versus prolapse repair and TVT
In a recently published fourth Italian trial, women with severe genital prolapse and occult stress urinary incontinence were enrolled (Meschia 2004). None of the women had preoperative detrusor overactivity. The women were randomised to receive either urethrovesical endopelvic fascia repair (n=25) or tension‐free vaginal tape (TVT) (n=25) in addition to vaginal hysterectomy and prolapse repair. Most also had a posterior repair (23/25 and 20/25 respectively).
Two other trials enrolled women with cystoceles with or without incontinence (Sand 2001; Weber 2001): one of the trials excluded women who needed a concomitant continence procedure such as colposuspension, sling or needle suspension (Weber 2001). Both trials compared traditional anterior vaginal wall repair with anterior vaginal wall repair supplemented by the use of absorbable mesh overlay (polyglactin) for cystocele. The trials were considered similar enough to combine in meta‐analysis. To enable meaningful comparison between the trials the standard and ultralateral anterior vaginal wall repair groups in Weber's trial (Weber 2001) were combined mimicking Sand's groups (Sand 2001) when comparing anterior vaginal wall repair with and without polyglactin mesh overlay.
-
Anterior vaginal wall repair versus anterior vaginal wall repair with mesh overlay
Sand randomly allocated women with cystocele to or beyond the introitus to anterior vaginal wall repair alone (n=70) or anterior vaginal wall repair and polyglactin mesh overlay (n=73) (Sand 2001). The surgery was for primary cystocele in 85% of cases. Concomitant surgery was performed as required including vaginal hysterectomy, vaginal sacrospinous colpopexy, posterior vaginal wall repair (n=67/70 and 65/73) and continence surgery. The women who underwent posterior vaginal wall repair and were assigned to the polyglactin mesh overlay for the cystocele also had their posterior vaginal wall repair augmented with polyglactin mesh.
-
Anterior vaginal wall repair versus anterior vaginal wall repair with mesh overlay versus ultralateral anterior vaginal wall repair
Weber evaluated the efficacy of standard anterior vaginal wall repair (n=33), ultralateral anterior vaginal wall repair (n=24) and standard anterior vaginal wall repair plus polyglactin mesh overlay (n=26) in women who underwent surgery for anterior vaginal wall prolapse (Weber 2001). Other concomitant prolapse surgery was performed as required.
Posterior vaginal wall prolapse (Hypotheses 7, 8 and 9)
Two trials (Kahn 1999; Nieminen 2004) compared the vaginal and transanal approach for the management of rectoceles. In addition, another trial provided data for women with rectoceles undergoing posterior repair with and without mesh (Sand 2001).
The trials involving transanal repair have been published as abstracts at ICS Annual Meetings, and the authors have provided additional data. Each trial had slightly different inclusion criteria. Kahn included women who had symptoms of prolapse or symptoms of impaired rectal evacuation with incomplete emptying on isotope defecography and normal compliance on anorectal manometry (Kahn 1999). Nieminen included women with symptomatic rectoceles not responding to conservative treatment (Nieminen 2004). Importantly, women with compromised anal sphincter function and other symptomatic genital prolapse were excluded. In both trials the vaginal repair was performed by gynaecologists and the transanal repair by colorectal surgeons. In Kahn's trial the posterior vaginal wall repair was performed using levator plication and in Nieminen's trial the rectovaginal fascia was plicated. The trials were considered to be similar enough to be combined in a meta‐analysis.
In the third trial, the women were included if they had a central cystocele with or without urinary incontinence, for which they required an anterior repair. The majority of the women were also having a posterior repair for rectocele (132/143, 92%) (Sand 2001). The women allocated to the mesh augmentation arm for their anterior repair also had their posterior repair augmented with mesh, and recurrence rates of rectocele were reported separately. However, no clinical outcomes relating to urinary, bowel or sexual function were reported.
Any type of prolapse (Hypotheses 10, 11, 12, 13, 14 and 15)
There were no trials which compared surgery with either mechanical devices or conservative treatment, nor open surgery with laparoscopy, nor did any trials address the choice of suture types.
Occult urinary incontinence (Hypothesis 13)
Occult urinary incontinence is diagnosed when women have no symptoms of stress urinary incontinence but do have demonstrable stress urinary incontinence when the prolapse is reduced. One trial included women with occult stress urinary incontinence and provided data separately for their urinary outcomes (Meschia 2004); four trials included only continent women or reported outcomes separately for a continent subsample (Colombo 1996a; Colombo 1997; Lo 1998; Maher 2004); and one other trial included both continent women and those with 'potential' incontinence (the term 'potential' was interpreted as 'occult') (Bump 1996a).
-
In one Italian trial, all the women were continent but a continence procedure was only performed in one arm (pubourethral ligament plication in addition to a standard colpopexy) (Colombo 1996a).
-
In a recent Italian trial, all the women were continent but demonstrated to have occult stress urinary incontinence on preoperative prolapse reduction (Meschia 2004).
-
Another included a mixed sample of women, with and without incontinence (Colombo 1997). However, data were presented separately, allowing assessment of prolapse surgery on urinary outcomes in the 73 continent women.
-
In Bump's trial, 29 women (10/15 in the fascia plication group and 10/14 in the needle colposuspension group) had urodynamically defined potential stress incontinence (defined as a mean pressure transmission ratio of less than 90% for the proximal three quarters of the urethra or a positive stress test during barrier testing) (Bump 1996a). However, all the women were symptomatically continent and both arms included a continence procedure. Data from this trial were aggregated with those from Colombo 1997.
-
Although Lo did not report the total number of women who developed new urinary incontinence after surgery, he did report how many women required surgery for incontinence (Lo 1998).
-
In one other trial, Maher performed additional Burch colposuspensions for all women with urodynamically proven or occult stress urinary incontinence in women randomly allocated to abdominal sacral colpopexy (14) or vaginal sacrospinous colpopexy (15) for vaginal vault prolapse (Maher 2004). Women undergoing concomitant colposuspension were stratified to ensure equal representation in the groups. Occult stress urinary incontinence was detected in 5/14 (11% of 46 in whole arm) of the abdominal group and 6/15 (13% of 43) of the vaginal group, but urinary outcomes were not available separately according to this baseline diagnosis. However, data were provided about the occurrence of new urinary incontinence in women previously continent (n=22 and 24 respectively) and new overactive bladder symptoms in women previously unaffected by urgency, detrusor overactivity or overactive bladder syndrome (n=33 and 29).
Use of mesh for prolapse surgery (Hypothesis 14)
Two trials included mesh for prolapse repair, as described above (Sand 2001; Weber 2001). The data from two similar arms in one trial (standard anterior vaginal wall repair and ultralateral anterior vaginal wall repair) were combined for the purpose of comparing with the arm including mesh (Weber 2001). In the other trial, data were available separately for women who also underwent a posterior vaginal wall repair (Sand 2001).
Full details of the included trials are given in the Characteristics of Included Studies Table.
Risk of bias in included studies
Sufficient detail was provided in seven trials to confirm that secure concealment of the randomisation process was used, e.g. allocation by remote person or computer (Benson 1996; Bump 1996a; Maher 2004; Meschia 2003; Meschia 2004; Roovers 2004; Weber 2001). Of the remainder, six stated that they used computer generated number lists but it was unclear whether the allocation was concealed before assignment. The last trial stated that a computer‐generated but open number list was used, and it was therefore classified as a quasi‐randomised trial (Colombo 2000).
Women and surgeons could not be blinded as to the procedure when different surgical routes were being compared (Benson 1996; Colombo 2000; Lo 1998; Maher 2004; Meschia 2003; Roovers 2004). Blinding of patients was not performed in any other trials. Outcome assessments were conducted by non‐surgeons in three trials (Benson 1996; Roovers 2004; Weber 2001). Only the Roovers trial data were reported according to the CONSORT guidelines. In four trials, data were analysed on an intention to treat basis (Lo 1998; Maher 2004; Roovers 2004; Weber 2001).
Loss to follow up was a variable problem ranging from zero (Colombo 1997; Kahn 1999; Meschia 2003; Meschia 2004) to 24% (26/109) (Weber 2001). Weber also reported a statistically significant higher loss to follow up in one arm of the trial (ultralateral anterior vaginal wall repair).
Baseline demographics were reported in all trials and were equally distributed except in one trial (Sand 2001) which reported that previous hysterectomy was more common in the mesh overlay group and a second trial (Kahn 1999) which reported a difference in menopausal status and previous hysterectomies between the groups. Preoperative prolapse status was reported in all trials but equal distribution and severity of prolapse between groups was not specifically reported in four trials (Benson 1996; Bump 1996a; Meschia 2004; Sand 2001). One trial included 7% of women with stage 1 anterior vaginal wall prolapse preoperatively (at time of inclusion) which would also have been classified as a postoperative success (Weber 2001). Length of follow up was less than one year in one trial (Meschia 2003) and greater than five years in another trial (Colombo 1996a), with all other trialists reporting results between one to five years.
Effects of interventions
A. Upper vaginal prolapse (uterine and vaginal vault) (Comparison 01)
Five trials provided data regarding the outcome of prolapse surgery for upper vaginal prolapse (Benson 1996; Lo 1998; Maher 2004; Meschia 2003; Roovers 2004).
Hypothesis 1: abdominal sacral colpopexy is better than vaginal sacrospinous colpopexy:
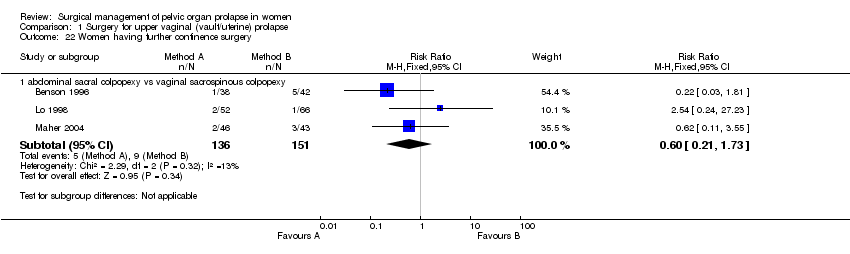
Three trials were considered to be similar enough to allow combination of data for comparison of abdominal sacral colpopexy and vaginal sacrospinous colpopexy (Benson 1996; Lo 1998; Maher 2004). Abdominal sacral colpopexy was better than vaginal colpopexy in terms of:
-
a lower rate of recurrent vault prolapse (3/84 versus 13/85; RR 0.23, 95% CI 0.07 to 0.77, Comparison 01.03.01) (Benson 1996; Maher 2004);
-
the number of women failing to improve to Stage 2 or better (3/52 versus 13/66; RR 0.29, 95% CI 0.09 to 0.97, Comparison 01.02.02) (Lo 1998);
-
less postoperative dyspareunia (7/45 versus 22/61; RR 0.39, 95% CI 0.18 to 0.86, Comparison 01.13.01) (Benson 1996; Lo 1998; Maher 2004);
-
less postoperative stress urinary incontinence (14/47 versus 28/81, RR 0.55, 95%CI 0.32 to 0.95, Comparison 01.05.01) (Benson 1996; Maher 2004). However, caution should be exercised when evaluating these data due to significant variation in the methodology of the two papers as described above. There was no statistically significant difference in reoperation rates for stress urinary incontinence (RR 0.6, 95% CI 0.21 to 1.73, Comparison 01.22.01) (Benson 1996; Lo 1998; Maher 2004);
-
The lower reoperation rate for prolapse after abdominal surgery did not reach statistical significance (6/84 versus 14/85, RR 1.46, 95% CI 0.19 to 1.11, Comparison 01.21.01) (Benson 1996; Maher 2004).
The results for intraoperative blood loss were inconsistent in two studies with a mean difference of 298 ml less blood loss in the abdominal group in Lo's study (Lo 1998) and 33 ml more blood loss in Maher's trial (Maher 2004) (Comparison 01.15.01). Benson did not report blood loss but the postoperative change in haemoglobin was not statistically different (Benson 1996).
Women treated abdominally took significantly longer to present with recurrent prolapse (WMD for months to recurrence ‐10.90, 95% CI ‐17.12 to ‐4.68, Comparison 01.24.01) in one trial (Benson 1996). On the other hand, the sacral (abdominal) colpopexy was associated with a longer operating time (WMD 21 minutes, 95% CI 12 to 30, Comparison 01.17.01) (Benson 1996; Lo 1998; Maher 2004), longer time to recover (WMD 8.3 days, 95% CI 3.9 to 12.7, Comparison 01.19.01) (Maher 2004) and was more expensive (WMD US$1334, 95% CI 1027 to 1641, Comparison 01.20.01) (Benson 1996; Maher 2004) than the vaginal approach.
There was no statistically significant difference in subjective outcome between the two approaches (subjective failure after abdominal surgery: 9/84 versus 18/85, RR 0.53, 95% CI 0.25 to 1.09, Comparison 01.01.01) (Benson 1996, Maher 2004). On the limited evidence available, patient's satisfaction (RR 0.82, 95% CI 0.32 to 2.06, Comparison 01.04.01) (Maher 2004) and objective failure at any site (any pelvic organ prolapse: RR 0.77, 95% CI 0.39 to 1.53, Comparison 01.02.01) (Maher 2004) were not different in both groups. Although data were available for bowel outcomes (Comparisons 01.10 and 01.11) and adverse events (Comparison 01.25), they were too few to provide sufficiently precise estimates to identify or rule out clinically important differences.
Hypothesis 2: vaginal hysterectomy is better than uterine preservation:
In the fourth trial, Roovers compared abdominal sacral hysteropexy against vaginal hysterectomy and repair with vault fixation to the uterosacral‐cardinal ligament complex (Roovers 2004). Although more women had subjective prolapse symptoms at one year after abdominal surgery (RR 3.2, 95% CI 1.29 to 7.92, Comparison 01.01.02), this did not reach statistical significance on the prolapse domain of the urinary distress inventory (UDI) (mean difference 4.1, 95% CI ‐5.4 to 13.6); nor was the score for urinary incontinence significantly different (mean difference 6, 95% CI ‐2 to 14). However, at one year after surgery the vaginal group scored significantly better (lower) scores on the discomfort /pain domain (7.1, 95% CI 1.1 to 13.2), overactive bladder domain (8.7, 95% CI 0.5 to 16.9) and the obstructive micturition domain (10.3, 95% CI 0.6 to 20.1) as compared to the abdominal group. More women in the abdominal group required repeat prolapse repair (RR 9.00, 95% CI 1.19 to 67.85, Comparison 01.21.02): in the abdominal group, five women (13%) had a reoperation for recurrent cystocele and four women (10.5%) for recurrent uterine prolapse, whereas in the vaginal group only one patient required surgery in the first year for vaginal vault prolapse. The operating time was less for the abdominal group (WMD ‐10 minutes, 95% CI ‐12 to ‐8, Comparison 01.17.02), possibly reflecting the less invasive nature of the abdominal procedure in this trial (the uterus was preserved in the abdominal group as opposed to removed in the vaginal group).
Hypothesis 3: vaginal hysterectomy with McCall culdoplasty is better than vaginal hysterectomy and sacrospinous colpopexy:
No trials identified.
Hypothesis 4: vaginal McCall culdoplasty and uterosacral ligament plication is better than vaginal sacrospinous colpopexy and repair:
No trials identified.
Other comparisons for upper vaginal prolapse:
In the fifth trial (Meschia 2003) there were too few data to demonstrate a difference between posterior intravaginal slingplasty and vaginal sacrospinous colpopexy in the objective prolapse rate at median follow up of 11 months. Cuff (vault) prolapse recurred once in each group. The RR for recurrence or persistence of any type of prolapse was 0.80, 95% CI 0.26 to 2.45, Comparison 01.02.03 (Meschia 2003). However, the operating time was shorter (WMD ‐14 minutes, 95% CI ‐25 to ‐3, Comparison 01.17.03) and blood loss less (‐52 ml, 95% CI ‐77 to ‐27, Comparison 01.15.03) with the former approach. One woman in the vaginal sacrospinous colpopexy group had dyspareunia at six months, and one in the intravaginal slingplasty group had faecal incontinence.
B. Anterior vaginal wall prolapse (cystocele, urethrocele, paravaginal defect) (Comparison 02)
Seven trials included a variety of surgical procedures to treat anterior vaginal wall prolapse, with or without stress or occult stress urinary incontinence. (Bump 1996a; Colombo 1996a; Colombo 1997; Colombo 2000; Meschia 2004; Sand 2001; Weber 2001). Combination of data was possible for two sets of trials: two were comparable in terms of type of population (women with prolapse only) and types of operation (anterior repair with and without mesh) (Sand 2001; Weber 2001); and the other two in terms of types of operation (endopelvic fascia plication versus needle suspension) (Bump 1996a; Colombo 1997). The trials were all small and the data reported for outcomes were therefore mostly inconclusive.
Hypothesis 5: anterior vaginal wall repair is better than the abdominal paravaginal repair in the management of cystocele:
No trials identified.
Hypothesis 6: for midline cystocele defects, a traditional anterior vaginal wall repair is better than anterior vaginal wall repair with mesh reinforcement:
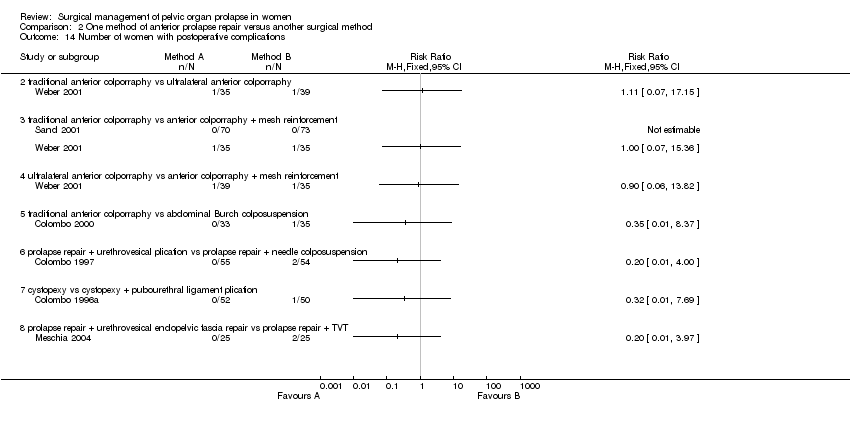
Data from two small trials suggested that traditional anterior repair may be followed by higher objective failure rates than after polyglactin mesh reinforcement of anterior repair (RR 1.48, 95% CI 1.07 to 2.04, Comparison 02.03.03) (Sand 2001; Weber 2001), but data on reoperation rates were not given and complication rates were similar. Weber did not find significant differences in cure rates for cystocele between the standard cystocele repair (30%), ultralateral repair (46%) and standard plus polyglactin mesh overlay (42%) at mean follow up of 24 months, but the trial was only powered to detect a 30% difference between the groups (Weber 2001).
Other comparisons for anterior vaginal wall prolapse:
Five other trials were identified which compared different operations for anterior vaginal wall prolapse or different continence procedures for women with urinary incontinence or occult urinary incontinence as well as anterior vaginal wall prolapse (Bump 1996a; Colombo 1996a; Colombo 1997; Colombo 2000; Meschia 2004).
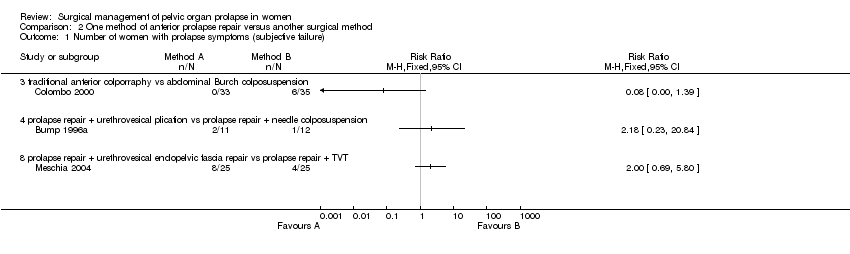
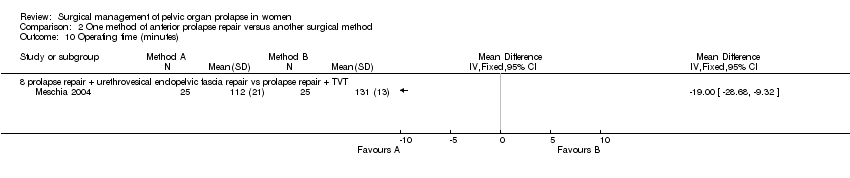
One single trial comparing anterior repair with Burch colposuspension showed statistically significant lower rates of cystocele recurrence (RR 0.09, 95% CI 0.01 to 0.64, Comparison 02.03.05) (Colombo 2000), but higher rates of persisting urinary incontinence (RR 3.39, 95% CI 1.40 to 8.22, Comparison 02.06.03) (Colombo 2000). However, this was not reflected in differences in reoperation rates for either prolapse or incontinence (Comparisons 02.18.03 and 02.19.03) (Colombo 2000). Another small trial reported that more women were incontinent after endopelvic fascia plication than after TVT supplementing prolapse surgery (RR 9, 95% CI 1.23 to 65.85, Comparison 02.07.08) (Meschia 2004) but the data were too few to comment on the effect on prolapse or other clinical outcomes. However, there was a shorter operating time for the former operation (WMD ‐19 minutes, 95% CI ‐29 to ‐9, Comparison 02.10.08) (Meschia 2004).
C. Posterior vaginal wall prolapse (rectocele) (Comparison 03)
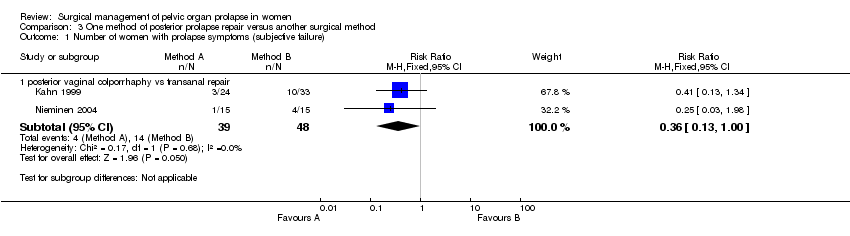
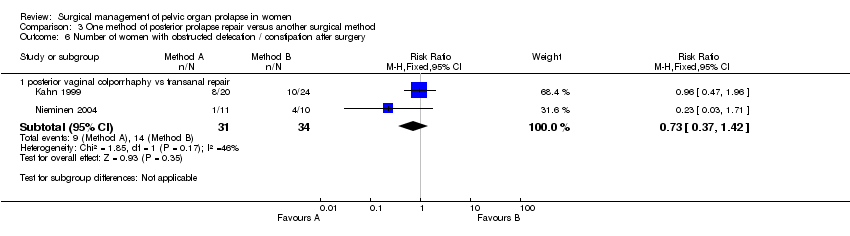
Two small trials compared vaginal and transanal approaches to the management of rectoceles (Kahn 1999; Nieminen 2004), and a third examined posterior repair with and without mesh reinforcement (Sand 2001).
Hypothesis 7: posterior vaginal vaginal wall repair is better than a transanal repair:
Many of the important outcome parameters were recorded in only one trial thus limiting the data available and the ability to perform meta‐analyses. The results for posterior vaginal wall repair were better than for transanal repair in terms of subjective (RR 0.36, 95% CI 0.13 to 1, Comparison 03.01.01) and objective (RR 0.24, 95% CI 0.09 to 0.64, Comparison 03.02.03) failure rates (persistence of rectocele and/or enterocele) (Kahn 1999; Nieminen 2004). Analysing rectocele alone showed that recurrent rectocele occurred in 2/39 in the vaginal group and 7/48 following the transanal repair, a difference that did not reach statistical significance (RR 0.32, 95% CI 0.07 to 1.34, Comparison 03.02.01). Postoperative enterocele was, however, significantly less common following the vaginal surgery as compared to the transanal group (RR 0.23, 95% CI 0.07 to 0.83, Comparison 03.02.02).
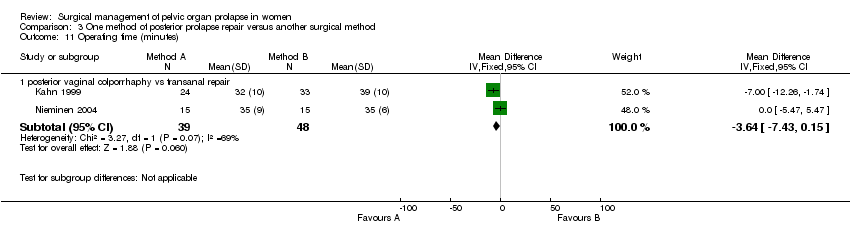
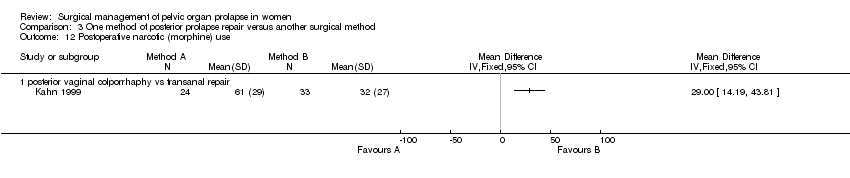
Postoperative hospital stay was longer after vaginal surgery than after transanal surgery in one trial (mean difference (MD) 1 day, 95% CI 0.5 to 1.5, Comparison 03.15.01) despite a shorter operating time (MD ‐7 minutes, 95% CI ‐12 to ‐2) (Kahn 1999). The operating times in the other trial (Nieminen 2004) were the same for both groups (35 minutes). When data for operating time were combined (WMD ‐3.6 minutes, 95% CI ‐7.4 to 0.2, Comparison 03.11.01), there was significant heterogeneity (P = 0.07, I‐squared = 69%). The vaginal approach was associated with a significantly higher blood loss (79 ml, 95% CI 40 to 119, Comparison 03.09.01) (Kahn 1999; Nieminen 2004) and postoperative narcotic use (Comparison 03.12.01, (Kahn 1999) only) as compared to the transanal approach.
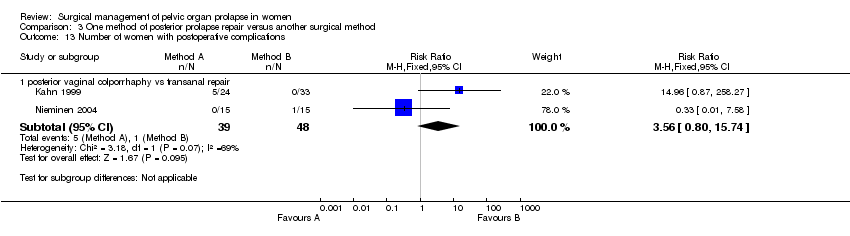
Nieminen reported that the mean depth of rectocele on postoperative defecography was 4.13 cm in the transanal group and this was significantly larger than the 2.73 cm in the vaginal group (WMD ‐1.43, 95% CI ‐2.86 to 0, P=0.05, data not shown). Postoperative difficulties in bowel evacuation were seen in 9/31 in the vaginal group as compared to 14/34 in the transanal group, a difference that was not significantly different (RR 0.73, 95% CI 0.37 to 1.42, Comparison 03.06.01). No significant differences were seen in the rate of incontinence to flatus or faeces postoperatively between the groups, nor in rates of postoperative dyspareunia but the trials were too small for these data to be reliable. There were differences between the trials for the outcome postoperative complications: in one trial, four women had a haematoma and one needed a blood transfusion in the vaginal arm (Kahn 1999) whereas in the other, one woman had a wound infection after transanal operation (Nieminen 2004) (Comparison 03.13.01).
Hypothesis 8: posterior vaginal wall repair is better than an abdominal posterior repair:
No trials identified.
Hypothesis 9: posterior vaginal wall repair is better than posterior vaginal wall repair with mesh reinforcement:
One trial compared posterior repair with and without mesh reinforcement (Sand 2001). Rectocele recurrence appeared equally common with and without polyglactin mesh augmentation (7/67 versus 6/65), but the confidence intervals were wide (RR 1.13, 95% CI 0.40 to 3.19, Comparison 03.02.04) (Sand 2001). No trial reported mesh erosion.
D. Any type of prolapse (Comparisons 04, 05, 06, 07, 08)
Hypothesis 10: surgical treatment is better than conservative treatment in the management of pelvic organ prolapse (Comparison 04):
No trials addressed this comparison.
Hypothesis 11: surgical treatment is better than mechanical devices in the management of pelvic organ prolapse (Comparison 05):
No trials addressed this comparison.
Hypothesis 12: open abdominal surgery is better than the laparoscopic approach for the management of prolapse (Comparison 06):
No trials addressed this comparison.
Hypothesis 13: potential stress urinary incontinence detected on reduction of prolapse prior to surgery is best treated with formal continence surgery at the time of prolapse surgery, rather than being left untreated (Comparison 07):
The effects of surgical management of pelvic organ prolapse on urinary symptoms were addressed in six trials which included data for women without urinary symptoms at baseline (Bump 1996a; Colombo 1996a; Colombo 1997; Lo 1998; Maher 2004; Meschia 2004).
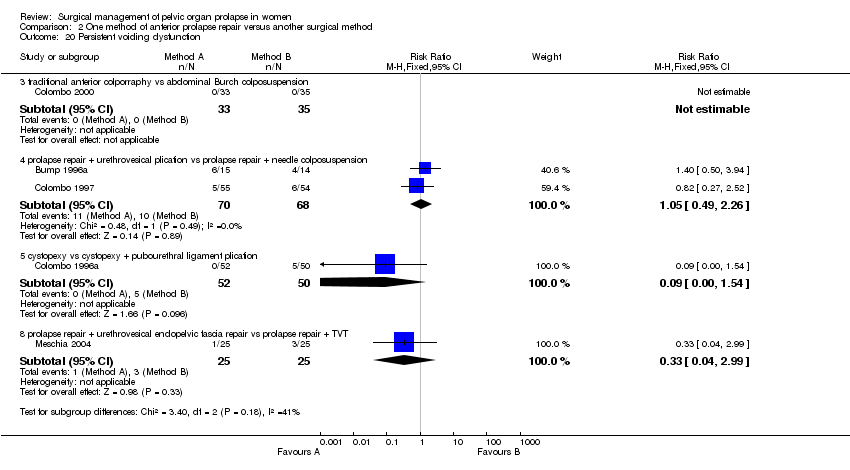
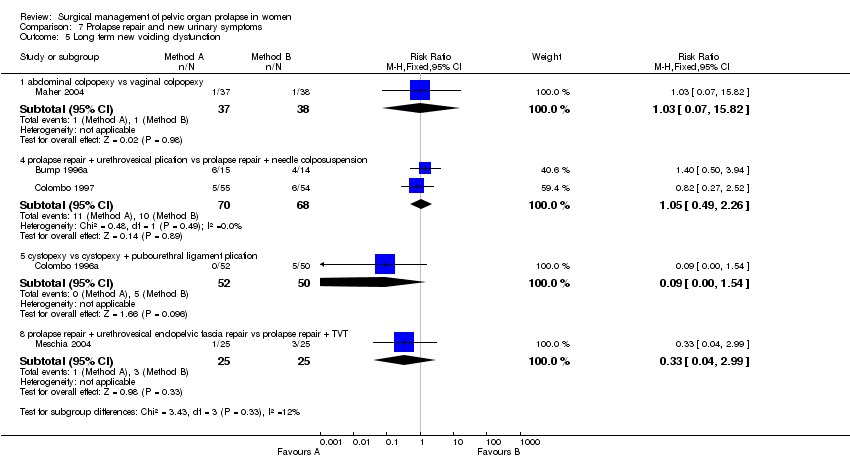
The trials involved several different operations and different populations. Each single trial was too small to demonstrate differences in new urinary symptom outcomes between the two arms, in terms of new stress urinary incontinence, persistent or new urgency, detrusor activity or overactive bladder, or in postoperative voiding dysfunction. However, one trial showed a higher rate of new stress urinary incontinence after pubourethral ligament plication than after Pereyra needle suspension, although in only one outcome, objectively demonstrated stress urinary incontinence (RR 2.06, 95% CI 1.05 to 4.06, Comparison 07.02.02) (Colombo 1997).
Another small trial included continent women with occult stress urinary incontinence. More women were incontinent after endopelvic fascia plication rather than when TVT was used as a continence procedure to supplement prolapse surgery, in respect of both subjective stress urinary incontinence (36% versus 4%, RR 9, 95% CI 1.23 to 65.85, Comparison 07.01.08) and objective stress urinary incontinence (44% versus 8%, RR 5.5, 95% CI 1.36 to 22.32, Comparison 07.02.08) (Meschia 2004). However, the data were too few to demonstrate an effect on the need for subsequent continence surgery (Comparison 07.06).
Since all the women in Comparison 07 were continent before prolapse surgery, it was possible to provide estimates of the effects on subsequent urinary function. Overall, 37/300 (12%) of women reported new subjective stress urinary incontinence (Comparison 07.01), and 26/323 (8%) new symptoms of overactive bladder (Comparison 07.04). Long‐term voiding dysfunction (difficulty emptying the bladder) was reported by 32/365 (9%) of women (Comparison 07.05).
Hypothesis 14: utilisation of mesh or synthetic grafts is better than native (autologous) tissue in the management of pelvic organ prolapse (Comparison 08):
Two trials evaluated the effects of using mesh to augment prolapse repairs (Sand 2001; Weber 2001). The data were aggregated in meta‐analysis, and two non‐mesh arms from one trial (traditional anterior vaginal wall repair and ultralateral anterior vaginal wall repair) were also aggregated for comparison with the mesh arm in one of the trials (Weber 2001).
Standard anterior repair was associated with a significantly higher recurrence rate of cystocele compared with augmentation with polyglactin mesh overlay (RR 1.39, 95% CI 1.02 to 1.90, Comparison 08.01.01) (Sand 2001; Weber 2001). One vaginal polyglactin mesh erosion was reported in total from both trials (Weber 2001).
Rectocele recurrence appeared equally common with and without polyglactin mesh augmentation in the other trial, but the confidence intervals were wide (RR 1.13, 95% CI 0.40 to 3.19, Comparison 08.02.01) (Sand 2001).
Hypothesis 15: one type of suture is better than another type of suture:
No trials addressed this comparison.
Discussion
This is one of three reviews of interventions for pelvic organ prolapse and it should be viewed in that context (Adams 2004; Hagen 2004). In the other two reviews, no randomised trials evaluating either conservative, physical or lifestyle interventions (Hagen 2004) or mechanical devices or pessaries (Adams 2004) were identified.
Amongst the 14 trials that addressed surgical management of pelvic organ prolapse, the quality of the trials was variable. Seven trials used adequate concealment of randomisation but of the remainder only one was definitely a quasi‐randomised trial (it was unclear for the other six).
All trials reported an objective evaluation of the specific pelvic floor defect that was repaired, but only five trials reported full site specific outcomes (Colombo 1996a; Colombo 1997; Colombo 2000; Maher 2004; Weber 2001). All but one trial reported median follow up of greater than one year but only two trials reported outcomes at greater than five years.
Generally, the impact of surgery on associated pelvic floor symptoms including bladder, bowel and sexual function, quality of life, cost and patient satisfaction were poorly reported. Validated pelvic floor questionnaires were reported in two trials (Maher 2004; Roovers 2004), cost issues also by two trialists (Benson 1996; Maher 2004) and impact of surgery on quality of life and patient satisfaction in one trial (Maher 2004). These deficiencies generally reflect the difficulties associated with prolapse surgery. One of the principal aims of prolapse surgery is to correct the vaginal protrusion and any associated pelvic floor dysfunction, but the anatomical correction itself is likely to impact upon bladder, bowel and sexual function in unpredictable ways. Until recently, neither standardised history, validated pelvic organ prolapse or specific quality of life questionnaires or other outcome assessment tools were available.
It was also disappointing that no trials were found which evaluated conservative, physical, lifestyle or mechanical means of prolapse treatment (Adams 2004; Hagen 2004), nor any which compared these interventions with surgery, nor any which compared different types of sutures.
Upper vaginal prolapse
The abdominal sacral colpopexy was associated with a lower rate of recurrent vault prolapse (Benson 1996; Maher 2004) reduced grade of residual prolapse (Lo 1998), greater length of time taken to recurrence of prolapse (Benson 1996) and less dyspareunia (Benson 1996; Lo 1998; Maher 2004) as compared to the vaginal sacrospinous colpopexy. The data were too few to say if the differences in satisfaction, bowel outcomes or adverse effects were significant. However, the abdominal sacral colpopexy was associated with a longer operating time (Benson 1996; Lo 1998; Maher 2004) a longer time for recovery (Maher 2004), and it was more expensive (Benson 1996; Maher 2004) than the vaginal approach. The finding of less postoperative stress urinary incontinence after the abdominal approach must be viewed with caution due to the different continence procedures performed in the two trials (as described in the Methodology section). The trend towards a lower reoperation rate in the abdominal group did not reach statistical significance (Benson 1996, Maher 2004).
In a fourth trial, more women needed repeat prolapse surgery after abdominal sacral hysteropexy (without hysterectomy), and fewer women had pain, overactive bladder symptoms or obstructive micturition symptoms after vaginal surgery which included hysterectomy (Roovers 2004). However, the clinical relevance of this trial, which compared uterine preservation in one arm and hysterectomy in the other, is debatable. The findings were inconclusive in the Meschia trial which compared two different vaginal interventions (vaginal sacrospinous colpopexy versus posterior intravaginal slingplasty) (Meschia 2003).
Anterior vaginal wall prolapse
It was disappointing that so little information was available concerning the treatment of anterior vaginal wall prolapse. In one trial concerning women who all had stress urinary incontinence as well as prolapse, Burch colposuspension was subjectively better at curing the incontinence and anterior repair was better for the prolapse (Colombo 2000) but the trial was too small to judge whether this affected subsequent reoperation rates or the effect on other aspects of bladder, bowel or sexual function. There was some evidence from two small trials that mesh might reduce objective prolapse recurrence compared with anterior repair alone (Sand 2001; Weber 2001), but data for other symptoms were not reported.
Importantly, long‐term outcome data were not available, in particular regarding adverse effects such as mesh erosion. Julian et al demonstrated in a prospective case control study that in women who had undergone at least two previous vaginal repairs, the overlaying of a Marlex (Bard) mesh to the anterior vaginal wall repair reduced the recurrence rate of cystocele from 33% to 0%. The Marlex mesh was associated with a mesh erosion rate of 25% (Julian 1996). Flood et al, in a retrospective review of 142 women with Marlex mesh augmentation of anterior vaginal wall repair, demonstrated a 100% success rate for cystoceles at 3.2 years and a mesh erosion rate of only 2% (Flood 1998).
Posterior vaginal wall prolapse
Posterior vaginal vaginal wall repair performed better than the transanal repair of rectocele in terms of a significantly lower recurrence rate of posterior vaginal wall prolapse in two trials, despite a higher blood loss and greater use of pain relief (Kahn 1999; Nieminen 2004). However, the data were too few to comment on clinical outcomes such as flatus or faecal incontinence, or dyspareunia. More women had difficulties in bowel evacuation after transanal operation but this did not reach statistical significance. In total, five serious adverse effects were reported amongst the 87 women in the two trials. The trial evaluating mesh augmentation of posterior repair was too small to address this question reliably, although no woman reported mesh erosion (Sand 2001).
Prolapse surgery and potential urinary symptoms
Six trials provided information about changes to urinary function in women who had not had urinary symptoms before operation. In view of the potential for prolapse surgery to impact on urinary function, it was disappointing that so little information was available. The slight evidence in favour of needle suspension needs to be viewed in the light of a Cochrane review of bladder neck needle suspension, which found that there was little evidence for it being better than anterior repair alone in the treatment of urinary incontinence, albeit with wide confidence intervals (RR 0.93, 95% CI 0.68 to 1.26) (Glazener 2004). However, a recent trial has demonstrated that TVT was better at preserving continence than endopelvic fascia plication when used as an adjunct to prolapse surgery in women with occult stress urinary incontinence (Meschia 2004).
Overall, 37/300 (12%) of women reported new subjective stress urinary incontinence, and 26/323 (8%) new symptoms of overactive bladder. Long‐term voiding dysfunction (difficulty emptying the bladder) was reported by 32/365 (9%) of women. However, the data were too few to relate these changes to any particular type of prolapse or prolapse surgery.
There is debate about the value of trying to diagnose occult stress urinary incontinence before prolapse surgery, for example by assessing incontinence when the prolapse is temporarily reduced. The above data show that new urinary symptoms may also occur unexpectedly. Thought should be given to further management of all women who develop new symptoms (whether or not 'occult' urinary incontinence can be demonstrated preoperatively on reduction of the prolapse), as well as those whose preoperative urinary symptoms are not cured by surgery.
Prolapse surgery and mesh augmentation
The use of mesh to augment repair surgery has been successful in other fields such as groin hernia repair (Scott 2004). However, particular issues related to its use in vaginal repair concern the effect on bowel, bladder and sexual function and the possibility of mesh erosion or infection. Evidence from case series suggest possible concerns. Salvatore et al reported functional outcomes after a polypropylene mesh overlay at vaginal repair including a mesh erosion rate of 13%, overactive bladder increasing from 28% to 56% and dyspareunia increasing from 18% to 38% postoperatively (Salvatore 2002). Visco et al suggested that the mesh erosion or infection rate was increased four‐fold when mesh was introduced vaginally as compared to the abdominal route in the management of pelvic organ prolapse (Visco 2001).
The evidence supporting the use of polyglactin mesh repair for anterior vaginal wall prolapse came from two small trials with conflicting results and is not sufficient to support the use of permanent meshes or grafts at the time of vaginal repair surgery except in the context of randomised controlled clinical trials. These trials must be adequately powered to evaluate the anatomic and functional outcomes and possible adverse events.

Comparison 1 Surgery for upper vaginal (vault/uterine) prolapse, Outcome 1 Number of women with prolapse symptoms (subjective failure).
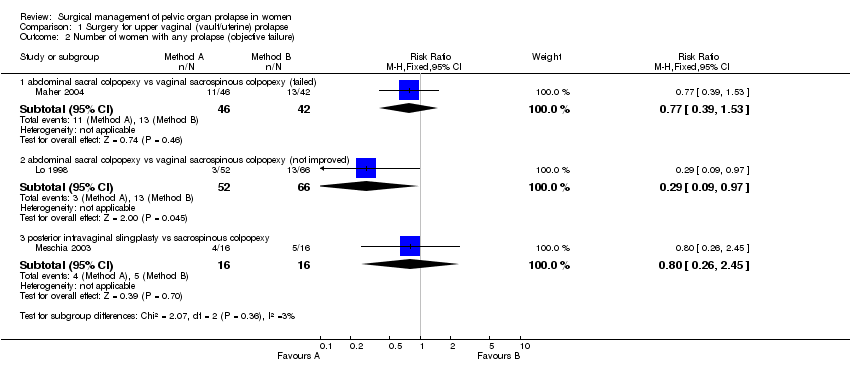
Comparison 1 Surgery for upper vaginal (vault/uterine) prolapse, Outcome 2 Number of women with any prolapse (objective failure).

Comparison 1 Surgery for upper vaginal (vault/uterine) prolapse, Outcome 3 Number of women with recurrent vault prolapse (objective).
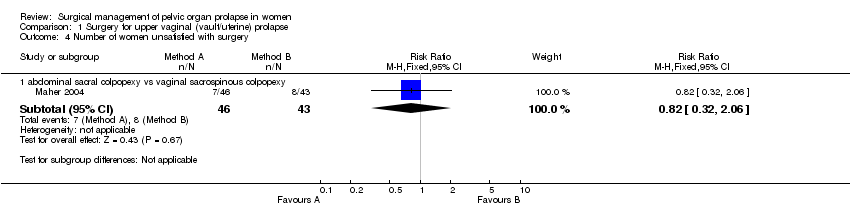
Comparison 1 Surgery for upper vaginal (vault/uterine) prolapse, Outcome 4 Number of women unsatisfied with surgery.
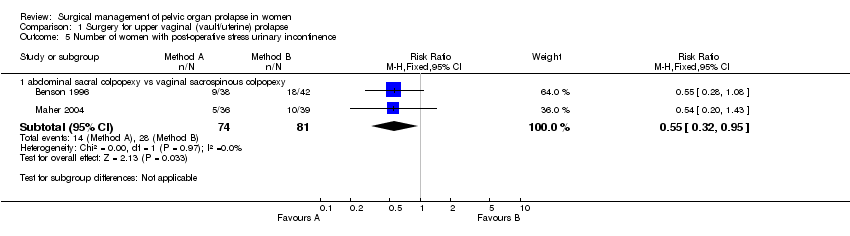
Comparison 1 Surgery for upper vaginal (vault/uterine) prolapse, Outcome 5 Number of women with post‐operative stress urinary incontinence.
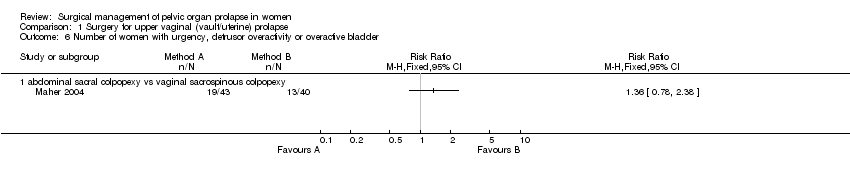
Comparison 1 Surgery for upper vaginal (vault/uterine) prolapse, Outcome 6 Number of women with urgency, detrusor overactivity or overactive bladder.
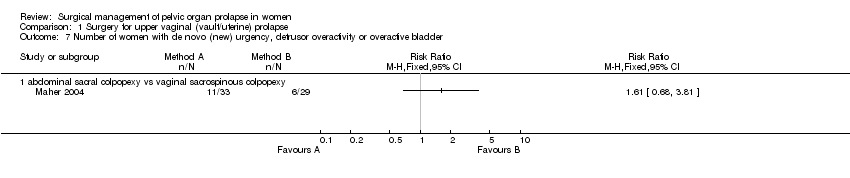
Comparison 1 Surgery for upper vaginal (vault/uterine) prolapse, Outcome 7 Number of women with de novo (new) urgency, detrusor overactivity or overactive bladder.

Comparison 1 Surgery for upper vaginal (vault/uterine) prolapse, Outcome 8 Number of women with persistent voiding dysfunction.

Comparison 1 Surgery for upper vaginal (vault/uterine) prolapse, Outcome 9 Number of women with new voiding dysfunction.
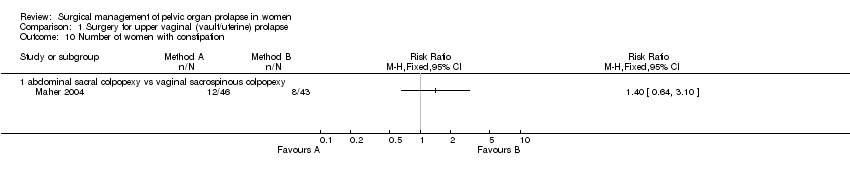
Comparison 1 Surgery for upper vaginal (vault/uterine) prolapse, Outcome 10 Number of women with constipation.

Comparison 1 Surgery for upper vaginal (vault/uterine) prolapse, Outcome 11 Number of women with faecal incontinence.

Comparison 1 Surgery for upper vaginal (vault/uterine) prolapse, Outcome 12 Number of women with obstructed defecation.
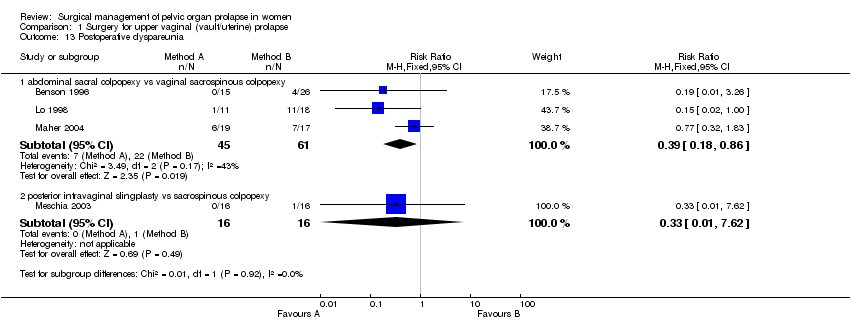
Comparison 1 Surgery for upper vaginal (vault/uterine) prolapse, Outcome 13 Postoperative dyspareunia.

Comparison 1 Surgery for upper vaginal (vault/uterine) prolapse, Outcome 14 Women with de novo (new) postoperative dyspareunia.
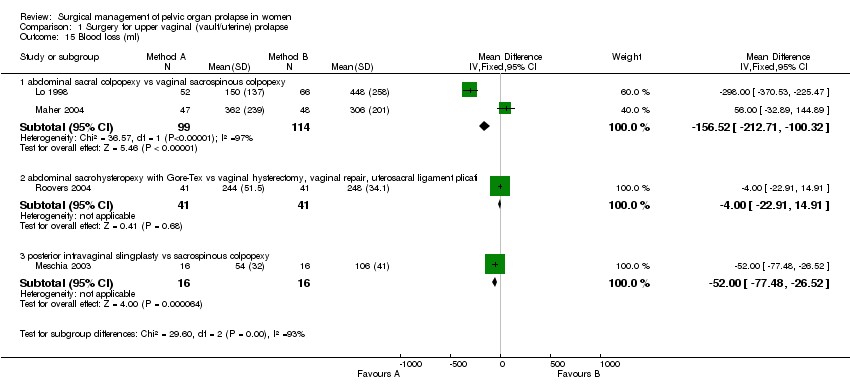
Comparison 1 Surgery for upper vaginal (vault/uterine) prolapse, Outcome 15 Blood loss (ml).
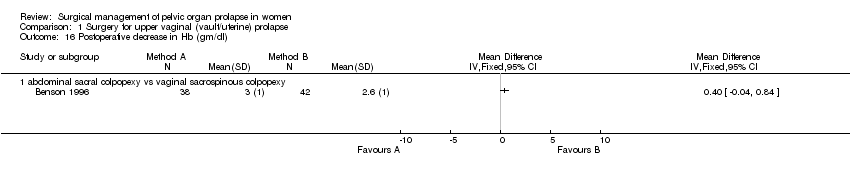
Comparison 1 Surgery for upper vaginal (vault/uterine) prolapse, Outcome 16 Postoperative decrease in Hb (gm/dl).
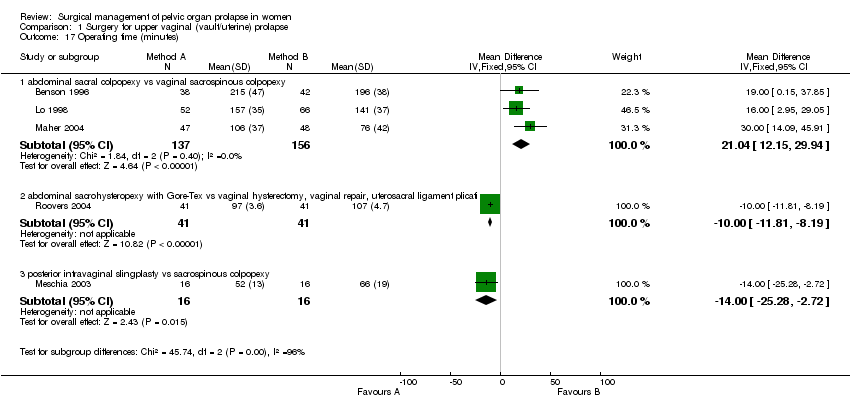
Comparison 1 Surgery for upper vaginal (vault/uterine) prolapse, Outcome 17 Operating time (minutes).
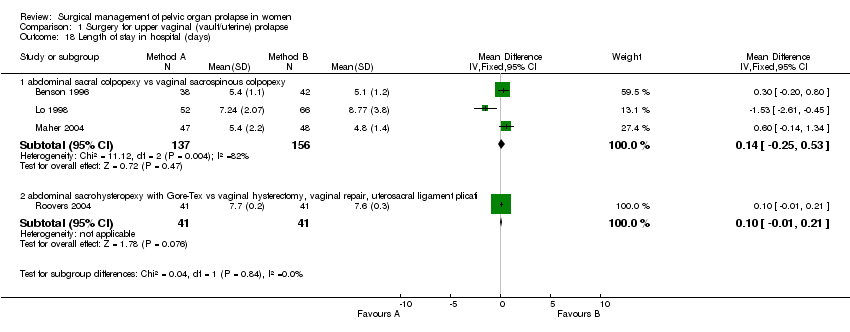
Comparison 1 Surgery for upper vaginal (vault/uterine) prolapse, Outcome 18 Length of stay in hospital (days).

Comparison 1 Surgery for upper vaginal (vault/uterine) prolapse, Outcome 19 Time to return to normal activity (days).

Comparison 1 Surgery for upper vaginal (vault/uterine) prolapse, Outcome 20 Cost (US dollars).
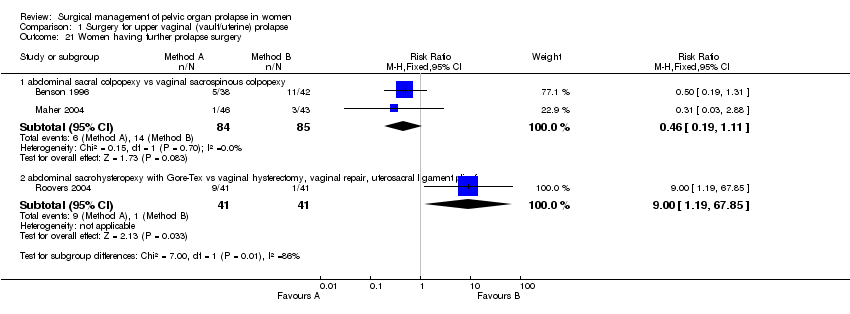
Comparison 1 Surgery for upper vaginal (vault/uterine) prolapse, Outcome 21 Women having further prolapse surgery.
Comparison 1 Surgery for upper vaginal (vault/uterine) prolapse, Outcome 22 Women having further continence surgery.

Comparison 1 Surgery for upper vaginal (vault/uterine) prolapse, Outcome 23 Women having further prolapse or continence surgery.

Comparison 1 Surgery for upper vaginal (vault/uterine) prolapse, Outcome 24 Time to recurrence of prolapse (months).

Comparison 1 Surgery for upper vaginal (vault/uterine) prolapse, Outcome 25 Adverse events.

Comparison 1 Surgery for upper vaginal (vault/uterine) prolapse, Outcome 26 Number of women with recurrent rectocele (objective).

Comparison 1 Surgery for upper vaginal (vault/uterine) prolapse, Outcome 27 Number of women with recurrent cystocele (objective).
Comparison 2 One method of anterior prolapse repair versus another surgical method, Outcome 1 Number of women with prolapse symptoms (subjective failure).

Comparison 2 One method of anterior prolapse repair versus another surgical method, Outcome 2 Number of women with prolapse (objective failure).

Comparison 2 One method of anterior prolapse repair versus another surgical method, Outcome 3 Number of women with anterior prolapse / cystocele (objective failure).

Comparison 2 One method of anterior prolapse repair versus another surgical method, Outcome 4 Number of women with posterior prolapse / rectocele (objective failure).

Comparison 2 One method of anterior prolapse repair versus another surgical method, Outcome 6 Number of women with pre‐operative stress incontinence not cured.

Comparison 2 One method of anterior prolapse repair versus another surgical method, Outcome 7 Number of women with de novo (new) stress urinary incontinence.

Comparison 2 One method of anterior prolapse repair versus another surgical method, Outcome 8 Number of women with urgency, detrusor overactivity or overactive bladder.

Comparison 2 One method of anterior prolapse repair versus another surgical method, Outcome 9 Number of women with dyspareunia.
Comparison 2 One method of anterior prolapse repair versus another surgical method, Outcome 10 Operating time (minutes).

Comparison 2 One method of anterior prolapse repair versus another surgical method, Outcome 11 Blood loss (ml).

Comparison 2 One method of anterior prolapse repair versus another surgical method, Outcome 12 Haemoglobin change.

Comparison 2 One method of anterior prolapse repair versus another surgical method, Outcome 13 Time to return to spontaneous voiding (days).
Comparison 2 One method of anterior prolapse repair versus another surgical method, Outcome 14 Number of women with postoperative complications.

Comparison 2 One method of anterior prolapse repair versus another surgical method, Outcome 15 Length of stay in hospital (days).

Comparison 2 One method of anterior prolapse repair versus another surgical method, Outcome 18 Number of women having further prolapse surgery.
Comparison 2 One method of anterior prolapse repair versus another surgical method, Outcome 19 Number of women having further surgery for incontinence.
Comparison 2 One method of anterior prolapse repair versus another surgical method, Outcome 20 Persistent voiding dysfunction.

Comparison 2 One method of anterior prolapse repair versus another surgical method, Outcome 21 Number of women with worse bowel function.

Comparison 2 One method of anterior prolapse repair versus another surgical method, Outcome 23 Death.
Comparison 3 One method of posterior prolapse repair versus another surgical method, Outcome 1 Number of women with prolapse symptoms (subjective failure).

Comparison 3 One method of posterior prolapse repair versus another surgical method, Outcome 2 Number of women with prolapse (objective failure).

Comparison 3 One method of posterior prolapse repair versus another surgical method, Outcome 4 Number of women with faecal incontinence after operation.

Comparison 3 One method of posterior prolapse repair versus another surgical method, Outcome 5 Number of women with anal incontinence to flatus after operation.
Comparison 3 One method of posterior prolapse repair versus another surgical method, Outcome 6 Number of women with obstructed defecation / constipation after surgery.
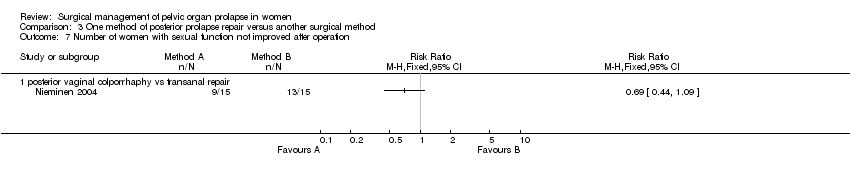
Comparison 3 One method of posterior prolapse repair versus another surgical method, Outcome 7 Number of women with sexual function not improved after operation.

Comparison 3 One method of posterior prolapse repair versus another surgical method, Outcome 8 Number of women with dyspareunia.

Comparison 3 One method of posterior prolapse repair versus another surgical method, Outcome 9 Blood loss (ml).

Comparison 3 One method of posterior prolapse repair versus another surgical method, Outcome 10 Difference in haemoglobin.
Comparison 3 One method of posterior prolapse repair versus another surgical method, Outcome 11 Operating time (minutes).
Comparison 3 One method of posterior prolapse repair versus another surgical method, Outcome 12 Postoperative narcotic (morphine) use.
Comparison 3 One method of posterior prolapse repair versus another surgical method, Outcome 13 Number of women with postoperative complications.

Comparison 3 One method of posterior prolapse repair versus another surgical method, Outcome 14 Persistent postoperative pain.

Comparison 3 One method of posterior prolapse repair versus another surgical method, Outcome 15 Length of stay in hospital (days).

Comparison 7 Prolapse repair and new urinary symptoms, Outcome 1 Number of women with de novo (new) stress urinary incontinence (subjective diagnosis).

Comparison 7 Prolapse repair and new urinary symptoms, Outcome 2 Number of women with de novo (new) stress urinary incontinence (objective diagnosis).
Comparison 7 Prolapse repair and new urinary symptoms, Outcome 3 Number of women with urgency, detrusor overactivity or overactive bladder.

Comparison 7 Prolapse repair and new urinary symptoms, Outcome 4 Number of women with de novo (new) urgency, detrusor overactivity or overactive bladder.
Comparison 7 Prolapse repair and new urinary symptoms, Outcome 5 Long term new voiding dysfunction.
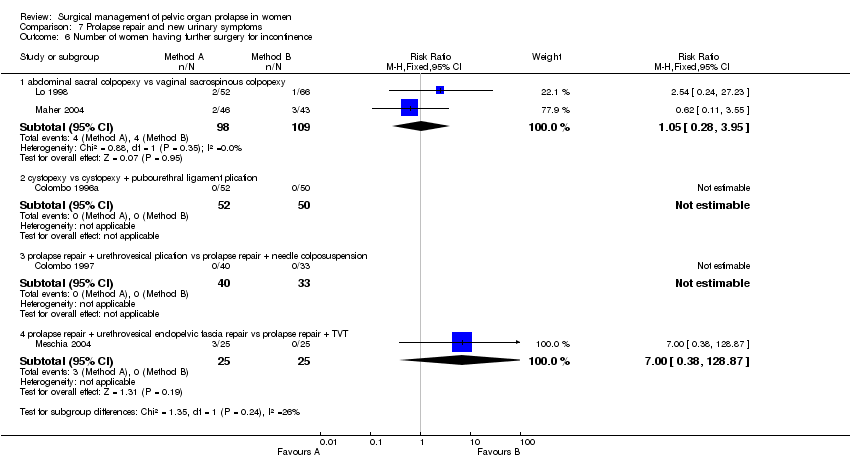
Comparison 7 Prolapse repair and new urinary symptoms, Outcome 6 Number of women having further surgery for incontinence.

Comparison 8 Use of native tissue versus mesh or foreign material, Outcome 1 Number of women with anterior prolapse / cystocele (objective failure).

Comparison 8 Use of native tissue versus mesh or foreign material, Outcome 2 Number of women with posterior prolapse / rectocele (objective failure).
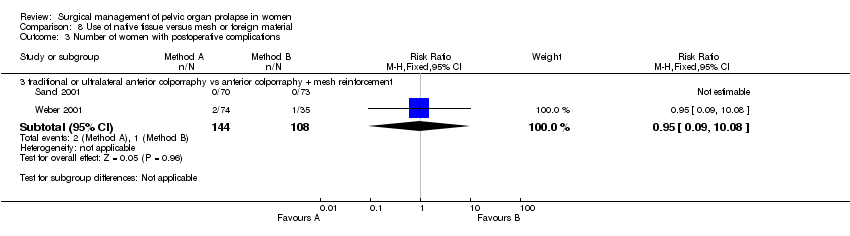
Comparison 8 Use of native tissue versus mesh or foreign material, Outcome 3 Number of women with postoperative complications.
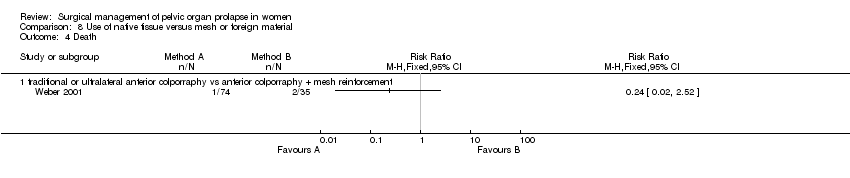
Comparison 8 Use of native tissue versus mesh or foreign material, Outcome 4 Death.
| Outcome or subgroup title | No. of studies | No. of participants | Statistical method | Effect size |
| 1 Number of women with prolapse symptoms (subjective failure) Show forest plot | 3 | Risk Ratio (M‐H, Fixed, 95% CI) | Subtotals only | |
| 1.1 abdominal sacral colpopexy vs vaginal sacrospinous colpopexy | 2 | 169 | Risk Ratio (M‐H, Fixed, 95% CI) | 0.53 [0.25, 1.09] |
| 1.2 abdominal sacrohysteropexy with Gore‐Tex vs vaginal hysterectomy, vaginal repair, uterosacral ligament plicati | 1 | 82 | Risk Ratio (M‐H, Fixed, 95% CI) | 3.2 [1.29, 7.92] |
| 2 Number of women with any prolapse (objective failure) Show forest plot | 3 | Risk Ratio (M‐H, Fixed, 95% CI) | Subtotals only | |
| 2.1 abdominal sacral colpopexy vs vaginal sacrospinous colpopexy (failed) | 1 | 88 | Risk Ratio (M‐H, Fixed, 95% CI) | 0.77 [0.39, 1.53] |
| 2.2 abdominal sacral colpopexy vs vaginal sacrospinous colpopexy (not improved) | 1 | 118 | Risk Ratio (M‐H, Fixed, 95% CI) | 0.29 [0.09, 0.97] |
| 2.3 posterior intravaginal slingplasty vs sacrospinous colpopexy | 1 | 32 | Risk Ratio (M‐H, Fixed, 95% CI) | 0.8 [0.26, 2.45] |
| 3 Number of women with recurrent vault prolapse (objective) Show forest plot | 2 | Risk Ratio (M‐H, Fixed, 95% CI) | Subtotals only | |
| 3.1 abdominal sacral colpopexy vs vaginal sacrospinous colpopexy | 2 | 169 | Risk Ratio (M‐H, Fixed, 95% CI) | 0.23 [0.07, 0.77] |
| 4 Number of women unsatisfied with surgery Show forest plot | 1 | Risk Ratio (M‐H, Fixed, 95% CI) | Subtotals only | |
| 4.1 abdominal sacral colpopexy vs vaginal sacrospinous colpopexy | 1 | 89 | Risk Ratio (M‐H, Fixed, 95% CI) | 0.82 [0.32, 2.06] |
| 5 Number of women with post‐operative stress urinary incontinence Show forest plot | 2 | Risk Ratio (M‐H, Fixed, 95% CI) | Subtotals only | |
| 5.1 abdominal sacral colpopexy vs vaginal sacrospinous colpopexy | 2 | 155 | Risk Ratio (M‐H, Fixed, 95% CI) | 0.55 [0.32, 0.95] |
| 6 Number of women with urgency, detrusor overactivity or overactive bladder Show forest plot | 1 | Risk Ratio (M‐H, Fixed, 95% CI) | Totals not selected | |
| 6.1 abdominal sacral colpopexy vs vaginal sacrospinous colpopexy | 1 | Risk Ratio (M‐H, Fixed, 95% CI) | 0.0 [0.0, 0.0] | |
| 7 Number of women with de novo (new) urgency, detrusor overactivity or overactive bladder Show forest plot | 1 | Risk Ratio (M‐H, Fixed, 95% CI) | Totals not selected | |
| 7.1 abdominal sacral colpopexy vs vaginal sacrospinous colpopexy | 1 | Risk Ratio (M‐H, Fixed, 95% CI) | 0.0 [0.0, 0.0] | |
| 8 Number of women with persistent voiding dysfunction Show forest plot | 1 | Risk Ratio (M‐H, Fixed, 95% CI) | Totals not selected | |
| 8.1 abdominal sacral colpopexy vs vaginal sacrospinous colpopexy | 1 | Risk Ratio (M‐H, Fixed, 95% CI) | 0.0 [0.0, 0.0] | |
| 9 Number of women with new voiding dysfunction Show forest plot | 1 | Risk Ratio (M‐H, Fixed, 95% CI) | Totals not selected | |
| 9.1 abdominal sacral colpopexy vs vaginal sacrospinous colpopexy | 1 | Risk Ratio (M‐H, Fixed, 95% CI) | 0.0 [0.0, 0.0] | |
| 10 Number of women with constipation Show forest plot | 1 | Risk Ratio (M‐H, Fixed, 95% CI) | Totals not selected | |
| 10.1 abdominal sacral colpopexy vs vaginal sacrospinous colpopexy | 1 | Risk Ratio (M‐H, Fixed, 95% CI) | 0.0 [0.0, 0.0] | |
| 11 Number of women with faecal incontinence Show forest plot | 2 | Risk Ratio (M‐H, Fixed, 95% CI) | Totals not selected | |
| 11.1 abdominal sacral colpopexy vs vaginal sacrospinous colpopexy | 1 | Risk Ratio (M‐H, Fixed, 95% CI) | 0.0 [0.0, 0.0] | |
| 11.2 posterior intravaginal slingplasty vs sacrospinous colpopexy | 1 | Risk Ratio (M‐H, Fixed, 95% CI) | 0.0 [0.0, 0.0] | |
| 12 Number of women with obstructed defecation Show forest plot | 1 | Risk Ratio (M‐H, Fixed, 95% CI) | Totals not selected | |
| 12.1 abdominal sacral colpopexy vs vaginal sacrospinous colpopexy | 1 | Risk Ratio (M‐H, Fixed, 95% CI) | 0.0 [0.0, 0.0] | |
| 13 Postoperative dyspareunia Show forest plot | 4 | Risk Ratio (M‐H, Fixed, 95% CI) | Subtotals only | |
| 13.1 abdominal sacral colpopexy vs vaginal sacrospinous colpopexy | 3 | 106 | Risk Ratio (M‐H, Fixed, 95% CI) | 0.39 [0.18, 0.86] |
| 13.2 posterior intravaginal slingplasty vs sacrospinous colpopexy | 1 | 32 | Risk Ratio (M‐H, Fixed, 95% CI) | 0.33 [0.01, 7.62] |
| 14 Women with de novo (new) postoperative dyspareunia Show forest plot | 1 | Risk Ratio (M‐H, Fixed, 95% CI) | Totals not selected | |
| 14.1 abdominal sacral colpopexy vs vaginal sacrospinous colpopexy | 1 | Risk Ratio (M‐H, Fixed, 95% CI) | 0.0 [0.0, 0.0] | |
| 15 Blood loss (ml) Show forest plot | 4 | Mean Difference (IV, Fixed, 95% CI) | Subtotals only | |
| 15.1 abdominal sacral colpopexy vs vaginal sacrospinous colpopexy | 2 | 213 | Mean Difference (IV, Fixed, 95% CI) | ‐156.52 [‐212.71, ‐100.32] |
| 15.2 abdominal sacrohysteropexy with Gore‐Tex vs vaginal hysterectomy, vaginal repair, uterosacral ligament plicati | 1 | 82 | Mean Difference (IV, Fixed, 95% CI) | ‐4.0 [‐22.91, 14.91] |
| 15.3 posterior intravaginal slingplasty vs sacrospinous colpopexy | 1 | 32 | Mean Difference (IV, Fixed, 95% CI) | ‐50.00 [‐77.48, ‐26.52] |
| 16 Postoperative decrease in Hb (gm/dl) Show forest plot | 1 | Mean Difference (IV, Fixed, 95% CI) | Totals not selected | |
| 16.1 abdominal sacral colpopexy vs vaginal sacrospinous colpopexy | 1 | Mean Difference (IV, Fixed, 95% CI) | 0.0 [0.0, 0.0] | |
| 17 Operating time (minutes) Show forest plot | 5 | Mean Difference (IV, Fixed, 95% CI) | Subtotals only | |
| 17.1 abdominal sacral colpopexy vs vaginal sacrospinous colpopexy | 3 | 293 | Mean Difference (IV, Fixed, 95% CI) | 21.04 [12.15, 29.94] |
| 17.2 abdominal sacrohysteropexy with Gore‐Tex vs vaginal hysterectomy, vaginal repair, uterosacral ligament plicati | 1 | 82 | Mean Difference (IV, Fixed, 95% CI) | ‐10.0 [‐11.81, ‐8.19] |
| 17.3 posterior intravaginal slingplasty vs sacrospinous colpopexy | 1 | 32 | Mean Difference (IV, Fixed, 95% CI) | ‐14.0 [‐25.28, ‐2.72] |
| 18 Length of stay in hospital (days) Show forest plot | 4 | Mean Difference (IV, Fixed, 95% CI) | Subtotals only | |
| 18.1 abdominal sacral colpopexy vs vaginal sacrospinous colpopexy | 3 | 293 | Mean Difference (IV, Fixed, 95% CI) | 0.14 [‐0.25, 0.53] |
| 18.2 abdominal sacrohysteropexy with Gore‐Tex vs vaginal hysterectomy, vaginal repair, uterosacral ligament plicati | 1 | 82 | Mean Difference (IV, Fixed, 95% CI) | 0.10 [‐0.01, 0.21] |
| 19 Time to return to normal activity (days) Show forest plot | 1 | Mean Difference (IV, Fixed, 95% CI) | Totals not selected | |
| 19.1 abdominal sacral colpopexy vs vaginal sacrospinous colpopexy | 1 | Mean Difference (IV, Fixed, 95% CI) | 0.0 [0.0, 0.0] | |
| 20 Cost (US dollars) Show forest plot | 2 | Mean Difference (IV, Fixed, 95% CI) | Subtotals only | |
| 20.1 abdominal sacral colpopexy vs vaginal sacrospinous colpopexy | 2 | 169 | Mean Difference (IV, Fixed, 95% CI) | 1333.95 [1027.24, 1640.65] |
| 21 Women having further prolapse surgery Show forest plot | 3 | Risk Ratio (M‐H, Fixed, 95% CI) | Subtotals only | |
| 21.1 abdominal sacral colpopexy vs vaginal sacrospinous colpopexy | 2 | 169 | Risk Ratio (M‐H, Fixed, 95% CI) | 0.46 [0.19, 1.11] |
| 21.2 abdominal sacrohysteropexy with Gore‐Tex vs vaginal hysterectomy, vaginal repair, uterosacral ligament plicati | 1 | 82 | Risk Ratio (M‐H, Fixed, 95% CI) | 9.0 [1.19, 67.85] |
| 22 Women having further continence surgery Show forest plot | 3 | Risk Ratio (M‐H, Fixed, 95% CI) | Subtotals only | |
| 22.1 abdominal sacral colpopexy vs vaginal sacrospinous colpopexy | 3 | 287 | Risk Ratio (M‐H, Fixed, 95% CI) | 0.60 [0.21, 1.73] |
| 23 Women having further prolapse or continence surgery Show forest plot | 2 | Risk Ratio (M‐H, Fixed, 95% CI) | Subtotals only | |
| 23.1 abdominal sacral colpopexy vs vaginal sacrospinous colpopexy | 2 | 169 | Risk Ratio (M‐H, Fixed, 95% CI) | 0.47 [0.23, 0.97] |
| 24 Time to recurrence of prolapse (months) Show forest plot | 1 | Mean Difference (IV, Fixed, 95% CI) | Totals not selected | |
| 24.1 abdominal sacral colpopexy vs vaginal sacrospinous colpopexy | 1 | Mean Difference (IV, Fixed, 95% CI) | 0.0 [0.0, 0.0] | |
| 25 Adverse events Show forest plot | 5 | Risk Ratio (M‐H, Fixed, 95% CI) | Subtotals only | |
| 25.1 abdominal sacral colpopexy vs vaginal sacrospinous colpopexy | 3 | 287 | Risk Ratio (M‐H, Fixed, 95% CI) | 1.30 [0.63, 2.69] |
| 25.2 abdominal sacrohysteropexy with Gore‐Tex vs vaginal hysterectomy, vaginal repair, uterosacral ligament plicati | 1 | 82 | Risk Ratio (M‐H, Fixed, 95% CI) | 1.2 [0.40, 3.62] |
| 25.3 posterior intravaginal slingplasty vs sacrospinous colpopexy | 1 | 47 | Risk Ratio (M‐H, Fixed, 95% CI) | 1.28 [0.32, 5.10] |
| 26 Number of women with recurrent rectocele (objective) Show forest plot | 1 | Risk Ratio (M‐H, Fixed, 95% CI) | Subtotals only | |
| 26.1 abdominal sacral colpopexy vs vaginal sacrospinous colpopexy | 1 | 89 | Risk Ratio (M‐H, Fixed, 95% CI) | 2.49 [0.71, 8.79] |
| 27 Number of women with recurrent cystocele (objective) Show forest plot | 1 | Risk Ratio (M‐H, Fixed, 95% CI) | Subtotals only | |
| 27.1 abdominal sacral colpopexy vs vaginal sacrospinous colpopexy | 1 | 89 | Risk Ratio (M‐H, Fixed, 95% CI) | 0.47 [0.12, 1.75] |
| Outcome or subgroup title | No. of studies | No. of participants | Statistical method | Effect size |
| 1 Number of women with prolapse symptoms (subjective failure) Show forest plot | 3 | Risk Ratio (M‐H, Fixed, 95% CI) | Totals not selected | |
| 1.3 traditional anterior colporraphy vs abdominal Burch colposuspension | 1 | Risk Ratio (M‐H, Fixed, 95% CI) | 0.0 [0.0, 0.0] | |
| 1.4 prolapse repair + urethrovesical plication vs prolapse repair + needle colposuspension | 1 | Risk Ratio (M‐H, Fixed, 95% CI) | 0.0 [0.0, 0.0] | |
| 1.8 prolapse repair + urethrovesical endopelvic fascia repair vs prolapse repair + TVT | 1 | Risk Ratio (M‐H, Fixed, 95% CI) | 0.0 [0.0, 0.0] | |
| 2 Number of women with prolapse (objective failure) Show forest plot | 4 | Risk Ratio (M‐H, Fixed, 95% CI) | Subtotals only | |
| 2.3 traditional anterior colporraphy vs abdominal Burch colposuspension | 1 | 68 | Risk Ratio (M‐H, Fixed, 95% CI) | 0.06 [0.01, 0.39] |
| 2.4 prolapse repair + urethrovesical plication vs prolapse repair + needle colposuspension | 2 | 138 | Risk Ratio (M‐H, Fixed, 95% CI) | 0.66 [0.34, 1.27] |
| 2.8 prolapse repair + urethrovesical endopelvic fascia repair vs prolapse repair + TVT | 1 | 50 | Risk Ratio (M‐H, Fixed, 95% CI) | 0.88 [0.37, 2.05] |
| 3 Number of women with anterior prolapse / cystocele (objective failure) Show forest plot | 7 | Risk Ratio (M‐H, Fixed, 95% CI) | Subtotals only | |
| 3.1 traditonal anterior colporrhaphy vs abdominal paravaginal repair | 0 | 0 | Risk Ratio (M‐H, Fixed, 95% CI) | 0.0 [0.0, 0.0] |
| 3.2 traditional anterior colporraphy vs ultralateral anterior colporraphy | 1 | 57 | Risk Ratio (M‐H, Fixed, 95% CI) | 1.29 [0.84, 1.98] |
| 3.3 traditional anterior colporraphy vs anterior colporraphy + mesh reinforcement | 2 | 202 | Risk Ratio (M‐H, Fixed, 95% CI) | 1.48 [1.07, 2.04] |
| 3.4 ultralateral anterior colporraphy vs anterior colporraphy + mesh reinforcement | 1 | 50 | Risk Ratio (M‐H, Fixed, 95% CI) | 0.94 [0.57, 1.54] |
| 3.5 traditional anterior colporraphy vs abdominal Burch colposuspension | 1 | 68 | Risk Ratio (M‐H, Fixed, 95% CI) | 0.09 [0.01, 0.64] |
| 3.6 prolapse repair + urethrovesical plication vs prolapse repair + needle colposuspension | 2 | 138 | Risk Ratio (M‐H, Fixed, 95% CI) | 0.55 [0.23, 1.29] |
| 3.7 cystopexy vs cystopexy + pubourethral ligament plication | 1 | 102 | Risk Ratio (M‐H, Fixed, 95% CI) | 0.96 [0.14, 6.57] |
| 3.8 prolapse repair + urethrovesical endopelvic fascia repair vs prolapse repair + TVT | 1 | 50 | Risk Ratio (M‐H, Fixed, 95% CI) | 1.17 [0.46, 2.98] |
| 4 Number of women with posterior prolapse / rectocele (objective failure) Show forest plot | 2 | Risk Ratio (M‐H, Fixed, 95% CI) | Totals not selected | |
| 4.1 traditional anterior colporraphy vs anterior colporraphy + mesh reinforcement | 1 | Risk Ratio (M‐H, Fixed, 95% CI) | 0.0 [0.0, 0.0] | |
| 4.8 prolapse repair + urethrovesical endopelvic fascia repair vs prolapse repair + TVT | 1 | Risk Ratio (M‐H, Fixed, 95% CI) | 0.0 [0.0, 0.0] | |
| 6 Number of women with pre‐operative stress incontinence not cured Show forest plot | 2 | Risk Ratio (M‐H, Fixed, 95% CI) | Totals not selected | |
| 6.3 traditional anterior colporraphy vs abdominal Burch colposuspension | 1 | Risk Ratio (M‐H, Fixed, 95% CI) | 0.0 [0.0, 0.0] | |
| 6.4 prolapse repair + urethrovesical plication vs prolapse repair + needle colposuspension | 1 | Risk Ratio (M‐H, Fixed, 95% CI) | 0.0 [0.0, 0.0] | |
| 7 Number of women with de novo (new) stress urinary incontinence Show forest plot | 4 | Risk Ratio (M‐H, Fixed, 95% CI) | Subtotals only | |
| 7.3 cystopexy vs cystopexy + pubourethral ligament plication | 1 | 102 | Risk Ratio (M‐H, Fixed, 95% CI) | 0.96 [0.25, 3.64] |
| 7.5 prolapse repair + urethrovesical plication vs prolapse repair + needle colposuspension | 2 | 102 | Risk Ratio (M‐H, Fixed, 95% CI) | 2.62 [0.63, 10.91] |
| 7.8 prolapse repair + urethrovesical endopelvic fascia repair vs prolapse repair + TVT | 1 | 50 | Risk Ratio (M‐H, Fixed, 95% CI) | 9.0 [1.23, 65.85] |
| 8 Number of women with urgency, detrusor overactivity or overactive bladder Show forest plot | 5 | Risk Ratio (M‐H, Fixed, 95% CI) | Subtotals only | |
| 8.3 traditional anterior colporraphy vs abdominal Burch colposuspension | 1 | 68 | Risk Ratio (M‐H, Fixed, 95% CI) | 1.06 [0.07, 16.27] |
| 8.4 prolapse repair + urethrovesical plication vs prolapse repair + needle colposuspension | 2 | 138 | Risk Ratio (M‐H, Fixed, 95% CI) | 0.96 [0.20, 4.49] |
| 8.5 cystopexy vs cystopexy + pubourethral ligament plication | 1 | 102 | Risk Ratio (M‐H, Fixed, 95% CI) | 0.96 [0.06, 14.96] |
| 8.8 prolapse repair + urethrovesical endopelvic fascia repair vs prolapse repair + TVT | 1 | 50 | Risk Ratio (M‐H, Fixed, 95% CI) | 0.33 [0.04, 2.99] |
| 9 Number of women with dyspareunia Show forest plot | 2 | Risk Ratio (M‐H, Fixed, 95% CI) | Totals not selected | |
| 9.3 traditional anterior colporraphy vs abdominal Burch colposuspension | 1 | Risk Ratio (M‐H, Fixed, 95% CI) | 0.0 [0.0, 0.0] | |
| 9.4 cystopexy vs cystopexy + pubourethral ligament plication | 1 | Risk Ratio (M‐H, Fixed, 95% CI) | 0.0 [0.0, 0.0] | |
| 10 Operating time (minutes) Show forest plot | 1 | Mean Difference (IV, Fixed, 95% CI) | Totals not selected | |
| 10.8 prolapse repair + urethrovesical endopelvic fascia repair vs prolapse repair + TVT | 1 | Mean Difference (IV, Fixed, 95% CI) | 0.0 [0.0, 0.0] | |
| 11 Blood loss (ml) Show forest plot | 1 | Mean Difference (IV, Fixed, 95% CI) | Totals not selected | |
| 11.8 prolapse repair + urethrovesical endopelvic fascia repair vs prolapse repair + TVT | 1 | Mean Difference (IV, Fixed, 95% CI) | 0.0 [0.0, 0.0] | |
| 12 Haemoglobin change Show forest plot | 1 | Mean Difference (IV, Fixed, 95% CI) | Totals not selected | |
| 12.8 prolapse repair + urethrovesical endopelvic fascia repair vs prolapse repair + TVT | 1 | Mean Difference (IV, Fixed, 95% CI) | 0.0 [0.0, 0.0] | |
| 13 Time to return to spontaneous voiding (days) Show forest plot | 1 | Mean Difference (IV, Fixed, 95% CI) | Totals not selected | |
| 13.8 prolapse repair + urethrovesical endopelvic fascia repair vs prolapse repair + TVT | 1 | Mean Difference (IV, Fixed, 95% CI) | 0.0 [0.0, 0.0] | |
| 14 Number of women with postoperative complications Show forest plot | 6 | Risk Ratio (M‐H, Fixed, 95% CI) | Totals not selected | |
| 14.2 traditional anterior colporraphy vs ultralateral anterior colporraphy | 1 | Risk Ratio (M‐H, Fixed, 95% CI) | 0.0 [0.0, 0.0] | |
| 14.3 traditional anterior colporraphy vs anterior colporraphy + mesh reinforcement | 2 | Risk Ratio (M‐H, Fixed, 95% CI) | 0.0 [0.0, 0.0] | |
| 14.4 ultralateral anterior colporraphy vs anterior colporraphy + mesh reinforcement | 1 | Risk Ratio (M‐H, Fixed, 95% CI) | 0.0 [0.0, 0.0] | |
| 14.5 traditional anterior colporraphy vs abdominal Burch colposuspension | 1 | Risk Ratio (M‐H, Fixed, 95% CI) | 0.0 [0.0, 0.0] | |
| 14.6 prolapse repair + urethrovesical plication vs prolapse repair + needle colposuspension | 1 | Risk Ratio (M‐H, Fixed, 95% CI) | 0.0 [0.0, 0.0] | |
| 14.7 cystopexy vs cystopexy + pubourethral ligament plication | 1 | Risk Ratio (M‐H, Fixed, 95% CI) | 0.0 [0.0, 0.0] | |
| 14.8 prolapse repair + urethrovesical endopelvic fascia repair vs prolapse repair + TVT | 1 | Risk Ratio (M‐H, Fixed, 95% CI) | 0.0 [0.0, 0.0] | |
| 15 Length of stay in hospital (days) Show forest plot | 3 | Mean Difference (IV, Fixed, 95% CI) | Totals not selected | |
| 15.3 prolapse repair + urethrovesical plication vs prolapse repair + needle colposuspension | 1 | Mean Difference (IV, Fixed, 95% CI) | 0.0 [0.0, 0.0] | |
| 15.4 cystopexy vs cystopexy + pubourethral ligament plication | 1 | Mean Difference (IV, Fixed, 95% CI) | 0.0 [0.0, 0.0] | |
| 15.8 prolapse repair + urethrovesical endopelvic fascia repair vs prolapse repair + TVT | 1 | Mean Difference (IV, Fixed, 95% CI) | 0.0 [0.0, 0.0] | |
| 18 Number of women having further prolapse surgery Show forest plot | 4 | Risk Ratio (M‐H, Fixed, 95% CI) | Subtotals only | |
| 18.3 traditional anterior colporraphy vs abdominal Burch colposuspension | 1 | 68 | Risk Ratio (M‐H, Fixed, 95% CI) | 0.0 [0.0, 0.0] |
| 18.4 prolapse repair + urethrovesical plication vs prolapse repair + needle colposuspension | 2 | 138 | Risk Ratio (M‐H, Fixed, 95% CI) | 0.41 [0.06, 2.71] |
| 18.5 cystopexy vs cystopexy + pubourethral ligament plication | 1 | 102 | Risk Ratio (M‐H, Fixed, 95% CI) | 0.0 [0.0, 0.0] |
| 19 Number of women having further surgery for incontinence Show forest plot | 4 | Risk Ratio (M‐H, Fixed, 95% CI) | Totals not selected | |
| 19.3 traditional anterior colporraphy vs abdominal Burch colposuspension | 1 | Risk Ratio (M‐H, Fixed, 95% CI) | 0.0 [0.0, 0.0] | |
| 19.4 cystopexy vs cystopexy + pubourethral ligament plication | 1 | Risk Ratio (M‐H, Fixed, 95% CI) | 0.0 [0.0, 0.0] | |
| 19.5 prolapse repair + urethrovesical plication vs prolapse repair + needle colposuspension | 1 | Risk Ratio (M‐H, Fixed, 95% CI) | 0.0 [0.0, 0.0] | |
| 19.8 prolapse repair + urethrovesical endopelvic fascia repair vs prolapse repair + TVT | 1 | Risk Ratio (M‐H, Fixed, 95% CI) | 0.0 [0.0, 0.0] | |
| 20 Persistent voiding dysfunction Show forest plot | 5 | Risk Ratio (M‐H, Fixed, 95% CI) | Subtotals only | |
| 20.3 traditional anterior colporraphy vs abdominal Burch colposuspension | 1 | 68 | Risk Ratio (M‐H, Fixed, 95% CI) | 0.0 [0.0, 0.0] |
| 20.4 prolapse repair + urethrovesical plication vs prolapse repair + needle colposuspension | 2 | 138 | Risk Ratio (M‐H, Fixed, 95% CI) | 1.05 [0.49, 2.26] |
| 20.5 cystopexy vs cystopexy + pubourethral ligament plication | 1 | 102 | Risk Ratio (M‐H, Fixed, 95% CI) | 0.09 [0.00, 1.54] |
| 20.8 prolapse repair + urethrovesical endopelvic fascia repair vs prolapse repair + TVT | 1 | 50 | Risk Ratio (M‐H, Fixed, 95% CI) | 0.33 [0.04, 2.99] |
| 21 Number of women with worse bowel function Show forest plot | 1 | Risk Ratio (M‐H, Fixed, 95% CI) | Totals not selected | |
| 21.1 prolapse repair + urethrovesical plication vs prolapse repair + needle colposuspension | 1 | Risk Ratio (M‐H, Fixed, 95% CI) | 0.0 [0.0, 0.0] | |
| 23 Death Show forest plot | 1 | Risk Ratio (M‐H, Fixed, 95% CI) | Totals not selected | |
| 23.1 traditional anterior colporraphy vs ultralateral anterior colporraphy | 1 | Risk Ratio (M‐H, Fixed, 95% CI) | 0.0 [0.0, 0.0] | |
| 23.2 traditional anterior colporraphy vs anterior colporraphy + mesh reinforcement | 1 | Risk Ratio (M‐H, Fixed, 95% CI) | 0.0 [0.0, 0.0] | |
| 23.3 ultralateral anterior colporraphy vs anterior colporraphy + mesh reinforcement | 1 | Risk Ratio (M‐H, Fixed, 95% CI) | 0.0 [0.0, 0.0] | |
| Outcome or subgroup title | No. of studies | No. of participants | Statistical method | Effect size |
| 1 Number of women with prolapse symptoms (subjective failure) Show forest plot | 2 | Risk Ratio (M‐H, Fixed, 95% CI) | Subtotals only | |
| 1.1 posterior vaginal colporrhaphy vs transanal repair | 2 | 87 | Risk Ratio (M‐H, Fixed, 95% CI) | 0.36 [0.13, 1.00] |
| 2 Number of women with prolapse (objective failure) Show forest plot | 3 | Risk Ratio (M‐H, Fixed, 95% CI) | Subtotals only | |
| 2.1 posterior vaginal colporrhaphy vs transanal repair (rectocele) | 2 | 87 | Risk Ratio (M‐H, Fixed, 95% CI) | 0.32 [0.07, 1.34] |
| 2.2 posterior vaginal colporrhaphy vs transanal repair (enterocele) | 2 | 87 | Risk Ratio (M‐H, Fixed, 95% CI) | 0.23 [0.07, 0.83] |
| 2.3 posterior vaginal colporrhaphy vs transanal repair (rectocele or enterocele)) | 2 | 87 | Risk Ratio (M‐H, Fixed, 95% CI) | 0.24 [0.09, 0.64] |
| 2.4 posterior vaginal colporraphy vs posterior colporraphy with mesh reinforcement for rectocele | 1 | 132 | Risk Ratio (M‐H, Fixed, 95% CI) | 1.13 [0.40, 3.19] |
| 4 Number of women with faecal incontinence after operation Show forest plot | 1 | Risk Ratio (M‐H, Fixed, 95% CI) | Totals not selected | |
| 4.1 posterior vaginal colporrhaphy vs transanal repair | 1 | Risk Ratio (M‐H, Fixed, 95% CI) | 0.0 [0.0, 0.0] | |
| 5 Number of women with anal incontinence to flatus after operation Show forest plot | 1 | Risk Ratio (M‐H, Fixed, 95% CI) | Totals not selected | |
| 5.1 posterior vaginal colporrhaphy vs transanal repair | 1 | Risk Ratio (M‐H, Fixed, 95% CI) | 0.0 [0.0, 0.0] | |
| 6 Number of women with obstructed defecation / constipation after surgery Show forest plot | 2 | Risk Ratio (M‐H, Fixed, 95% CI) | Subtotals only | |
| 6.1 posterior vaginal colporrhaphy vs transanal repair | 2 | 65 | Risk Ratio (M‐H, Fixed, 95% CI) | 0.73 [0.37, 1.42] |
| 7 Number of women with sexual function not improved after operation Show forest plot | 1 | Risk Ratio (M‐H, Fixed, 95% CI) | Totals not selected | |
| 7.1 posterior vaginal colporrhaphy vs transanal repair | 1 | Risk Ratio (M‐H, Fixed, 95% CI) | 0.0 [0.0, 0.0] | |
| 8 Number of women with dyspareunia Show forest plot | 2 | Risk Ratio (M‐H, Fixed, 95% CI) | Subtotals only | |
| 8.1 posterior vaginal colporrhaphy vs transanal repair | 2 | 80 | Risk Ratio (M‐H, Fixed, 95% CI) | 3.13 [0.87, 11.23] |
| 9 Blood loss (ml) Show forest plot | 2 | Mean Difference (IV, Fixed, 95% CI) | Subtotals only | |
| 9.1 posterior vaginal colporrhaphy vs transanal repair | 2 | 87 | Mean Difference (IV, Fixed, 95% CI) | 79.38 [39.69, 119.08] |
| 10 Difference in haemoglobin Show forest plot | 1 | Mean Difference (IV, Fixed, 95% CI) | Totals not selected | |
| 10.1 posterior vaginal colporrhaphy vs transanal repair | 1 | Mean Difference (IV, Fixed, 95% CI) | 0.0 [0.0, 0.0] | |
| 11 Operating time (minutes) Show forest plot | 2 | Mean Difference (IV, Fixed, 95% CI) | Subtotals only | |
| 11.1 posterior vaginal colporrhaphy vs transanal repair | 2 | 87 | Mean Difference (IV, Fixed, 95% CI) | ‐3.64 [‐7.43, 0.15] |
| 12 Postoperative narcotic (morphine) use Show forest plot | 1 | Mean Difference (IV, Fixed, 95% CI) | Totals not selected | |
| 12.1 posterior vaginal colporrhaphy vs transanal repair | 1 | Mean Difference (IV, Fixed, 95% CI) | 0.0 [0.0, 0.0] | |
| 13 Number of women with postoperative complications Show forest plot | 2 | Risk Ratio (M‐H, Fixed, 95% CI) | Subtotals only | |
| 13.1 posterior vaginal colporrhaphy vs transanal repair | 2 | 87 | Risk Ratio (M‐H, Fixed, 95% CI) | 3.56 [0.80, 15.74] |
| 14 Persistent postoperative pain Show forest plot | 1 | Risk Ratio (M‐H, Fixed, 95% CI) | Totals not selected | |
| 14.1 posterior vaginal colporrhaphy vs transanal repair | 1 | Risk Ratio (M‐H, Fixed, 95% CI) | 0.0 [0.0, 0.0] | |
| 15 Length of stay in hospital (days) Show forest plot | 1 | Mean Difference (IV, Fixed, 95% CI) | Totals not selected | |
| 15.1 posterior vaginal colporrhaphy vs transanal repair | 1 | Mean Difference (IV, Fixed, 95% CI) | 0.0 [0.0, 0.0] | |
| Outcome or subgroup title | No. of studies | No. of participants | Statistical method | Effect size |
| 1 Number of women with de novo (new) stress urinary incontinence (subjective diagnosis) Show forest plot | 5 | Risk Ratio (M‐H, Fixed, 95% CI) | Subtotals only | |
| 1.1 cystopexy vs cystopexy + pubourethral ligament plication | 1 | 102 | Risk Ratio (M‐H, Fixed, 95% CI) | 0.96 [0.25, 3.64] |
| 1.2 prolapse repair + urethrovesical plication vs prolapse repair + needle colposuspension | 2 | 102 | Risk Ratio (M‐H, Fixed, 95% CI) | 2.62 [0.63, 10.91] |
| 1.4 abdominal colpopexy vs vaginal colpopexy | 1 | 46 | Risk Ratio (M‐H, Fixed, 95% CI) | 0.27 [0.06, 1.15] |
| 1.8 prolapse repair + urethrovesical endopelvic fascia repair vs prolapse repair + TVT | 1 | 50 | Risk Ratio (M‐H, Fixed, 95% CI) | 9.0 [1.23, 65.85] |
| 2 Number of women with de novo (new) stress urinary incontinence (objective diagnosis) Show forest plot | 2 | Risk Ratio (M‐H, Fixed, 95% CI) | Totals not selected | |
| 2.2 prolapse repair + urethrovesical plication vs prolapse repair + needle colposuspension | 1 | Risk Ratio (M‐H, Fixed, 95% CI) | 0.0 [0.0, 0.0] | |
| 2.8 prolapse repair + urethrovesical endopelvic fascia repair vs prolapse repair + TVT | 1 | Risk Ratio (M‐H, Fixed, 95% CI) | 0.0 [0.0, 0.0] | |
| 3 Number of women with urgency, detrusor overactivity or overactive bladder Show forest plot | 1 | Risk Ratio (M‐H, Fixed, 95% CI) | Totals not selected | |
| 3.6 prolapse repair + urethrovesical plication vs prolapse repair + needle colposuspension | 1 | Risk Ratio (M‐H, Fixed, 95% CI) | 0.0 [0.0, 0.0] | |
| 4 Number of women with de novo (new) urgency, detrusor overactivity or overactive bladder Show forest plot | 4 | Risk Ratio (M‐H, Fixed, 95% CI) | Totals not selected | |
| 4.1 abdominal colpopexy vs vaginal colpopexy | 1 | Risk Ratio (M‐H, Fixed, 95% CI) | 0.0 [0.0, 0.0] | |
| 4.2 cystopexy vs cystopexy + pubourethral ligament plication | 1 | Risk Ratio (M‐H, Fixed, 95% CI) | 0.0 [0.0, 0.0] | |
| 4.3 prolapse repair + urethrovesical plication vs prolapse repair + needle colposuspension | 1 | Risk Ratio (M‐H, Fixed, 95% CI) | 0.0 [0.0, 0.0] | |
| 4.8 prolapse repair + urethrovesical endopelvic fascia repair vs prolapse repair + TVT | 1 | Risk Ratio (M‐H, Fixed, 95% CI) | 0.0 [0.0, 0.0] | |
| 5 Long term new voiding dysfunction Show forest plot | 5 | Risk Ratio (M‐H, Fixed, 95% CI) | Subtotals only | |
| 5.1 abdominal colpopexy vs vaginal colpopexy | 1 | 75 | Risk Ratio (M‐H, Fixed, 95% CI) | 1.03 [0.07, 15.82] |
| 5.4 prolapse repair + urethrovesical plication vs prolapse repair + needle colposuspension | 2 | 138 | Risk Ratio (M‐H, Fixed, 95% CI) | 1.05 [0.49, 2.26] |
| 5.5 cystopexy vs cystopexy + pubourethral ligament plication | 1 | 102 | Risk Ratio (M‐H, Fixed, 95% CI) | 0.09 [0.00, 1.54] |
| 5.8 prolapse repair + urethrovesical endopelvic fascia repair vs prolapse repair + TVT | 1 | 50 | Risk Ratio (M‐H, Fixed, 95% CI) | 0.33 [0.04, 2.99] |
| 6 Number of women having further surgery for incontinence Show forest plot | 5 | Risk Ratio (M‐H, Fixed, 95% CI) | Subtotals only | |
| 6.1 abdominal sacral colpopexy vs vaginal sacrospinous colpopexy | 2 | 207 | Risk Ratio (M‐H, Fixed, 95% CI) | 1.05 [0.28, 3.95] |
| 6.2 cystopexy vs cystopexy + pubourethral ligament plication | 1 | 102 | Risk Ratio (M‐H, Fixed, 95% CI) | 0.0 [0.0, 0.0] |
| 6.3 prolapse repair + urethrovesical plication vs prolapse repair + needle colposuspension | 1 | 73 | Risk Ratio (M‐H, Fixed, 95% CI) | 0.0 [0.0, 0.0] |
| 6.4 prolapse repair + urethrovesical endopelvic fascia repair vs prolapse repair + TVT | 1 | 50 | Risk Ratio (M‐H, Fixed, 95% CI) | 7.0 [0.38, 128.87] |
| Outcome or subgroup title | No. of studies | No. of participants | Statistical method | Effect size |
| 1 Number of women with anterior prolapse / cystocele (objective failure) Show forest plot | 2 | Risk Ratio (M‐H, Fixed, 95% CI) | Subtotals only | |
| 1.1 traditional or ultralateral anterior colporraphy vs anterior colporraphy + mesh reinforcement | 2 | 226 | Risk Ratio (M‐H, Fixed, 95% CI) | 1.39 [1.02, 1.90] |
| 2 Number of women with posterior prolapse / rectocele (objective failure) Show forest plot | 1 | Risk Ratio (M‐H, Fixed, 95% CI) | Totals not selected | |
| 2.1 traditional anterior colporraphy vs anterior colporraphy + mesh reinforcement | 1 | Risk Ratio (M‐H, Fixed, 95% CI) | 0.0 [0.0, 0.0] | |
| 3 Number of women with postoperative complications Show forest plot | 2 | Risk Ratio (M‐H, Fixed, 95% CI) | Subtotals only | |
| 3.3 traditional or ultralateral anterior colporraphy vs anterior colporraphy + mesh reinforcement | 2 | 252 | Risk Ratio (M‐H, Fixed, 95% CI) | 0.95 [0.09, 10.08] |
| 4 Death Show forest plot | 1 | Risk Ratio (M‐H, Fixed, 95% CI) | Totals not selected | |
| 4.1 traditional or ultralateral anterior colporraphy vs anterior colporraphy + mesh reinforcement | 1 | Risk Ratio (M‐H, Fixed, 95% CI) | 0.0 [0.0, 0.0] | |