Leche de fórmula versus leche materna de donante para la alimentación de neonatos prematuros o de bajo peso al nacer
Referencias
Referencias de los estudios incluidos en esta revisión
Referencias de los estudios excluidos de esta revisión
Referencias adicionales
Referencias de otras versiones publicadas de esta revisión
Characteristics of studies
Characteristics of included studies [ordered by study ID]
Ir a:
| Methods | 1. Blinding of randomisation: Can't tell | |
| Participants | 68 preterm infants: 28‐36 weeks in two strata. | |
| Interventions | Term formula milk (N= 34 ) versus unfortified, Pasteurised donor breast milk (N= 34). Assigned from birth for 2 months. | |
| Outcomes | Rates of weight gain, increase in head circumference and length from birth until 1 month and from 1 month until 2 months. | |
| Notes | Infants of mothers who wished to breastfeed were initially given expressed breast milk if unable to feed naturally. There were only two such infants, their feeding group was not specified and the results for these infants are not presented separately in the paper. Given that this applies to only two out of 68 infants, we have included this study in the review. | |
| Risk of bias | ||
| Bias | Authors' judgement | Support for judgement |
| Allocation concealment? | Unclear risk | B ‐ Unclear |
| Methods | 1. Blinding of randomisation: Yes | |
| Participants | 67 preterm infants (27‐33 weeks). | |
| Interventions | Term formula milk (N= 26) versus unfortified, Pasteurised donor breast milk (N=41). Feeds were assigned until the infant reached a weight of 1800g or until withdrawn from the study because of feed intolerance or necrotising enterocolitis. | |
| Outcomes | Time to regain birth weight. | |
| Notes | Although the report gave information on adverse outcomes, the seven affected infants were withdrawn from the study and not included in the analyses of growth rates. Therefore, growth data are reported for 20 infants in each arm of the trial. | |
| Risk of bias | ||
| Bias | Authors' judgement | Support for judgement |
| Allocation concealment? | Low risk | A ‐ Adequate |
| Methods | 1. Blinding of randomisation: Yes | |
| Participants | 159 infants of birth weight <1850g. Stratified by birth weight <1200g and 1201‐ 1850g. Infants with congenital abnormalities excluded. Infants with intra‐uterine growth restriction not excluded. | |
| Interventions | Preterm formula milk (N= 76) versus donor (mainly "drip") breast milk (N= 83). The formula was intended to be delivered at 180 ml/kg/day versus the breast milk at 200 ml/kg/day. Feeds were assigned until the infant reached a weight of 2000 g or until discharge from the neonatal unit. | |
| Outcomes | Short term outcomes: | |
| Notes | The first "interim" report provided data on short term growth outcomes in a pre‐defined subset of the total cohort recruited. | |
| Risk of bias | ||
| Bias | Authors' judgement | Support for judgement |
| Allocation concealment? | Low risk | A ‐ Adequate |
| Methods | 1. Blinding of randomisation: Yes | |
| Participants | 343 infants of birth weight <1850 g. Stratified by birth weight <1200g and 1201‐ 1850g. Infants with congenital abnormalities excluded. Infants with intra‐uterine growth restriction not excluded. | |
| Interventions | Preterm formula milk (N= 173) versus banked donor breast milk (N= 170 ) as a supplement to the mother's own breast milk. | |
| Outcomes | Short term outcomes:Time to regain birth weight (132 infants). Rates of change in weight (115 infants), crown‐heel length (45 infants) and head circumference (97 infants) from the point of regained birth weight until discharge from the neonatal unit or reaching a weight of 2000 g. | |
| Notes | The first "interim" report provided data on short term growth outcomes in a pre‐defined subset of the total cohort recruited. | |
| Risk of bias | ||
| Bias | Authors' judgement | Support for judgement |
| Allocation concealment? | Low risk | A ‐ Adequate |
| Methods | 1. Blinding of randomisation: Yes (only for formula milk groups) | |
| Participants | 106 preterm infants of birth weight less than 2100g, but between 10th and 90th centiles for birth weight. Infants excluded if evidence of "physical abnormality or obvious disease". Premature Unit, Helsinki University Children's Hospital. 1972 to 1975. | |
| Interventions | Term formula milk (N= 84) versus unfortified donor breast milk (N= 22). Feeds continued until a weight of 2.4 kg was attained or until infants were withdrawn from the study because of a "medical complication". | |
| Outcomes | Time, from birth, to regain birth weight. Rate of weight change from birth and from point of regained birth weight. | |
| Notes | Allocation to the formula milks was undertaken using a random sequence of four numbers, but every fifth infant was allocated to receive term human milk, so allocation concealment may have been sub‐optimal. | |
| Risk of bias | ||
| Bias | Authors' judgement | Support for judgement |
| Allocation concealment? | Unclear risk | B ‐ Unclear |
| Methods | 1. Blinding of randomisation: Yes | |
| Participants | 173 infants of gestational age less than 30 weeks', whose mothers intended to breastfeed but whose own milk became insufficient from birth until 90 days of age or hospital discharge. | |
| Interventions | Preterm formula milk (N= 81) versus unfortified donor breast milk (N=92) given as a supplement to maternal breast milk. | |
| Outcomes | Incidence of late‐onset invasive infection and/or necrotising enterocolitis, duration of hospitalisation and growth during the study period (weight gain, head circumference increment, and length increment). | |
| Notes | Participating infants received small quantities (20 ml per kg per day) of their own mother's milk during the first week after birth and continued for 3‐5 days before the volume was advanced. Milk intake was increased by 20 ml per kg per day to 100 ml per kg at which time human milk fortifier was added. Subsequently the volume of fortified human milk was advanced by 20 m//kg per day until 160 mL/kg per day was achieved. If no mother's milk was available and the baby was assigned to donor breast milk then a similar advancement and fortification protocol was followed. For all infants, adjustments in milk intake between 160 and 200 mL/kg per day were recommended to ensure an average weekly weight gain of at least 15 g/kg per day. | |
| Risk of bias | ||
| Bias | Authors' judgement | Support for judgement |
| Allocation concealment? | Low risk | A ‐ Adequate |
| Methods | 1. Blinding of randomisation: Can't tell | |
| Participants | 20 preterm or low birth weight infants; all infants to be "physically normal with no further signs of disease; no further details published. | |
| Interventions | Term formula milk (N= 10) versus donor breast milk (N= 10) for at least four weeks from birth. | |
| Outcomes | Time, from birth, to regain birth weight (mean but no standard deviation reported). | |
| Notes | ||
| Risk of bias | ||
| Bias | Authors' judgement | Support for judgement |
| Allocation concealment? | Unclear risk | B ‐ Unclear |
| Methods | 1. Blinding of randomisation: Yes | |
| Participants | 81 very low birth weight infants, excluding infants with "any significant illness" or those who required ventilatory support at day 10. | |
| Interventions | Preterm formula milk (N= 44) versus donor breast milk (N= 37). The donor breast milk was not Pasteurised. Feeds were allocated on the tenth day of life, and continued until the infant reached a weight of 2000 g or until withdrawn from the study because of "any illness requiring intravenous infusion of fat or protein". | |
| Outcomes | Mean daily rates of change in weight, crown‐heel length and head circumference from the tenth until the thirtieth day of life were reported. | |
| Notes | The feeds were not allocated until the tenth day after birth in order to avoid the use of protein‐enriched formula "when active growth was unlikely". In the first nine days of life the infants received a term formula or maternal expressed breast milk (if available). Although the report gave information on adverse outcomes, including necrotising enterocolitis, the five affected infants were withdrawn from the study and not included in the analyses of growth rates. | |
| Risk of bias | ||
| Bias | Authors' judgement | Support for judgement |
| Allocation concealment? | Low risk | A ‐ Adequate |
Characteristics of excluded studies [ordered by study ID]
Ir a:
| Study | Reason for exclusion |
| Cooper 1984 measured growth and adverse events in preterm infants fed preterm formula or donor breast milk, but for most participants the feeding group was not allocated randomly. | |
| Jarvenpaa 1983 compared growth in low birth weight infants fed formula verus breast milk. However, the allocation was not random since those infants whose mothers chose to provide their own milk were selectively assigned to the human milk group. | |
| Narayanan 1982 reported a block randomised trial in low birth weight infants of feeding with formula milk versus "expressed human milk", the latter being a mixture of preterm and term human milk. The randomised blocked design was followed strictly at first, but in the second year, many of the low birth weight infants were allocated to one of the human milk groups (rather than the formula group). Hence, the data for year 1 are completely random (all 4 groups can be compared and be included in our review), but the data for year 2 (and beyond) were not completely random (and should not be included). The authors reported that the results in the random and "non‐random" phases were similar and therefore presented the combined results. The authors have been contacted to see if the results for year 1 are available separately. | |
| O'Connor 2003 compared growth, feeding tolerance, morbidity and development in 463 low birth weight infants fed human milk or formula. However, the feeding groups were not randomly allocated. | |
| Although not clearly stated in the title or abstract, feeds do not appear to have been randomly assigned. | |
| Svenningsen 1982 randomly assigned 48 low birth weight infants to formula milk versus breast milk. However, most infants in the breast milk group received their own mother's expressed milk rather than donor breast milk. |
Data and analyses
| Outcome or subgroup title | No. of studies | No. of participants | Statistical method | Effect size |
| 1 Time to regain birth weight (days from birth) Show forest plot | 2 | 166 | Mean Difference (IV, Fixed, 95% CI) | ‐2.00 [‐5.81, ‐2.18] |
| Analysis 1.1  Comparison 1 Formula milk versus donor breast milk, Outcome 1 Time to regain birth weight (days from birth). | ||||
| 2 Short term weight change (g/kg/day) Show forest plot | 7 | 649 | Mean Difference (IV, Fixed, 95% CI) | 2.59 [1.99, 3.20] |
| Analysis 1.2  Comparison 1 Formula milk versus donor breast milk, Outcome 2 Short term weight change (g/kg/day). | ||||
| 3 Short term change in crown‐heel length (mm/week) Show forest plot | 6 | 441 | Mean Difference (IV, Fixed, 95% CI) | 1.14 [0.61, 1.67] |
| Analysis 1.3  Comparison 1 Formula milk versus donor breast milk, Outcome 3 Short term change in crown‐heel length (mm/week). | ||||
| 4 Short term change in crown‐rump length (mm/week) Show forest plot | 1 | 106 | Mean Difference (IV, Fixed, 95% CI) | 0.59 [0.08, 1.10] |
| Analysis 1.4  Comparison 1 Formula milk versus donor breast milk, Outcome 4 Short term change in crown‐rump length (mm/week). | ||||
| 5 Short term change in femoral length (mm/week) Show forest plot | 1 | 106 | Mean Difference (IV, Fixed, 95% CI) | 0.34 [0.13, 0.55] |
| Analysis 1.5  Comparison 1 Formula milk versus donor breast milk, Outcome 5 Short term change in femoral length (mm/week). | ||||
| 6 Short term change in head circumference (mm/week) Show forest plot | 6 | 515 | Mean Difference (IV, Fixed, 95% CI) | 1.25 [0.75, 1.75] |
| Analysis 1.6  Comparison 1 Formula milk versus donor breast milk, Outcome 6 Short term change in head circumference (mm/week). | ||||
| 7 Weight (kg) at 9 months post term Show forest plot | 2 | 369 | Mean Difference (IV, Fixed, 95% CI) | ‐0.03 [‐0.26, 0.21] |
| Analysis 1.7  Comparison 1 Formula milk versus donor breast milk, Outcome 7 Weight (kg) at 9 months post term. | ||||
| 8 Length (cm) at 9 months post term Show forest plot | 2 | 369 | Mean Difference (IV, Fixed, 95% CI) | 0.03 [‐0.64, 0.70] |
| Analysis 1.8  Comparison 1 Formula milk versus donor breast milk, Outcome 8 Length (cm) at 9 months post term. | ||||
| 9 Head circumference (cm) at 9 months post term Show forest plot | 2 | 369 | Mean Difference (IV, Fixed, 95% CI) | 0.20 [‐0.13, 0.53] |
| Analysis 1.9  Comparison 1 Formula milk versus donor breast milk, Outcome 9 Head circumference (cm) at 9 months post term. | ||||
| 10 Weight (kg) at 18 months post term Show forest plot | 2 | 438 | Mean Difference (IV, Fixed, 95% CI) | 0.10 [‐0.15, 0.35] |
| Analysis 1.10  Comparison 1 Formula milk versus donor breast milk, Outcome 10 Weight (kg) at 18 months post term. | ||||
| 11 Length (cm) at 18 months post term Show forest plot | 2 | 438 | Mean Difference (IV, Fixed, 95% CI) | 0.53 [‐0.15, 1.20] |
| Analysis 1.11  Comparison 1 Formula milk versus donor breast milk, Outcome 11 Length (cm) at 18 months post term. | ||||
| 12 Head circumference (cm) at 18 months post term Show forest plot | 2 | 438 | Mean Difference (IV, Fixed, 95% CI) | 0.10 [‐0.19, 0.39] |
| Analysis 1.12  Comparison 1 Formula milk versus donor breast milk, Outcome 12 Head circumference (cm) at 18 months post term. | ||||
| 13 Weight (kg) at 7.5‐8 years of age Show forest plot | 2 | 420 | Mean Difference (IV, Fixed, 95% CI) | ‐0.56 [‐1.42, 0.29] |
| Analysis 1.13  Comparison 1 Formula milk versus donor breast milk, Outcome 13 Weight (kg) at 7.5‐8 years of age. | ||||
| 14 Length (cm) at 7.5‐8 years of age Show forest plot | 2 | 420 | Mean Difference (IV, Fixed, 95% CI) | 0.05 [‐1.12, 1.23] |
| Analysis 1.14  Comparison 1 Formula milk versus donor breast milk, Outcome 14 Length (cm) at 7.5‐8 years of age. | ||||
| 15 Head circumference (cm) at 7.5‐8 years of age Show forest plot | 2 | 420 | Mean Difference (IV, Fixed, 95% CI) | ‐0.19 [‐0.54, 0.16] |
| Analysis 1.15  Comparison 1 Formula milk versus donor breast milk, Outcome 15 Head circumference (cm) at 7.5‐8 years of age. | ||||
| 16 Bayley mental development index at 18 months Show forest plot | 2 | 387 | Mean Difference (IV, Fixed, 95% CI) | 1.24 [‐2.62, 5.09] |
| Analysis 1.16  Comparison 1 Formula milk versus donor breast milk, Outcome 16 Bayley mental development index at 18 months. | ||||
| 17 Bayley psychomotor development index at 18 months Show forest plot | 2 | 387 | Mean Difference (IV, Fixed, 95% CI) | ‐0.32 [‐3.43, 2.79] |
| Analysis 1.17  Comparison 1 Formula milk versus donor breast milk, Outcome 17 Bayley psychomotor development index at 18 months. | ||||
| 18 Neurological impairment at 18 months Show forest plot | 2 | 400 | Risk Ratio (M‐H, Fixed, 95% CI) | 1.21 [0.62, 2.35] |
| Analysis 1.18  Comparison 1 Formula milk versus donor breast milk, Outcome 18 Neurological impairment at 18 months. | ||||
| 19 Mortality Show forest plot | 3 | 668 | Risk Ratio (M‐H, Fixed, 95% CI) | 1.23 [0.72, 2.11] |
| Analysis 1.19  Comparison 1 Formula milk versus donor breast milk, Outcome 19 Mortality. | ||||
| 20 Necrotising enterocolitis Show forest plot | 5 | 816 | Risk Ratio (M‐H, Fixed, 95% CI) | 2.46 [1.19, 5.08] |
| Analysis 1.20  Comparison 1 Formula milk versus donor breast milk, Outcome 20 Necrotising enterocolitis. | ||||
| 21 Suspected necrotising enterocolitis Show forest plot | 3 | 583 | Risk Ratio (M‐H, Fixed, 95% CI) | 1.41 [0.73, 2.71] |
| Analysis 1.21  Comparison 1 Formula milk versus donor breast milk, Outcome 21 Suspected necrotising enterocolitis. | ||||
| 22 Feed intolerance or diarrhoea Show forest plot | 2 | 148 | Risk Ratio (M‐H, Fixed, 95% CI) | 4.92 [1.17, 20.70] |
| Analysis 1.22  Comparison 1 Formula milk versus donor breast milk, Outcome 22 Feed intolerance or diarrhoea. | ||||
| 23 Incidence of invasive infection Show forest plot | 1 | 166 | Risk Ratio (M‐H, Fixed, 95% CI) | 0.98 [0.66, 1.44] |
| Analysis 1.23  Comparison 1 Formula milk versus donor breast milk, Outcome 23 Incidence of invasive infection. | ||||
| Outcome or subgroup title | No. of studies | No. of participants | Statistical method | Effect size |
| 1 Short term weight change (g/kg/day) Show forest plot | 3 | 234 | Mean Difference (IV, Fixed, 95% CI) | 1.74 [0.96, 2.53] |
| Analysis 2.1  Comparison 2 Term formula versus donor breast milk, Outcome 1 Short term weight change (g/kg/day). | ||||
| 2 Short term change in crown‐heel length (mm/week) Show forest plot | 2 | 128 | Mean Difference (IV, Fixed, 95% CI) | 0.80 [0.10, 1.50] |
| Analysis 2.2  Comparison 2 Term formula versus donor breast milk, Outcome 2 Short term change in crown‐heel length (mm/week). | ||||
| 3 Short term change in head circumference (mm/week) Show forest plot | 2 | 128 | Mean Difference (IV, Fixed, 95% CI) | 0.81 [0.15, 1.47] |
| Analysis 2.3  Comparison 2 Term formula versus donor breast milk, Outcome 3 Short term change in head circumference (mm/week). | ||||
| 4 Necrotising enterocolitis Show forest plot | 1 | 67 | Risk Ratio (M‐H, Fixed, 95% CI) | 4.73 [0.52, 43.09] |
| Analysis 2.4  Comparison 2 Term formula versus donor breast milk, Outcome 4 Necrotising enterocolitis. | ||||
| 5 Feed intolerance or diarrhoea Show forest plot | 1 | 67 | Risk Ratio (M‐H, Fixed, 95% CI) | 9.46 [1.21, 74.17] |
| Analysis 2.5  Comparison 2 Term formula versus donor breast milk, Outcome 5 Feed intolerance or diarrhoea. | ||||
| Outcome or subgroup title | No. of studies | No. of participants | Statistical method | Effect size |
| 1 Short term weight change (g/kg/day) Show forest plot | 4 | 415 | Mean Difference (IV, Fixed, 95% CI) | 3.83 [2.88, 4.78] |
| Analysis 3.1  Comparison 3 Preterm formula versus donor breast milk, Outcome 1 Short term weight change (g/kg/day). | ||||
| 2 Short term change in crown‐heel length (mm/week) Show forest plot | 4 | 313 | Mean Difference (IV, Fixed, 95% CI) | 1.61 [0.79, 2.42] |
| Analysis 3.2  Comparison 3 Preterm formula versus donor breast milk, Outcome 2 Short term change in crown‐heel length (mm/week). | ||||
| 3 Short term change in head circumference (mm/week) Show forest plot | 4 | 387 | Mean Difference (IV, Fixed, 95% CI) | 1.84 [1.07, 2.61] |
| Analysis 3.3  Comparison 3 Preterm formula versus donor breast milk, Outcome 3 Short term change in head circumference (mm/week). | ||||
| 4 Necrotising enterocolitis Show forest plot | 4 | 749 | Risk Ratio (M‐H, Fixed, 95% CI) | 2.26 [1.04, 4.90] |
| Analysis 3.4  Comparison 3 Preterm formula versus donor breast milk, Outcome 4 Necrotising enterocolitis. | ||||
| 5 Feed intolerance or diarrhoea Show forest plot | 1 | 81 | Risk Ratio (M‐H, Fixed, 95% CI) | 1.68 [0.16, 17.82] |
| Analysis 3.5  Comparison 3 Preterm formula versus donor breast milk, Outcome 5 Feed intolerance or diarrhoea. | ||||
| Outcome or subgroup title | No. of studies | No. of participants | Statistical method | Effect size |
| 1 Short term weight change (g/kg/day) Show forest plot | 5 | 368 | Mean Difference (IV, Fixed, 95% CI) | 2.68 [1.96, 3.41] |
| Analysis 4.1  Comparison 4 Formula milk given as a sole diet versus donor breast milk given as a sole diet, Outcome 1 Short term weight change (g/kg/day). | ||||
| 2 Short term change in crown‐heel length (mm/week) Show forest plot | 4 | 230 | Mean Difference (IV, Fixed, 95% CI) | 1.28 [0.66, 1.90] |
| Analysis 4.2  Comparison 4 Formula milk given as a sole diet versus donor breast milk given as a sole diet, Outcome 2 Short term change in crown‐heel length (mm/week). | ||||
| 3 Short term change in head circumference (mm/week) Show forest plot | 4 | 252 | Mean Difference (IV, Fixed, 95% CI) | 1.45 [0.88, 2.02] |
| Analysis 4.3  Comparison 4 Formula milk given as a sole diet versus donor breast milk given as a sole diet, Outcome 3 Short term change in head circumference (mm/week). | ||||
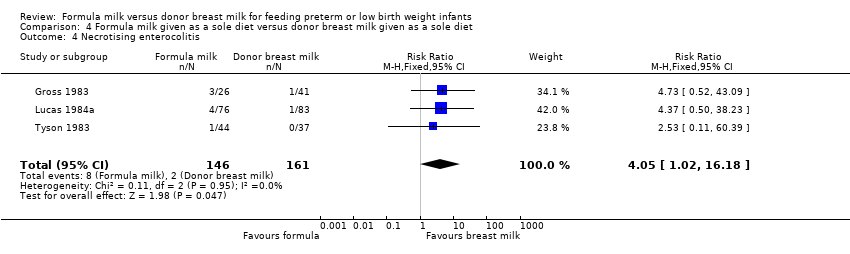
| 4 Necrotising enterocolitis Show forest plot | 3 | 307 | Risk Ratio (M‐H, Fixed, 95% CI) | 4.05 [1.02, 16.18] |
| Analysis 4.4  Comparison 4 Formula milk given as a sole diet versus donor breast milk given as a sole diet, Outcome 4 Necrotising enterocolitis. | ||||
| Outcome or subgroup title | No. of studies | No. of participants | Statistical method | Effect size |
| 1 Short term weight change (g/kg/day) Show forest plot | 2 | 281 | Mean Difference (IV, Fixed, 95% CI) | 2.39 [1.28, 3.50] |
| Analysis 5.1  Comparison 5 Formula milk versus donor breast milk given as a supplement to maternal breast milk, Outcome 1 Short term weight change (g/kg/day). | ||||
| 2 Short term change in crown‐heel length (mm/week) Show forest plot | 2 | 211 | Mean Difference (IV, Fixed, 95% CI) | 0.75 [‐0.28, 1.78] |
| Analysis 5.2  Comparison 5 Formula milk versus donor breast milk given as a supplement to maternal breast milk, Outcome 2 Short term change in crown‐heel length (mm/week). | ||||
| 3 Short term change in head circumference (mm/week) Show forest plot | 2 | 263 | Mean Difference (IV, Fixed, 95% CI) | 0.59 [‐0.44, 1.62] |
| Analysis 5.3  Comparison 5 Formula milk versus donor breast milk given as a supplement to maternal breast milk, Outcome 3 Short term change in head circumference (mm/week). | ||||
| 4 Mortality Show forest plot | 2 | 509 | Risk Ratio (M‐H, Fixed, 95% CI) | 1.16 [0.60, 2.24] |
| Analysis 5.4  Comparison 5 Formula milk versus donor breast milk given as a supplement to maternal breast milk, Outcome 4 Mortality. | ||||
| 5 Necrotising enterocolitis Show forest plot | 2 | 509 | Risk Ratio (M‐H, Fixed, 95% CI) | 1.96 [0.82, 4.67] |
| Analysis 5.5  Comparison 5 Formula milk versus donor breast milk given as a supplement to maternal breast milk, Outcome 5 Necrotising enterocolitis. | ||||
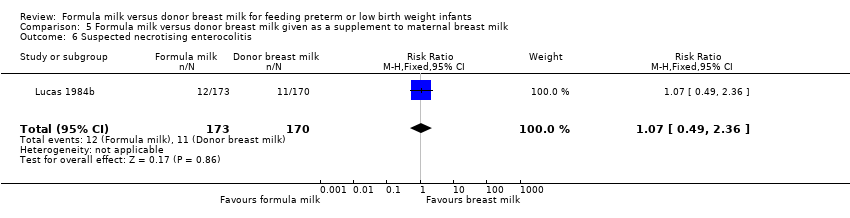
| 6 Suspected necrotising enterocolitis Show forest plot | 1 | 343 | Risk Ratio (M‐H, Fixed, 95% CI) | 1.07 [0.49, 2.36] |
| Analysis 5.6  Comparison 5 Formula milk versus donor breast milk given as a supplement to maternal breast milk, Outcome 6 Suspected necrotising enterocolitis. | ||||

Comparison 1 Formula milk versus donor breast milk, Outcome 1 Time to regain birth weight (days from birth).

Comparison 1 Formula milk versus donor breast milk, Outcome 2 Short term weight change (g/kg/day).

Comparison 1 Formula milk versus donor breast milk, Outcome 3 Short term change in crown‐heel length (mm/week).

Comparison 1 Formula milk versus donor breast milk, Outcome 4 Short term change in crown‐rump length (mm/week).

Comparison 1 Formula milk versus donor breast milk, Outcome 5 Short term change in femoral length (mm/week).
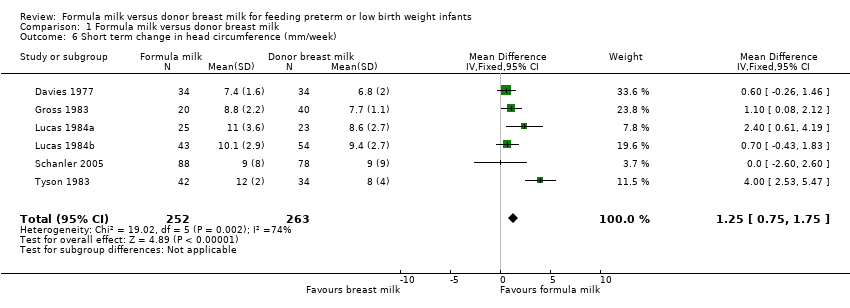
Comparison 1 Formula milk versus donor breast milk, Outcome 6 Short term change in head circumference (mm/week).

Comparison 1 Formula milk versus donor breast milk, Outcome 7 Weight (kg) at 9 months post term.

Comparison 1 Formula milk versus donor breast milk, Outcome 8 Length (cm) at 9 months post term.

Comparison 1 Formula milk versus donor breast milk, Outcome 9 Head circumference (cm) at 9 months post term.

Comparison 1 Formula milk versus donor breast milk, Outcome 10 Weight (kg) at 18 months post term.

Comparison 1 Formula milk versus donor breast milk, Outcome 11 Length (cm) at 18 months post term.

Comparison 1 Formula milk versus donor breast milk, Outcome 12 Head circumference (cm) at 18 months post term.

Comparison 1 Formula milk versus donor breast milk, Outcome 13 Weight (kg) at 7.5‐8 years of age.
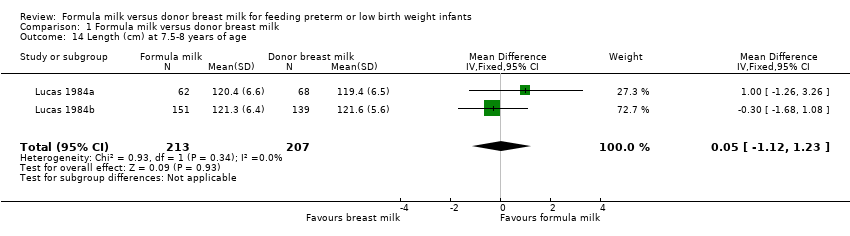
Comparison 1 Formula milk versus donor breast milk, Outcome 14 Length (cm) at 7.5‐8 years of age.

Comparison 1 Formula milk versus donor breast milk, Outcome 15 Head circumference (cm) at 7.5‐8 years of age.
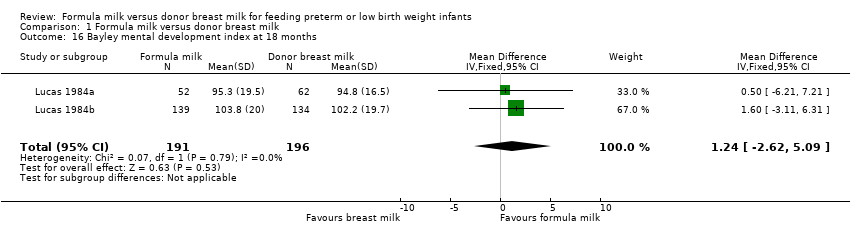
Comparison 1 Formula milk versus donor breast milk, Outcome 16 Bayley mental development index at 18 months.

Comparison 1 Formula milk versus donor breast milk, Outcome 17 Bayley psychomotor development index at 18 months.
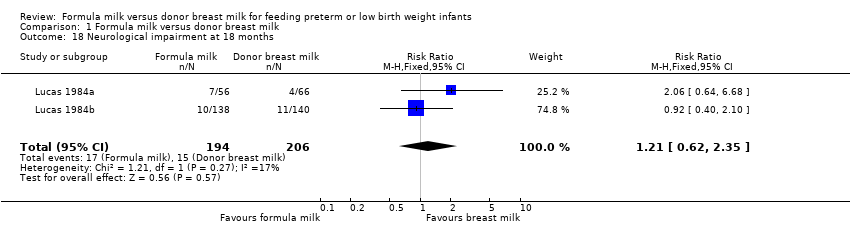
Comparison 1 Formula milk versus donor breast milk, Outcome 18 Neurological impairment at 18 months.

Comparison 1 Formula milk versus donor breast milk, Outcome 19 Mortality.
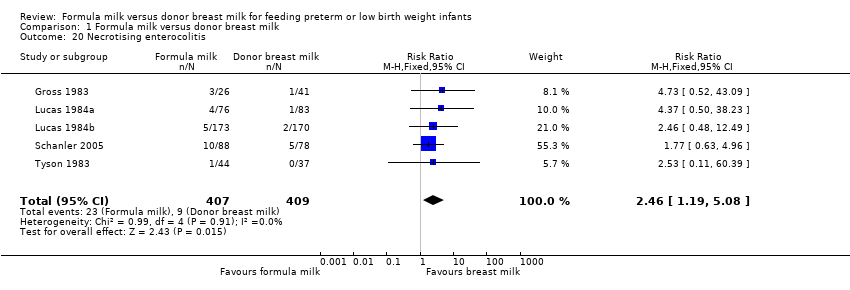
Comparison 1 Formula milk versus donor breast milk, Outcome 20 Necrotising enterocolitis.
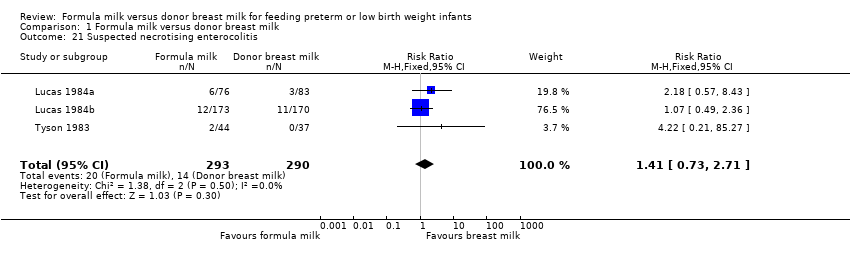
Comparison 1 Formula milk versus donor breast milk, Outcome 21 Suspected necrotising enterocolitis.
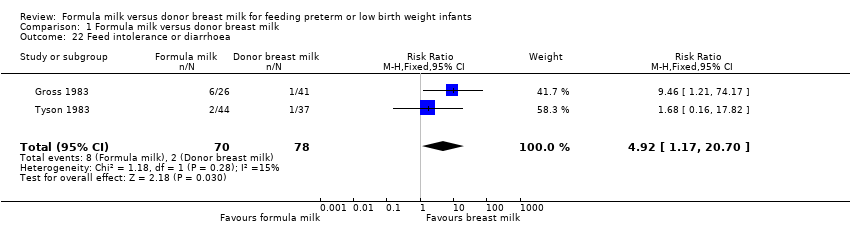
Comparison 1 Formula milk versus donor breast milk, Outcome 22 Feed intolerance or diarrhoea.
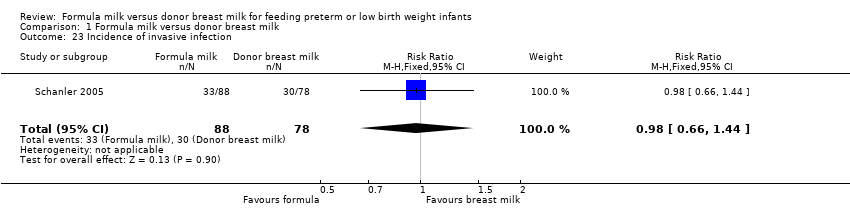
Comparison 1 Formula milk versus donor breast milk, Outcome 23 Incidence of invasive infection.
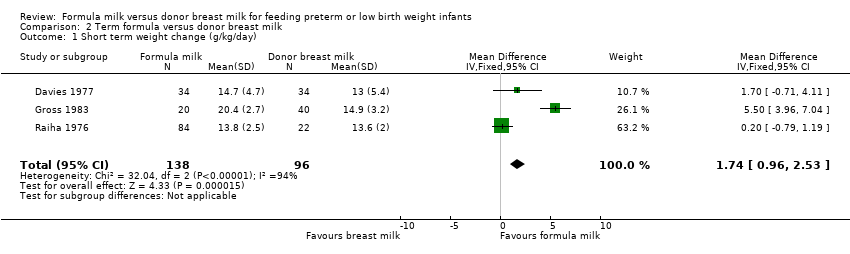
Comparison 2 Term formula versus donor breast milk, Outcome 1 Short term weight change (g/kg/day).

Comparison 2 Term formula versus donor breast milk, Outcome 2 Short term change in crown‐heel length (mm/week).
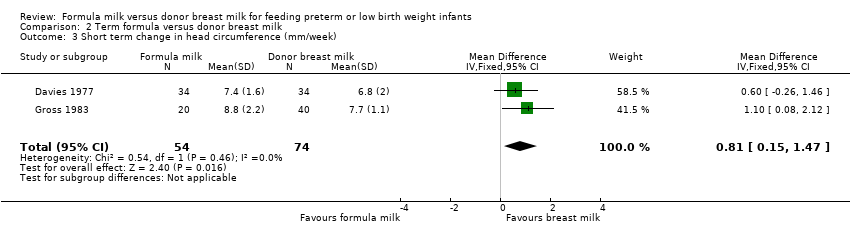
Comparison 2 Term formula versus donor breast milk, Outcome 3 Short term change in head circumference (mm/week).
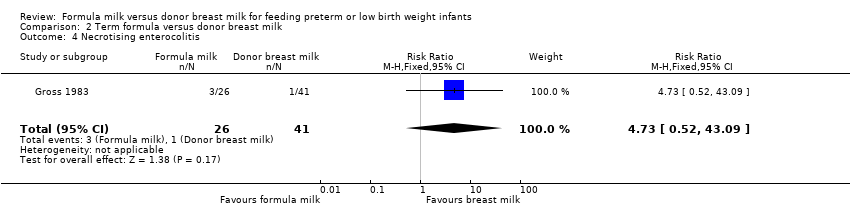
Comparison 2 Term formula versus donor breast milk, Outcome 4 Necrotising enterocolitis.

Comparison 2 Term formula versus donor breast milk, Outcome 5 Feed intolerance or diarrhoea.
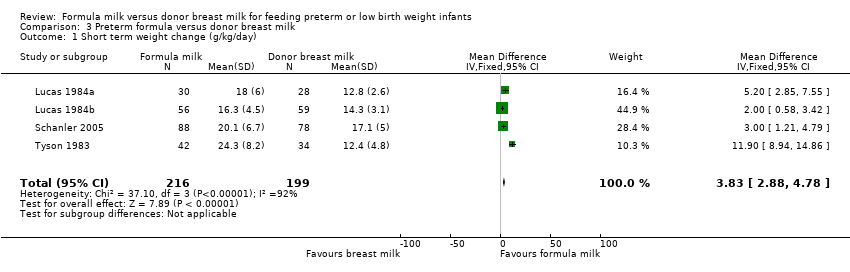
Comparison 3 Preterm formula versus donor breast milk, Outcome 1 Short term weight change (g/kg/day).
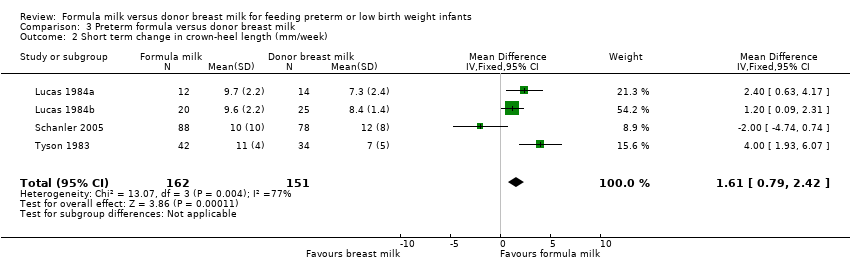
Comparison 3 Preterm formula versus donor breast milk, Outcome 2 Short term change in crown‐heel length (mm/week).
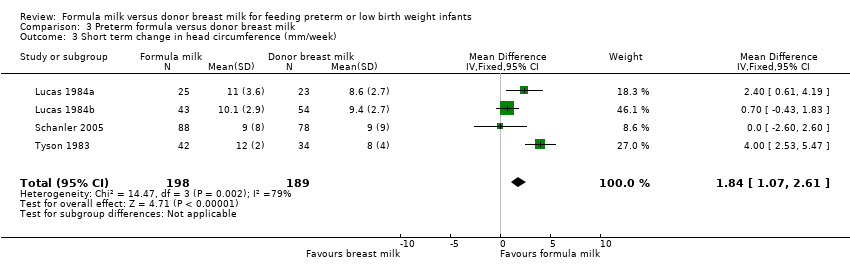
Comparison 3 Preterm formula versus donor breast milk, Outcome 3 Short term change in head circumference (mm/week).
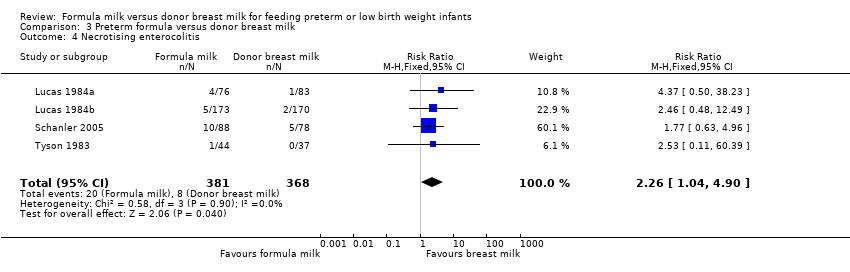
Comparison 3 Preterm formula versus donor breast milk, Outcome 4 Necrotising enterocolitis.
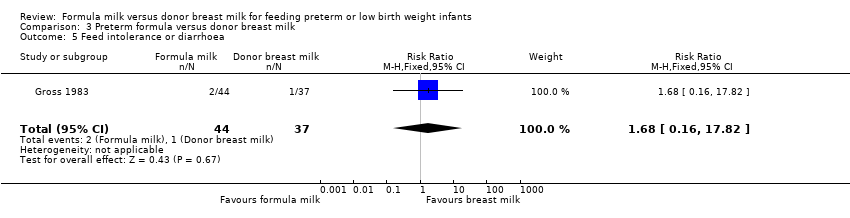
Comparison 3 Preterm formula versus donor breast milk, Outcome 5 Feed intolerance or diarrhoea.

Comparison 4 Formula milk given as a sole diet versus donor breast milk given as a sole diet, Outcome 1 Short term weight change (g/kg/day).

Comparison 4 Formula milk given as a sole diet versus donor breast milk given as a sole diet, Outcome 2 Short term change in crown‐heel length (mm/week).

Comparison 4 Formula milk given as a sole diet versus donor breast milk given as a sole diet, Outcome 3 Short term change in head circumference (mm/week).
Comparison 4 Formula milk given as a sole diet versus donor breast milk given as a sole diet, Outcome 4 Necrotising enterocolitis.

Comparison 5 Formula milk versus donor breast milk given as a supplement to maternal breast milk, Outcome 1 Short term weight change (g/kg/day).

Comparison 5 Formula milk versus donor breast milk given as a supplement to maternal breast milk, Outcome 2 Short term change in crown‐heel length (mm/week).

Comparison 5 Formula milk versus donor breast milk given as a supplement to maternal breast milk, Outcome 3 Short term change in head circumference (mm/week).

Comparison 5 Formula milk versus donor breast milk given as a supplement to maternal breast milk, Outcome 4 Mortality.

Comparison 5 Formula milk versus donor breast milk given as a supplement to maternal breast milk, Outcome 5 Necrotising enterocolitis.
Comparison 5 Formula milk versus donor breast milk given as a supplement to maternal breast milk, Outcome 6 Suspected necrotising enterocolitis.
| Outcome or subgroup title | No. of studies | No. of participants | Statistical method | Effect size |
| 1 Time to regain birth weight (days from birth) Show forest plot | 2 | 166 | Mean Difference (IV, Fixed, 95% CI) | ‐2.00 [‐5.81, ‐2.18] |
| 2 Short term weight change (g/kg/day) Show forest plot | 7 | 649 | Mean Difference (IV, Fixed, 95% CI) | 2.59 [1.99, 3.20] |
| 3 Short term change in crown‐heel length (mm/week) Show forest plot | 6 | 441 | Mean Difference (IV, Fixed, 95% CI) | 1.14 [0.61, 1.67] |
| 4 Short term change in crown‐rump length (mm/week) Show forest plot | 1 | 106 | Mean Difference (IV, Fixed, 95% CI) | 0.59 [0.08, 1.10] |
| 5 Short term change in femoral length (mm/week) Show forest plot | 1 | 106 | Mean Difference (IV, Fixed, 95% CI) | 0.34 [0.13, 0.55] |
| 6 Short term change in head circumference (mm/week) Show forest plot | 6 | 515 | Mean Difference (IV, Fixed, 95% CI) | 1.25 [0.75, 1.75] |
| 7 Weight (kg) at 9 months post term Show forest plot | 2 | 369 | Mean Difference (IV, Fixed, 95% CI) | ‐0.03 [‐0.26, 0.21] |
| 8 Length (cm) at 9 months post term Show forest plot | 2 | 369 | Mean Difference (IV, Fixed, 95% CI) | 0.03 [‐0.64, 0.70] |
| 9 Head circumference (cm) at 9 months post term Show forest plot | 2 | 369 | Mean Difference (IV, Fixed, 95% CI) | 0.20 [‐0.13, 0.53] |
| 10 Weight (kg) at 18 months post term Show forest plot | 2 | 438 | Mean Difference (IV, Fixed, 95% CI) | 0.10 [‐0.15, 0.35] |
| 11 Length (cm) at 18 months post term Show forest plot | 2 | 438 | Mean Difference (IV, Fixed, 95% CI) | 0.53 [‐0.15, 1.20] |
| 12 Head circumference (cm) at 18 months post term Show forest plot | 2 | 438 | Mean Difference (IV, Fixed, 95% CI) | 0.10 [‐0.19, 0.39] |
| 13 Weight (kg) at 7.5‐8 years of age Show forest plot | 2 | 420 | Mean Difference (IV, Fixed, 95% CI) | ‐0.56 [‐1.42, 0.29] |
| 14 Length (cm) at 7.5‐8 years of age Show forest plot | 2 | 420 | Mean Difference (IV, Fixed, 95% CI) | 0.05 [‐1.12, 1.23] |
| 15 Head circumference (cm) at 7.5‐8 years of age Show forest plot | 2 | 420 | Mean Difference (IV, Fixed, 95% CI) | ‐0.19 [‐0.54, 0.16] |
| 16 Bayley mental development index at 18 months Show forest plot | 2 | 387 | Mean Difference (IV, Fixed, 95% CI) | 1.24 [‐2.62, 5.09] |
| 17 Bayley psychomotor development index at 18 months Show forest plot | 2 | 387 | Mean Difference (IV, Fixed, 95% CI) | ‐0.32 [‐3.43, 2.79] |
| 18 Neurological impairment at 18 months Show forest plot | 2 | 400 | Risk Ratio (M‐H, Fixed, 95% CI) | 1.21 [0.62, 2.35] |
| 19 Mortality Show forest plot | 3 | 668 | Risk Ratio (M‐H, Fixed, 95% CI) | 1.23 [0.72, 2.11] |
| 20 Necrotising enterocolitis Show forest plot | 5 | 816 | Risk Ratio (M‐H, Fixed, 95% CI) | 2.46 [1.19, 5.08] |
| 21 Suspected necrotising enterocolitis Show forest plot | 3 | 583 | Risk Ratio (M‐H, Fixed, 95% CI) | 1.41 [0.73, 2.71] |
| 22 Feed intolerance or diarrhoea Show forest plot | 2 | 148 | Risk Ratio (M‐H, Fixed, 95% CI) | 4.92 [1.17, 20.70] |
| 23 Incidence of invasive infection Show forest plot | 1 | 166 | Risk Ratio (M‐H, Fixed, 95% CI) | 0.98 [0.66, 1.44] |
| Outcome or subgroup title | No. of studies | No. of participants | Statistical method | Effect size |
| 1 Short term weight change (g/kg/day) Show forest plot | 3 | 234 | Mean Difference (IV, Fixed, 95% CI) | 1.74 [0.96, 2.53] |
| 2 Short term change in crown‐heel length (mm/week) Show forest plot | 2 | 128 | Mean Difference (IV, Fixed, 95% CI) | 0.80 [0.10, 1.50] |
| 3 Short term change in head circumference (mm/week) Show forest plot | 2 | 128 | Mean Difference (IV, Fixed, 95% CI) | 0.81 [0.15, 1.47] |
| 4 Necrotising enterocolitis Show forest plot | 1 | 67 | Risk Ratio (M‐H, Fixed, 95% CI) | 4.73 [0.52, 43.09] |
| 5 Feed intolerance or diarrhoea Show forest plot | 1 | 67 | Risk Ratio (M‐H, Fixed, 95% CI) | 9.46 [1.21, 74.17] |
| Outcome or subgroup title | No. of studies | No. of participants | Statistical method | Effect size |
| 1 Short term weight change (g/kg/day) Show forest plot | 4 | 415 | Mean Difference (IV, Fixed, 95% CI) | 3.83 [2.88, 4.78] |
| 2 Short term change in crown‐heel length (mm/week) Show forest plot | 4 | 313 | Mean Difference (IV, Fixed, 95% CI) | 1.61 [0.79, 2.42] |
| 3 Short term change in head circumference (mm/week) Show forest plot | 4 | 387 | Mean Difference (IV, Fixed, 95% CI) | 1.84 [1.07, 2.61] |
| 4 Necrotising enterocolitis Show forest plot | 4 | 749 | Risk Ratio (M‐H, Fixed, 95% CI) | 2.26 [1.04, 4.90] |
| 5 Feed intolerance or diarrhoea Show forest plot | 1 | 81 | Risk Ratio (M‐H, Fixed, 95% CI) | 1.68 [0.16, 17.82] |
| Outcome or subgroup title | No. of studies | No. of participants | Statistical method | Effect size |
| 1 Short term weight change (g/kg/day) Show forest plot | 5 | 368 | Mean Difference (IV, Fixed, 95% CI) | 2.68 [1.96, 3.41] |
| 2 Short term change in crown‐heel length (mm/week) Show forest plot | 4 | 230 | Mean Difference (IV, Fixed, 95% CI) | 1.28 [0.66, 1.90] |
| 3 Short term change in head circumference (mm/week) Show forest plot | 4 | 252 | Mean Difference (IV, Fixed, 95% CI) | 1.45 [0.88, 2.02] |
| 4 Necrotising enterocolitis Show forest plot | 3 | 307 | Risk Ratio (M‐H, Fixed, 95% CI) | 4.05 [1.02, 16.18] |
| Outcome or subgroup title | No. of studies | No. of participants | Statistical method | Effect size |
| 1 Short term weight change (g/kg/day) Show forest plot | 2 | 281 | Mean Difference (IV, Fixed, 95% CI) | 2.39 [1.28, 3.50] |
| 2 Short term change in crown‐heel length (mm/week) Show forest plot | 2 | 211 | Mean Difference (IV, Fixed, 95% CI) | 0.75 [‐0.28, 1.78] |
| 3 Short term change in head circumference (mm/week) Show forest plot | 2 | 263 | Mean Difference (IV, Fixed, 95% CI) | 0.59 [‐0.44, 1.62] |
| 4 Mortality Show forest plot | 2 | 509 | Risk Ratio (M‐H, Fixed, 95% CI) | 1.16 [0.60, 2.24] |
| 5 Necrotising enterocolitis Show forest plot | 2 | 509 | Risk Ratio (M‐H, Fixed, 95% CI) | 1.96 [0.82, 4.67] |
| 6 Suspected necrotising enterocolitis Show forest plot | 1 | 343 | Risk Ratio (M‐H, Fixed, 95% CI) | 1.07 [0.49, 2.36] |