| 1 Time to regain birth weight (days from birth) Show forest plot | 2 | 166 | Mean Difference (IV, Fixed, 95% CI) | ‐2.00 [‐5.81, ‐2.18] |
|
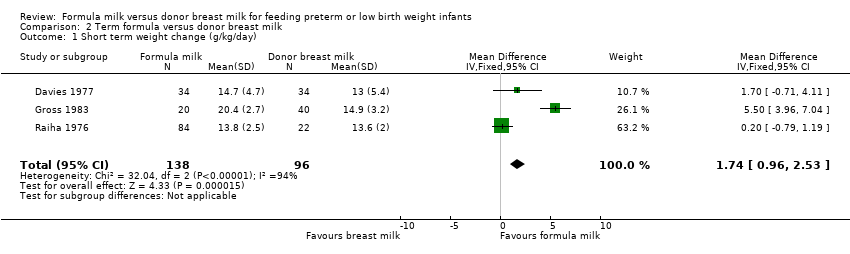
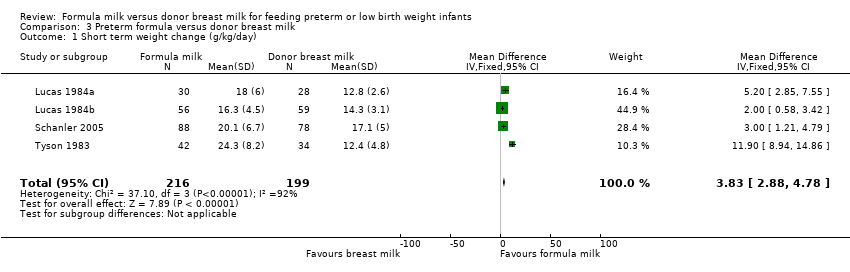
| 2 Short term weight change (g/kg/day) Show forest plot | 7 | 649 | Mean Difference (IV, Fixed, 95% CI) | 2.59 [1.99, 3.20] |
|
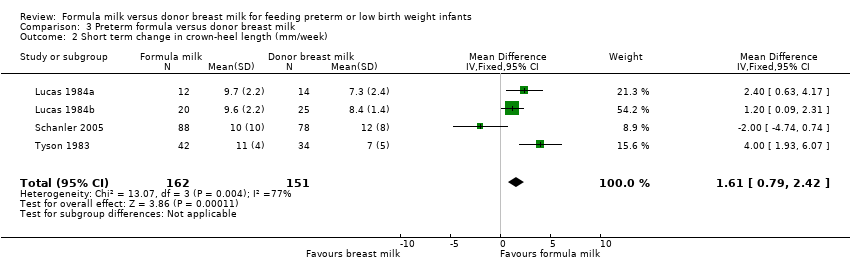
| 3 Short term change in crown‐heel length (mm/week) Show forest plot | 6 | 441 | Mean Difference (IV, Fixed, 95% CI) | 1.14 [0.61, 1.67] |
|
| 4 Short term change in crown‐rump length (mm/week) Show forest plot | 1 | 106 | Mean Difference (IV, Fixed, 95% CI) | 0.59 [0.08, 1.10] |
|
| 5 Short term change in femoral length (mm/week) Show forest plot | 1 | 106 | Mean Difference (IV, Fixed, 95% CI) | 0.34 [0.13, 0.55] |
|
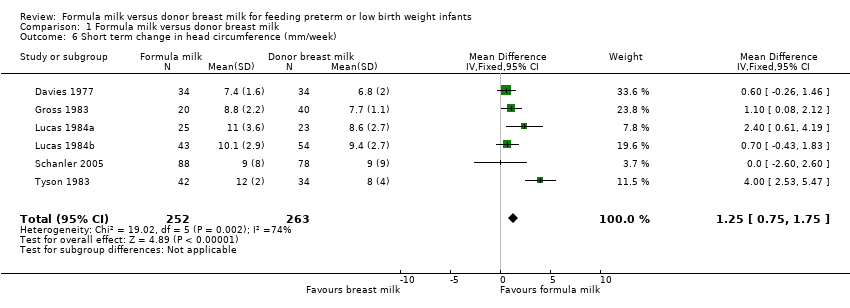
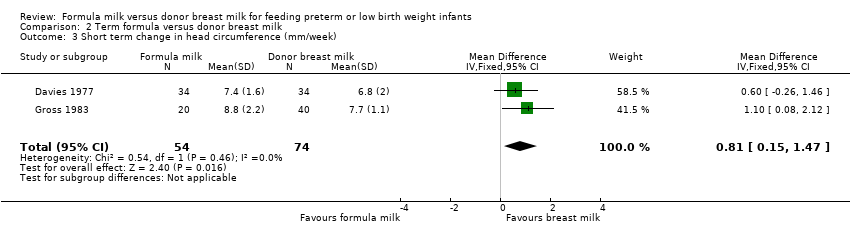
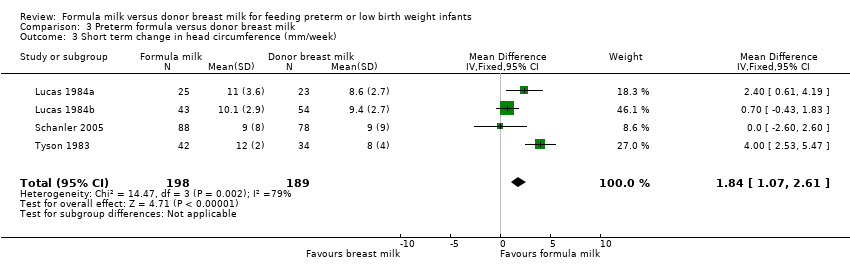
| 6 Short term change in head circumference (mm/week) Show forest plot | 6 | 515 | Mean Difference (IV, Fixed, 95% CI) | 1.25 [0.75, 1.75] |
|
| 7 Weight (kg) at 9 months post term Show forest plot | 2 | 369 | Mean Difference (IV, Fixed, 95% CI) | ‐0.03 [‐0.26, 0.21] |
|
| 8 Length (cm) at 9 months post term Show forest plot | 2 | 369 | Mean Difference (IV, Fixed, 95% CI) | 0.03 [‐0.64, 0.70] |
|
| 9 Head circumference (cm) at 9 months post term Show forest plot | 2 | 369 | Mean Difference (IV, Fixed, 95% CI) | 0.20 [‐0.13, 0.53] |
|
| 10 Weight (kg) at 18 months post term Show forest plot | 2 | 438 | Mean Difference (IV, Fixed, 95% CI) | 0.10 [‐0.15, 0.35] |
|
| 11 Length (cm) at 18 months post term Show forest plot | 2 | 438 | Mean Difference (IV, Fixed, 95% CI) | 0.53 [‐0.15, 1.20] |
|
| 12 Head circumference (cm) at 18 months post term Show forest plot | 2 | 438 | Mean Difference (IV, Fixed, 95% CI) | 0.10 [‐0.19, 0.39] |
|
| 13 Weight (kg) at 7.5‐8 years of age Show forest plot | 2 | 420 | Mean Difference (IV, Fixed, 95% CI) | ‐0.56 [‐1.42, 0.29] |
|
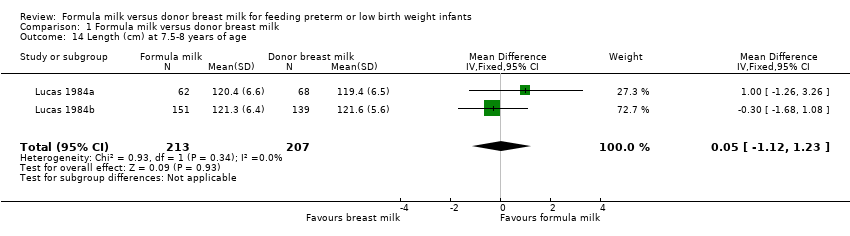
| 14 Length (cm) at 7.5‐8 years of age Show forest plot | 2 | 420 | Mean Difference (IV, Fixed, 95% CI) | 0.05 [‐1.12, 1.23] |
|
| 15 Head circumference (cm) at 7.5‐8 years of age Show forest plot | 2 | 420 | Mean Difference (IV, Fixed, 95% CI) | ‐0.19 [‐0.54, 0.16] |
|
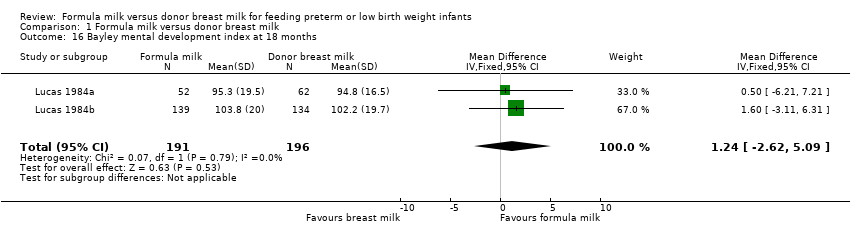
| 16 Bayley mental development index at 18 months Show forest plot | 2 | 387 | Mean Difference (IV, Fixed, 95% CI) | 1.24 [‐2.62, 5.09] |
|
| 17 Bayley psychomotor development index at 18 months Show forest plot | 2 | 387 | Mean Difference (IV, Fixed, 95% CI) | ‐0.32 [‐3.43, 2.79] |
|
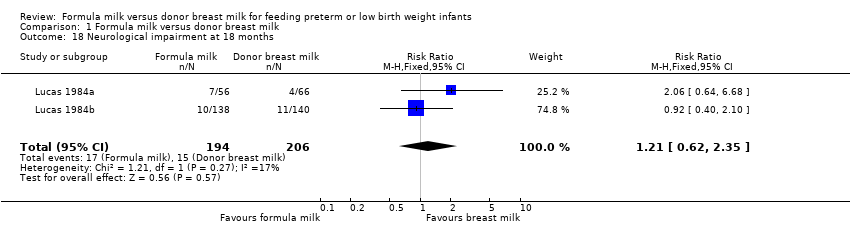
| 18 Neurological impairment at 18 months Show forest plot | 2 | 400 | Risk Ratio (M‐H, Fixed, 95% CI) | 1.21 [0.62, 2.35] |
|
| 19 Mortality Show forest plot | 3 | 668 | Risk Ratio (M‐H, Fixed, 95% CI) | 1.23 [0.72, 2.11] |
|
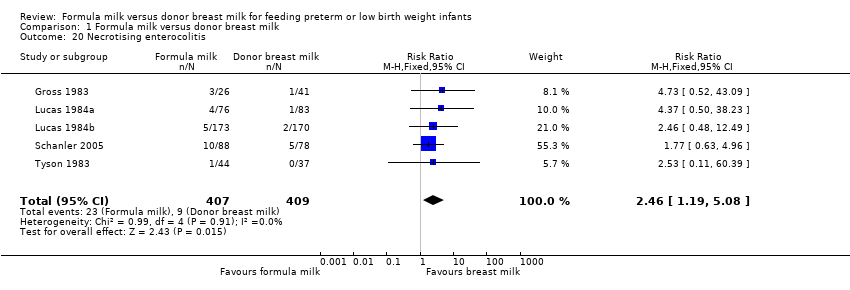
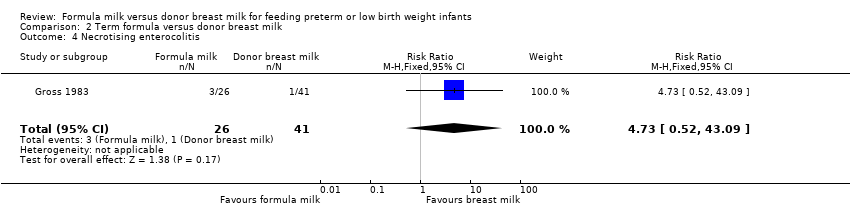
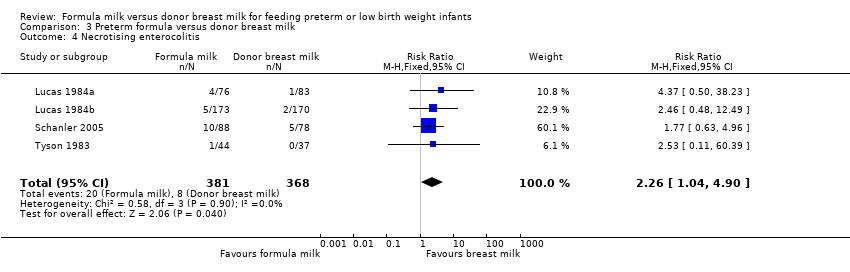
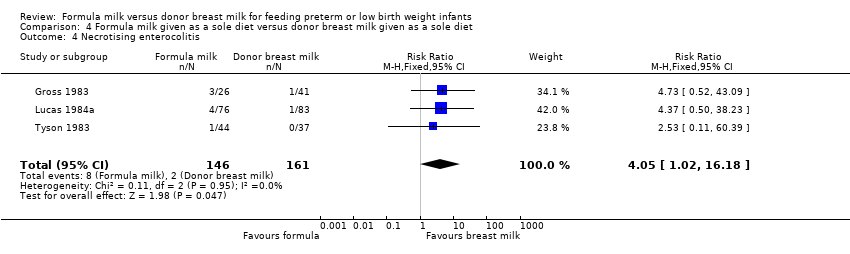
| 20 Necrotising enterocolitis Show forest plot | 5 | 816 | Risk Ratio (M‐H, Fixed, 95% CI) | 2.46 [1.19, 5.08] |
|
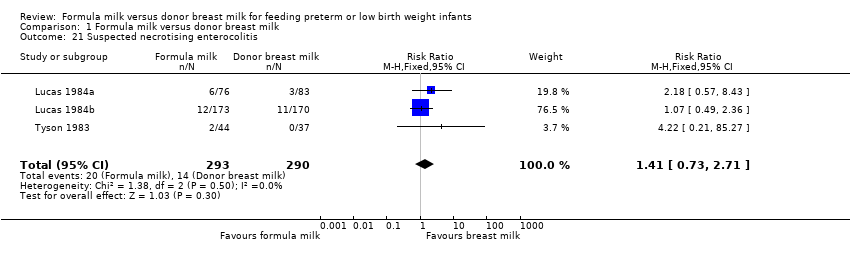
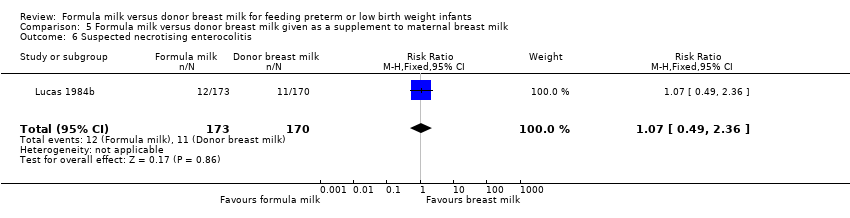
| 21 Suspected necrotising enterocolitis Show forest plot | 3 | 583 | Risk Ratio (M‐H, Fixed, 95% CI) | 1.41 [0.73, 2.71] |
|
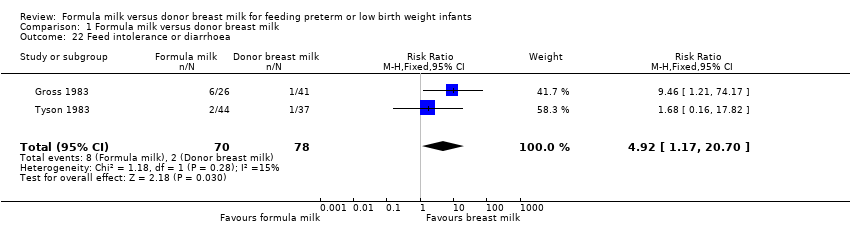
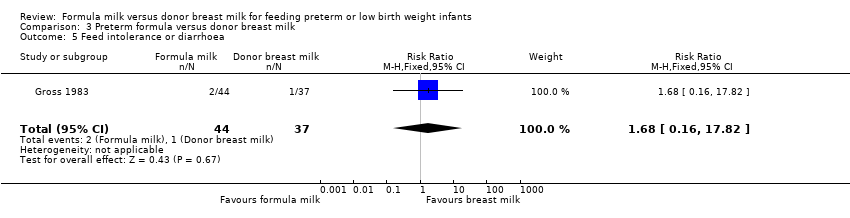
| 22 Feed intolerance or diarrhoea Show forest plot | 2 | 148 | Risk Ratio (M‐H, Fixed, 95% CI) | 4.92 [1.17, 20.70] |
|
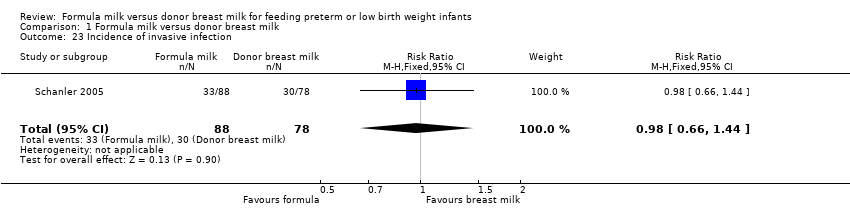
| 23 Incidence of invasive infection Show forest plot | 1 | 166 | Risk Ratio (M‐H, Fixed, 95% CI) | 0.98 [0.66, 1.44] |
|