2型糖尿病に対する運動
アブストラクト
背景
2型糖尿病の人には通常運動が推奨される。しかしながら、いくつかの研究において、食事または行動の変化、またはその両方を含む運動介入を評価したが、食事と運動の効果は区別されていない。いくつかの運動の研究は参加者が少数で、大規模な試験であらわれる有意差を示す検出力が欠如している。
目的
2型糖尿病において運動の効果を評価する。
検索戦略
Cochrane Central Register of Controlled Trials (CENTRAL)、MEDLINE、EMBASEおよび書誌事項のハンドサーチにより該当する試験を同定した。最新の検索の日付は2005年3月3日であった。
選択基準
2型糖尿病の人において、実証されている運動のエアロビクス、フィットネスまたはprogressive resistance trainingをする場合としない場合を比較するすべてのランダム化比較試験。
データ収集と分析
2名のレビューアが別々に試験を選択し、試験の質を評価し、データを抽出した。研究著者にその後追加された情報がないかを問い合わせた。有害作用に関するあらゆる情報を試験から集めた。
主な結果
2型糖尿病において、運動をする場合としない場合を比較する377例を組み入れた14件のランダム化比較試験が同定された。試験期間は8週間から12ヵ月までであった。対照と比較して、運動介入は、糖化ヘモグロビン値の0.6%低下で示されたように、有意に血糖コントロールを改善した(‐0.6% HbA1c、95%信頼区間(CI) ‐0.9~‐0.3、P<0.05)。この結果は、統計的にも臨床的にも有意であった。全体の体格指標に群間で有意差はなかったが、1件の試験で報告されたようにおそらく運動により除脂肪組織量(筋)が増えたためである(6.3kg、95%CI 0.0~12.6)。運動により内臓脂肪組織が減り(‐45.5cm2、95%CI ‐63.8~‐27.3)、皮下脂肪組織も減った。運動群の有害作用や糖尿病合併症を報告した研究はなかった。運動介入はインスリン反応を有意に増加させ(131 AUC、95%CI 20~242)(1件の試験)、血漿トリグリセライドを低下させた(‐0.25mmol/L、95%CI ‐0.48~‐0.02)。QOL(1件の試験)、血漿コレステロールあるいは血圧に、群間で有意差は確認されなかった。
著者の結論
メタアナリシスは、2型糖尿病の人において運動は体重の低下がなくても有意に血糖コントロールを改善し、内臓脂肪組織と血漿トリグリセライドを低下させるが、血漿コレステロールは低下させないことを示している。
PICO
Plain language summary
Exercise for type 2 diabetes mellitus
Exercise, dietary changes and medications are frequently used in the management of type 2 diabetes. However, it is difficult to determine the independent effect of exercise from some trials because exercise has been combined with dietary modifications or medications, or compared with a control which includes another form of intervention. The review authors aimed to determine the effect of exercise on blood sugar control in type 2 diabetes.
This review found that exercise improves blood sugar control and that this effect is evident even without weight loss. Furthermore, exercise decreases body fat content, thus the failure to lose weight with exercise programmes is probably explained by the conversion of fat to muscle. Exercise improved the body's reaction to insulin and decreased blood lipids. Quality of life was only assessed in one study, which found no difference between the two groups. No significant difference was found between groups in blood levels of cholesterol or blood pressure. A total of 14 randomised controlled trials were assessed. These included 377 participants and compared groups that differed only with respect to an exercise programme intervention. The duration of the interventions in the studies ranged from eight weeks to one year. Two studies reported follow‐up information, one at six months after the end of the six month exercise intervention and one at twelve months post‐intervention. Generally, the studies were well‐conducted, but blinding of outcome assessors was not reported and although all studies reported that randomisation was performed, few gave details of the method.
No adverse effects with exercise were reported. The effect of exercise on diabetic complications was not assessed in any of the studies.
The relatively short duration of trials prevented the reporting of any significant long term complications or mortality. Another limitation was the small number of participants included in the analyses for adiposity, blood pressure, cholesterol, body's muscle and quality of life.
Authors' conclusions
Background
Description of the condition
Diabetes mellitus is a metabolic disorder resulting from defective insulin secretion, insulin action, or both. A consequence of this is chronic hyperglycaemia (that is elevated levels of plasma glucose) with disturbances of carbohydrate, fat and protein metabolism. Long‐term complications of diabetes mellitus include retinopathy, nephropathy and neuropathy and increased risk of cardiovascular disease. For a detailed overview of diabetes mellitus, please see 'Additional information' provided by the Metabolic and Endocrine Disorders Group in The Cochrane Library (see 'About The Cochrane Collaboration', 'Collaborative Review Groups'). For an explanation of methodological terms, see the main Glossary in The Cochrane Library .
Description of the intervention
In non‐diabetic participants, studies have shown that exercise reduces hyperglycaemia, insulin resistance, hypertension and dyslipidaemia, and provides a protective effect against cardiovascular disease (ADA 1997; Bouchard 1994; Després 1997; Kelley 1995; NIH 1998; Shaw 2001). Exercise, in addition to diet modification and medication, has long been recommended as one of the three main components to diabetic therapy (Joslin 1959). People with type 2 diabetes are encouraged to increase physical activity, because studies in people without diabetes suggest it may reduce hyperglycaemia and body fat and improve protection against developing cardiovascular complications. The low cost and non‐pharmacological nature of exercise enhances its therapeutic appeal.
Even though exercise is recommended as part of diabetic therapy, its effects in type 2 diabetes are not well documented and there have been no large studies with adequate statistical power to guide practitioners in recommending exercise programmes for the management of type 2 diabetes. Published exercise intervention trials, using different types of intervention, usually have small sample sizes since they are difficult and expensive to conduct. The findings have varied.
The optimal type, frequency, intensity and duration of exercise for achieving therapeutic goals in type 2 diabetes are not known. Aerobic exercise, which is the repetitive cyclical movements caused by contraction of the large muscle masses relying on aerobic energy pathways, is the usual intervention in exercise studies. In aerobic exercise, the muscular and cardiorespiratory systems are involved (for example brisk walking, cycling, swimming, and jogging). Resistance training, which is exercise using muscular strength to move a weight or to work against a resistive load (for example exercise with free weights or weight machines) may also be used as an intervention. Resistance training increases muscle strength and size when performed regularly at a sufficient intensity.
In type 2 diabetes, the promotion of weight loss is one mechanism through which exercise may be beneficial (Ivy 1997; Wallberg‐H. 1998) since obesity, especially abdominal obesity, is associated with metabolic abnormalities in diabetes. However, studies in both diabetic and non‐diabetic people demonstrate that, even without any weight loss, exercise may still be beneficial. For example, a single bout of exercise lowers plasma glucose levels and increases insulin sensitivity (Wallberg‐H. 1998). Insulin sensitivity can be measured, using radioimmunoassay, over the period of a three hour oral glucose tolerance test, with blood specimens being tested every half hour (Tessier 2000). The incremental area under the insulin curve thus obtained indicates the degree of insulin sensitivity. The adaptations to a single bout of exercise are short lived (King 1995) and some of the benefits from exercise training may be due to the repeated acute improvements which follow individual exercise sessions (Albright 2005).
Exercise is usually a general recommendation prescribed for people with type 2 diabetes, especially in the early stages. The longer the disease has been present, the greater likelihood there is of disease complications, which may limit exercise. Possible adverse effects of exercise in people with type 2 diabetes mellitus may include an abnormal cardiovascular response to exercise or problems related to foot care (Constantini 2005). Exercise capabilities may be limited by the presence of retinopathy, neuropathy or nephropathy.
In a review of different weight loss strategies in type 2 diabetes (Brown 1996), the effect of aerobic exercise on diabetic control was reported. Of the 89 studies included, 10% had exercise interventions, but only five studies had a control group. It was concluded that exercise caused a reduction in glycated haemoglobin and a decrease in body mass. A meta‐analysis of controlled clinical trials (Boule 2001) addressed the effect of exercise on glycaemic control and body mass in type 2 diabetes and concluded that exercise training reduces glycated haemoglobin, but not body mass. However, Boule et al included some non‐randomised controlled trials, and also some trials in which diet was a co‐intervention with exercise in the intervention group, while the same diet was not also applied to the control group. Hence, it was not possible to measure the effects of the exercise per se.
Why it is important to do this review
The object of this systematic review was to explore the independent effect of exercise in people with type 2 diabetes. All randomised controlled trials in which the only difference between the intervention group and the comparison group was that the intervention group performed well‐documented exercise were included. Our review included a range of outcome measures. We assessed the effects of different types of exercise interventions by performing subgroup analyses, to provide explanations for variations found in individual trials and evaluated the scientific evidence to support or refute the role of exercise interventions.
Objectives
To assess the effects of exercise in type 2 diabetes mellitus.
Methods
Criteria for considering studies for this review
Types of studies
Inclusion criteria
Trial design
We considered all randomised controlled trials (RCT) comparing aerobic, fitness or progressive resistance training exercise with no exercise in type 2 diabetes mellitus.
Trial duration
We included trials of eight weeks or longer, because we wanted to evaluate the effect of ongoing exercise training rather than acute single bouts of exercise. A training period of less than eight weeks would be too short to show alteration in either glycated haemoglobin concentrations or body mass. A post‐intervention follow‐up of at least six months would have been ideal to specify also, however this was not an absolute criterion for study inclusion.
Exclusion criteria
Single bout exercise interventions; studies where the intervention involved only the recommendation of increased physical activity, without further detail; studies where the exercise intervention was not either directly supervised or well‐documented; studies where there was a co‐intervention in the experimental group such as a dietary alteration or counselling that was not also applied to the control group.
Studies where the same diet was applied to both the intervention group and the control group and hence the exercise in the intervention group was the only difference between the two groups, were not excluded.
Types of participants
The participants were males and females with type 2 diabetes. Ideally, the diagnostic criteria for type 2 diabetes mellitus should have been described in the trial. To be consistent with changes in classification and diagnostic criteria of diabetes through the years, the diagnosis should have been established using the standard criteria valid at the beginning of the trial. Acceptable diagnostic criteria included those described by: the National Diabetes Data Group standards (NDDG 1979), the World Health Organisation standards (WHO 1980; WHO 1999) or the American Diabetes Association standards (ADA 1997b). The major difference between the different standards is that the ADA cutoff point for diabetes is a fasting blood glucose level of equal to or more than 7.0 mmol/L whereas the other two standards use a cutoff of equal to or more than 7.8 mmol/L. Changes in diagnostic criteria may have produced variation in the clinical characteristics of the people included in trials as well as in the results obtained.
Studies performed on people with impaired glucose tolerance (IGT) were not included in the analysis. Where studies reported the combined results for people with type 2 diabetes and IGT, we contacted the authors requesting individual data. If these data were not provided, the trial was excluded.
Types of interventions
The included studies prescribed an exercise intervention, defined as a pre‐determined program of physical activity. Physical activity can comprise any body movement produced by skeletal muscle, resulting in an increase in energy expenditure. In contrast, exercise prescriptions include specific recommendations for the type, intensity, frequency and duration of physical activity with a specific objective (that is, increase fitness or health) (Bouchard 1994). Studies that stated they simply recommended increasing physical activity were not included in the analyses unless it was possible to quantify the exercise stimulus.
We intended to measure the effect of exercise, hence only included studies where the only difference in interventions between groups was exercise. Using this inclusion criteria, studies involving dietary or medication changes were eligible for inclusion only when the same treatments were applied to both the control and intervention groups. The review includes studies involving three types of intervention:
-
exercise versus non‐exercise control;
-
exercise plus diet versus diet alone;
-
exercise plus medication versus medication alone.
Types of outcome measures
Primary outcomes
-
glycaemic control measured as percent glycated haemoglobin (HbA1c) (or fasting glucose concentration, glucose tolerance test, post prandial blood glucose);
-
body mass indices (body mass (kg), body mass index (BMI) (kg/m2), visceral adipose tissue (cm2), subcutaneous adipose tissue (cm2), muscle mass (kg));
-
adverse events (hypoglycaemic reactions, exercise induced injuries).
Secondary outcomes
-
insulin sensitivity (area under the insulin curve, Kitt constant, plasma insulin concentrations);
-
blood lipids (mmol/litre): total cholesterol, high density lipoprotein‐cholesterol (HDL), low‐density lipoprotein‐cholesterol (LDL), triglycerides;
-
blood pressure (mmHg);
-
quality of life (using validated instruments such as SF‐36, Euroquol);
-
fitness (as measured by maximal exercise capacity (VO2 max));
-
diabetic complication rates (diabetic neuropathy, diabetic retinopathy, diabetic nephropathy and diabetic cardiovascular disease);
-
mortality.
This review focused on clinically important outcomes, measured using physiological variables associated with diabetes and its complications. The secondary outcomes hyperinsulinaemia dyslipidaemia and hypertension are also associated with cardiovascular disease (Bouchard 1994; Després 1997; Lamarche 1998; Yki‐Yarvinen 1998). Knowledge of the effects of exercise on these variables is important since people with type 2 diabetes have morbidity and mortality rates from cardiovascular disease two to four fold higher than people without diabetes (Meltzer 1998).
Timing of outcome assessment (length of intervention)
Studies were classified as short term (less than three months), medium term (three to less than six months), long term (6 to 12 months) and over 12 months duration, according to the timing of the outcome assessments measured at the end of the intervention.
Search methods for identification of studies
Electronic searches
We searched the following databases
-
The Cochrane Library, including the Cochrane Controlled Trials Register (CENTRAL, Issue 1, 2005);
-
MEDLINE and EMBASE were searched from January 1966 (when possible) to March 2005
For detailed search strategies please see under Appendix 1. We placed no language restrictions on either the search or the included trials.
Searching other resources
The reference lists of review articles and included studies were handsearched for other potentially eligible studies.
Furthermore, other potentially eligible studies were sought through experts in the field.
Data collection and analysis
Selection of studies
To determine the studies to be assessed, two authors (DT and GN) independently reviewed the titles, abstract sections and keywords of every record retrieved from the search. The full articles were retrieved for further assessment when the information suggested that the study may fit the review criteria. Any trial that clearly did not fulfil the selection criteria, for example, the participants did not have type 2 diabetes mellitus, there was no control group, the trial included a co‐intervention which was not also applied to the control group or the trial only measured the acute effect of a single exercise session, was eliminated. From the full articles of the remaining studies, the decision to eliminate a trial was based on agreement by all three authors. When a trial was excluded after this, a record of the article, including the reason for exclusion, was retained (see Characteristics of excluded studies). We had planned to measure inter‐rater agreement using Cohen's kappa statistic (Fleiss 1981) and to discuss any differences in opinion with a third party. However, as the authors were unanimous in their initial choices of abstracts for further investigation, this was not done.
Data extraction and management
Two authors (DT and GN) independently extracted the data on study population, intervention and outcome in each included study, using a standard data extraction form, which included the following:
-
general information: published/unpublished, title, authors, source, contact address, country, setting, language, year of publication, duplicate publication, source of funding;
-
trial characteristics: design, randomisation (and method if stated), allocation concealment, blinding of outcome assessors;
-
participants: if randomised, inclusion criteria, exclusion criteria, total number in intervention/control groups, sex, age, baseline characteristics, diagnostic criteria, similarity of groups at baseline, withdrawals/losses to follow‐up;
-
intervention and comparator, duration of trial;
-
outcomes: Outcomes specified in the methods, other outcomes assessed, length of post‐intervention follow‐up if applicable;
-
results: For continuous variables, we extracted the number of participants, and the baseline and post‐intervention means with standard deviations (SD) (or standard error of the mean (SEM) or 95% confidence interval (95% CI)) for the intervention and control groups. We transformed SEM or 95% CI into SD, if appropriate. There were no relevant dichotomous variable outcomes.
Variations in data extraction were resolved by consensus, referring back to the original data.
We contacted three authors, two for clarification and one to request raw data.
When data were available only in graph form, the best estimate of the mean and SD was obtained. When post‐intervention measures of dispersion (SD, SEM or 95% CI) were not available (for example when post‐intervention information was expressed as percentage change from baseline values) the measure of dispersion at baseline was used as the post‐intervention value. However, this extrapolation was only performed when other pre‐ and post‐ measures of dispersion were similar for the same outcomes in other trials. Variation at baseline should be greater than at post‐intervention, hence any such replacement should be conservative.
Assessment of risk of bias in included studies
The methodological quality of each included randomised controlled trial was assessed independently by two authors (DT and GN), based on quality criteria specified by Schultz and Jadad (Jadad 1996; Schultz 1995). The following factors were studied:
(1) Minimisation of selection bias ‐ a) was the randomisation procedure adequate? b) was the allocation concealment adequate?
(2) Minimisation of attrition bias ‐ a) were withdrawals and dropouts completely described? b) was the analysis by intention‐to treat?
(3) Minimisation of detection bias ‐ were the outcome assessors blind to the intervention?
Blinding of the people administering the intervention, as well as the participants actually doing the exercise is impossible in exercise intervention trials, so only the blinding of outcome assessors was assessed.
We had planned a sensitivity analysis based on classification of the studies into three categories (Cochrane Handbook for Systematic Reviews of Interventions):
A ‐ low risk of bias: all quality criteria met;
B ‐ moderate risk of bias: one or more of the quality criteria only partially met;
C ‐ high risk of bias: one or more quality criteria not met, as well as exploring the effect of the individual quality criteria. However, as there were insufficient data, this was not done.
We assessed each trial independently for quality, and for any differences of opinion we had planned to calculate the level of inter‐rater agreement using the kappa statistic (Fleiss 1981), resolving the differences by discussion. However, there was no disagreement on quality assessment.
Assessment of reporting biases
We assessed funnel plot asymmetry to explore bias (Cooper 1994).
Data synthesis
Data were summarised statistically, when they were sufficiently uniform and of sufficient quality.
For continuous outcomes, weighted mean differences (WMD) between the post‐intervention values of the intervention and control groups were used to analyse the size of the intervention effects. When the information was provided, we used an intention‐to treat analysis. If results for continuous outcomes had been presented on different scales, we had planned to use standardised mean differences (SMD).
All data were initially analysed with a fixed effect model. We tested for heterogeneity between trial results using a standard chi‐squared test to observe whether any variation in study results was compatible with the variation expected by chance alone. A significance level of alpha = 0.1 was used for the test of heterogeneity. The I2 parameter was used to quantify any inconsistency (I2 = [(Q‐df)] x 100%, where Q is the chi‐squared statistic and df is its degrees of freedom) (Higgins 2003). A value for I2 greater than 50% was considered to be substantial heterogeneity. Where heterogeneity was found, we attempted to determine potential sources of heterogeneity with various subgroup and sensitivity analyses.
Subgroup analysis and investigation of heterogeneity
We performed length of intervention subgroup analyses excluding the longest study and the two longest studies for our main outcome, glycated haemoglobin, as there were sufficient data for this (less than three months, three to less than six months, six to twelve months and over twelve months). Other subgroup analyses planned, but with insufficient data to pursue were:
-
age (less than 18 years, 18 to 45 years, older than 45 years);
-
sex (male or female);
-
body mass (body mass index less than 25, over 25);
-
medication (receiving medication, not receiving medication);
-
post‐intervention follow‐up timing (less than six months, six to twelve months, more than twelve months);
-
the type of exercise intervention (aerobic or non‐aerobic);
-
exercise frequency (less than three times per week, more than three times per week).
Sensitivity analysis
We had proposed to perform sensitivity analyses to explore the influence of a number of other factors on effect size, by repeating the analysis:
-
excluding unpublished studies;
-
taking study quality, as specified above, into account;
-
excluding any large studies to establish how much they dominated the results;
-
excluding studies using the following filters: diagnostic criteria, language of publication, source of funding (industry versus other), country.
Results
Description of studies
Three authors were contacted for further information. Professor Sato was contacted for clarification on whether the participants had been randomised in the Yamanouchi 1995 study . We received a rapid response, confirming that the trial had been a controlled clinical trial and randomisation had not been possible under the circumstances. We also contacted Bogardus 1984, to ask if they had separate data for type 2 diabetes and impaired glucose tolerance (IGT) participants, since these are combined in the paper and impaired glucose tolerance was one of our exclusion criteria. We received an efficient response informing us that no raw data for this trial were available. These studies are included in the table Characteristics of excluded studies.
Results of the search
From the initial search, 2101 records were identified, and from these, 98 full papers were identified for further examination. The other studies were excluded on the basis of their abstracts because they were not relevant to the question under study. Main reasons for exclusion were: exercise was not the sole intervention, articles were reviews, studies did not compare similar groups, (for example only one group had type 2 diabetes, all participants did not have type 2 diabetes, or participants with type 2 diabetes were indistinguishable from those with impaired glucose tolerance), the intervention was less than eight weeks, the paper was on prevention rather than treatment of type 2 diabetes or the study had no control group, no randomisation, or else insufficient data were provided (Kaplan 1985; Kaplan 1987). See Appendix 3 for details of the amended QUOROM statement.
From 35 potentially appropriate papers selected for closer examination, 14 studies finally met the inclusion criteria. Two studies (Mourier 1997; Ronnemaa 1986) reported results through two papers .
Assessment of publication bias inter‐rater agreement
Two authors (DT and GN) reviewed the studies. There was agreement on the studies to be extracted for closer inspection from the searches. The full papers were obtained, and from these, the studies eligible for the review were selected. All three authors agreed on the final papers chosen for the review.
Included studies
Details of the characteristics of the included studies are given in the table Characteristics of included studies. The following gives a brief overview.
Study types
All final 14 studies selected for the review were randomised controlled trials. They were conducted in Australia (Dunstan 1998; Dunstan 2002; Maiorana 2002), Canada (Cuff 2003; Tessier 2000), Denmark (Dela 2004), Finland (Loimaala 2003; Ronnemaa 1986), France (Mourier 1997), Israel (Raz 1994), Japan (Tsujiuchi 2002), New Zealand (Baldi 2003), and USA (Wing 1988b; Yeater 1990). The duration of the interventions ranged from eight weeks in four studies (Dunstan 1998; Maiorana 2002; Mourier 1997) to one study using six months (Samaras 1997) to 12 months (Loimaala 2003). One trial had a post‐intervention follow‐up at 12 months after the end of the 12 week intervention (Raz 1994). Another trial (Wing 1988b) reported data from a one‐year follow‐up, but not as the exercise group versus the control group, rather as the self‐reporting of exercise from all the participants available in the trial. The shorter studies mainly involved progressive resistance training (Dunstan 1998; Maiorana 2002; Mourier 1997) and the exercise prescription in longer studies tended to involve moderate aerobic exercise such as walking (Tessier 2000) or cycling (Raz 1994) or controlled endurance training combined with muscle strength training (Loimaala 2003).
Participants
The included studies involved 377 participants. The number of participants in a single study ranged from 16 (Dela 2004; Yeater 1990) to 49 (Loimaala 2003) with a pooled total of 361 participants in studies reporting glycated haemoglobin. Of these, 198 participants received the exercise intervention. Only six studies (Baldi 2003; Cuff 2003; Dunstan 2002; Loimaala 2003; Raz 1994; Tessier 2000) included more than 16 participants in the intervention group, one having 24 (Loimaala 2003). The mean age of most groups was between 45 (Mourier 1997) and 65 (Tessier 2000) years and slightly more men than women participated. No study included children.
Interventions
Duration
Exercise interventions ranged from eight weeks duration (Dunstan 1998; Maiorana 2002; Mourier 1997; Yeater 1990) to one year (Loimaala 2003). Two trials (Raz 1994; Wing 1988b) reported post‐intervention follow‐up results, Raz et al at six months after the end of the six month intervention and Wing et al at 12 months post‐intervention. The most common duration of the intervention was either eight weeks (Dunstan 1998; Maiorana 2002; Mourier 1997; Yeater 1990) or 16 weeks (Cuff 2003 ; Ronnemaa 1986; Tessier 2000; Tsujiuchi 2002). In two studies the intervention was 10 weeks, (Baldi 2003; Wing 1988b), in two studies over 12 weeks (Dela 2004; Raz 1994) and in one study over 24 weeks (Dunstan 2002). One intervention lasted 52 weeks (Loimaala 2003).
The duration of individual exercise sessions varied from at least 30 minutes for resistance training (Dela 2004; Loimaala 2003) to 120 minutes for a Qi Gong program (Tsujiuchi 2002). Approximately 60 minutes duration per exercise session was cited in seven studies. The number of weekly sessions in the interventions varied from one (Tsujiuchi 2002) to seven (Ronnemaa 1986). Individual details are provided in the table Characteristics of included studies. The Mourier 1997 study had a design that enabled two sets of comparison groups within the one study.
Frequency
Most interventions involved three sessions per week with exercise occurring on non‐consecutive days. This accords with recovery and adaptation principles of exercise programming. One recent study using Qi Gong involved one two‐hour session per week (Tsujiuchi 2002). Two studies required participants to complete one unsupervised session in addition to the three (Loimaala 2003; Wing 1988b) or two (Raz 1994) sessions supervised by researchers. Compliance with exercise five or more times per week was required in two studies (Dela 2004; Ronnemaa 1986). One of these five weekly sessions studies (Dela 2004) was home‐based rather than community based with compliance monitored using hidden counters on the cycle ergometers.
Types of exercise
The studies in this systematic review included various types of exercise interventions, both resistance and aerobic based. In some of the studies using aerobic training programmes, a choice of aerobic activities was made available to participants (Raz 1994; Ronnemaa 1986; Yeater 1990). In some trials, additional unsupervised exercise sessions were also included (Loimaala 2003; Raz 1994; Wing 1988b). In one study, the use of hidden counters on the cycle ergometers was a novel way of supervision and effectively measured compliance (Dela 2004). In the studies using progressive resistance training, the loads imposed in recent trials (Dunstan 2002; Loimaala 2003) were higher than in other trials (Dunstan 1998; Tessier 2000). Usually loads are lighter for the first two weeks, after which they are increased (Baldi 2003; Dunstan 1998; Dunstan 2002; Mourier 1997). In some studies, re‐assessment of progression in resistance training programmes was routine (Dunstan 1998; Loimaala 2003). In other trials, progression was determined on an individual goal attainment basis (Baldi 2003; Dunstan 2002). Detailed descriptions of the exact resistance training regimes used in more recent studies mean that these could be accurately duplicated (Cuff 2003; Dunstan 2002). One study provided the control group with short supervised stretching regimes (Dunstan 2002).
Intensity of exercise intervention
Traditionally interventions were either progressive resistance training (Dunstan 1998) or moderate aerobic training (Baldi 2003; Mourier 1997; Raz 1994; Wing 1988b; Yeater 1990). Longer trials involved combinations of progressive resistance and at least some aerobic training (Cuff 2003; Dela 2004; Dunstan 2002; Loimaala 2003). Progressive resistance training prescriptions have been described with increasing accuracy over the past two decades and more recent studies describe the precise regime and duration of intervals between sets as well as the frequency of re‐testing during the trials (Cuff 2003; Dunstan 2002).
Percentage of the maximal oxygen uptake (Ronnemaa 1986; Tessier 2000), peak oxygen uptake (Mourier 1997), or peak heart rate (Maiorana 2002) were scales used to define the percentage effort required in the interventions. Exercise modalities included continuous and intermittent cycling (Mourier 1997), progressive increases in walking (Dela 2004; Tessier 2000; Yeater 1990) and mixed aerobic sessions of running, cycling, skiing, and swimming (Raz 1994; Ronnemaa 1986). Among more recent studies, mixed aerobic and resistance training sessions were prescribed (Cuff 2003; Loimaala 2003; Maiorana 2002; Tessier 2000). One study prescribed a two hour session of Qi‐gong (Tsujiuchi 2002).
Outcomes
Original data can be found in Appendix 4 and Appendix 5.
Primary outcomes
Glycaemic control
Glycated haemoglobin was used as the principal measure for glycaemic control in this review (Peters 1996). All 14 studies measured glycated haemoglobin, involving a total of 377 participants. There were 361 participants in the meta‐analysis (Baldi 2003; Cuff 2003; Dela 2004; Dunstan 1998; Dunstan 2002; Loimaala 2003; Maiorana 2002; Mourier 1997; Raz 1994; Ronnemaa 1986; Tessier 2000; Tsujiuchi 2002; Wing 1988b) and 16 participants in the Yeater 1990 study, which, while described as a randomised controlled trial, provided no data for the control group and so could not be included in the meta‐analysis.
Other measures relating to plasma glucose concentrations that were reported were fructosamine (Raz 1994), fasting plasma glucose concentration and AUC (area under the curve) glycaemia (Tessier 2000). Nine studies measured fasting plasma glucose concentration (Baldi 2003; Dela 2004; Dunstan 1998; Maiorana 2002; Mourier 1997; Raz 1994; Ronnemaa 1986; Tessier 2000; Wing 1988b). One study reported results of oral glucose tolerance tests (Ronnemaa 1986).
Body mass index
Ten studies (n = 248) reported results for body mass (Baldi 2003; Cuff 2003; Dela 2004; Dunstan 1998; Dunstan 2002; Maiorana 2002; Mourier 1997; Ronnemaa 1986; Tessier 2000; Wing 1988b) and five of these studies also included body mass index (BMI) (Dela 2004 ; Dunstan 1998; Maiorana 2002; Mourier 1997; Tessier 2000). One study (Yeater 1990) reported that body mass did not change but gave no data. Two studies (Loimaala 2003; Raz 1994) included only body mass index. One study (Baldi 2003) reported both fat free mass (a measure of musculoskeletal mass) and fat mass. Two studies reported visceral and subcutaneous adipose tissue (Cuff 2003; Mourier 1997).
Adverse effects
No study included adverse effects as an outcome.
Secondary outcomes
Insulin sensitivity
Insulin sensitivity was reported in a number of ways. Only one study (Tessier 2000) reported area under the insulin curve. One study reported the Kitt constant, related to the insulin tolerance test (Mourier 1997). Seven studies reported fasting insulin concentration ( Baldi 2003; Dela 2004; Dunstan 1998; Mourier 1997; Ronnemaa 1986; Tessier 2000; Wing 1988b) and one further study (Yeater 1990) also investigated fasting insulin concentration, mentioned it in the results, but gave no actual results data.
Blood lipids
Triglycerides were reported in five studies (Maiorana 2002; Mourier 1997; Raz 1994; Ronnemaa 1986; Wing 1988b). Five studies reported both total cholesterol and high density lipoprotein cholesterol (Maiorana 2002; Mourier 1997; Raz 1994; Ronnemaa 1986; Wing 1988b). Three of these studies also reported low density lipoprotein cholesterol (Maiorana 2002; Mourier 1997; Ronnemaa 1986). One study (Yeater 1990) also studied blood lipids, but did not report data in the results.
Blood pressure
Four studies provided data on blood pressure, three recording both systolic and diastolic pressure (Dunstan 1998; Dunstan 2002; Wing 1988b) and one recording only the systolic pressure (Loimaala 2003). One study measured systolic blood pressure, but only gave results for the exercise group (Yeater 1990).
Quality of life
Quality of life was measured in one study (Tessier 2000).
Fitness
Four studies addressed fitness levels (Loimaala 2003; Mourier 1997; Ronnemaa 1986; Yeater 1990). Yeater 1990 did not provide data for the control group.
Diabetic complications
No study included diabetic complications as an outcome.
Mortality
No study included mortality as an outcome, the intervention periods being too short.
Excluded studies
Excluded studies and the reasons for excluding them are given in the table Characteristics of excluded studies.
Risk of bias in included studies
Allocation
All selected trials were described as randomised, however, only one study reported the method of randomisation (Dela 2004), by drawing lots. No study reported allocation concealment.
Blinding
Blinding of the people administering the intervention and of the participants actually performing the exercise is not possible in exercise intervention trials, so, as stated in the methods, blinding of these was not assessed as a quality criterion. However, blinding of the outcome assessors is feasible. The methodological characteristics of the included studies are summarised in Appendix 2.
No trial reported blinding of the outcome assessors.
Incomplete outcome data
Most studies accounted for all the randomised participants. One study did not report the number randomised, only the number analysed (Cuff 2003). One study reported that ten of the original 36 participants were 'excluded from the analysis' for a 'variety of reasons' (Tsujiuchi 2002).
Other potential sources of bias
Similarity at baseline
All studies included in the review reported no significant differences in the main characteristics of the participants at baseline, except for Yeater 1990, who found plasma triglyceride levels to be higher in the exercise group at baseline (P < 0.05).
Adequacy of length of follow‐up
The longest intervention lasted 12 months (Loimaala 2003). Two studies reported 12 month post‐intervention follow‐ups (Raz 1994; Wing 1988b). One study (which had a 12 week intervention) had a post‐intervention follow‐up (which occurred at 12 months after the end of the intervention) (Raz 1994).
Effects of interventions
Primary outcomes
Glycaemic control
Glycated haemoglobin was reduced by 0.6% HbA1c with exercise (‐0.6% HbA1c WMD, 95% confidence interval (CI) ‐0.9 to ‐0.3). This is both clinically and statistically significant (P < 0.0001) (Baldi 2003; Cuff 2003; Dela 2004; Dunstan 1998; Dunstan 2002; Loimaala 2003; Maiorana 2002; Mourier 1997; Raz 1994; Ronnemaa 1986; Tessier 2000; Tsujiuchi 2002; Wing 1988b). Studying sub‐group analyses, the glycated haemoglobin decrease was more pronounced in shorter studies. For studies less than three months, the decrease was ‐0.8% (‐0.8% HbA1c WMD 95% CI ‐1.2 to ‐0.4)(P < 0.05) (Baldi 2003; Dunstan 1998; Maiorana 2002; Mourier 1997; Raz 1994; Wing 1988b). For all studies less than six months, it was ‐0.7% (‐0.7% HbA1c WMD, 95% CI ‐1.0 to ‐0.4) (P < 0.05) (Baldi 2003; Cuff 2003; Dela 2004; Dunstan 1998; Maiorana 2002; Mourier 1997; Raz 1994; Ronnemaa 1986; Tessier 2000; Tsujiuchi 2002; Wing 1988b). The Yeater 1990 study reported, without providing data, that glycated haemoglobin decreased in seven of the eight participants in the exercise group, and in only two of the eight participants in the control group.
The one study including a follow‐up, at 12 months post‐intervention, of the original randomised groups (Raz 1994), reported that the exercise group maintained the improvement in glycated haemoglobin. The results they reported for this were: exercise intervention group (n = 12): 12.5 % (± 2.9) at baseline versus 10.9 % (± 2.7) at post‐intervention, (P < 0.03); control group (n = 16): 12.4 % (± 4.0) at baseline to 13.1% (± 2.9) at post‐intervention. Eight participants from the exercise group and four from the control group in this study were lost to follow up.
There was no significant difference in fasting plasma glucose concentrations (‐0.45 mmol/L WMD, 95% CI ‐1.09 to 0.18) between the exercise intervention and control groups in the pooled estimate from nine studies reporting fasting plasma glucose concentration (Baldi 2003; Dela 2004; Dunstan 1998; Maiorana 2002; Mourier 1997; Raz 1994; Ronnemaa 1986; Tessier 2000; Wing 1988b). The single study reporting glycaemia area under the curve (Tessier 2000), found no significant differences between the two groups (‐0.60 AUC, 95% CI ‐2.52 to 1.32). While data were not supplied, the Yeater 1990 study also reported no significant difference in fasting plasma glucose concentrations between the two groups.
Body mass indices
In the 10 studies reporting body mass, there was no significant difference in either body mass or body mass index (Baldi 2003; Cuff 2003; Dela 2004; Dunstan 1998; Dunstan 2002; Maiorana 2002; Mourier 1997; Ronnemaa 1986; Tessier 2000; Wing 1988b) between the exercise intervention and control groups (0.0 kg WMD, 95% CI ‐3.8 to 3.8). The study Yeater 1990, which supplied no results data, also reported no change in body mass between the two groups.
However, there was a significant decrease in visceral adipose tissue reported in two studies (Cuff 2003; Mourier 1997). In these two studies, with 40 participants, visceral adipose tissue was significantly reduced in the exercise intervention compared to the control group (‐45.5 cm2 WMD, 95% CI ‐63.8 to ‐27.3). Each of these two studies also showed a significant decrease in subcutaneous adipose tissue in the intervention group compared to the control group, but as there was some statistical heterogeneity (I2 = 53.9%) in the meta‐analysis, we have reported the results separately (Cuff 2003: ‐119.8 cm2, 95% CI ‐154.8 to ‐84.8 (P < 0.05); Mourier 1997: ‐73.6 cm2, 95%CI ‐124.2 to ‐23.0)(P < 0.05). The heterogeneity may be due to the fact that the Cuff 2003 intervention was 16 weeks, while the Mourier 1997 intervention was only half that (eight weeks), with a corresponding smaller decrease in subcutaneous adipose tissue.
There was a significant increase in fat free mass reported in the exercise intervention group in one study of 18 participants (Baldi 2003): 6.3 kg, 95% CI 0.0 to 12.6 (P < 0.05). This study also reported that there was no significant difference in overall fat mass (‐3.3 kg, 95% CI ‐17.4 to 10.8)(P < 0.05).
Adverse effects
No study included adverse events as an outcome. However, some reported on the lack of serious adverse effects or exercise induced injuries in the intervention group. Baldi 2003 reported that there were no complaints or injuries after some expected muscle soreness in the early stages. Yeater 1990 reported an absence of orthopaedic complaints or injuries. Dunstan 2002 mentioned that other than transient musculoskeletal soreness, there were no major complications or injuries from exercise. Loimaala 2003 made no mention of any adverse effects, only noting that all participants successfully completed the 12 month intervention, except for one who withdrew from the study due to lack of time for training. Maiorana 2002 reported that there were no adverse events. Mourier 1997 reported that the participants' compliance and tolerance for the training regime were good and that no exercise bout was stopped for medical reasons. The other studies (Cuff 2003; Dela 2004; Raz 1994; Ronnemaa 1986; Tessier 2000; Tsujiuchi 2002; Wing 1988b) made no reference to any adverse effects in the exercise group.
However, Raz 1994 mentioned that one participant in the control (non‐exercise) group had a cerebrovascular accident during the trial period and was withdrawn from the study.
Secondary outcomes
Insulin sensitivity
Only one study (Tessier 2000) involving 39 participants, reported insulin sensitivity, measuring the area under the insulin curve in a three hour oral glucose tolerance test, which represents insulin release over time. This study reported a significant increase in insulin sensitivity (131 AUC, 95% CI 20 to 242) (P < 0.05) in the exercise intervention group compared to the control group.
In other measures associated with insulin sensitivity, the Kitt constant (a constant involved in the insulin glucose tolerance test) was reported in one study of 21 participants (Mourier 1997). This constant was found to be significantly higher in the exercise intervention group than in the control group (1.5, 95% CI 0.7 to 2.3) (P < 0.05). In the seven studies reporting fasting plasma insulin concentrations, no significant difference was evident (‐0.7 pmol/litre WMD, 95% CI ‐4.1 to 2.7) (Baldi 2003; Dela 2004; Dunstan 1998; Mourier 1997; Ronnemaa 1986; Tessier 2000; Wing 1988b). Yeater 1990 also reported that there was no significant difference in fasting plasma insulin concentration between the two groups, however data were not provided.
Blood lipids
Serum triglyceride levels were reported in six studies (Maiorana 2002; Mourier 1997; Raz 1994; Ronnemaa 1986; Wing 1988b; Yeater 1990) and the pooled data of the five studies reporting complete data showed a significant lowering of plasma triglycerides in the exercise intervention group compared with the controls (‐0.25 WMD, 95% CI ‐0.48 to ‐0.02)(P < 0.05). The Yeater 1990 study also reported that total triglycerides decreased significantly in the exercise group, but not in the control group, however did not provide data for the control group, so this result was not included in the meta‐analysis. Yeater 1990 also reported that the per cent change in triglycerides was related to training intensity (r = 0.91, P < 0.01).
In the pooled data from the five studies recording both total cholesterol and high density lipoprotein cholesterol (Maiorana 2002; Mourier 1997; Raz 1994; Ronnemaa 1986; Wing 1988b), there was no significant difference between the exercise group and the control group in either total cholesterol (‐0.1 mmol/L WMD, 95% CI ‐0.4 to 0.2) or high density lipoprotein cholesterol (0.0 mmol/L WMD, 95% CI ‐0.1 to 0.1). In the three of these studies also reporting low density lipoprotein cholesterol (Maiorana 2002; Mourier 1997; Ronnemaa 1986), there were no significant differences between the two groups (0.1 mmol/L WMD, 95% CI ‐0.3 to 0.5). These results were also confirmed by the Yeater 1990 trial which, while not providing data, reported no difference between the exercise and control groups in total cholesterol, high density lipoprotein cholesterol or low density lipoprotein cholesterol.
Blood pressure
The change in systolic blood pressure, reported in four studies (Dunstan 1998; Dunstan 2002; Loimaala 2003; Wing 1988b), was ‐4 mmHg WMD, 95% CI ‐10 to +1. There was no significant difference between exercise intervention and control groups. The other study which measured systolic blood pressure (Yeater 1990) only gave results for the exercise group, reporting that resting systolic blood pressure decreased significantly from 141 to 130 mmHg in this group.
The change in diastolic blood pressure, reported in three studies (Dunstan 1998; Dunstan 2002; Wing 1988b), was 0 mmHg WMD, 95% CI ‐4 to +3. There was no significant difference between exercise intervention and control groups.
Quality of life
There was no significant change in the quality of life assessment with exercise in the one study reporting this outcome (Tessier 2000), with no significant difference between exercise intervention and control groups.
Fitness levels
Three studies (95 participants) reported complete data for fitness as measured by maximal oxygen uptake (VO2max) (Loimaala 2003; Mourier 1997; Ronnemaa 1986). However, there was significant heterogeneity when all three were combined in a meta‐analysis (I2 = 75.8). Thus, the combined result is only reported for two trials (Loimaala 2003; Ronnemaa 1986), for which there was no heterogeneity (I2 = 0%). The combined result (2 ml/kg*min WMD, 95% CI 0 to 5) was not significant (P < 0.09). On the other hand, the Mourier 1997 study reported that fitness improved significantly (9 %VO2max, 95% CI 6 to 13) (P < 0.05). This was supported by a further study (Yeater 1990), however as no data were provided for the control group in this study, the results could not be included in the meta‐analysis.
Diabetic complications
No hypoglycaemic reactions or development of diabetic complications were reported in any of the trials in the exercise group. The Dunstan 2002 study explicitly reported that there were no major complications in the exercise group. Mourier 1997 reported that participants had good tolerance for the training regime and that no exercise bout was stopped for medical reasons. Raz 1994 mentioned that one participant in the control group had a cerebrovascular accident and was withdrawn from the study. The other trials made no mention of any diabetic or other complications.
Mortality
No trial assessed mortality as a primary or secondary outcome.
Heterogeneity
Of the outcomes tested, there was only substantial heterogeneity in the results of trials for the outcomes of subcutaneous adipose tissue and maximal exercise capacity. In the case of the two studies reporting subcutaneous adipose tissue (Cuff 2003; Mourier 1997), the I2 statistic for heterogeneity was 53.9%, so the results show some heterogeneity. The heterogeneity may be due to the fact that the Cuff 2003 trial length was 16 weeks, while the Mourier 1997 trial length was only half that (eight weeks), resulting in a smaller decrease in subcutaneous adipose tissue.
Complete data for maximal exercise capacity (I2 = 75.8%), were reported in three studies (Loimaala 2003; Mourier 1997; Ronnemaa 1986). If Mourier 1997 is deselected in the meta‐analysis, heterogeneity is no longer apparent between Loimaala 2003 and Ronnemaa 1986. The different protocols employed, different exercise equipment used and diversity in the initial fitness status of the participants in the studies may explain the heterogeneity.
Subgroup analyses
Length of the intervention subgroup analyses were performed for glycated haemoglobin. Including only the six studies with a less than three month intervention (158 participants) that provided sufficient data, the drop in glycated haemoglobin was significant (‐0.8% WMD, 95% CI ‐1.2 to ‐0.4) with I2 = 0% (Baldi 2003; Dunstan 1998; Maiorana 2002; Mourier 1997; Raz 1994; Wing 1988b). When studies of less than three months duration were excluded, the decrease in glycated haemoglobin was significant for the remaining seven studies (203 participants) (‐0.5% WMD, 95% CI ‐0.8 to ‐0.1) with I2 = 0% (Cuff 2003; Dela 2004; Dunstan 2002; Loimaala 2003; Ronnemaa 1986; Tessier 2000; Tsujiuchi 2002). Excluding the longest study (Loimaala 2003; 12 months duration) had no significant effect on the percentage glycated haemoglobin result (‐0.6%HbA1c WMD, 95% CI ‐0.9 to ‐0.3) with I2 = 0%. After excluding the two longest studies (six months Dunstan 2002; 12 months Loimaala 2003), the drop in glycated haemoglobin remained significant (‐0.7% WMD, 95% CI ‐1.0 to ‐0.4, I2 = 0%). Hence based on subgroup analysis, the decrease in glycated haemoglobin in shorter studies (less than three months: ‐0.8%; and less than 6 months: ‐0.7%) was more pronounced than the decrease for all the studies combined (‐0.6%).
Sensitivity analyses
Not performed due to lack of relevant data.
Assessment of publication bias
Funnel plots for the main outcomes, glycated haemoglobin and body mass, were visually assessed as reasonably symmetrical, indicating little publication or small study bias.
Follow‐up
The Raz 1994 study provided follow‐up glycated haemoglobin data on the randomised groups, 12 months after the end of the 12 week exercise intervention for 12 of the 20 exercise intervention participants and 16 of the 20 participants in the control group. This trial showed that the exercise intervention group maintained a significant improvement in glycated haemoglobin levels, while the control group did not: Exercise intervention group: 10.9 ± 2.7 %HbA1c at 12 months post‐intervention versus 12.5 ± 2.9 %HbA1c at baseline, P < 0.03; control group: 13.1 ± 2.9 %HbA1c at 12 months post‐intervention versus 12.4 ± 4.0 %HbA1c at baseline. The Wing 1988b study also had a 12 month post‐intervention follow‐up and reported that at one year, the medication for participants in the exercise intervention group was reduced by 83%, while medication for participants in the control group was reduced by only 38%.
Discussion
Summary of main results
An exercise intervention resulted in a clinically significantly improvement in glycaemic control compared to controls. The decrease of 0.6% HbA1c (13 trials) was achieved over relatively short periods of time, since the shortest studies in the review were of eight weeks duration (Dunstan 1998; Maiorana 2002; Mourier 1997) and there were only two studies with an intervention of six months or more (Dunstan 2002) (six months) and (Loimaala 2003) (twelve months). Analysis of sub‐groups showed a trend to the shorter trials producing a slightly more pronounced improvement in glycaemic control (‐0.8% HbA1c for studies of three months or less and ‐0.7% HbA1c for all studies less than six months), compared to ‐0.6% HbA1c for all thirteen trials. This probably reflects both the higher intensity of the exercise in some of the shorter trials, as well as the difficulties of maintaining compliance with exercise regimes in longer term studies. Results from the fourteenth study (Yeater 1990) also support the fact that exercise improved glycemic control. Yeater 1990 reported improved glycaemic control in seven of the eight participants in the exercise group, compared to only two out of eight participants in the controls.
There is some evidence that the improvement in glycaemic control can be maintained in the longer term. In the 12 month post‐intervention follow‐up reported by Raz 1994, the participants continuing to exercise maintained the improvement in glycaemic control, while the others had not. However, there were large losses to follow‐up. In the only other study that reported a 12 month post‐intervention follow‐up (Wing 1988b), they found that medication for participants in the exercise intervention group was more greatly reduced, than for those in the control group. However for this study also, there were losses to follow‐up.
It is generally difficult to motivate people to exercise. A gradual increase in exercise, starting from low intensity and increasing to moderate exercise performed regularly may be a more successful approach to incorporate exercise into daily lives on a long term basis, than introducing more intense levels of exercise at the outset, which will be difficult to maintain in the longer term. The Yeater 1990 study attributed the high rate of compliance in their study partly to the initial low intensity and gradual progression of the exercise, which was individualised for each person. The exercise intervention in this study, which started at low intensity walking and gradually increased to moderate walking or gentle jogging resulted in significantly improved glycaemic control and fitness, and decreased resting systolic blood pressure and fasting triglycerides.
The mean reduction of 0.6% HbA1c achieved compares well with reported reductions achieved through medications. Meta‐analysis has shown that metformin can lower glycated haemoglobin levels by 0.9% (‐0.9% HbA1c WMD, 95% CI ‐1.1 to ‐0.7) compared to placebo, and sulphonylureas have been shown to have a similar effect (Campbell 1995; Johansen 1999).
The clinical significance of a 0.6% decrease in glycated haemoglobin can be gauged by studying the large prospective intervention studies examining morbidity and mortality outcomes in people with type 2 diabetes. An epidemiological interpretation of the United Kingdom Prospective Diabetes Study Group data suggests that a 1% rise in glycated haemoglobin represents a 21% increase in risk for any diabetes‐related endpoint (95% CI 17 to 24, P < 0.0001), a 21% increase in risk for any diabetes‐related death (95% CI 15 to 27, P < 0.0001), a 14% increased risk for myocardial infarction (95% CI 8 to 21, P < 0.0001) and a 37% increased risk for microvascular complications (95% CI 33 to 41, P < 0.0001) (Stratton 2000). The group found that there was no threshold value of glycated haemoglobin for any adverse outcome and concluded that any reduction in glycated haemoglobin was likely to reduce the risk of complications, with the lowest risk being in those with normal glycated haemoglobin levels (less than 6%).
The impact of a decrease of 0.6 % HbA1c equates to a 30% improvement towards a target value of 7% HbA1c, and a 20% improvement towards a normal value of 6% HbA1c, for a person diagnosed with 9% HbA1c. Hence, possible improvements achievable through exercise are not insubstantial.
Improvements in glycaemic control were achieved over a range of exercise intensities. For example, improvements in glycated haemoglobin were observed following low intensity exercise such as a one hour weekly session of Qi Gong (Tsujiuchi 2002), moderate intensity exercise such as walking three times per week at 60 to 79% of maximal oxygen uptake (Tessier 2000) and high intensity exercise regimes that included progressive resistance training of three sets of ten to twelve repetitions of lifting weights that represented 70 to 85% of a maximum voluntary contraction load of a muscle group (Loimaala 2003).
In addition to the decrease in glycated haemoglobin, there was also a significant decrease in fat mass and in visceral adipose tissue, thus exercise is contributing to decreasing one of the major risk factors for the metabolic syndrome. Despite the decrease in fat, there was no decrease in body mass and this probably reflects a significant increase in fat free mass or muscle mass. Participants in the exercise group are likely to have developed muscle, which is heavier than adipose tissue. In the early stages of an exercise programme, an increase in muscle mass would obscure any weight loss due to adipose tissue loss. Over time muscle mass does not keep increasing to the same extent as adipose tissue loss and eventually weight loss occurs due to loss of adipose tissue. The length of most of the included trials was too short to show change in body mass. Interventions for sustained weight change require durations of up to one year.
There was also a significant lowering of plasma triglycerides in the exercise intervention group compared with the controls, but there was no significant difference between groups in either total cholesterol or blood pressure. However, one study, not included in the meta‐analysis (Yeater 1990), did report a significant decrease in systolic blood pressure with exercise.
In the one study reporting insulin response, there was increased insulin sensitivity in the exercise intervention group, which would contribute to improved glycaemic control. However, it was observed in another study that no benefits could be expected in patients who already had poor metabolic control and weak insulin reserves (Ronnemaa 1986).
Quality of life did not decrease when exercise sessions were included as reported in the study addressing quality of life (Tessier 2000).
There were no serious adverse effects reported as a result of any of the exercise interventions and no hypoglycaemic reactions or development of diabetic complications were reported in any of the trials in the exercise group. No trial aimed to observe mortality, due to the restricted study periods.
These results show a need to be process (engagement) rather than product (weight loss) focussed. In several studies, despite the lack of weight loss, good compliance and programme design resulted in lifestyle, biochemical, biological and other systemic benefits in people with type 2 diabetes. Feedback to people about these other important health outcomes may improve exercise adherence and hence the sustainability of the intervention. Variety, with a choice of the exercise activity, may also be important to ensure compliance with exercise programmes beyond the period of the intervention.
Overall completeness and applicability of evidence
We identified fourteen randomised controlled trials (377 participants) which assessed exercise against no exercise in people with type 2 diabetes. These studies involved either aerobic or resistance training exercise interventions or a combination of both of these. The studies were conducted in nine different countries. Participants included both male and female adults of mean age over 45 years, hence the results particularly apply to the age group at most risk for type 2 diabetes.
Potential biases in the review process
Most studies included in this review were well‐designed, even though there are some methodological limitations, some of which may be due to reporting standards prevalent in the year in which the study was performed. While all the included studies were reported as randomised, few reported the method of randomisation, or allocation concealment. However, in some of these studies, the same participants took part in both the intervention and control arms of the study. No study reported blinding of outcome assessors. Analyses for the results were not always performed on an intention‐to‐treat basis, however most studies reported on the reasons why people had dropped out of the study.
The length of trials prevented the reporting of any significant long term complications or mortality. Another limitation of the review was the small number of participants included in the analyses for visceral and subcutaneous adiposity, blood pressure, total cholesterol, high density lipoprotein cholesterol, low density lipoprotein cholesterol, fat free mass and quality of life.
Exercise prescriptions are difficult for many people to maintain over the longer term. The longest study in this review was 12 months (Loimaala 2003), with one study (Raz 1994) having a one year post‐intervention follow‐up and another study (Wing 1988b) reporting a one year general post‐intervention follow‐up, but not comparing the participants according to their original randomised groups. It is possible that the length of the trials included in the review was not sufficient to result in any loss in total body mass, even though a decrease in visceral adipose tissue was reported. Longer term trials are needed to evaluate whether long term exercise maintains the improved glycaemic control. Inclusion of regular exercise into daily routines requires a lifestyle change that could be justified, if long term trials demonstrated compliance and longer term benefits such as decreased rates of diabetic complications.

Comparison 1 Exercise vs no exercise, Outcome 1 Glycated haemoglobin (%).

Comparison 1 Exercise vs no exercise, Outcome 2 Visceral adipose tissue (cm2).

Comparison 1 Exercise vs no exercise, Outcome 3 Subcutaneous adipose tissue (cm2).

Comparison 1 Exercise vs no exercise, Outcome 4 Body Mass (kg).

Comparison 1 Exercise vs no exercise, Outcome 5 Triglycerides (mmol/litre).
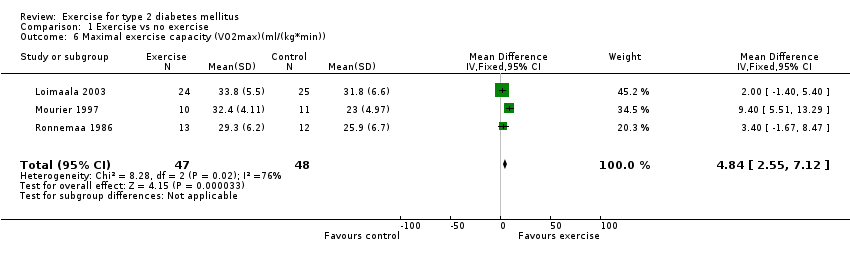
Comparison 1 Exercise vs no exercise, Outcome 6 Maximal exercise capacity (VO2max)(ml/(kg*min)).
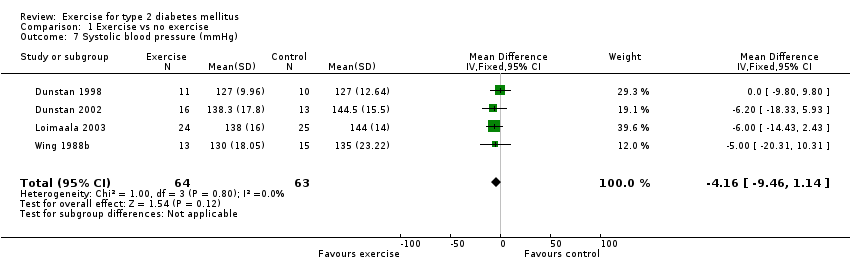
Comparison 1 Exercise vs no exercise, Outcome 7 Systolic blood pressure (mmHg).
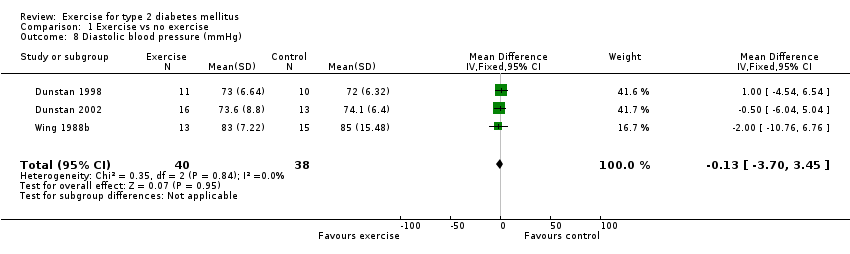
Comparison 1 Exercise vs no exercise, Outcome 8 Diastolic blood pressure (mmHg).

Comparison 1 Exercise vs no exercise, Outcome 9 Fasting plasma glucose concentration (mmol/L).

Comparison 1 Exercise vs no exercise, Outcome 10 Insulin (fasting concentration (pmol/litre).

Comparison 1 Exercise vs no exercise, Outcome 11 Body Mass index (kg/m2).

Comparison 1 Exercise vs no exercise, Outcome 12 Total cholesterol (mmol/l).
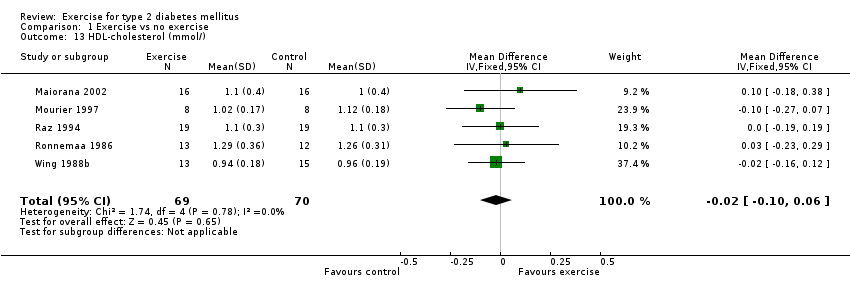
Comparison 1 Exercise vs no exercise, Outcome 13 HDL‐cholesterol (mmol/).

Comparison 1 Exercise vs no exercise, Outcome 14 LDL‐cholesterol (mmol/).
| Outcome or subgroup title | No. of studies | No. of participants | Statistical method | Effect size |
| 1 Glycated haemoglobin (%) Show forest plot | 13 | 361 | Mean Difference (IV, Fixed, 95% CI) | ‐0.62 [‐0.91, ‐0.33] |
| 2 Visceral adipose tissue (cm2) Show forest plot | 2 | 40 | Mean Difference (IV, Fixed, 95% CI) | ‐45.54 [‐63.76, ‐27.31] |
| 3 Subcutaneous adipose tissue (cm2) Show forest plot | 2 | Mean Difference (IV, Fixed, 95% CI) | Subtotals only | |
| 4 Body Mass (kg) Show forest plot | 10 | 248 | Mean Difference (IV, Fixed, 95% CI) | ‐0.04 [‐3.83, 3.76] |
| 5 Triglycerides (mmol/litre) Show forest plot | 5 | 139 | Mean Difference (IV, Fixed, 95% CI) | ‐0.25 [‐0.48, ‐0.02] |
| 6 Maximal exercise capacity (VO2max)(ml/(kg*min)) Show forest plot | 3 | 95 | Mean Difference (IV, Fixed, 95% CI) | 4.84 [2.55, 7.12] |
| 7 Systolic blood pressure (mmHg) Show forest plot | 4 | 127 | Mean Difference (IV, Fixed, 95% CI) | ‐4.16 [‐9.46, 1.14] |
| 8 Diastolic blood pressure (mmHg) Show forest plot | 3 | 78 | Mean Difference (IV, Fixed, 95% CI) | ‐0.13 [‐3.70, 3.45] |
| 9 Fasting plasma glucose concentration (mmol/L) Show forest plot | 9 | 238 | Mean Difference (IV, Fixed, 95% CI) | ‐0.45 [‐1.09, 0.18] |
| 10 Insulin (fasting concentration (pmol/litre) Show forest plot | 7 | 168 | Mean Difference (IV, Fixed, 95% CI) | ‐0.71 [‐4.13, 2.71] |
| 11 Body Mass index (kg/m2) Show forest plot | 7 | 216 | Mean Difference (IV, Fixed, 95% CI) | ‐0.21 [‐1.35, 0.93] |
| 12 Total cholesterol (mmol/l) Show forest plot | 5 | 139 | Mean Difference (IV, Fixed, 95% CI) | ‐0.11 [‐0.41, 0.18] |
| 13 HDL‐cholesterol (mmol/) Show forest plot | 5 | 139 | Mean Difference (IV, Fixed, 95% CI) | ‐0.02 [‐0.10, 0.06] |
| 14 LDL‐cholesterol (mmol/) Show forest plot | 3 | 73 | Mean Difference (IV, Fixed, 95% CI) | 0.12 [‐0.29, 0.53] |