Antagonistas de la vitamina K versus heparina de bajo peso molecular para el tratamiento a largo plazo de la tromboembolia venosa sintomática
Información
- DOI:
- https://doi.org/10.1002/14651858.CD002001.pub3Copiar DOI

- Base de datos:
-
- Cochrane Database of Systematic Reviews
- Versión publicada:
-
- 24 julio 2017see what's new
- Tipo:
-
- Intervention
- Etapa:
-
- Review
- Grupo Editorial Cochrane:
-
Grupo Cochrane de Vascular
- Copyright:
-
- Copyright © 2017 The Cochrane Collaboration. Published by John Wiley & Sons, Ltd.
Cifras del artículo
Altmetric:
Citado por:
Autores
Contributions of authors
A Andras (AA) assessed trials for inclusion, extracted data, assessed risk of bias, analysed data, and drafted the manuscript.
A Sala Tenna (AST) drafted the manuscript.
M Stewart (MS) assessed trials for inclusion, extracted data, assessed risk of bias, analysed data, and drafted the manuscript.
Sources of support
Internal sources
-
No sources of support supplied
External sources
-
National Institute for Health Research (NIHR), UK.
This project was supported by the NIHR, via Cochrane Programme Grant funding to Cochrane Vascular (13/89/23). The views and opinions expressed therein are those of the review authors and do not necessarily reflect those of the Systematic Reviews Programme, NIHR, NHS, or the Department of Health
-
Chief Scientist Office, Scottish Government Health Directorates, The Scottish Government, UK.
The Cochrane Vascular editorial base is supported by the Chief Scientist Office
Declarations of interest
AA: none known.
AST: none known.
MS: none known. MS is a member of the Cochrane Vascular editorial staff. To prevent conflict of interest issues, editorial decisions and activities related to this review were carried out by other editorial staff members when appropriate.
Acknowledgements
We would like to thank Dr F Crawford, Dr JF van der Heijden, Prof HR Büller, Dr BA Hutten, and Prof MH Prins for their work on earlier versions of this review. The review authors would like to thank the personnel from Cochrane Vascular, especially Cathryn Broderick and Karen Welch, for providing invaluable support and advice. We are also grateful to the editors for their attention to detail.
Version history
| Published | Title | Stage | Authors | Version |
| 2017 Jul 24 | Vitamin K antagonists versus low‐molecular‐weight heparin for the long term treatment of symptomatic venous thromboembolism | Review | Alina Andras, Adriano Sala Tenna, Marlene Stewart | |
| 2012 Oct 17 | Vitamin K antagonists or low‐molecular‐weight heparin for the long term treatment of symptomatic venous thromboembolism | Review | Alina Andras, Adriano Sala Tenna, Fay Crawford | |
| 2001 Jul 23 | Vitamin K antagonists or low‐molecular‐weight heparin for the long term treatment of symptomatic venous thromboembolism | Review | Jeroen Frank van der Heijden, Barbara A Hutten, Harry R Büller, Martin H Prins | |
Differences between protocol and review
We modified the original protocol as follows for the update published in 2012.
-
We excluded trials that randomised only participants with cancer, as patients with malignancy are the topic of a different review (Akl 2014).
-
We added secondary outcomes that were the same as primary outcomes but were measured over a different time frame. Primary outcomes now are measured during initial treatment covering three months, and secondary outcomes are considered for an additional nine months, or longer if data are available.
-
We changed assessment of the methodological quality of included trials to include the updated and recommended Cochrane 'Risk of bias' tool (Higgins 2011).
For the 2017 update, we added a 'Summary of findings' table, according to current Cochrane guidelines.
Notes
The 'Description of the condition' section is based on a standard background section established by Cochrane Vascular.
Keywords
MeSH
Medical Subject Headings (MeSH) Keywords
- Anticoagulants [adverse effects, *therapeutic use];
- Hemorrhage [chemically induced, epidemiology];
- Heparin, Low‐Molecular‐Weight [adverse effects, *therapeutic use];
- Incidence;
- Odds Ratio;
- Randomized Controlled Trials as Topic;
- Recurrence;
- Venous Thromboembolism [*drug therapy, mortality];
- Venous Thrombosis [drug therapy];
- Vitamin K [*antagonists & inhibitors];
Medical Subject Headings Check Words
Humans;
PICO

Study flow diagram.

Risk of bias graph: review authors' judgements about each risk of bias item presented as percentages across all included trials.

Risk of bias summary: review authors' judgements about each risk of bias item for each included trial.

Funnel plot of comparison: 2 LMWH versus VKA during three months of allocated treatment (category I and II trials); outcome: 2.1 incidence of recurrent VTE.

Funnel plot of comparison: 2 LMWH versus VKA during three months of allocated treatment (category I and II trials); outcome: 2.2 incidence of major bleeding.

Funnel plot of comparison: 2 LMWH versus VKA during three months of allocated treatment (category I and II trials), outcome; 2.3 mortality.

Comparison 1 LMWH versus VKA during allocated treatment (category I and II trials) in participants with VTE, Outcome 1 Incidence of recurrent VTE.

Comparison 1 LMWH versus VKA during allocated treatment (category I and II trials) in participants with VTE, Outcome 2 Incidence of major bleeding.

Comparison 1 LMWH versus VKA during allocated treatment (category I and II trials) in participants with VTE, Outcome 3 Mortality.
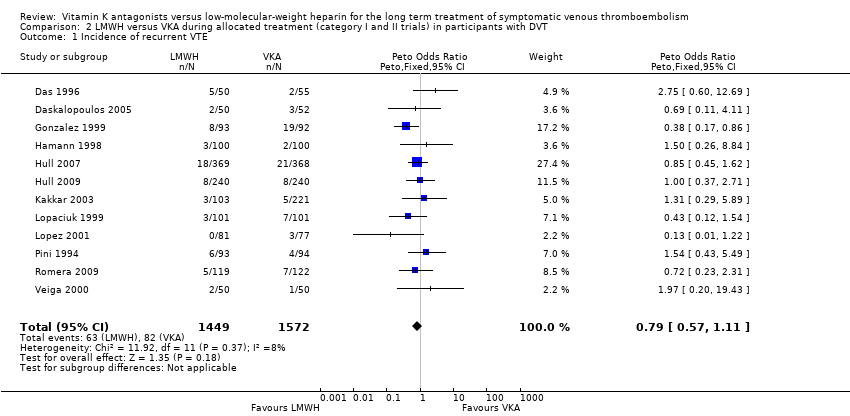
Comparison 2 LMWH versus VKA during allocated treatment (category I and II trials) in participants with DVT, Outcome 1 Incidence of recurrent VTE.

Comparison 2 LMWH versus VKA during allocated treatment (category I and II trials) in participants with DVT, Outcome 2 Incidence of major bleeding.

Comparison 2 LMWH versus VKA during allocated treatment (category I and II trials) in participants with DVT, Outcome 3 Mortality.

Comparison 3 LMWH versus VKA during allocated treatment (category I and II trials) in participants with PE, Outcome 1 Incidence of recurrent VTE.

Comparison 3 LMWH versus VKA during allocated treatment (category I and II trials) in participants with PE, Outcome 2 Incidence of major bleeding.
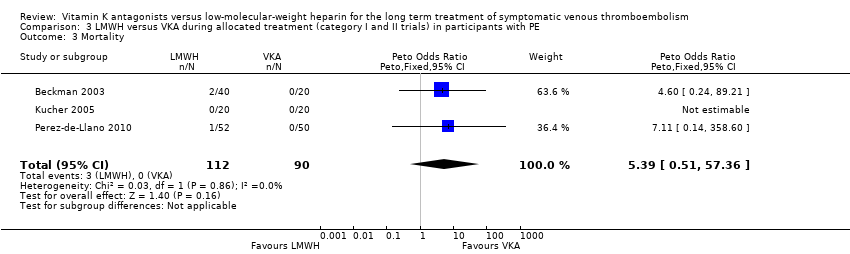
Comparison 3 LMWH versus VKA during allocated treatment (category I and II trials) in participants with PE, Outcome 3 Mortality.

Comparison 4 LMWH versus VKA during allocated treatment (category I trials) in participants with VTE, Outcome 1 Incidence of recurrent VTE.

Comparison 4 LMWH versus VKA during allocated treatment (category I trials) in participants with VTE, Outcome 2 Incidence of major bleeding.

Comparison 4 LMWH versus VKA during allocated treatment (category I trials) in participants with VTE, Outcome 3 Mortality.
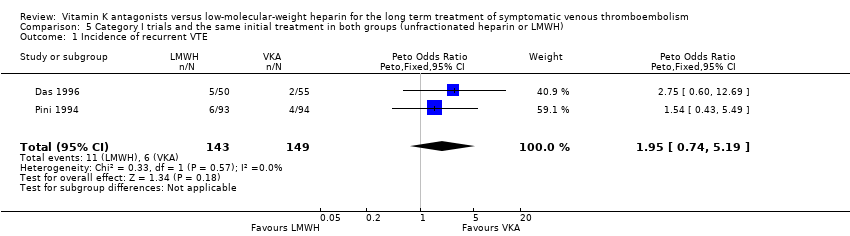
Comparison 5 Category I trials and the same initial treatment in both groups (unfractionated heparin or LMWH), Outcome 1 Incidence of recurrent VTE.

Comparison 5 Category I trials and the same initial treatment in both groups (unfractionated heparin or LMWH), Outcome 2 Incidence of major bleeding.

Comparison 5 Category I trials and the same initial treatment in both groups (unfractionated heparin or LMWH), Outcome 3 Mortality.

Comparison 6 Category I trials and initial treatment not the same in both groups (unfractionated heparin compared with LMWH), Outcome 1 Incidence of recurrent VTE.

Comparison 6 Category I trials and initial treatment not the same in both groups (unfractionated heparin compared with LMWH), Outcome 2 Incidence of major bleeding.

Comparison 6 Category I trials and initial treatment not the same in both groups (unfractionated heparin compared with LMWH), Outcome 3 Mortality.

Comparison 7 LMWH versus VKA during additional follow‐up (category I and II trials), Outcome 1 Incidence of recurrent VTE.

Comparison 7 LMWH versus VKA during additional follow‐up (category I and II trials), Outcome 2 Incidence of major bleeding.

Comparison 7 LMWH versus VKA during additional follow‐up (category I and II trials), Outcome 3 Mortality.

Comparison 8 LMWH versus VKA during additional nine months of follow‐up (category I trials), Outcome 1 Incidence of recurrent VTE.
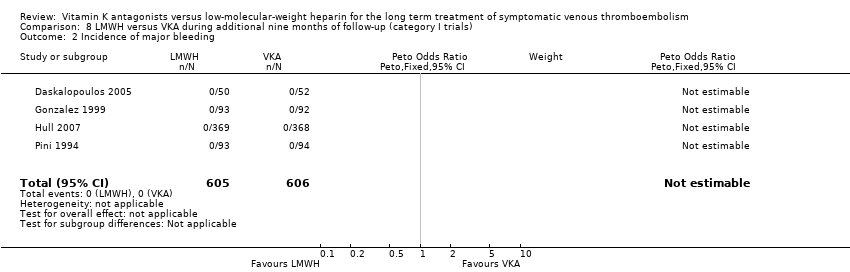
Comparison 8 LMWH versus VKA during additional nine months of follow‐up (category I trials), Outcome 2 Incidence of major bleeding.
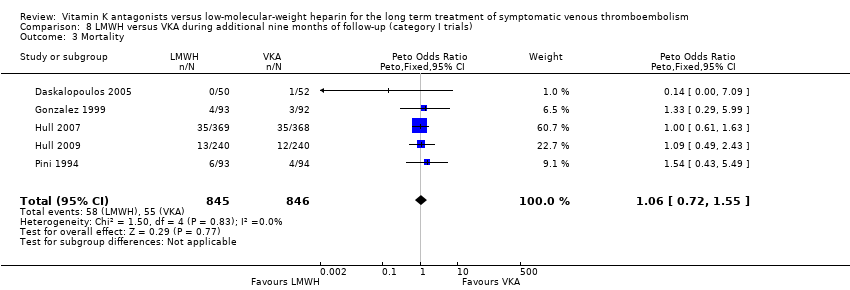
Comparison 8 LMWH versus VKA during additional nine months of follow‐up (category I trials), Outcome 3 Mortality.

Comparison 9 LMWH versus VKA for total period of 12 months of follow‐up (category I and II trials), Outcome 1 Incidence of recurrent VTE.

Comparison 9 LMWH versus VKA for total period of 12 months of follow‐up (category I and II trials), Outcome 2 Incidence of major bleeding.
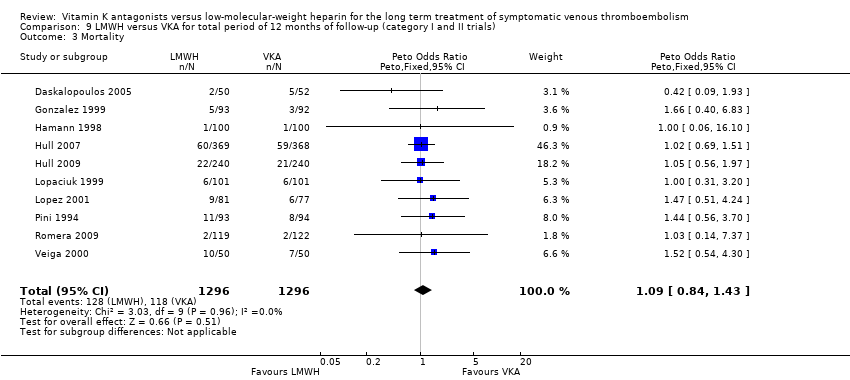
Comparison 9 LMWH versus VKA for total period of 12 months of follow‐up (category I and II trials), Outcome 3 Mortality.

Comparison 10 LMWH versus VKA for total period of 12 months of follow‐up (category I trials), Outcome 1 Incidence of recurrent VTE.

Comparison 10 LMWH versus VKA for total period of 12 months of follow‐up (category I trials), Outcome 2 Incidence of major bleeding.
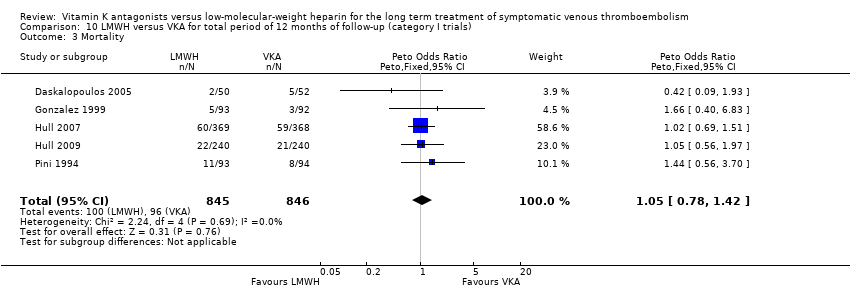
Comparison 10 LMWH versus VKA for total period of 12 months of follow‐up (category I trials), Outcome 3 Mortality.
| LMWH compared with VKA for long term treatment of symptomatic VTE | ||||||
| Patient or population: patients with symptomatic VTE requiring long term treatment (3 months) for symptomatic VTE | ||||||
| Outcomes | Anticipated absolute effects* (95% CI) | Relative effect | Number of participants | Quality of the evidence | Comments | |
| Risk with VKA | Risk with LMWH | |||||
| Incidence of recurrent VTE (treatment duration 3 months) | Study population | Peto OR 0.83 | 3299 | ⊕⊕⊕⊝ | ||
| 51 per 1000 | 42 per 1000 | |||||
| Incidence of major bleeding (treatment duration 3 months) | Study population | Peto OR 0.51 | 3299 | ⊕⊕⊝⊝ | ||
| 29 per 1000 | 15 per 1000 | |||||
| Mortality (treatment duration 3 months) | Study population | Peto OR 1.08 | 3299 | ⊕⊕⊕⊝ | ||
| 35 per 1000 | 37 per 1000 | |||||
| * The basis for the assumed risk with VKA for 'Study population' was the average risk in the VKA group (i.e. total number of participants with events divided by total number of participants in the VKA group included in the meta‐analysis). The risk in the LMWH group (and its 95% confidence interval) is based on assumed risk in the VKA group and the relative effect of the intervention (and its 95% CI) | ||||||
| GRADE Working Group grades of evidence | ||||||
| aHigh risk of bias due to no blinding but not downgraded, as analysis excluding studies deemed of low methodological quality confirms no clear differences between LMWH and VKA | ||||||
| Outcome or subgroup title | No. of studies | No. of participants | Statistical method | Effect size |
| 1 Incidence of recurrent VTE Show forest plot | 16 | 3299 | Peto Odds Ratio (Peto, Fixed, 95% CI) | 0.83 [0.60, 1.15] |
| 2 Incidence of major bleeding Show forest plot | 16 | 3299 | Peto Odds Ratio (Peto, Fixed, 95% CI) | 0.51 [0.32, 0.80] |
| 3 Mortality Show forest plot | 16 | 3299 | Peto Odds Ratio (Peto, Fixed, 95% CI) | 1.08 [0.75, 1.56] |
| Outcome or subgroup title | No. of studies | No. of participants | Statistical method | Effect size |
| 1 Incidence of recurrent VTE Show forest plot | 12 | 3021 | Peto Odds Ratio (Peto, Fixed, 95% CI) | 0.79 [0.57, 1.11] |
| 2 Incidence of major bleeding Show forest plot | 12 | 3021 | Peto Odds Ratio (Peto, Fixed, 95% CI) | 0.54 [0.33, 0.88] |
| 3 Mortality Show forest plot | 12 | 3021 | Peto Odds Ratio (Peto, Fixed, 95% CI) | 1.10 [0.75, 1.60] |
| Outcome or subgroup title | No. of studies | No. of participants | Statistical method | Effect size |
| 1 Incidence of recurrent VTE Show forest plot | 3 | 202 | Peto Odds Ratio (Peto, Fixed, 95% CI) | 5.70 [0.91, 35.60] |
| 2 Incidence of major bleeding Show forest plot | 3 | 202 | Peto Odds Ratio (Peto, Fixed, 95% CI) | 0.23 [0.03, 1.78] |
| 3 Mortality Show forest plot | 3 | 202 | Peto Odds Ratio (Peto, Fixed, 95% CI) | 5.39 [0.51, 57.36] |
| Outcome or subgroup title | No. of studies | No. of participants | Statistical method | Effect size |
| 1 Incidence of recurrent VTE Show forest plot | 7 | 1872 | Peto Odds Ratio (Peto, Fixed, 95% CI) | 0.80 [0.54, 1.18] |
| 2 Incidence of major bleeding Show forest plot | 7 | 1872 | Peto Odds Ratio (Peto, Fixed, 95% CI) | 0.62 [0.36, 1.07] |
| 3 Mortality Show forest plot | 7 | 1872 | Peto Odds Ratio (Peto, Fixed, 95% CI) | 0.92 [0.61, 1.41] |
| Outcome or subgroup title | No. of studies | No. of participants | Statistical method | Effect size |
| 1 Incidence of recurrent VTE Show forest plot | 2 | 292 | Peto Odds Ratio (Peto, Fixed, 95% CI) | 1.95 [0.74, 5.19] |
| 2 Incidence of major bleeding Show forest plot | 2 | 292 | Peto Odds Ratio (Peto, Fixed, 95% CI) | 1.01 [0.20, 5.12] |
| 3 Mortality Show forest plot | 2 | 292 | Peto Odds Ratio (Peto, Fixed, 95% CI) | 0.89 [0.29, 2.68] |
| Outcome or subgroup title | No. of studies | No. of participants | Statistical method | Effect size |
| 1 Incidence of recurrent VTE Show forest plot | 5 | 1580 | Peto Odds Ratio (Peto, Fixed, 95% CI) | 0.68 [0.44, 1.03] |
| 2 Incidence of major bleeding Show forest plot | 5 | 1580 | Peto Odds Ratio (Peto, Fixed, 95% CI) | 0.59 [0.33, 1.04] |
| 3 Mortality Show forest plot | 5 | 1580 | Peto Odds Ratio (Peto, Fixed, 95% CI) | 0.93 [0.59, 1.46] |
| Outcome or subgroup title | No. of studies | No. of participants | Statistical method | Effect size |
| 1 Incidence of recurrent VTE Show forest plot | 10 | 2592 | Peto Odds Ratio (Peto, Fixed, 95% CI) | 1.12 [0.77, 1.64] |
| 2 Incidence of major bleeding Show forest plot | 9 | 2112 | Peto Odds Ratio (Peto, Fixed, 95% CI) | 0.0 [0.0, 0.0] |
| 3 Mortality Show forest plot | 10 | 2592 | Peto Odds Ratio (Peto, Fixed, 95% CI) | 1.00 [0.71, 1.40] |
| Outcome or subgroup title | No. of studies | No. of participants | Statistical method | Effect size |
| 1 Incidence of recurrent VTE Show forest plot | 5 | 1691 | Peto Odds Ratio (Peto, Fixed, 95% CI) | 1.26 [0.81, 1.98] |
| 2 Incidence of major bleeding Show forest plot | 4 | 1211 | Peto Odds Ratio (Peto, Fixed, 95% CI) | 0.0 [0.0, 0.0] |
| 3 Mortality Show forest plot | 5 | 1691 | Peto Odds Ratio (Peto, Fixed, 95% CI) | 1.06 [0.72, 1.55] |
| Outcome or subgroup title | No. of studies | No. of participants | Statistical method | Effect size |
| 1 Incidence of recurrent VTE Show forest plot | 10 | 2592 | Peto Odds Ratio (Peto, Fixed, 95% CI) | 0.88 [0.67, 1.15] |
| 2 Incidence of major bleeding Show forest plot | 9 | 2112 | Peto Odds Ratio (Peto, Fixed, 95% CI) | 0.56 [0.33, 0.95] |
| 3 Mortality Show forest plot | 10 | 2592 | Peto Odds Ratio (Peto, Fixed, 95% CI) | 1.09 [0.84, 1.43] |
| Outcome or subgroup title | No. of studies | No. of participants | Statistical method | Effect size |
| 1 Incidence of recurrent VTE Show forest plot | 5 | 1691 | Peto Odds Ratio (Peto, Fixed, 95% CI) | 0.95 [0.70, 1.30] |
| 2 Incidence of major bleeding Show forest plot | 4 | 1211 | Peto Odds Ratio (Peto, Fixed, 95% CI) | 0.72 [0.39, 1.32] |
| 3 Mortality Show forest plot | 5 | 1691 | Peto Odds Ratio (Peto, Fixed, 95% CI) | 1.05 [0.78, 1.42] |