Antagonistas de la vitamina K versus heparina de bajo peso molecular para el tratamiento a largo plazo de la tromboembolia venosa sintomática
Appendices
Appendix 1. CENTRAL search strategy
| #1 | MESH DESCRIPTOR Thrombosis | 1234 |
| #2 | MESH DESCRIPTOR Thromboembolism | 896 |
| #3 | MESH DESCRIPTOR Venous Thromboembolism | 239 |
| #4 | MESH DESCRIPTOR Venous Thrombosis EXPLODE ALL TREES | 2001 |
| #5 | (thromboprophyla* or thrombus* or thrombotic* or thrombolic* or thromboemboli* or thrombos* or embol*):TI,AB,KY | 17573 |
| #6 | MESH DESCRIPTOR Pulmonary Embolism EXPLODE ALL TREES | 734 |
| #7 | (PE or DVT or VTE):TI,AB,KY | 4603 |
| #8 | (((vein* or ven*) near thromb*)):TI,AB,KY | 6271 |
| #9 | #1 OR #2 OR #3 OR #4 OR #5 OR #6 OR #7 OR #8 | 20979 |
| #10 | MESH DESCRIPTOR Anticoagulants | 3271 |
| #11 | MESH DESCRIPTOR Coumarins EXPLODE ALL TREES | 1618 |
| #12 | (((vitamin k or vit k) near3 antagon*)):TI,AB,KY | 370 |
| #13 | VKA:TI,AB,KY | 140 |
| #14 | anticoagula*:TI,AB,KY | 7493 |
| #15 | anti‐coagula*:TI,AB,KY | 146 |
| #16 | warfarin*:TI,AB,KY | 2809 |
| #17 | *coum* :TI,AB,KY | 834 |
| #18 | (Jantoven or Marevan or Lawarin or Waran or Warfant or Dindevan):TI,AB,KY | 4 |
| #19 | phenindione:TI,AB,KY | 33 |
| #20 | (Sinthrome or Sintrom):TI,AB,KY | 8 |
| #21 | (Marcumar or Falithrom):TI,AB,KY | 10 |
| #22 | (aldocumar or tedicumar):TI,AB,KY | 0 |
| #23 | #10 OR #11 OR #12 OR #13 OR #14 OR #15 OR #16 OR #17 OR #18 OR #19 OR #20 OR #21 OR #22 | 9306 |
| #24 | MESH DESCRIPTOR Heparin, Low‐Molecular‐Weight EXPLODE ALL TREES | 1488 |
| #25 | (low near4 hepar* ):TI,AB,KY | 3132 |
| #26 | (LMWH or LMH):TI,AB,KY | 802 |
| #27 | (nadroparin* or fraxiparin* or enoxaparin):TI,AB,KY | 1620 |
| #28 | (Clexane or klexane or lovenox):TI,AB,KY | 42 |
| #29 | (dalteparin or Fragmin or ardeparin):TI,AB,KY | 561 |
| #30 | (normiflo or tinzaparin or logiparin):TI,AB,KY | 182 |
| #31 | (Innohep or certoparin or sandoparin or reviparin):TI,AB,KY | 134 |
| #32 | (clivarin* or danaproid or danaparoid):TI,AB,KY | 56 |
| #33 | (antixarin or ardeparin* or bemiparin*):TI,AB,KY | 42 |
| #34 | (Zibor or cy 222 or embolex or monoembolex):TI,AB,KY | 38 |
| #35 | (parnaparin* or rd 11885 or RD1185):TI,AB,KY | 27 |
| #36 | (tedelparin or Kabi‐2165 or Kabi 2165):TI,AB,KY | 42 |
| #37 | (emt‐966 or emt‐967 or pk‐10 169 or pk‐10169 or pk10169):TI,AB,KY | 8 |
| #38 | (fr‐860 or cy‐216 or cy216):TI,AB,KY | 51 |
| #39 | (seleparin* or tedegliparin or seleparin* or tedegliparin*):TI,AB,KY | 1 |
| #40 | ("kb 101" or kb101 or lomoparan or orgaran):TI,AB,KY | 31 |
| #41 | (parnaparin or fluxum or lohepa or lowhepa):TI,AB,KY | 33 |
| #42 | (op 2123 or parvoparin):TI,AB,KY | 1 |
| #43 | calciparin*:TI,AB,KY | 22 |
| #44 | #24 OR #25 OR #26 OR #27 OR #28 OR #29 OR #30 OR #31 OR #32 OR #33 OR #34 OR #35 OR #36 OR #37 OR #38 OR #39 OR #40 OR #41 OR #42 | 4570 |
| #45 | #9 AND #23 AND #44 | 1187 |
| #46 | 15/02/2012 TO 31/10/2016:DL | 308891 |
| #47 | #45 AND #46 | 446 |
Appendix 2. Trials registries searches
ClinicalTrials.gov
44 studies found for: Thromboembolism OR thrombosis OR DVT in Condition AND
(vitamin k antagonist OR warfarin OR coumadin OR phenprocoumon OR acenocoumarol OR dicoumarol) AND heparin in Interventions
World Health Organization International Clinical Trials Registry Platform
496 records for 138 trials for: Thromboembolism OR thrombosis OR DVT in Condition AND
(warfarin OR coumadin OR phenprocoumon OR acenocoumarol OR dicoumarol) AND heparin in Intervention
ISRCTN Register
3 results found for (warfarin OR coumadin OR phenprocoumon OR acenocoumarol OR dicoumarol) AND (thromboembolism or thrombosis or DVT)
Appendix 3. Glossary
anticoagulant: medicine that helps prevent blood clots
intravenous: into the vein(s)
oral anticoagulant: anticoagulant taken by mouth
parenteral anticoagulant: administration of anticoagulant by injection or infusion
subcutaneous: under the skin

Study flow diagram.

Risk of bias graph: review authors' judgements about each risk of bias item presented as percentages across all included trials.

Risk of bias summary: review authors' judgements about each risk of bias item for each included trial.

Funnel plot of comparison: 2 LMWH versus VKA during three months of allocated treatment (category I and II trials); outcome: 2.1 incidence of recurrent VTE.

Funnel plot of comparison: 2 LMWH versus VKA during three months of allocated treatment (category I and II trials); outcome: 2.2 incidence of major bleeding.

Funnel plot of comparison: 2 LMWH versus VKA during three months of allocated treatment (category I and II trials), outcome; 2.3 mortality.

Comparison 1 LMWH versus VKA during allocated treatment (category I and II trials) in participants with VTE, Outcome 1 Incidence of recurrent VTE.

Comparison 1 LMWH versus VKA during allocated treatment (category I and II trials) in participants with VTE, Outcome 2 Incidence of major bleeding.

Comparison 1 LMWH versus VKA during allocated treatment (category I and II trials) in participants with VTE, Outcome 3 Mortality.
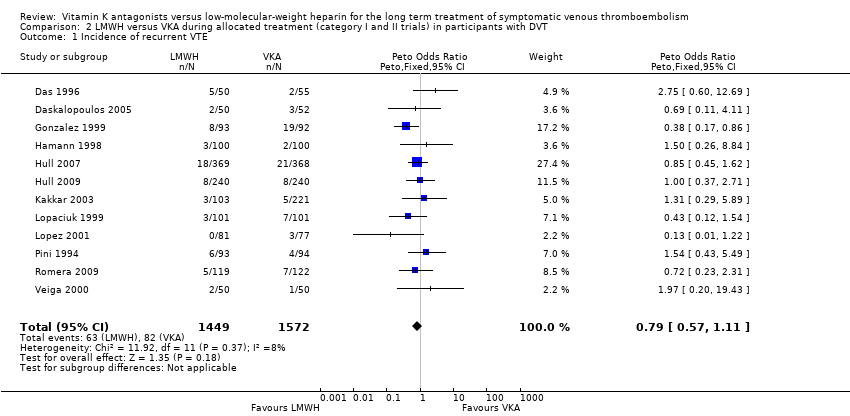
Comparison 2 LMWH versus VKA during allocated treatment (category I and II trials) in participants with DVT, Outcome 1 Incidence of recurrent VTE.

Comparison 2 LMWH versus VKA during allocated treatment (category I and II trials) in participants with DVT, Outcome 2 Incidence of major bleeding.

Comparison 2 LMWH versus VKA during allocated treatment (category I and II trials) in participants with DVT, Outcome 3 Mortality.

Comparison 3 LMWH versus VKA during allocated treatment (category I and II trials) in participants with PE, Outcome 1 Incidence of recurrent VTE.

Comparison 3 LMWH versus VKA during allocated treatment (category I and II trials) in participants with PE, Outcome 2 Incidence of major bleeding.
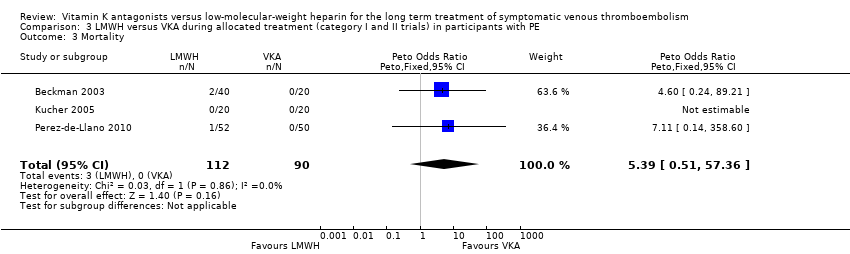
Comparison 3 LMWH versus VKA during allocated treatment (category I and II trials) in participants with PE, Outcome 3 Mortality.

Comparison 4 LMWH versus VKA during allocated treatment (category I trials) in participants with VTE, Outcome 1 Incidence of recurrent VTE.

Comparison 4 LMWH versus VKA during allocated treatment (category I trials) in participants with VTE, Outcome 2 Incidence of major bleeding.

Comparison 4 LMWH versus VKA during allocated treatment (category I trials) in participants with VTE, Outcome 3 Mortality.
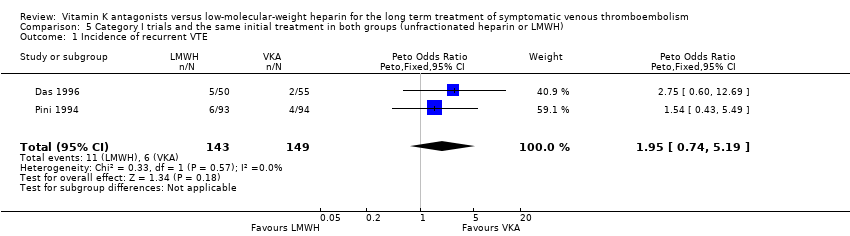
Comparison 5 Category I trials and the same initial treatment in both groups (unfractionated heparin or LMWH), Outcome 1 Incidence of recurrent VTE.

Comparison 5 Category I trials and the same initial treatment in both groups (unfractionated heparin or LMWH), Outcome 2 Incidence of major bleeding.

Comparison 5 Category I trials and the same initial treatment in both groups (unfractionated heparin or LMWH), Outcome 3 Mortality.

Comparison 6 Category I trials and initial treatment not the same in both groups (unfractionated heparin compared with LMWH), Outcome 1 Incidence of recurrent VTE.

Comparison 6 Category I trials and initial treatment not the same in both groups (unfractionated heparin compared with LMWH), Outcome 2 Incidence of major bleeding.

Comparison 6 Category I trials and initial treatment not the same in both groups (unfractionated heparin compared with LMWH), Outcome 3 Mortality.

Comparison 7 LMWH versus VKA during additional follow‐up (category I and II trials), Outcome 1 Incidence of recurrent VTE.

Comparison 7 LMWH versus VKA during additional follow‐up (category I and II trials), Outcome 2 Incidence of major bleeding.

Comparison 7 LMWH versus VKA during additional follow‐up (category I and II trials), Outcome 3 Mortality.

Comparison 8 LMWH versus VKA during additional nine months of follow‐up (category I trials), Outcome 1 Incidence of recurrent VTE.
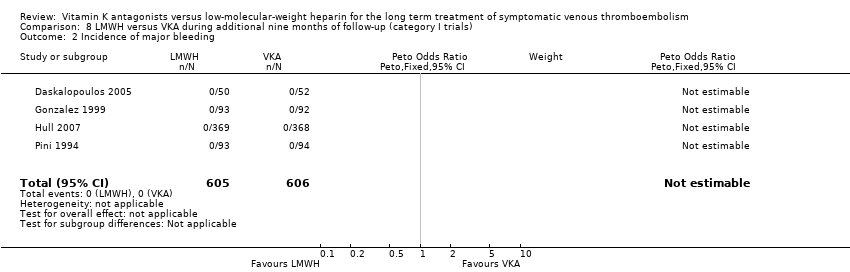
Comparison 8 LMWH versus VKA during additional nine months of follow‐up (category I trials), Outcome 2 Incidence of major bleeding.
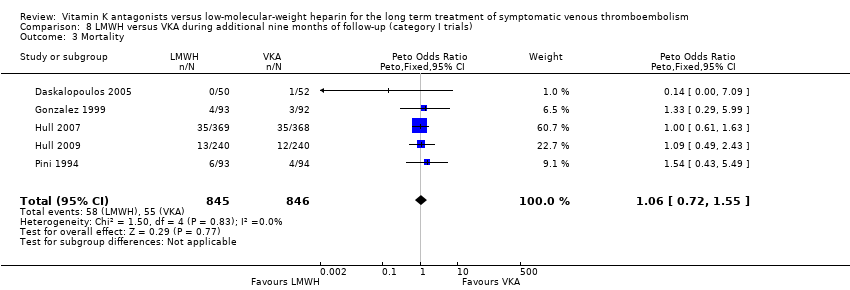
Comparison 8 LMWH versus VKA during additional nine months of follow‐up (category I trials), Outcome 3 Mortality.

Comparison 9 LMWH versus VKA for total period of 12 months of follow‐up (category I and II trials), Outcome 1 Incidence of recurrent VTE.

Comparison 9 LMWH versus VKA for total period of 12 months of follow‐up (category I and II trials), Outcome 2 Incidence of major bleeding.
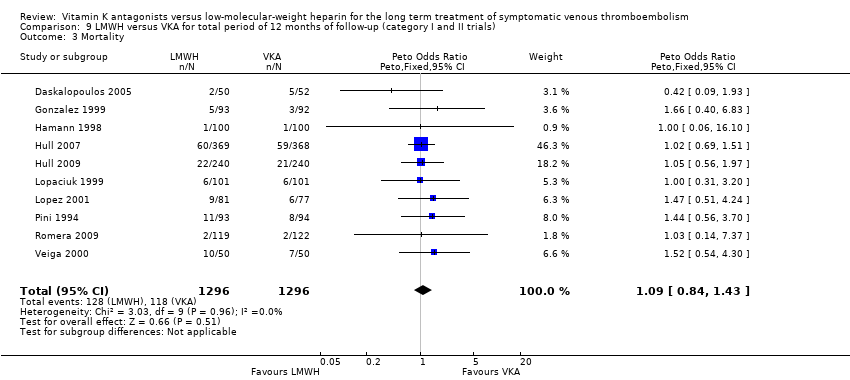
Comparison 9 LMWH versus VKA for total period of 12 months of follow‐up (category I and II trials), Outcome 3 Mortality.

Comparison 10 LMWH versus VKA for total period of 12 months of follow‐up (category I trials), Outcome 1 Incidence of recurrent VTE.

Comparison 10 LMWH versus VKA for total period of 12 months of follow‐up (category I trials), Outcome 2 Incidence of major bleeding.
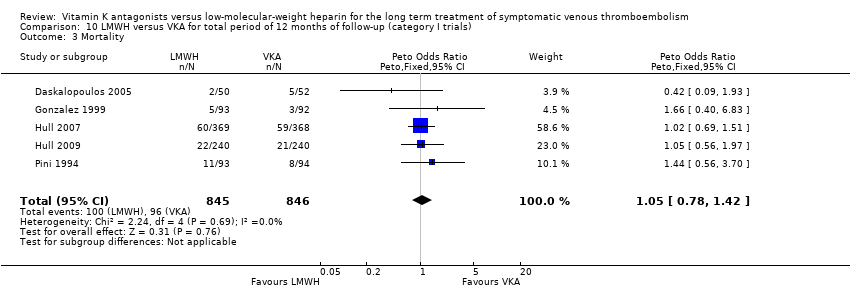
Comparison 10 LMWH versus VKA for total period of 12 months of follow‐up (category I trials), Outcome 3 Mortality.
| LMWH compared with VKA for long term treatment of symptomatic VTE | ||||||
| Patient or population: patients with symptomatic VTE requiring long term treatment (3 months) for symptomatic VTE | ||||||
| Outcomes | Anticipated absolute effects* (95% CI) | Relative effect | Number of participants | Quality of the evidence | Comments | |
| Risk with VKA | Risk with LMWH | |||||
| Incidence of recurrent VTE (treatment duration 3 months) | Study population | Peto OR 0.83 | 3299 | ⊕⊕⊕⊝ | ||
| 51 per 1000 | 42 per 1000 | |||||
| Incidence of major bleeding (treatment duration 3 months) | Study population | Peto OR 0.51 | 3299 | ⊕⊕⊝⊝ | ||
| 29 per 1000 | 15 per 1000 | |||||
| Mortality (treatment duration 3 months) | Study population | Peto OR 1.08 | 3299 | ⊕⊕⊕⊝ | ||
| 35 per 1000 | 37 per 1000 | |||||
| * The basis for the assumed risk with VKA for 'Study population' was the average risk in the VKA group (i.e. total number of participants with events divided by total number of participants in the VKA group included in the meta‐analysis). The risk in the LMWH group (and its 95% confidence interval) is based on assumed risk in the VKA group and the relative effect of the intervention (and its 95% CI) | ||||||
| GRADE Working Group grades of evidence | ||||||
| aHigh risk of bias due to no blinding but not downgraded, as analysis excluding studies deemed of low methodological quality confirms no clear differences between LMWH and VKA | ||||||
| Outcome or subgroup title | No. of studies | No. of participants | Statistical method | Effect size |
| 1 Incidence of recurrent VTE Show forest plot | 16 | 3299 | Peto Odds Ratio (Peto, Fixed, 95% CI) | 0.83 [0.60, 1.15] |
| 2 Incidence of major bleeding Show forest plot | 16 | 3299 | Peto Odds Ratio (Peto, Fixed, 95% CI) | 0.51 [0.32, 0.80] |
| 3 Mortality Show forest plot | 16 | 3299 | Peto Odds Ratio (Peto, Fixed, 95% CI) | 1.08 [0.75, 1.56] |
| Outcome or subgroup title | No. of studies | No. of participants | Statistical method | Effect size |
| 1 Incidence of recurrent VTE Show forest plot | 12 | 3021 | Peto Odds Ratio (Peto, Fixed, 95% CI) | 0.79 [0.57, 1.11] |
| 2 Incidence of major bleeding Show forest plot | 12 | 3021 | Peto Odds Ratio (Peto, Fixed, 95% CI) | 0.54 [0.33, 0.88] |
| 3 Mortality Show forest plot | 12 | 3021 | Peto Odds Ratio (Peto, Fixed, 95% CI) | 1.10 [0.75, 1.60] |
| Outcome or subgroup title | No. of studies | No. of participants | Statistical method | Effect size |
| 1 Incidence of recurrent VTE Show forest plot | 3 | 202 | Peto Odds Ratio (Peto, Fixed, 95% CI) | 5.70 [0.91, 35.60] |
| 2 Incidence of major bleeding Show forest plot | 3 | 202 | Peto Odds Ratio (Peto, Fixed, 95% CI) | 0.23 [0.03, 1.78] |
| 3 Mortality Show forest plot | 3 | 202 | Peto Odds Ratio (Peto, Fixed, 95% CI) | 5.39 [0.51, 57.36] |
| Outcome or subgroup title | No. of studies | No. of participants | Statistical method | Effect size |
| 1 Incidence of recurrent VTE Show forest plot | 7 | 1872 | Peto Odds Ratio (Peto, Fixed, 95% CI) | 0.80 [0.54, 1.18] |
| 2 Incidence of major bleeding Show forest plot | 7 | 1872 | Peto Odds Ratio (Peto, Fixed, 95% CI) | 0.62 [0.36, 1.07] |
| 3 Mortality Show forest plot | 7 | 1872 | Peto Odds Ratio (Peto, Fixed, 95% CI) | 0.92 [0.61, 1.41] |
| Outcome or subgroup title | No. of studies | No. of participants | Statistical method | Effect size |
| 1 Incidence of recurrent VTE Show forest plot | 2 | 292 | Peto Odds Ratio (Peto, Fixed, 95% CI) | 1.95 [0.74, 5.19] |
| 2 Incidence of major bleeding Show forest plot | 2 | 292 | Peto Odds Ratio (Peto, Fixed, 95% CI) | 1.01 [0.20, 5.12] |
| 3 Mortality Show forest plot | 2 | 292 | Peto Odds Ratio (Peto, Fixed, 95% CI) | 0.89 [0.29, 2.68] |
| Outcome or subgroup title | No. of studies | No. of participants | Statistical method | Effect size |
| 1 Incidence of recurrent VTE Show forest plot | 5 | 1580 | Peto Odds Ratio (Peto, Fixed, 95% CI) | 0.68 [0.44, 1.03] |
| 2 Incidence of major bleeding Show forest plot | 5 | 1580 | Peto Odds Ratio (Peto, Fixed, 95% CI) | 0.59 [0.33, 1.04] |
| 3 Mortality Show forest plot | 5 | 1580 | Peto Odds Ratio (Peto, Fixed, 95% CI) | 0.93 [0.59, 1.46] |
| Outcome or subgroup title | No. of studies | No. of participants | Statistical method | Effect size |
| 1 Incidence of recurrent VTE Show forest plot | 10 | 2592 | Peto Odds Ratio (Peto, Fixed, 95% CI) | 1.12 [0.77, 1.64] |
| 2 Incidence of major bleeding Show forest plot | 9 | 2112 | Peto Odds Ratio (Peto, Fixed, 95% CI) | 0.0 [0.0, 0.0] |
| 3 Mortality Show forest plot | 10 | 2592 | Peto Odds Ratio (Peto, Fixed, 95% CI) | 1.00 [0.71, 1.40] |
| Outcome or subgroup title | No. of studies | No. of participants | Statistical method | Effect size |
| 1 Incidence of recurrent VTE Show forest plot | 5 | 1691 | Peto Odds Ratio (Peto, Fixed, 95% CI) | 1.26 [0.81, 1.98] |
| 2 Incidence of major bleeding Show forest plot | 4 | 1211 | Peto Odds Ratio (Peto, Fixed, 95% CI) | 0.0 [0.0, 0.0] |
| 3 Mortality Show forest plot | 5 | 1691 | Peto Odds Ratio (Peto, Fixed, 95% CI) | 1.06 [0.72, 1.55] |
| Outcome or subgroup title | No. of studies | No. of participants | Statistical method | Effect size |
| 1 Incidence of recurrent VTE Show forest plot | 10 | 2592 | Peto Odds Ratio (Peto, Fixed, 95% CI) | 0.88 [0.67, 1.15] |
| 2 Incidence of major bleeding Show forest plot | 9 | 2112 | Peto Odds Ratio (Peto, Fixed, 95% CI) | 0.56 [0.33, 0.95] |
| 3 Mortality Show forest plot | 10 | 2592 | Peto Odds Ratio (Peto, Fixed, 95% CI) | 1.09 [0.84, 1.43] |
| Outcome or subgroup title | No. of studies | No. of participants | Statistical method | Effect size |
| 1 Incidence of recurrent VTE Show forest plot | 5 | 1691 | Peto Odds Ratio (Peto, Fixed, 95% CI) | 0.95 [0.70, 1.30] |
| 2 Incidence of major bleeding Show forest plot | 4 | 1211 | Peto Odds Ratio (Peto, Fixed, 95% CI) | 0.72 [0.39, 1.32] |
| 3 Mortality Show forest plot | 5 | 1691 | Peto Odds Ratio (Peto, Fixed, 95% CI) | 1.05 [0.78, 1.42] |