Traditional suburethral sling operations for urinary incontinence in women
Referencias
References to studies included in this review
References to studies excluded from this review
References to ongoing studies
Additional references
Characteristics of studies
Characteristics of included studies [ordered by study ID]
| Methods | RCT by electronic treatment assignment. 2 arms. Unblinded | |
| Participants | N = 655 Symptom‐based diagnosis, confirmed by standard stress test Inclusion criteria: documented pure or predominant symptom of SUI for at least 3 months, positive standardised urinary stress test Groups similar in age, ethnic group, marital status, BMI, vaginal deliveries, hormone treatment, smoking, mixed UI, POP, UDS, concomitant surgery Multicentre. Tertiary referral centres. USA | |
| Interventions | A (326): Sling B (329): Burch Burch as modified by Tanagho Sling procedure using autologous rectus fascia at level of the bladder neck and proximal urethra Interventions standardised across the centres | |
| Outcomes | Number with overall success, number with SUI‐specific success, pad test, number of incontinence episodes in a 3‐d voiding diary, POP, adverse events, voiding dysfunction (use of a catheter), postoperative UUI Overall success defined as no self‐reported symptoms of UI, no incontinence on 3‐d diary, negative stress test, no re treatment SUI‐specific success defined as no symptoms, negative stress test and no re treatment for SUI All outcomes reported at 2‐year follow‐up Failure (symptoms) at 24 months: A: 101/265, B: 130/255 Failure (pad test) at 24 months: A: 37/265, B: 38/255 Complications: any complications: A: 206/326, B: 156/329; any voiding dysfunction: A: 46/326, B: 7/329; post‐operative cystitis: A: 247/326, B: 166/329; bladder perforation: A: 2/326, B: 10/329 | |
| Notes | Full text with several other reports in full‐text and abstract form | |
| Risk of bias | ||
| Bias | Authors' judgement | Support for judgement |
| Random sequence generation (selection bias) | Low risk | Use of permuted‐block randomisation schedule with stratification according to clinical site |
| Allocation concealment (selection bias) | Unclear risk | Insufficient information to permit judgement |
| Blinding (performance bias and detection bias) | High risk | Participants were aware of study‐group assignments postoperatively. Independent data and safety monitoring board oversaw the progress, interim results, and safety of the study |
| Incomplete outcome data (attrition bias) | Low risk | 135 women were lost to follow‐up at 2 years. 61 from the sling group and 74 from Burch failed to attend clinic To allow for attrition and missed visits, 655 women had been recruited following power calculation |
| Methods | RCT of autologous fascial sling with TVT. Single blind. Follow‐up assessment carried out at 1, 6, 12 and 36 months | |
| Participants | Women with involuntary detrusor contractions or pre‐existing bladder outlet obstruction during urodynamic study were excluded | |
| Interventions | A (21): autologous fascial sling B (20): TVT | |
| Outcomes | Cure rates (defined as complete dryness with no usage of pads, operative‐room time, postoperative analgesia, complications, time of hospital stay, postoperative catheterisation, time to return to normal activities. 60‐min pad test used and QoL evaluated using a validated Portuguese version of King's Health Questionnaire Incontinent at 12 months: A: 9/21, B: 7/20 | |
| Notes | Abstract and poster | |
| Risk of bias | ||
| Bias | Authors' judgement | Support for judgement |
| Random sequence generation (selection bias) | Unclear risk | Not mentioned |
| Allocation concealment (selection bias) | Unclear risk | Not mentioned |
| Blinding (performance bias and detection bias) | Unclear risk | "Single blinded" mentioned in abstract, but no description given |
| Incomplete outcome data (attrition bias) | Low risk | All outcome data assessed. No women lost to follow‐up |
| Methods | RCT, randomisation method unclear. Participants' demographics were well reported. Procedures were standardised. Follow‐up was 2‐6 months, 12 and 24 months (median 12 months) | |
| Participants | 142 women with urodynamic‐proven SUI were recruited. Women with detrusor instability excluded. Groups comparable | |
| Interventions | A (74): Pelvicol B (68): TVT | |
| Outcomes | Outcome measures: cure rates (subjective, questionnaire‐based; pad used ‐ not weighed), levels of morbidity and impact on QoLand symptom severity Failure at 12 months (incontinence): A: 8/74, B: 10/68 Not Improved at 12 months: A:6/74, B: 4/68 Failure at 36 months (incontinence): A: 12/68, B: 7/60 Not improved at 36 months: A: 5/68, B: 4/60 Complications: any complications: A: 17/74, B: 13/68; any voiding dysfunction: A: 8/74, B: 6/68; Retention up to 6 weeks A: 6/74, B: 1/68; Release of sling required A: 5/74, B: 2/68; Bladder perforations: A: 0/74, B: 0/68 | |
| Notes | Surgery was only offered after conservative therapy had proved unsuccessful | |
| Risk of bias | ||
| Bias | Authors' judgement | Support for judgement |
| Random sequence generation (selection bias) | Unclear risk | Not mentioned |
| Allocation concealment (selection bias) | Unclear risk | Not mentioned |
| Blinding (performance bias and detection bias) | Unclear risk | Not mentioned |
| Incomplete outcome data (attrition bias) | Low risk | No participants lost to follow‐up at 12 months. All outcome data assessed. At 36 months, in the Pelvicol arm 2 participants died and 4 lost to follow‐up; in the TVT arm 1 died, and 7 lost to follow‐up. Statistical analysis failed to detect significant differences |
| Methods | RCT. Method not described. 3 arms. Blinding not mentioned. Unclear if ITT. Follow‐up at 1 year with assessments at 3, 6, 9 months | |
| Participants | UDS confirmed. No mixed incontinence Groups comparable as to age, parity, BMI, menopausal status, MUCP, VLPP, functional urethral length and peak flow rates at baseline Inclusion criteria : USI grade 1 and 2 Exclusion criteria: grade III incontinence, detrusor overactivity, UTI, ISD, POP > grade II Ob&Gyne. South Korea | |
| Interventions | A (28): Sling Sling procedure was a pubovaginal sling using autologous rectus muscle fascia | |
| Outcomes | Number cured (3, 6, 12 months); complication rate (number with idiopathic detrusor overactivity, hesitancy, urinary retention) Cure defined as absence of subjective complaints of leakage and absence of urinary leakage on stress test Not cured (6 months): A: 2/28, B: 3/33, C: 2/31 Not cured (12 months): A: 2/28, B: 4/33, C: 4/31 De novo detrusor overactivity: A: 0/28, B: 3/33, C: 0/31 Voiding dysfunction: A: 2/28, B: 1/33, C: 4/31 | |
| Notes | TVT technique according to Ulmsten All procedures performed by one surgeon | |
| Risk of bias | ||
| Bias | Authors' judgement | Support for judgement |
| Random sequence generation (selection bias) | Unclear risk | Not mentioned |
| Allocation concealment (selection bias) | Unclear risk | Not mentioned |
| Blinding (performance bias and detection bias) | Unclear risk | Not mentioned |
| Incomplete outcome data (attrition bias) | Low risk | No missing outcome data |
| Methods | RCT. Follow‐up at 6 and 30 months. Women allocated to 1/2 interventions by a computer‐generated random table in a 2:1 ratio. All women available at follow‐up | |
| Participants | 48 consecutive women. Inclusion and exclusion criteria not clearly stated, but some participants with mixed incontinence | |
| Interventions | A (32): rectus fascia sling B (16): Gore‐Tex sling operation | |
| Outcomes | Cure defined as complete freedom from SUI (clinically accessed) or improved (persistence or recurrence of SUI, but in lesser intensity) Failure rates at 6 months: A: 6/32, B: 2/16 Failure rates at 30 months: A:11/32, B: 2/16 Complications: B: 2 cases of erosion of sling and 3 other cases of recurrent UTI | |
| Notes | Pre‐operative characteristics reported but no comparisons between groups made; statistical analysis reported for urodynamic parameters pre and post operation. No other statistical comparison between groups reported. Some participants with mixed incontinence, but results not stratified by groups or type of incontinence | |
| Risk of bias | ||
| Bias | Authors' judgement | Support for judgement |
| Random sequence generation (selection bias) | Low risk | Computer randomised numbers, assigning 2 successive numbers to the fascial group and following number to Gore‐Tex group |
| Allocation concealment (selection bias) | Unclear risk | Not mentioned |
| Blinding (performance bias and detection bias) | Unclear risk | Not mentioned |
| Incomplete outcome data (attrition bias) | Low risk | No missing outcome data |
| Methods | RCT. Details of randomisation not given. Two arms. Follow‐up 12 months | |
| Participants | 139 women randomised. Baseline comparison made: number of participants, mean age (years), mean daily pad usage, mean parturition, mean BMI, mixed urinary incontinence. No statistical difference Inclusion criteria: stress urinary incontinence due to urethral hypermobility Exclusion criteria: participants with ISD, uterine prolapse, rectocele, enterocele, grade III or IV cystocele Concomitant urinary urge incontinence was present in some women with mixed urinary incontinence present in 49 participants (73%) in the fascia lata sling group and in 44 participants (61%) in the intravaginal slingplasty group | |
| Interventions | A (67) Cadaveric fascia lata B (72) Intravaginal slingplasty | |
| Outcomes | Objective cure rate was evaluated by the pad test, and participant‐satisfaction rate was assessed by a subjective questionnaire. A cure and an improvement were defined as a totally dry participant and 1 pad/d, respectively. Usage of more than 1 pad/d was accepted as surgical failure. The sum of cure and improvement rates was conceded as a total success rate. Other outcomes measured were: mean operating time, bladder perforation, urinary retention, erosion, sling revision, haematoma, persistent urge urinary incontinence, defective vaginal wall, de novo detrusor overactivity. Total success: A: 79.0%, B: 70.8 Satisfaction at 12 months: A: 82.0%, B: 87.5% Incontinent at 12 months: A: 32/67, B: 38/72 Not improved at 12 months: A: 14/67, B: 21/72 Daily mean pad usage (SD): A: 4.1 (3.5), B: 2.9 (1.7) Operative time: A: 50, B: 25 min Adverse events: de novo detrusor overactivity: A: 15/67, B: 5/72; bladder perforation: A: 3/67, B: 8/72; urinary retention: A: 8/67, B: 8/72; vaginal erosion: A: 0/67, B: 0/72; sling revision: A: 2/67, B: 0/72 | |
| Notes | Preoperative evaluation of all participants included: urogynaecological history, previous pelvic surgery, voiding diary, parturition and daily pad usage The abstract indicated that the QOL was significantly improved in the study, the full article showed that measurement was carried out by participant‐satisfaction questionnaire. No comment was made on the validity and reliability of this questionnaire | |
| Risk of bias | ||
| Bias | Authors' judgement | Support for judgement |
| Random sequence generation (selection bias) | Unclear risk | Not mentioned |
| Allocation concealment (selection bias) | Unclear risk | Not mentioned |
| Blinding (performance bias and detection bias) | Unclear risk | Not mentioned |
| Incomplete outcome data (attrition bias) | Low risk | No missing outcome data |
| Methods | RCT. Follow‐up 12 months. No details of allocation method given. Not all women available in follow‐up | |
| Participants | 46 women recruited, 23 in each arm of the study. 34 women available for follow‐up, reasons for loss to follow‐up not reported. Inclusion and exclusion criteria were well defined | |
| Interventions | A (23): rectus fascia sling B (23): Burch colposuspension | |
| Outcomes | Cure defined as dry, symptom‐free (subjective based on history and objective on ultrasonography) Failure rate: A:0/17, B: 1/17 Late complications (1‐year follow‐up): A: 1 instability; 3 suprapubic pain and 1 dyspareunia; B: 1 instability, 2 dyspareunia and 2 genital prolapse (enterocele) | |
| Notes | Ultrasonography for measurement of bladder neck mobility was tested in both groups pre and post operatory and showed significant improvement but no significant differences between the groups | |
| Risk of bias | ||
| Bias | Authors' judgement | Support for judgement |
| Random sequence generation (selection bias) | Unclear risk | Not mentioned |
| Allocation concealment (selection bias) | Unclear risk | Not mentioned |
| Blinding (performance bias and detection bias) | Unclear risk | Not mentioned |
| Incomplete outcome data (attrition bias) | High risk | 12 women missing lost to follow‐up, reason not reported. No mention of whether loss had impact on final analysis |
| Methods | RCT. Follow‐up at 32‐48 months. Women allocated to 1/2 interventions by open random‐number chart. All women available to follow up | |
| Participants | 72 women recruited, 36 in each arm of the study. Inclusion criteria: all participants with GSI (urodynamic and sonographic diagnosis) had a vaginal hysterectomy and, at least, one previous anterior repair; 57 were postmenopausal without hormone replacement therapy. Exclusion criteria: urinary tract infection, unstable bladder, voiding difficulty and severe cystocele and/or rectocele. Groups were comparable for age, weight, parity, menopausal status, previous surgery and time of follow‐up | |
| Interventions | A (36) Group II: lyophilised dura mater sling operation B (36) Group I: modified Burch colposuspension (two pairs of sutures instead of three) | |
| Outcomes | Cure defined as dry, symptom‐free without objective urine loss during stress with bladder filled to 300 mL or positive urethral‐closure pressure during stress provocation. Failure rate at follow‐up at 32‐48 months: A: 3/36, B: 5/36 Urodynamic results reported before and at follow‐up. Reported longer hospital stay and suprapubic catheter permanence for A. Equal frequency pyrexia and bladder laceration Late complications: enterocele or rectocele: A: 1/36, B: 5/36; voiding difficulty A: 5/36, B: 1/36. Both differences statistically significant. Other problems not statistically significant: urgency/urge incontinence (A: 6/36, B: 3/36). 4 participants reported in control because of residual urine for B. Equal good results in sonographic investigation at follow‐up. | |
| Notes | ||
| Risk of bias | ||
| Bias | Authors' judgement | Support for judgement |
| Random sequence generation (selection bias) | Low risk | Random number chart, even numbers underwent colposuspension; odd numbers underwent sling procedure |
| Allocation concealment (selection bias) | Unclear risk | Not mentioned |
| Blinding (performance bias and detection bias) | Unclear risk | Not mentioned |
| Incomplete outcome data (attrition bias) | Low risk | No missing outcome data |
| Methods | RCT. Details not given. Follow‐up at 6 months | |
| Participants | 22 women with intrinsic sphincter deficiency, 11 in each arm | |
| Interventions | A (11): suburethral sling B (11): Burch retropubic urethropexy | |
| Outcomes | Cure assessed using IIQ, UDI, stress test, voiding dysfunction Success rate reported as: A: 100% (11/11), B: 77.8% (7/9) P = 0.1 | |
| Notes | Abstract only Two participants in the Burch group were found to have recurrent urethrovisical junction hypermobility or displacement and not included in the final analysis. | |
| Risk of bias | ||
| Bias | Authors' judgement | Support for judgement |
| Random sequence generation (selection bias) | Unclear risk | Not mentioned |
| Allocation concealment (selection bias) | Unclear risk | Not mentioned |
| Blinding (performance bias and detection bias) | Unclear risk | Not mentioned |
| Incomplete outcome data (attrition bias) | High risk | Two participants in the Burch group were found to have recurrent urethrovesical junction hypermobility considered surgical failures and excluded from final analysis. Insufficient information to judge whether appropriately addressed |
| Methods | RCT. Details not given in abstract of trial. 3 treatment arms. 4 centres. Follow‐up 6 months and 1 year | |
| Participants | 201 women randomised (mean age 52 years) to Pelvicol‐50, TVT‐72, autologous sling‐79. 85% were available for follow‐up at 1 year Inclusion criteria: women requiring primary surgical treatment for urodynamic SUI | |
| Interventions | A (79) autologous sling B (50) Pelvicol C (72) TVT | |
| Outcomes | Success and improvement rates were described Other outcome measures included: operative details, complications, dry/ improved rates, QoL assessment, catheterisation and re‐operation rates Median theatre time (min): A: 50, B: 35, C: 30 Median length post‐op stay (days): A: 4, B: 4, C: 2 Incontinent at 6 months: A: 41/79, B: 28/50, C: 35/72 Incontinent at 12 months : A: 41/79, B: 39/50, C: 32/72 Not improved at 6 months: A: 4/79, B: 13/50, C: 6/72 Not improved at 12 months: A: 8/79, B: 19/50, C: 5/72 Re‐operation rate: A: 0%, B: 0%, C: 0% Self‐catherterisation at 12 months: A: 1/79, B: 0/50, C: 0/72 | |
| Notes | High re‐operation rates (1 in 5) in Pelvicol group so arm closed. Study closed at 6 years before target number reached. Interim analysis after the first 50 participants in each group No mention of how success rate was assessed in the abstract, on contacting a listed author, we were informed that the figures were patient‐reported | |
| Risk of bias | ||
| Bias | Authors' judgement | Support for judgement |
| Random sequence generation (selection bias) | Unclear risk | Insufficient information to make judgement |
| Allocation concealment (selection bias) | Unclear risk | Insufficient information to make judgement |
| Blinding (performance bias and detection bias) | Unclear risk | Insufficient information to make judgement |
| Incomplete outcome data (attrition bias) | Low risk | No missing outcome data at 12 months. Study closed after 6 years due to failure to recruit target numbers and high reoperation rate |
| Methods | RCT. Details not given. Follow‐up at 4‐6 months | |
| Participants | 30 women randomised, 15 in each arm of the study, all with genuine stress incontinence. All age groups of participants but menopausal status not reported. Exclusion criteria: cystocele, uterine prolapse, urge incontinence, neurogenic bladder, UTIs | |
| Interventions | A (15): Teflon sling (Zoedler urethroplasty) B (15): MMK urethrocystopexy | |
| Outcomes | Cure defined as complete freedom from SUI (subjective and objective demonstration). All participants cured in both groups. Complications not reported. Main differences observed in stress closing pressure of urethra, which became positive after surgery in both groups | |
| Notes | Groups stated similar but no comparisons made at baseline. Short follow‐up | |
| Risk of bias | ||
| Bias | Authors' judgement | Support for judgement |
| Random sequence generation (selection bias) | Unclear risk | Not mentioned |
| Allocation concealment (selection bias) | Unclear risk | Not mentioned |
| Blinding (performance bias and detection bias) | Unclear risk | Not mentioned |
| Incomplete outcome data (attrition bias) | Low risk | No missing outcome data |
| Methods | RCT. Follow‐up at 2, 3, 12 and 24 months. Women allocated to 1/2 interventions by random tables. All women available at follow‐up | |
| Participants | 20 women recruited, 10 in each arm of the study. Inclusion criteria: GSI (urodynamic diagnosis), vaginal narrowing, post surgical scar, unsuitable for colposuspension. Exclusion criteria: not stated. Groups comparable for age, parity and number of previous surgical incontinence procedures. Menopausal status not reported | |
| Interventions | A (10): porcine dermis sling operation B (10): Stamey bladder‐neck (needle) suspension | |
| Outcomes | Cure stated as objective (urodynamic diagnosis, pad test) at 3 months and subjective at 24 months of follow‐up. Failure rates at 3 months: A: 1/10, B: 2/10 Failure rates at 24 months: A: 1/10, B: 3/10 Differences not statistically significant at 3 and 24 months Post op. complications: A: 9/10, B: 2/10 (operative blood loss, pyrexia, infective complications, supra pubic catheter permanence). Hospital stay: A: 20 (12.9), B: 7 (0.3). Late complications not reported. Voiding problems at 3 months: A: 4/10, B:2/10. Detrusor instability: A: 2/10, B: 1/10. Urge incontinence: A: 5/10, B: 3/10. | |
| Notes | Pad test at 12 and 24 months stated but not reported | |
| Risk of bias | ||
| Bias | Authors' judgement | Support for judgement |
| Random sequence generation (selection bias) | Low risk | Random number chart |
| Allocation concealment (selection bias) | Unclear risk | Not mentioned |
| Blinding (performance bias and detection bias) | Unclear risk | Not mentioned |
| Incomplete outcome data (attrition bias) | Low risk | No missing outcome data |
| Methods | RCT randomisation by date of birth method. 2 arms. Odd days assigned to TVT arm, even days PVS. Follow‐up 3, 12 and 24 months | |
| Participants | 63 women who complained of SUI were recruited, 3 eventually declined to undergo surgery, therefore a total of 60 women (29‐PVS, 31‐TVT) with urodynamic stress or mixed incontinence were included. Diagnosis made by a cough‐stress test, a 60 min pad‐weighing test, and urodynamic studies | |
| Interventions | A (29): PVS B (31): TVT | |
| Outcomes | The primary outcome measure was cure of SUI. Objective cure was defined as the complete absence of leakage during the cough‐stress test with 250 or 300 mL of water in the bladder. Subjective cure was consistent with complete dryness or a few drops of water with strong exercises. Other outcome measures (6‐parameter analysis): operation time, numbers of analgesics required in a perioperative period, , changes in haematocrit, length of a Foley catheter, and length of stay Not cured at 24 months (subjective): A: 7/21, B: 4/23 Not cured at 24 months (objective): A: 11/21, B: 7/23 Operative time (mean (SD)): A: 87.1 (13.3), B: 43.9 (17.3) min Length of hospital stay (mean (SD)): A: 9.2 (0.9), B: 9.2 (0.6) days Time to catheter removal (mean (SD)): A: 1.4 (0.5), B: 1.3 (0.1) days Complications: all complications: A: 11/29, B: 9/31; bladder perforation: A: 7/29, B: 7/31; urethral injury: A:0/29, B: 1/31; subcutaneous haematoma: A: 0/29, B: 1/31; voiding dysfunction: A: 4/29, B: 0/31; release of sling surgery: A: 4/29, B: 0/31; de novo detrusor urgency: A: 3/29, B: 2/31 | |
| Notes | Follow‐up 24 months. Women who underwent concomitant surgery (5‐PVS, 8‐TVT) and/or had revision surgery were excluded from the 6‐parameter analysis because extra interventions made a comparison difficult. Participants for the assessment reduced to 23 women in the TVT and 21 in the PVS group Data updated from new publication | |
| Risk of bias | ||
| Bias | Authors' judgement | Support for judgement |
| Random sequence generation (selection bias) | High risk | Date‐of‐birth method |
| Allocation concealment (selection bias) | High risk | Date of birth |
| Blinding (performance bias and detection bias) | Unclear risk | No mention |
| Incomplete outcome data (attrition bias) | Low risk | Similar loss across groups at follow‐up, 72% remained in sling arm and 74% in Burch |
| Methods | RCT. Follow‐up at 3, 6 and 12 months. Women allocated to each arm by a central telephone randomisation system. Not blinded ? operation obvious to all medical and nursing personnel. 3 hospitals | |
| Participants | 165 women randomly assigned to 2 groups. Baseline demographics and symptomology were similar: age, height, weight, symptom years, previous surgery, number and type of concurrent problems between both groups Inclusion criteria: participants > 18 years and urodynamically proven SUI exclusion criteria: evidence of neurological disease; urodynamic evidence of detrusor instability and hypocompliance | |
| Interventions | A (81): standard sling insertion (long) B (84): sling on a string (short) | |
| Outcomes | Primary outcome was to compare QoL scores in both groups over time. Success rate was measured by recurrence of stress leakage as reported in participant questionnaire Secondary outcomes were measured by participant's QoL, clinical indicators (such as immediate post‐operative complications, time to first void, pad tests); administrative indicators, pain scores and participant satisfaction Participant satisfaction at 12 months: A: 57/73, B: 62/82 Stress leakage at 12 months: A: 14/72, B: 16/72 Stress leakage at 3 years: A: 35/75, B: 30/70 Stress leakage at 6 years: A: 42/73, B: 34/69 De novo urgency: A: 6/81,B: 2/84 Pad test volumes (mL): A: 7.71, B: 4.61; P = 0.56 Mean operative time (min): A: 62 (range 38‐135), B: 54 (25 to 140) P = 0.001, (P used to calculate SD: 15.33 in each group) Mean blood loss (mL): A: 274 (50‐800), B: 230 (50‐700) P = 0.07 Length of stay (ds): A: 6.48, B: 6.73 Voiding dysfunction 12 months: A: 19/81, B: 17/84 Readmission within 3 months: A: 19/79, B: 9/83 Surgery to release sling: A: 1/81, B: 4/84 Further continence surgery: A: 2/56, B: 5/69 Pain at 3 months: A: 52/78, B: 42/82 Adverse effects: perioperative surgical complications: A: 34/81, B: 31/84; bladder perforation A 2/81, B 3/84; UTI A 10/81, B 6/84 | |
| Notes | Detailed outcome measures at 3, 6 and 12 months were provided. Both groups showed improvement in their QoL with no significant statistical difference between allocated operation. 46 participants had previously undergone one or more forms of incontinence surgery. Data updated from new publication | |
| Risk of bias | ||
| Bias | Authors' judgement | Support for judgement |
| Random sequence generation (selection bias) | Low risk | Computer‐generated randomisation schedule |
| Allocation concealment (selection bias) | Low risk | Remote telephone randomisation |
| Blinding (performance bias and detection bias) | High risk | Not blinded. Operation performed obvious to all medical and nursing personnel involved in the assessment |
| Incomplete outcome data (attrition bias) | Low risk | Ouctome data were analysed according to the randomised group, per protocol and best possible. 21 women lost to follow‐up by 12 months, 23 lost by 3 years. The similar losses from each arm were unlikely to affect the final analysis. Actual numbers with outcome reported |
| Methods | RCT of pubovaginal sling vs Macroplastique. Follow‐up 6 months and 1 year. ITT analysis performed | |
| Participants | 45 women randomised. 1 from each arm lost to follow‐up by 1 year Inclusion criteria: women with USI and ISD diagnosed by a MUCP less than or equal to 20 cm H2O, who failed to respond to conservative treatment Exclusion criteria: required prolapse surgery, had undergone a sling procedure or were unsuitable for general anaesthesia Baseline comparison included: age (years), BMI (kg/m2), menopause status, parity, previous surgery (abdominal hysterectomy, vaginal hysterectomy/repair, retropubic continence surgery, needle suspension) | |
| Interventions | A (22) pubovaginal Sling B (23) transurethral Macroplastique | |
| Outcomes | Objective success: no leakage due to SUI on repeat urodynamic study Subjective success: no or occasional (less than once a week) stress incontinence Other outcome measures included: voiding dysfunction, participant satisfaction, operating time, blood loss, inpatient days, duration of catheterisation, time to resume normal activities Incontinent within 1st year: A: 2/21, B: 5/22 P = 0.41 Incontinent after 1st year: A: 0/13, B: 4/14 P = 0.1 Incontinent within 1st year (obj): A: 4/21, B: 20/22 P = < 0.0001 Patient satisfaction (self‐reported at 6 months): A: 7/21, B: 13/22 P = 0.41 Patient satisfaction (self‐reported at 5 years): A: 9/13, B: 4/14 P = 0.057 Operative time (mins): A: 60 (25‐105), B: 22 (10‐41) P = < 0.0001 Length of hospital stay (days): A: 4 (3‐81), B: 1 (1‐2) P = < 0.0001 Time to normal activity (weeks): A: 4 (0‐42), B: 28 (0‐35) P = < 0.0001 Time to catheter removal (days): A: 5 (2‐42), B: 1 (0‐7) P = < 0.0001 Further continence surgery: A: 1/21, B: 2/22 Complications: UTI: A: 3/21, B: 2/22; De novo detrusor overactivity: A: 1/21, B: 0/22; voiding dysfunction: A: 4/21, B: 1/22 | |
| Notes | Tertiary referral centres Macroplastique (uroplasty, Minneapolis, Minnesota, USA) is a vulcanised silicone microimplant (polydiamethylsiloxone) suspended in a povidine gel designed to provided urethral bulking for the treatment of SUI | |
| Risk of bias | ||
| Bias | Authors' judgement | Support for judgement |
| Random sequence generation (selection bias) | Unclear risk | Computer randomisation software, no description given |
| Allocation concealment (selection bias) | Unclear risk | Not mentioned |
| Blinding (performance bias and detection bias) | Unclear risk | Not mentioned |
| Incomplete outcome data (attrition bias) | Low risk | Ouctome data were analysed according to the randomised group. One woman in each group failed to return or complete any review. Actual numbers with outcome reported |
| Methods | RCT (block‐randomisation technique). Follow‐up reported at 6 months. Selection criteria were well reported | |
| Participants | 75 women with mixed incontinence symptoms and a negative cystometrogram for motor detrusor overactivity. All had proven stress urinary incontinence. No details on demographic data were reported 21 participants (anticholinergic) and 24 (sling) were available to follow up | |
| Interventions | A (50): surgery (Ai (24) Burch colposuspension, Aii (26) rectus fascia sling) B (25): anticholinergic treatment | |
| Outcomes | Participants were evaluated by SEAPI score (subjective and objective) and underwent urodynamic examination pre and post treatment Cure for urge symptoms: Aii: 88%; B:57% Cure for SUI: Aii: 83%; B: 0 | |
| Notes | The study was designed to investigate anticholinergic therapy in comparison with surgery. Participants allocated to surgery had a sling procedure if the Valsalva leak point pressure was < 90 cm H2O. We extracted only data on sling in comparison with anticholinergics | |
| Risk of bias | ||
| Bias | Authors' judgement | Support for judgement |
| Random sequence generation (selection bias) | Low risk | Block randomisation |
| Allocation concealment (selection bias) | Unclear risk | Not mentioned |
| Blinding (performance bias and detection bias) | Unclear risk | Not mentioned |
| Incomplete outcome data (attrition bias) | Low risk | Of 75 women randomised, 68 evaluated at 6 months. Four lost in anticholinergic arm and 3 in surgical arm. Insufficient information to determine whether appropriately addressed or not |
| Methods | RCT. Abstract. Randomisation 2:1. 2 arms. Follow‐up 1 year | |
| Participants | 34 women randomised. No mention of baseline comparison Inclusion criteria: women 30‐77 years old with SUI due to hypermobility or ISD underwent surgical correction | |
| Interventions | A (10): autologous fascia B (24): FortaPerm | |
| Outcomes | Objective outcome assessment was urine loss using a provocative pad test Subjective participant evaluations included QoL questionnaire, incontinence diary, pain and global outcome assessments Biopsies were taken at 1 year from FortaPerm implant sites adjacent to urethra for histology Incontinent within 1st year: A: 1/10, B: 5/24 Not improved within 1st year (subjective): A: 0/10, B: 2/24 | |
| Notes | FortaPerm is absorbable biomaterial composed of laminated sheets of purified porcine collagen matrix | |
| Risk of bias | ||
| Bias | Authors' judgement | Support for judgement |
| Random sequence generation (selection bias) | Unclear risk | Not mentioned |
| Allocation concealment (selection bias) | Unclear risk | Not mentioned |
| Blinding (performance bias and detection bias) | Unclear risk | Not mentioned |
| Incomplete outcome data (attrition bias) | Low risk | No missing outcome data |
| Methods | RCT by random number table. Follow‐up at 3 months and at 72.6 months (mean) | |
| Participants | 36 women with genuine stress incontinence and a maximum urethral closure pressure ≤ 20 cm H2O. Groups comparable in terms of age, parity, and urodynamic variables, except for detrusor instability (> Burch vs sling) and residual volume (> Burch vs sling) | |
| Interventions | A (17): Polytetrafluoroethylene sling operation B (19): modified (overcorrection) Burch colposuspension | |
| Outcomes | Cure defined as objective (urodynamic) and subjective (history) Objective cure (long‐term): A: 100% 13/13, B: 86% 13/15 Subjective cure (long‐term): A: 84% 11/13, B: 93% 14/15 There were no statistically significant differences in outcome measures | |
| Notes | The first publication (2000) reported the short‐term follow‐up and was considered the primary reference. The last publication (2003) reported the long‐term results | |
| Risk of bias | ||
| Bias | Authors' judgement | Support for judgement |
| Random sequence generation (selection bias) | Low risk | Random number table |
| Allocation concealment (selection bias) | Unclear risk | Not mentioned |
| Blinding (performance bias and detection bias) | Unclear risk | Not mentioned |
| Incomplete outcome data (attrition bias) | Low risk | Similar losses in both groups at long‐term assessment |
| Methods | RCT of TVT with autologous rectus fascia sling. Randomisation by sealed, opaque envelopes. Follow‐up 1, 3, 6 and 12 months | |
| Participants | 100 women randomised into 2 groups. However only 61 followed up to 1 year. 16 were lost due to distance and expense of travel, 12 were age‐related and 11 because of dissatisfaction with surgical result (6‐Sling, 5‐TVT) Inclusion criteria: history of USI, 1‐h pad‐test (> 2 g of leakage), objective positive cough (effort or exertion) ? induced stress test, normal cystourethroscopy and urodynamic confirmation of SI, urethral hypermobility and competent bladder neck Exclusion criteria: history of > 3 episodes of UTI in past 2 years, other gynaecological problems such as high grade uterine prolapse, high grade rectocele and enterocele, cystocele ≥ grade 2, abnormal filling phase of urodynamic study, low flow rates (< 15 mL/s), residual urine of more than 100 mL, trabeculated bladder mucosa on cystourethroscopy, a history of major pelvic trauma, and fractures that might negatively affect urethral function Mixed incontinence was included provided urodynamics showed normal capacity, normal compliance and stable bladder The 2 groups had similar characteristics with respect to age, parity, hysterectomy, previous incontinence surgery, sensory urge incontinence, preoperative IIQ score | |
| Interventions | A (52) pubovaginal sling B (48) TVT | |
| Outcomes | Objective cure defined as negative cough‐induced stress test with full bladder (at least 250 mL filled) in the lithotomy and standing position and a 1‐h pad‐test ≤ 2 g Subjective cure defined by mean IIQ score in each group Also assessed were: type of anaesthesia, operative time, estimated blood loss, bladder penetration and satisfaction with procedure Incontinent within 1 year (stress test): A: 6/36, B: 3/25 P = 0.9 Incontinent within 1 year (1‐h pad test): A: 10/36, B: 6/25 P = 0.83 Participantsatisfaction at 12 months: A: 20/36, B: 15/25 Operative time (min): A: 80 (50‐180), B: 45 (30‐70) P = 0.01 Length of hospital stay (days): A: 5 (3‐7), B: 2 (1‐5) P = 0.001 Time to catheter removal (days): A: 4.6 (3‐6), B: 1.3 (1‐5) P = 0.001 Complications: de novo urge symptoms: A: 8/36, B: 1/25; voiding dysfunction: A: 11/36, B: 5/25; bladder perforation: A: 2/36, B: 6/25 P = 0.05; bleeding (> 250mL): A: 1/36, B: 1/25 P = 1.00; suprapubic incisional hernia after 8 months: A: 1/36, B: 1/25 | |
| Notes | Procedures performed by single surgeon All participants were preoperatively evaluated by, physical examination, plain abdominal X‐ray, urinary tract ultrasound, cystourethroscopy and urodynamic study Physical examination assessed degree of prolapsed, basal lab tests (FBC, renal and liver function tests, serum electrolytes, urine analysis, culture) Assumption was made that t‐test was used for operative time, catheterisation and hospital stay | |
| Risk of bias | ||
| Bias | Authors' judgement | Support for judgement |
| Random sequence generation (selection bias) | Unclear risk | Not mentioned |
| Allocation concealment (selection bias) | Unclear risk | Sealed, opaque envelopes, no mention of numbering |
| Blinding (performance bias and detection bias) | Unclear risk | Not mentioned |
| Incomplete outcome data (attrition bias) | Low risk | All outcomes assessed in randomised groups. 39 participants lost to follow‐up. Similar losses in each group |
| Methods | RCT stated. Details not given in the abstract of trial. Follow‐up after first year reported | |
| Participants | 57 women with various types of SUI. Participants' characteristics were not reported | |
| Interventions | A (33): autologous dermal graft patch B (24): cadaveric fascia lata | |
| Outcomes | Outcome measures reported were success rate (dry/improved), de novo detrusor instability Success rate: A: 91, 6%, B: 93, 2% | |
| Notes | ||
| Risk of bias | ||
| Bias | Authors' judgement | Support for judgement |
| Random sequence generation (selection bias) | Unclear risk | Insufficient information |
| Allocation concealment (selection bias) | Unclear risk | Not mentioned |
| Blinding (performance bias and detection bias) | Unclear risk | Not mentioned |
| Incomplete outcome data (attrition bias) | Low risk | No missing outcome data. (based on abstract) |
| Methods | RCT of SAFYRE TOT with autologous pubovaginal sling. Randomisation method unclear. Follow‐up 6 months | |
| Participants | 20 women (average age of 52.5 years ± 11.8 years) with both USI and SUI but without detrusor overactivity The 2 groups had similar characteristics with respect to age, parity, BMI, menopausal status, presence of pelvic floor defects, and mean Valsalva leak point pressure in the preoperative UDS | |
| Interventions | A (10): pubovaginal sling B (10): SAFYRE TOT | |
| Outcomes | Cure rates and intraoperative and postoperative morbidity. Women were declared objectively cured when they had a postoperative pad test of ≤ 8 g All participants were preoperatively evaluated by history, physical examination, QoL questionnaire (King's Health Questionnaire), a 24‐h pad weight test, a 2‐d voiding diary, and a multichannel urodynamic study that included uroflowmetry, post‐void residual volume measurement by urethral catheter, and a cystometrogram. The objective quantification of the severity of incontinence was done by the mean stress leaking point pressure in the urodynamic study. Preoperative measurements included the type of anaesthesia, duration of surgery, intraoperative complications, occurrence of combined procedures, and hospital stay. At 6‐month follow‐up the aforementioned measurements were carried out excluding UDS. Post operative pad test (mean (SD)): A: 8.4 (16.44), B: 39.4 (39.53) g; P = 0.01 Operative time (mean (SD)): A: 69.5 (23.7), B: 21.1 (3.8) min; P < 0.001 Length of hospital stay (mean (SD)): A: 44.4 (5.8), B: 28.8 (8.4) h; P < 0.001 | |
| Notes | SAFYRE consists of a monofilament polypropylene mesh between two silicone columns that are made of multiple cone‐shaped soft tissue anchors. The two columns are fixed to the obturator muscle. The pubovaginal sling uses rectus fascia | |
| Risk of bias | ||
| Bias | Authors' judgement | Support for judgement |
| Random sequence generation (selection bias) | Unclear risk | Not mentioned |
| Allocation concealment (selection bias) | Unclear risk | Not mentioned |
| Blinding (performance bias and detection bias) | Unclear risk | Not mentioned |
| Incomplete outcome data (attrition bias) | Low risk | No missing outcome data |
| Methods | RCT of TVT compared with autologous fascia lata pubovaginal sling. Single centre | |
| Participants | 67 women with SUI were randomised. Basline comparison of age, menopause status, parity, SUI, mixed incontinence and intrinsic sphincter dysfunction were made Inclusion criteria: type II‐IV SUI, mixed SUI, intrinsic sphincter dysfunction, or failed previous operations Mixed incontinence was included in this study | |
| Interventions | A (19): autologous fascia lata pubovaginal sling B (48): TVT | |
| Outcomes | Cure rates and operative morbidity Damage to bladder, urinary retention, difficulty voiding Incontinent at 3 months: A: 1/19, B: 3/48 Not improved at 3 months A: 0/19, B: 0/48 Operative time (SD): A: 125 (13), B: 27 (5) min Mean length of hospital stay: A: 7.2, B: 1.8 ds Mean time to catheter removal: A: 5.3, B: 1 ds Complications: voiding dysfunction: A: 3/19, B: 3/48; urinary retention: A: 2/19, B: 0/48; bladder injury: A: 0/19, B: 2/48; detrusor overactivity: A: 1/19, B: 3/48 | |
| Notes | Follow‐up on average was between 20‐37 months. Cure rates assessed at 3 months Full text was translated from Chinese | |
| Risk of bias | ||
| Bias | Authors' judgement | Support for judgement |
| Random sequence generation (selection bias) | Unclear risk | Not mentioned |
| Allocation concealment (selection bias) | Unclear risk | Not mentioned |
| Blinding (performance bias and detection bias) | Unclear risk | Not mentioned |
| Incomplete outcome data (attrition bias) | Low risk | No missing outcome data |
| Methods | RCT. Follow‐up 12 months | |
| Participants | 41 women randomly distributed into two groups. Participants had similar baseline characteristics (age, BMI, parity, vaginal births, postmenopausal conditions, hormone replacement therapy, previous SUI surgery, genital prolapse, previous surgery/previous hysterectomy, disease duration) Inclusion criteria: USI, confirmed through medical history, physical exam, and urodynamic investigation | |
| Interventions | A (20): retropubic sling B (21): SAFYRE TOT | |
| Outcomes | Cure was reported absence of SUI and no urinary loss during effort manoeuvres at 12‐month follow‐up re‐evaluation. Failure at 12 months: A: 1/20, B: 2/21 Operative time (mean (SD)): A: 59.7 (10.3), B: 12.8 (2.4) mins Time to catheter removal: A: 2, B: 1 ds Complications: all complications: A: 12/20, B: 3/21; UTI: A: 2/20 B: 0/21; bladder perforation: A: 1/20, B: 0/21; urinary retention: B: 3/20, A: 2/21; vaginal mesh erosion (isolated): A: 0/20, B: 1/21 | |
| Notes | Physical exam specifically evaluated urinary loss through Valsalva manoeuvre and presence of other concurrent dystopias of pelvic floor (anterior, posterior, and apical), using POP‐Q classification. VLPP standardised in this study at 200 mL of vesical repletion Urodynamic study performed on every participant included | |
| Risk of bias | ||
| Bias | Authors' judgement | Support for judgement |
| Random sequence generation (selection bias) | Unclear risk | Participants "randomly distributed". No detail provided |
| Allocation concealment (selection bias) | Unclear risk | Not mentioned |
| Blinding (performance bias and detection bias) | Unclear risk | Not mentioned |
| Incomplete outcome data (attrition bias) | Low risk | No missing outcome data |
| Methods | RCT. Details not given in abstract. Follow‐up 24 h and 90 ds | |
| Participants | 42 participants were randomised (porcine collagen‐21, polypropylene tapes‐21) Inclusion criteria: stress urinary incontinence | |
| Interventions | A (21) porcine collagen B (21) polypropylene tapes | |
| Outcomes | No outcome measure relevant to this review C reactive protein and white blood count measured previous day and at 24 h after surgery Biopsy at 90ds post operation for local inflammatory markers (polymorphonuclear cells, mononuclear cells, giant cells and neovascularisation) and collagen reaction (collagen amount, composition and organisation) | |
| Notes | Trial assessing systemic and local inflammatory response in different sling materials | |
| Risk of bias | ||
| Bias | Authors' judgement | Support for judgement |
| Random sequence generation (selection bias) | Unclear risk | No details provided |
| Allocation concealment (selection bias) | Unclear risk | "blindly randomised" no details provided |
| Blinding (performance bias and detection bias) | Unclear risk | Not mentioned |
| Incomplete outcome data (attrition bias) | Unclear risk | 2 participants with missing outcome data. No detail provided on whether losses were similar in both groups, or from a single arm of the trial |
| Methods | RCT. Method not clarified. Only the short‐term follow‐up reported | |
| Participants | 26 women with stress urinary incontinence | |
| Interventions | A (15): fascial sling B (11): vaginal wall sling | |
| Outcomes | Measures of outcome included SEAPI‐QMN questionnaire, presence of SUI at postoperative period, urinary symptoms and hospital stay. Cure rates: SEAPI scores decreased from 6.1 to 0.9 for B and from 6.3 to 0.8 for A | |
| Notes | All procedures performed by same surgeon No useable data | |
| Risk of bias | ||
| Bias | Authors' judgement | Support for judgement |
| Random sequence generation (selection bias) | Unclear risk | Insufficient information |
| Allocation concealment (selection bias) | Unclear risk | Not mentioned |
| Blinding (performance bias and detection bias) | Unclear risk | Not mentioned |
| Incomplete outcome data (attrition bias) | Low risk | No missing outcome data |
| Methods | RCT randomised by closed envelope delivered to surgeon by a third party. Procedures by one surgeon. Follow‐up 6 months | |
| Participants | 53 women (mean age 45.12 years) with SUI were randomised, all had similar background characteristics (age, BMI, parity, grade of associated cystocoele) Inclusion criteria were age > 21 years, Predominant symptom of SUI, willing to give informed consent, life expectancy > 1 year, normal upper urinary tract and normal manual dexterity Exclusion: pelvic or vaginal surgery within 6 months, urge incontinence as predominant symptom, > grade 2 cystocele, associated urethral pathology e.g. diverticulum, associated bladder pathology e.g. fistula, culture proven, active urinary tract infection | |
| Interventions | A (25): autologous fascial sling B (28): TVT | |
| Outcomes | Cure, i.e. complete dryness with no usage of pad and negative cough‐stress test Not cured at 6 months: A: 2/25, B: 2/28 Operative time (mean (SD)): A: 68 (23), B: 48 (25) min Time to catheter removal (mean (SD)): A: 6.6 (5.3), B: 4.3 (2.6) d Complications: bladder perforation: A: 1/25, B: 2/28; de novo detrusor overactivity at 6 months: A: 1/23, B: 0/24; stitch sinus at 1 week: A: 0/25, B 1/28; vaginal erosion: A: 0/25, B: 0/28; wound pain at 6 months: A: 7/25, B: 2/28; voiding dysfunction: A: 7/25, B: 3/28 | |
| Notes | ||
| Risk of bias | ||
| Bias | Authors' judgement | Support for judgement |
| Random sequence generation (selection bias) | Unclear risk | Not mentioned |
| Allocation concealment (selection bias) | Low risk | Closed, opaque envelopes held by a non‐involved 3rd party who revealed the allocation after participant had been anaesthetised, just before start of surgery |
| Blinding (performance bias and detection bias) | Unclear risk | No details provided |
| Incomplete outcome data (attrition bias) | Low risk | No missing data |
BMI = body mass index
IIQ = Incontinence Impact Questionnaire
ISD = Intrinsic sphincter dysfunction
ITT = intention to treat
MMK = Marshall‐Marchetti‐Krantz
MUCP = maximum urethral closure pressure
POP = pelvic organ prolapse
QoL = quality of life
RCT = randomised controlled trial
SEAPI = SEAPI QMM incontinence classification system
SUI = stress urinary incontinence
TVT = tension‐free vaginal tape
UDI = Urinary Distress Inventory
UDS = urodynamics
UI = urinary incontinence
USI = urodynamic stress incontinence
UTI = urinary tract infection
UUI = urge urinary incontinence
VLPP = Valsava leak point pressure
Characteristics of excluded studies [ordered by study ID]
| Study | Reason for exclusion |
| RCT. One minimally invasive sling versus another | |
| Non‐randomised | |
| We are not sure about the population studied and it could be the same population as Barrington 2003 and Arunkalaivanan 2003 (included in the review); we have written to the trial authors to clarify this point. | |
| We are not sure about the population studied and it could be the same population as Aurunkalaivanan 2001 and Arunkalaivanan 2003 (included in the review); we have written to the trial authors to clarify this point. | |
| Not RCT, no comparator group | |
| Allocation score C (participants randomised by alternating fashion). Trial comparing slings made of vaginal wall and of polytetrafluorethylene mesh impregnated with chorhexidine | |
| All participants were randomised to undergo preoperative urodynamic evaluation or not. They then had implantation of suburethral mycromesh sling. Therefore the study analyses the impact on effectiveness of sling if the diagnosis of SUI is made with or without urodynamic evaluation | |
| Participants all had TVT operation, were randomised to division/no division of tape | |
| Participants were randomised to surgery or collagen injection but those in the surgery arm were selected to sling by participant's option. Three types of operation could be chosen in the surgery group: Burch, sling or bladder neck suspension. Results were reported in terms of collagen versus surgery | |
| RCT 1 minimally invasive sling versus another Inlcuded in Minimally Invasive Sling Cochrane Review | |
| Not all participants had stress incontinence (and allocation score C ‐ participants randomised by birth date). Debodinance 2000 is a 10‐year follow‐up of the first published study. The trial is a comparative study between Bologna (a sling made of strips of vaginal wall) and Ingelman‐Sundberg procedure (anterior colporrhaphy with pubococcygeus muscle) | |
| Not clear how participants allocated. Paper in French, need translation | |
| We are not sure about the population studied and it could be the same population as Giri 2006, which has been excluded as it was a non‐randomised study. We have made attempts to contact the study authors. | |
| Non‐randomised | |
| Prolapse surgery rather than incontinence surgery | |
| Study comparing transvaginal tape with colposuspension; will be included in a separate review on self‐fixing slings | |
| Study comparing transvaginal tape with colposuspension; will be included in a separate review on self‐fixing slings. | |
| Not clear how participants were allocated, we have written to the study authors | |
| Randomisation and groups unclear ('randomised by age'). Excluded as attempts to contact study authors unsuccessful and insufficient information given in abstract. Interventions: vaginal hysterectomy, modified Pereyra procedure, anterior and posterior repair vs vaginal hysterectomy, sling procedure with Mersilene mesh, anterior and posterior repair | |
| Study comparing transvaginal tape procedures; will be included in a separate review on self‐fixing slings. | |
| Allocation score C (participants randomised by consecutive study entry). Comparison between rectus fascia and polypropylene mesh | |
| Not all participants had stress incontinence; all participants were treated for prolapse but one group received concomitant transvaginal sling (processed fascia lata), one group received an alternate surgery for SUI and the last group, didn't have SUI and were submitted only to treatment of prolapse | |
| Interventions were on clamping versus non‐clamping of catheters post‐anti‐incontinence surgery | |
| Study comparing transvaginal tape with colposuspension; will be included in a separate review on self‐fixing slings | |
| This study is comparing minimally invasive sling procedures and will be included in that Cochrane Review. | |
| Surgery for prolapse rather than incontinence | |
| This study is comparing tape procedures and will be included in the minimally invasive slings Cochrane Review. | |
| RCT. Participants randomised to colposuspension or transvaginal tape. Outcome measures (collagen metabolism) reported not included in this review | |
| Not clear how participants were allocated. Study author written to in October 2001, no reply received | |
| Unclear how participants were allocated. Bone anchoring used | |
| RCT. One minimally invasive sling versus another | |
| Occult incontinence treated at same time as prolapse repair | |
| Randomised to different types of anaesthetic | |
| Study comparing transvaginal tape with colposuspension; will be included in a separate review on self‐fixing slings | |
| This study is comparing tape procedures and will be added to the minimally invasive slings Cochrane Review. |
Characteristics of ongoing studies [ordered by study ID]
| Trial name or title | A prospective randomised comparative trial of a tension free vaginal tape (TVT) and fascial sling procedure for 'secondary' genuine stress incontinence |
| Methods | |
| Participants | 146 planned recruitment |
| Interventions | TVT versus fascial sling |
| Outcomes | No information |
| Starting date | |
| Contact information | |
| Notes |
| Trial name or title | Sling operation for stress urinary incontinence: randomised trial of three operative procedures |
| Methods | |
| Participants | |
| Interventions | TVT versus Pelvicol versus sling on a string |
| Outcomes | |
| Starting date | |
| Contact information | |
| Notes | Possibly same as Lucas 2004 |
Data and analyses
| Outcome or subgroup title | No. of studies | No. of participants | Statistical method | Effect size |
| 1 Number with incontinence (worse, unchanged or improved) within the first year (women's observations) Show forest plot | 1 | Risk Ratio (M‐H, Fixed, 95% CI) | Totals not selected | |
| Analysis 3.1  Comparison 3 Sling versus drugs, Outcome 1 Number with incontinence (worse, unchanged or improved) within the first year (women's observations). | ||||
| 1.1 urodynamic stress incontinence (only) | 0 | Risk Ratio (M‐H, Fixed, 95% CI) | 0.0 [0.0, 0.0] | |
| 1.2 stress urinary incontinence (symptoms only) | 0 | Risk Ratio (M‐H, Fixed, 95% CI) | 0.0 [0.0, 0.0] | |
| 1.3 mixed incontinence | 1 | Risk Ratio (M‐H, Fixed, 95% CI) | 0.0 [0.0, 0.0] | |
| 2 Urge symptoms or urge incontinence Show forest plot | 1 | Risk Ratio (M‐H, Fixed, 95% CI) | Totals not selected | |
| Analysis 3.2  Comparison 3 Sling versus drugs, Outcome 2 Urge symptoms or urge incontinence. | ||||
| 2.1 urodynamic stress incontinence (only) | 0 | Risk Ratio (M‐H, Fixed, 95% CI) | 0.0 [0.0, 0.0] | |
| 2.2 stress urinary incontinence (symptoms only) | 0 | Risk Ratio (M‐H, Fixed, 95% CI) | 0.0 [0.0, 0.0] | |
| 2.3 mixed incontinence | 1 | Risk Ratio (M‐H, Fixed, 95% CI) | 0.0 [0.0, 0.0] | |
| Outcome or subgroup title | No. of studies | No. of participants | Statistical method | Effect size |
| 1 Number with incontinence (worse, unchanged or improved) within the first year (women's observations) Show forest plot | 1 | Risk Ratio (M‐H, Fixed, 95% CI) | Totals not selected | |
| Analysis 4.1 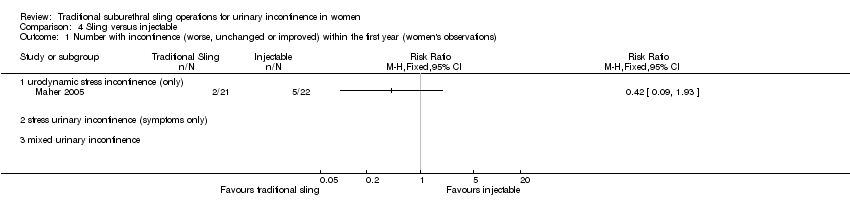 Comparison 4 Sling versus injectable, Outcome 1 Number with incontinence (worse, unchanged or improved) within the first year (women's observations). | ||||
| 1.1 urodynamic stress incontinence (only) | 1 | Risk Ratio (M‐H, Fixed, 95% CI) | 0.0 [0.0, 0.0] | |
| 1.2 stress urinary incontinence (symptoms only) | 0 | Risk Ratio (M‐H, Fixed, 95% CI) | 0.0 [0.0, 0.0] | |
| 1.3 mixed urinary incontinence | 0 | Risk Ratio (M‐H, Fixed, 95% CI) | 0.0 [0.0, 0.0] | |
| 2 Number with incontinence (worse, unchanged or improved) after first year (women's observations) Show forest plot | 1 | Risk Ratio (M‐H, Fixed, 95% CI) | Totals not selected | |
| Analysis 4.2  Comparison 4 Sling versus injectable, Outcome 2 Number with incontinence (worse, unchanged or improved) after first year (women's observations). | ||||
| 2.1 urodynamic stress incontinence (only) | 1 | Risk Ratio (M‐H, Fixed, 95% CI) | 0.0 [0.0, 0.0] | |
| 2.2 stress urinary incontinence (symptoms only) | 0 | Risk Ratio (M‐H, Fixed, 95% CI) | 0.0 [0.0, 0.0] | |
| 2.3 mixed urinary incontinence | 0 | Risk Ratio (M‐H, Fixed, 95% CI) | 0.0 [0.0, 0.0] | |
| 3 Number with incontinence (clinician's observations) within first year Show forest plot | 1 | Risk Ratio (M‐H, Fixed, 95% CI) | Totals not selected | |
| Analysis 4.3  Comparison 4 Sling versus injectable, Outcome 3 Number with incontinence (clinician's observations) within first year. | ||||
| 3.1 urodynamic stress incontinence (only) | 1 | Risk Ratio (M‐H, Fixed, 95% CI) | 0.0 [0.0, 0.0] | |
| 3.2 stress urinary incontinence (symptoms only) | 0 | Risk Ratio (M‐H, Fixed, 95% CI) | 0.0 [0.0, 0.0] | |
| 3.3 mixed urinary incontinence | 0 | Risk Ratio (M‐H, Fixed, 95% CI) | 0.0 [0.0, 0.0] | |
| 4 Voiding dysfunction Show forest plot | 1 | Risk Ratio (M‐H, Fixed, 95% CI) | Totals not selected | |
| Analysis 4.4  Comparison 4 Sling versus injectable, Outcome 4 Voiding dysfunction. | ||||
| 4.1 urodynamic stress incontinence (only) | 1 | Risk Ratio (M‐H, Fixed, 95% CI) | 0.0 [0.0, 0.0] | |
| 4.2 stress urinary incontinence (symptoms only) | 0 | Risk Ratio (M‐H, Fixed, 95% CI) | 0.0 [0.0, 0.0] | |
| 4.3 mixed urinary incontinence | 0 | Risk Ratio (M‐H, Fixed, 95% CI) | 0.0 [0.0, 0.0] | |
| 5 De novo detrusor overactivity (urodynamic diagnosis) Show forest plot | 1 | Risk Ratio (M‐H, Fixed, 95% CI) | Totals not selected | |
| Analysis 4.5  Comparison 4 Sling versus injectable, Outcome 5 De novo detrusor overactivity (urodynamic diagnosis). | ||||
| 5.1 urodynamic stress incontinence (only) | 1 | Risk Ratio (M‐H, Fixed, 95% CI) | 0.0 [0.0, 0.0] | |
| 5.2 stress urinary incontinence (symptoms only) | 0 | Risk Ratio (M‐H, Fixed, 95% CI) | 0.0 [0.0, 0.0] | |
| 5.3 mixed urinary incontinence | 0 | Risk Ratio (M‐H, Fixed, 95% CI) | 0.0 [0.0, 0.0] | |
| 6 Urinary tract infection Show forest plot | 1 | Risk Ratio (M‐H, Fixed, 95% CI) | Totals not selected | |
| Analysis 4.6  Comparison 4 Sling versus injectable, Outcome 6 Urinary tract infection. | ||||
| 6.1 urodynamic stress incontinence (only) | 1 | Risk Ratio (M‐H, Fixed, 95% CI) | 0.0 [0.0, 0.0] | |
| 6.2 stress urinary incontinence (symptoms only) | 0 | Risk Ratio (M‐H, Fixed, 95% CI) | 0.0 [0.0, 0.0] | |
| 6.3 mixed urinary incontinence | 0 | Risk Ratio (M‐H, Fixed, 95% CI) | 0.0 [0.0, 0.0] | |
| Outcome or subgroup title | No. of studies | No. of participants | Statistical method | Effect size |
| 1 Number with incontinence (worse, unchanged or improved) within the first year (women's observations) Show forest plot | 4 | 147 | Risk Ratio (M‐H, Fixed, 95% CI) | 0.40 [0.11, 1.41] |
| Analysis 5.1  Comparison 5 Sling versus open abdominal retropubic suspension, Outcome 1 Number with incontinence (worse, unchanged or improved) within the first year (women's observations). | ||||
| 1.1 urodynamic stress incontinence (only) | 4 | 147 | Risk Ratio (M‐H, Fixed, 95% CI) | 0.40 [0.11, 1.41] |
| 1.2 stress urinary incontinence (symptoms only) | 0 | 0 | Risk Ratio (M‐H, Fixed, 95% CI) | 0.0 [0.0, 0.0] |
| 1.3 mixed incontinence | 0 | 0 | Risk Ratio (M‐H, Fixed, 95% CI) | 0.0 [0.0, 0.0] |
| 2 Number not improved (worse or unchanged) within the first year (women's observations) | 0 | 0 | Risk Ratio (M‐H, Fixed, 95% CI) | 0.0 [0.0, 0.0] |
| 2.1 urodynamic stress incontinence (only) | 0 | 0 | Risk Ratio (M‐H, Fixed, 95% CI) | 0.0 [0.0, 0.0] |
| 2.2 stress urinary incontinence (symptoms only) | 0 | 0 | Risk Ratio (M‐H, Fixed, 95% CI) | 0.0 [0.0, 0.0] |
| 2.3 mixed incontinence | 0 | 0 | Risk Ratio (M‐H, Fixed, 95% CI) | 0.0 [0.0, 0.0] |
| 3 Number with incontinence (worse, unchanged or improved) after first year (women's observations) Show forest plot | 5 | 715 | Risk Ratio (M‐H, Fixed, 95% CI) | 0.75 [0.62, 0.90] |
| Analysis 5.3  Comparison 5 Sling versus open abdominal retropubic suspension, Outcome 3 Number with incontinence (worse, unchanged or improved) after first year (women's observations). | ||||
| 3.1 urodynamic stress incontinence (only) | 4 | 195 | Risk Ratio (M‐H, Fixed, 95% CI) | 0.72 [0.31, 1.67] |
| 3.2 stress urinary incontinence (symptoms only) | 1 | 520 | Risk Ratio (M‐H, Fixed, 95% CI) | 0.75 [0.62, 0.91] |
| 3.3 mixed incontinence | 0 | 0 | Risk Ratio (M‐H, Fixed, 95% CI) | 0.0 [0.0, 0.0] |
| 4 Number not improved (worse or unchanged) after first year (women's observations) | 0 | 0 | Risk Ratio (M‐H, Fixed, 95% CI) | 0.0 [0.0, 0.0] |
| 4.1 urodynamic stress incontinence (only) | 0 | 0 | Risk Ratio (M‐H, Fixed, 95% CI) | 0.0 [0.0, 0.0] |
| 4.2 stress urinary incontinence (symptoms only) | 0 | 0 | Risk Ratio (M‐H, Fixed, 95% CI) | 0.0 [0.0, 0.0] |
| 4.3 mixed incontinence | 0 | 0 | Risk Ratio (M‐H, Fixed, 95% CI) | 0.0 [0.0, 0.0] |
| 5 Pad changes over 24 hours | 0 | 0 | Mean Difference (IV, Fixed, 95% CI) | 0.0 [0.0, 0.0] |
| 5.1 urodynamic stress incontinence (only) | 0 | 0 | Mean Difference (IV, Fixed, 95% CI) | 0.0 [0.0, 0.0] |
| 5.2 stress urinary incontinence (symptoms only) | 0 | 0 | Mean Difference (IV, Fixed, 95% CI) | 0.0 [0.0, 0.0] |
| 5.3 mixed incontinence | 0 | 0 | Mean Difference (IV, Fixed, 95% CI) | 0.0 [0.0, 0.0] |
| 6 Incontinent episodes over 24 hours | 0 | 0 | Mean Difference (IV, Fixed, 95% CI) | 0.0 [0.0, 0.0] |
| 6.1 urodynamic stress incontinence (only) | 0 | 0 | Mean Difference (IV, Fixed, 95% CI) | 0.0 [0.0, 0.0] |
| 6.2 stress urinary incontinence (symptoms only) | 0 | 0 | Mean Difference (IV, Fixed, 95% CI) | 0.0 [0.0, 0.0] |
| 6.3 mixed incontinence | 0 | 0 | Mean Difference (IV, Fixed, 95% CI) | 0.0 [0.0, 0.0] |
| 7 Pad test weights | 0 | 0 | Mean Difference (IV, Fixed, 95% CI) | 0.0 [0.0, 0.0] |
| 7.1 urodynamic stress incontinence (only) | 0 | 0 | Mean Difference (IV, Fixed, 95% CI) | 0.0 [0.0, 0.0] |
| 7.2 stress urinary incontinence (symptoms only) | 0 | 0 | Mean Difference (IV, Fixed, 95% CI) | 0.0 [0.0, 0.0] |
| 7.3 mixed incontinence | 0 | 0 | Mean Difference (IV, Fixed, 95% CI) | 0.0 [0.0, 0.0] |
| 8 Number with incontinence (clinician's observations) within the first year | 0 | 0 | Risk Ratio (M‐H, Fixed, 95% CI) | 0.0 [0.0, 0.0] |
| 8.1 urodynamic stress incontinence (only) | 0 | 0 | Risk Ratio (M‐H, Fixed, 95% CI) | 0.0 [0.0, 0.0] |
| 8.2 stress urinary incontinence (symptoms only) | 0 | 0 | Risk Ratio (M‐H, Fixed, 95% CI) | 0.0 [0.0, 0.0] |
| 8.3 mixed incontinence | 0 | 0 | Risk Ratio (M‐H, Fixed, 95% CI) | 0.0 [0.0, 0.0] |
| 9 Number with incontinence (clinician's observations) after first year Show forest plot | 3 | 620 | Risk Ratio (M‐H, Fixed, 95% CI) | 0.95 [0.64, 1.41] |
| Analysis 5.9  Comparison 5 Sling versus open abdominal retropubic suspension, Outcome 9 Number with incontinence (clinician's observations) after first year. | ||||
| 9.1 urodynamic stress incontinence (only) | 1 | 28 | Risk Ratio (M‐H, Fixed, 95% CI) | 0.23 [0.01, 4.37] |
| 9.2 stress urinary incontinence (symptoms only) | 2 | 592 | Risk Ratio (M‐H, Fixed, 95% CI) | 0.99 [0.66, 1.47] |
| 9.3 mixed incontinence | 0 | 0 | Risk Ratio (M‐H, Fixed, 95% CI) | 0.0 [0.0, 0.0] |
| 10 Operative time (minutes) Show forest plot | 1 | Mean Difference (IV, Fixed, 95% CI) | Totals not selected | |
| Analysis 5.10  Comparison 5 Sling versus open abdominal retropubic suspension, Outcome 10 Operative time (minutes). | ||||
| 10.1 urodynamic stress incontinence (only) | 1 | Mean Difference (IV, Fixed, 95% CI) | 0.0 [0.0, 0.0] | |
| 10.2 stress urinary incontinence (symptoms only) | 0 | Mean Difference (IV, Fixed, 95% CI) | 0.0 [0.0, 0.0] | |
| 10.3 mixed incontinence | 0 | Mean Difference (IV, Fixed, 95% CI) | 0.0 [0.0, 0.0] | |
| 11 Time to catheter removal (days) Show forest plot | 2 | 108 | Mean Difference (IV, Fixed, 95% CI) | 8.01 [6.84, 9.18] |
| Analysis 5.11  Comparison 5 Sling versus open abdominal retropubic suspension, Outcome 11 Time to catheter removal (days). | ||||
| 11.1 urodynamic stress incontinence (only) | 1 | 36 | Mean Difference (IV, Fixed, 95% CI) | 9.5 [‐4.27, 23.27] |
| 11.2 stress urinary incontinence (symptoms only) | 1 | 72 | Mean Difference (IV, Fixed, 95% CI) | 8.0 [6.82, 9.18] |
| 11.3 mixed incontinence | 0 | 0 | Mean Difference (IV, Fixed, 95% CI) | 0.0 [0.0, 0.0] |
| 12 Length of inpatient stay (days) Show forest plot | 3 | 137 | Mean Difference (IV, Fixed, 95% CI) | 2.03 [1.47, 2.59] |
| Analysis 5.12  Comparison 5 Sling versus open abdominal retropubic suspension, Outcome 12 Length of inpatient stay (days). | ||||
| 12.1 urodynamic stress incontinence (only) | 3 | 137 | Mean Difference (IV, Fixed, 95% CI) | 2.03 [1.47, 2.59] |
| 12.2 stress urinary incontinence (symptoms only) | 0 | 0 | Mean Difference (IV, Fixed, 95% CI) | 0.0 [0.0, 0.0] |
| 12.3 mixed incontinence | 0 | 0 | Mean Difference (IV, Fixed, 95% CI) | 0.0 [0.0, 0.0] |
| 13 Time to return to normal activity level | 0 | 0 | Mean Difference (IV, Fixed, 95% CI) | 0.0 [0.0, 0.0] |
| 13.1 urodynamic stress incontinence (only) | 0 | 0 | Mean Difference (IV, Fixed, 95% CI) | 0.0 [0.0, 0.0] |
| 13.2 stress urinary incontinence (symptoms only) | 0 | 0 | Mean Difference (IV, Fixed, 95% CI) | 0.0 [0.0, 0.0] |
| 13.3 mixed incontinence | 0 | 0 | Mean Difference (IV, Fixed, 95% CI) | 0.0 [0.0, 0.0] |
| 14 Peri‐operative surgical complications Show forest plot | 4 | 792 | Risk Ratio (M‐H, Fixed, 95% CI) | 1.31 [1.14, 1.51] |
| Analysis 5.14  Comparison 5 Sling versus open abdominal retropubic suspension, Outcome 14 Peri‐operative surgical complications. | ||||
| 14.1 urodynamic stress incontinence (only) | 3 | 137 | Risk Ratio (M‐H, Fixed, 95% CI) | 0.85 [0.28, 2.52] |
| 14.2 stress urinary incontinence (symptoms only) | 1 | 655 | Risk Ratio (M‐H, Fixed, 95% CI) | 1.33 [1.16, 1.53] |
| 14.3 mixed incontinence | 0 | 0 | Risk Ratio (M‐H, Fixed, 95% CI) | 0.0 [0.0, 0.0] |
| 15 Bladder perforation Show forest plot | 1 | Risk Ratio (M‐H, Fixed, 95% CI) | Totals not selected | |
| Analysis 5.15  Comparison 5 Sling versus open abdominal retropubic suspension, Outcome 15 Bladder perforation. | ||||
| 15.1 urodynamic stress incontinence (only) | 0 | Risk Ratio (M‐H, Fixed, 95% CI) | 0.0 [0.0, 0.0] | |
| 15.2 stress urinary incontinence (symptoms only) | 1 | Risk Ratio (M‐H, Fixed, 95% CI) | 0.0 [0.0, 0.0] | |
| 15.3 mixed incontinence | 0 | Risk Ratio (M‐H, Fixed, 95% CI) | 0.0 [0.0, 0.0] | |
| 16 Urinary tract infection Show forest plot | 1 | Risk Ratio (M‐H, Fixed, 95% CI) | Totals not selected | |
| Analysis 5.16  Comparison 5 Sling versus open abdominal retropubic suspension, Outcome 16 Urinary tract infection. | ||||
| 16.1 urodynamic stress incontinence (only) | 0 | Risk Ratio (M‐H, Fixed, 95% CI) | 0.0 [0.0, 0.0] | |
| 16.2 stress urinary incontinence (symptoms only) | 1 | Risk Ratio (M‐H, Fixed, 95% CI) | 0.0 [0.0, 0.0] | |
| 16.3 mixed incontinence | 0 | Risk Ratio (M‐H, Fixed, 95% CI) | 0.0 [0.0, 0.0] | |
| 17 Urge symptoms or urge incontinence Show forest plot | 1 | Risk Ratio (M‐H, Fixed, 95% CI) | Totals not selected | |
| Analysis 5.17 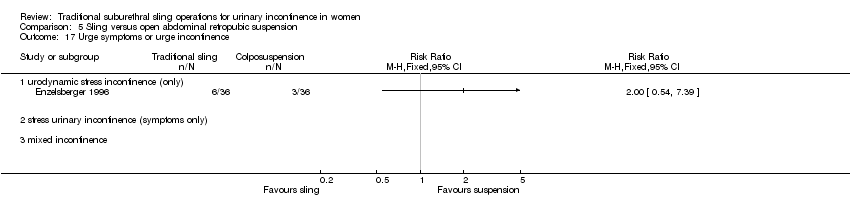 Comparison 5 Sling versus open abdominal retropubic suspension, Outcome 17 Urge symptoms or urge incontinence. | ||||
| 17.1 urodynamic stress incontinence (only) | 1 | Risk Ratio (M‐H, Fixed, 95% CI) | 0.0 [0.0, 0.0] | |
| 17.2 stress urinary incontinence (symptoms only) | 0 | Risk Ratio (M‐H, Fixed, 95% CI) | 0.0 [0.0, 0.0] | |
| 17.3 mixed incontinence | 0 | Risk Ratio (M‐H, Fixed, 95% CI) | 0.0 [0.0, 0.0] | |
| 18 Detrusor overactivity (urodynamic diagnosis) Show forest plot | 4 | 203 | Risk Ratio (M‐H, Fixed, 95% CI) | 1.42 [0.52, 3.87] |
| Analysis 5.18  Comparison 5 Sling versus open abdominal retropubic suspension, Outcome 18 Detrusor overactivity (urodynamic diagnosis). | ||||
| 18.1 urodynamic stress incontinence (only) | 4 | 203 | Risk Ratio (M‐H, Fixed, 95% CI) | 1.42 [0.52, 3.87] |
| 18.2 stress urinary incontinence (symptoms only) | 0 | 0 | Risk Ratio (M‐H, Fixed, 95% CI) | 0.0 [0.0, 0.0] |
| 18.3 mixed incontinence | 0 | 0 | Risk Ratio (M‐H, Fixed, 95% CI) | 0.0 [0.0, 0.0] |
| 19 Voiding dysfunction after three months Show forest plot | 5 | 853 | Risk Ratio (M‐H, Fixed, 95% CI) | 6.08 [3.10, 11.95] |
| Analysis 5.19  Comparison 5 Sling versus open abdominal retropubic suspension, Outcome 19 Voiding dysfunction after three months. | ||||
| 19.1 urodynamic stress incontinence (only) | 4 | 198 | Risk Ratio (M‐H, Fixed, 95% CI) | 4.48 [1.16, 17.36] |
| 19.2 stress urinary incontinence (symptoms only) | 1 | 655 | Risk Ratio (M‐H, Fixed, 95% CI) | 6.63 [3.04, 14.47] |
| 19.3 mixed incontinence | 0 | 0 | Risk Ratio (M‐H, Fixed, 95% CI) | 0.0 [0.0, 0.0] |
| 20 Prolapse Show forest plot | 2 | 106 | Risk Ratio (M‐H, Fixed, 95% CI) | 0.2 [0.04, 1.11] |
| Analysis 5.20  Comparison 5 Sling versus open abdominal retropubic suspension, Outcome 20 Prolapse. | ||||
| 20.1 urodynamic stress incontinence (only) | 2 | 106 | Risk Ratio (M‐H, Fixed, 95% CI) | 0.2 [0.04, 1.11] |
| 20.2 stress urinary incontinence (symptoms only) | 0 | 0 | Risk Ratio (M‐H, Fixed, 95% CI) | 0.0 [0.0, 0.0] |
| 20.3 mixed incontinence | 0 | 0 | Risk Ratio (M‐H, Fixed, 95% CI) | 0.0 [0.0, 0.0] |
| 21 Repeat incontinence surgery | 0 | 0 | Risk Ratio (M‐H, Fixed, 95% CI) | 0.0 [0.0, 0.0] |
| 21.1 urodynamic stress incontinence (only) | 0 | 0 | Risk Ratio (M‐H, Fixed, 95% CI) | 0.0 [0.0, 0.0] |
| 21.2 stress urinary incontinence (symptoms only) | 0 | 0 | Risk Ratio (M‐H, Fixed, 95% CI) | 0.0 [0.0, 0.0] |
| 21.3 mixed incontinence | 0 | 0 | Risk Ratio (M‐H, Fixed, 95% CI) | 0.0 [0.0, 0.0] |
| 22 Health status measures | 0 | 0 | Mean Difference (IV, Fixed, 95% CI) | 0.0 [0.0, 0.0] |
| 22.1 urodynamic stress incontinence (only) | 0 | 0 | Mean Difference (IV, Fixed, 95% CI) | 0.0 [0.0, 0.0] |
| 22.2 stress urinary incontinence (symptoms only) | 0 | 0 | Mean Difference (IV, Fixed, 95% CI) | 0.0 [0.0, 0.0] |
| 22.3 mixed incontinence | 0 | 0 | Mean Difference (IV, Fixed, 95% CI) | 0.0 [0.0, 0.0] |
| Outcome or subgroup title | No. of studies | No. of participants | Statistical method | Effect size |
| 1 Number with incontinence (worse, unchanged or improved) within the first year (women's observations) Show forest plot | 1 | Risk Ratio (M‐H, Fixed, 95% CI) | Totals not selected | |
| Analysis 6.1 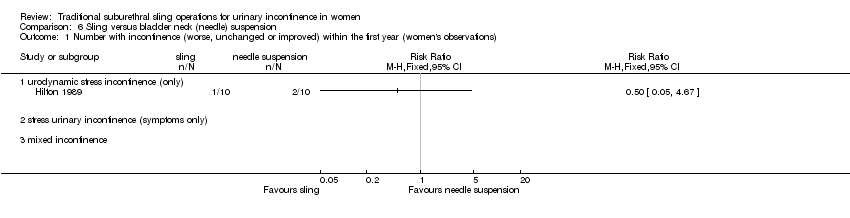 Comparison 6 Sling versus bladder neck (needle) suspension, Outcome 1 Number with incontinence (worse, unchanged or improved) within the first year (women's observations). | ||||
| 1.1 urodynamic stress incontinence (only) | 1 | Risk Ratio (M‐H, Fixed, 95% CI) | 0.0 [0.0, 0.0] | |
| 1.2 stress urinary incontinence (symptoms only) | 0 | Risk Ratio (M‐H, Fixed, 95% CI) | 0.0 [0.0, 0.0] | |
| 1.3 mixed incontinence | 0 | Risk Ratio (M‐H, Fixed, 95% CI) | 0.0 [0.0, 0.0] | |
| 2 Number with incontinence (worse, unchanged or improved) after the first year (women's observations) Show forest plot | 1 | Risk Ratio (M‐H, Fixed, 95% CI) | Totals not selected | |
| Analysis 6.2  Comparison 6 Sling versus bladder neck (needle) suspension, Outcome 2 Number with incontinence (worse, unchanged or improved) after the first year (women's observations). | ||||
| 2.1 urodynamic stress incontinence (only) | 1 | Risk Ratio (M‐H, Fixed, 95% CI) | 0.0 [0.0, 0.0] | |
| 2.2 stress urinary incontinence (symptoms only) | 0 | Risk Ratio (M‐H, Fixed, 95% CI) | 0.0 [0.0, 0.0] | |
| 2.3 mixed incontinence | 0 | Risk Ratio (M‐H, Fixed, 95% CI) | 0.0 [0.0, 0.0] | |
| 3 Length of inpatient stay Show forest plot | 1 | Mean Difference (IV, Fixed, 95% CI) | Totals not selected | |
| Analysis 6.3  Comparison 6 Sling versus bladder neck (needle) suspension, Outcome 3 Length of inpatient stay. | ||||
| 3.1 urodynamic stress incontinence (only) | 1 | Mean Difference (IV, Fixed, 95% CI) | 0.0 [0.0, 0.0] | |
| 3.2 stress urinary incontinence (symptoms only) | 0 | Mean Difference (IV, Fixed, 95% CI) | 0.0 [0.0, 0.0] | |
| 3.3 mixed incontinence | 0 | Mean Difference (IV, Fixed, 95% CI) | 0.0 [0.0, 0.0] | |
| 4 Peri‐operative surgical complications Show forest plot | 1 | Risk Ratio (M‐H, Fixed, 95% CI) | Totals not selected | |
| Analysis 6.4  Comparison 6 Sling versus bladder neck (needle) suspension, Outcome 4 Peri‐operative surgical complications. | ||||
| 4.1 urodynamic stress incontinence (only) | 1 | Risk Ratio (M‐H, Fixed, 95% CI) | 0.0 [0.0, 0.0] | |
| 4.2 stress urinary incontinence (symptoms only) | 0 | Risk Ratio (M‐H, Fixed, 95% CI) | 0.0 [0.0, 0.0] | |
| 4.3 mixed incontinence | 0 | Risk Ratio (M‐H, Fixed, 95% CI) | 0.0 [0.0, 0.0] | |
| 5 Urge symptoms or urge incontinence Show forest plot | 1 | Risk Ratio (M‐H, Fixed, 95% CI) | Totals not selected | |
| Analysis 6.5  Comparison 6 Sling versus bladder neck (needle) suspension, Outcome 5 Urge symptoms or urge incontinence. | ||||
| 5.1 urodynamic stress incontinence (only) | 1 | Risk Ratio (M‐H, Fixed, 95% CI) | 0.0 [0.0, 0.0] | |
| 5.2 stress urinary incontinence (symptoms only) | 0 | Risk Ratio (M‐H, Fixed, 95% CI) | 0.0 [0.0, 0.0] | |
| 5.3 mixed incontinence | 0 | Risk Ratio (M‐H, Fixed, 95% CI) | 0.0 [0.0, 0.0] | |
| 6 Voiding dysfunction after three months Show forest plot | 1 | Risk Ratio (M‐H, Fixed, 95% CI) | Totals not selected | |
| Analysis 6.6  Comparison 6 Sling versus bladder neck (needle) suspension, Outcome 6 Voiding dysfunction after three months. | ||||
| 6.1 urodynamic stress incontinence (only) | 1 | Risk Ratio (M‐H, Fixed, 95% CI) | 0.0 [0.0, 0.0] | |
| 6.2 stress urinary incontinence (symptoms only) | 0 | Risk Ratio (M‐H, Fixed, 95% CI) | 0.0 [0.0, 0.0] | |
| 6.3 mixed incontinence | 0 | Risk Ratio (M‐H, Fixed, 95% CI) | 0.0 [0.0, 0.0] | |
| 7 Detrusor overactivity (urodynamic diagnosis) Show forest plot | 1 | Risk Ratio (M‐H, Fixed, 95% CI) | Totals not selected | |
| Analysis 6.7 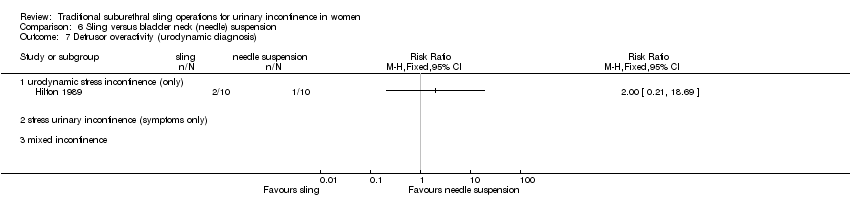 Comparison 6 Sling versus bladder neck (needle) suspension, Outcome 7 Detrusor overactivity (urodynamic diagnosis). | ||||
| 7.1 urodynamic stress incontinence (only) | 1 | Risk Ratio (M‐H, Fixed, 95% CI) | 0.0 [0.0, 0.0] | |
| 7.2 stress urinary incontinence (symptoms only) | 0 | Risk Ratio (M‐H, Fixed, 95% CI) | 0.0 [0.0, 0.0] | |
| 7.3 mixed incontinence | 0 | Risk Ratio (M‐H, Fixed, 95% CI) | 0.0 [0.0, 0.0] | |
| Outcome or subgroup title | No. of studies | No. of participants | Statistical method | Effect size |
| 1 Number with incontinence (worse, unchanged or improved) within the first year (women's observations) Show forest plot | 8 | 693 | Risk Ratio (M‐H, Fixed, 95% CI) | 0.97 [0.78, 1.20] |
| Analysis 9.1 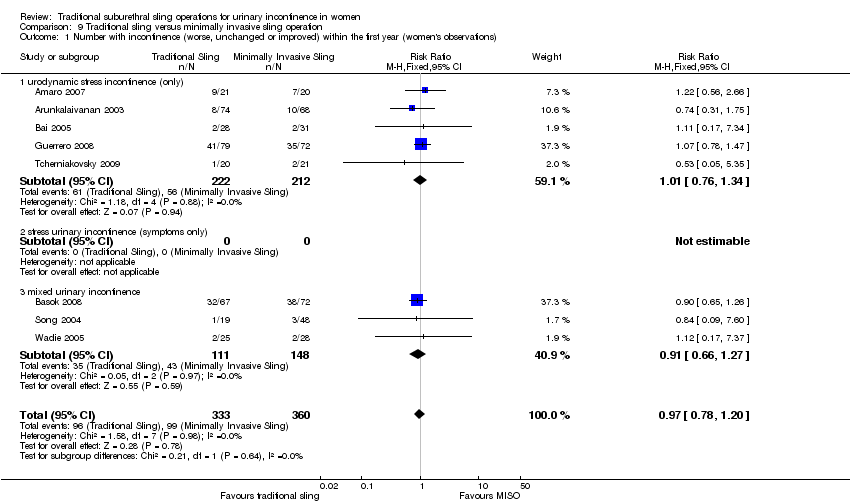 Comparison 9 Traditional sling versus minimally invasive sling operation, Outcome 1 Number with incontinence (worse, unchanged or improved) within the first year (women's observations). | ||||
| 1.1 urodynamic stress incontinence (only) | 5 | 434 | Risk Ratio (M‐H, Fixed, 95% CI) | 1.01 [0.76, 1.34] |
| 1.2 stress urinary incontinence (symptoms only) | 0 | 0 | Risk Ratio (M‐H, Fixed, 95% CI) | 0.0 [0.0, 0.0] |
| 1.3 mixed urinary incontinence | 3 | 259 | Risk Ratio (M‐H, Fixed, 95% CI) | 0.91 [0.66, 1.27] |
| 2 Number not improved (worse or unchanged) within the first year (women's observations) Show forest plot | 3 | 432 | Risk Ratio (M‐H, Fixed, 95% CI) | 0.78 [0.48, 1.27] |
| Analysis 9.2 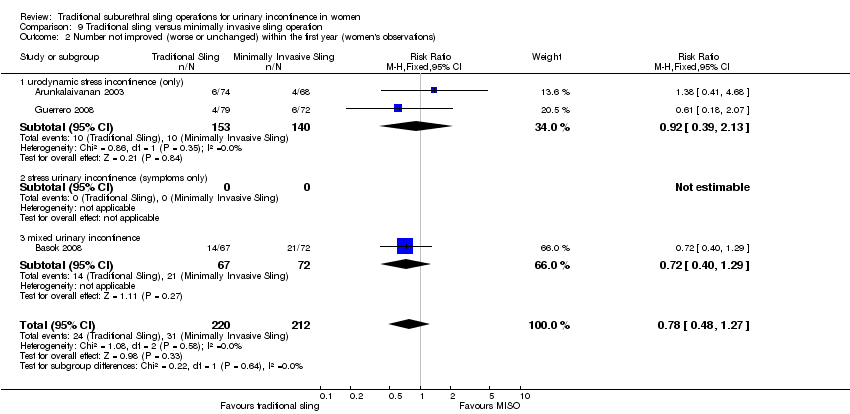 Comparison 9 Traditional sling versus minimally invasive sling operation, Outcome 2 Number not improved (worse or unchanged) within the first year (women's observations). | ||||
| 2.1 urodynamic stress incontinence (only) | 2 | 293 | Risk Ratio (M‐H, Fixed, 95% CI) | 0.92 [0.39, 2.13] |
| 2.2 stress urinary incontinence (symptoms only) | 0 | 0 | Risk Ratio (M‐H, Fixed, 95% CI) | 0.0 [0.0, 0.0] |
| 2.3 mixed urinary incontinence | 1 | 139 | Risk Ratio (M‐H, Fixed, 95% CI) | 0.72 [0.40, 1.29] |
| 3 Number with incontinence (worse, unchanged or improved) after first year (women's observations) Show forest plot | 4 | 382 | Risk Ratio (M‐H, Fixed, 95% CI) | 1.23 [0.91, 1.66] |
| Analysis 9.3 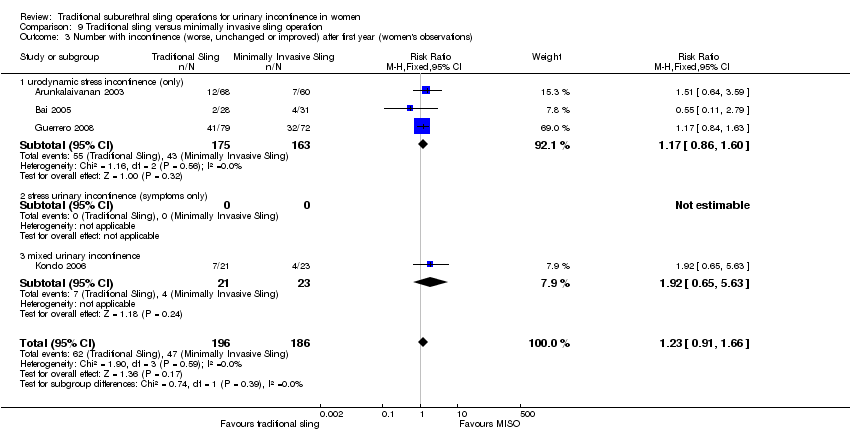 Comparison 9 Traditional sling versus minimally invasive sling operation, Outcome 3 Number with incontinence (worse, unchanged or improved) after first year (women's observations). | ||||
| 3.1 urodynamic stress incontinence (only) | 3 | 338 | Risk Ratio (M‐H, Fixed, 95% CI) | 1.17 [0.86, 1.60] |
| 3.2 stress urinary incontinence (symptoms only) | 0 | 0 | Risk Ratio (M‐H, Fixed, 95% CI) | 0.0 [0.0, 0.0] |
| 3.3 mixed urinary incontinence | 1 | 44 | Risk Ratio (M‐H, Fixed, 95% CI) | 1.92 [0.65, 5.63] |
| 4 Number not improved (worse or unchanged) after the first year (women's observations) Show forest plot | 2 | 279 | Risk Ratio (M‐H, Fixed, 95% CI) | 1.30 [0.57, 2.94] |
| Analysis 9.4  Comparison 9 Traditional sling versus minimally invasive sling operation, Outcome 4 Number not improved (worse or unchanged) after the first year (women's observations). | ||||
| 4.1 urodynamic stress incontinence (only) | 2 | 279 | Risk Ratio (M‐H, Fixed, 95% CI) | 1.30 [0.57, 2.94] |
| 4.2 stress urinary incontinence (symptoms only) | 0 | 0 | Risk Ratio (M‐H, Fixed, 95% CI) | 0.0 [0.0, 0.0] |
| 4.3 mixed urinary incontinence | 0 | 0 | Risk Ratio (M‐H, Fixed, 95% CI) | 0.0 [0.0, 0.0] |
| 5 Pad test: mean weight of urine Show forest plot | 1 | 20 | Mean Difference (IV, Fixed, 95% CI) | ‐29.00 [‐57.53, ‐4.47] |
| Analysis 9.5 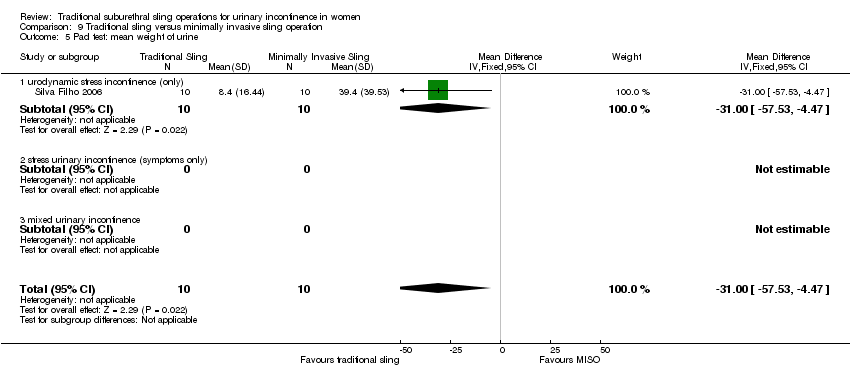 Comparison 9 Traditional sling versus minimally invasive sling operation, Outcome 5 Pad test: mean weight of urine. | ||||
| 5.1 urodynamic stress incontinence (only) | 1 | 20 | Mean Difference (IV, Fixed, 95% CI) | ‐29.00 [‐57.53, ‐4.47] |
| 5.2 stress urinary incontinence (symptoms only) | 0 | 0 | Mean Difference (IV, Fixed, 95% CI) | 0.0 [0.0, 0.0] |
| 5.3 mixed urinary incontinence | 0 | 0 | Mean Difference (IV, Fixed, 95% CI) | 0.0 [0.0, 0.0] |
| 6 Number with incontinence (clinician's observations) within first year Show forest plot | 2 | 105 | Risk Ratio (M‐H, Fixed, 95% CI) | 1.29 [0.45, 3.71] |
| Analysis 9.6  Comparison 9 Traditional sling versus minimally invasive sling operation, Outcome 6 Number with incontinence (clinician's observations) within first year. | ||||
| 6.1 urodynamic stress incontinence (only) | 0 | 0 | Risk Ratio (M‐H, Fixed, 95% CI) | 0.0 [0.0, 0.0] |
| 6.2 stress urinary incontinence (symptoms only) | 0 | 0 | Risk Ratio (M‐H, Fixed, 95% CI) | 0.0 [0.0, 0.0] |
| 6.3 mixed urinary incontinence | 2 | 105 | Risk Ratio (M‐H, Fixed, 95% CI) | 1.29 [0.45, 3.71] |
| 7 Number with incontinence (clinician's observations) after first year Show forest plot | 1 | 44 | Risk Ratio (M‐H, Fixed, 95% CI) | 1.72 [0.82, 3.61] |
| Analysis 9.7  Comparison 9 Traditional sling versus minimally invasive sling operation, Outcome 7 Number with incontinence (clinician's observations) after first year. | ||||
| 7.1 urodynamic stress incontinence (only) | 0 | 0 | Risk Ratio (M‐H, Fixed, 95% CI) | 0.0 [0.0, 0.0] |
| 7.2 stress urinary incontinence (symptoms only) | 0 | 0 | Risk Ratio (M‐H, Fixed, 95% CI) | 0.0 [0.0, 0.0] |
| 7.3 mixed urinary incontinence | 1 | 44 | Risk Ratio (M‐H, Fixed, 95% CI) | 1.72 [0.82, 3.61] |
| 8 Operative time (mins) Show forest plot | 5 | 225 | Mean Difference (IV, Fixed, 95% CI) | 59.90 [56.62, 63.18] |
| Analysis 9.8  Comparison 9 Traditional sling versus minimally invasive sling operation, Outcome 8 Operative time (mins). | ||||
| 8.1 urodynamic stress incontinence (only) | 2 | 61 | Mean Difference (IV, Fixed, 95% CI) | 46.91 [42.31, 51.52] |
| 8.2 stress urinary incontinence (symptoms only) | 0 | 0 | Mean Difference (IV, Fixed, 95% CI) | 0.0 [0.0, 0.0] |
| 8.3 mixed urinary incontinence | 3 | 164 | Mean Difference (IV, Fixed, 95% CI) | 73.26 [68.59, 77.94] |
| 9 Length of hospital stay (days) Show forest plot | 2 | 64 | Mean Difference (IV, Fixed, 95% CI) | 0.49 [0.26, 0.72] |
| Analysis 9.9 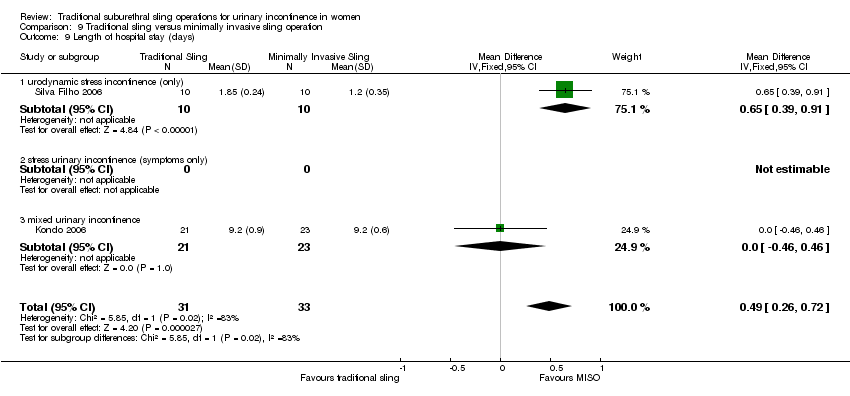 Comparison 9 Traditional sling versus minimally invasive sling operation, Outcome 9 Length of hospital stay (days). | ||||
| 9.1 urodynamic stress incontinence (only) | 1 | 20 | Mean Difference (IV, Fixed, 95% CI) | 0.65 [0.39, 0.91] |
| 9.2 stress urinary incontinence (symptoms only) | 0 | 0 | Mean Difference (IV, Fixed, 95% CI) | 0.0 [0.0, 0.0] |
| 9.3 mixed urinary incontinence | 1 | 44 | Mean Difference (IV, Fixed, 95% CI) | 0.0 [‐0.46, 0.46] |
| 10 Time to catheter removal (days) Show forest plot | 2 | 113 | Mean Difference (IV, Fixed, 95% CI) | 0.11 [‐0.07, 0.30] |
| Analysis 9.10  Comparison 9 Traditional sling versus minimally invasive sling operation, Outcome 10 Time to catheter removal (days). | ||||
| 10.1 urodynamic stress incontinence (only) | 0 | 0 | Mean Difference (IV, Fixed, 95% CI) | 0.0 [0.0, 0.0] |
| 10.2 stress urinary incontinence (symptoms only) | 0 | 0 | Mean Difference (IV, Fixed, 95% CI) | 0.0 [0.0, 0.0] |
| 10.3 mixed urinary incontinence | 2 | 113 | Mean Difference (IV, Fixed, 95% CI) | 0.11 [‐0.07, 0.30] |
| 11 Peri operative surgical complications Show forest plot | 3 | 243 | Risk Ratio (M‐H, Fixed, 95% CI) | 1.59 [1.03, 2.44] |
| Analysis 9.11  Comparison 9 Traditional sling versus minimally invasive sling operation, Outcome 11 Peri operative surgical complications. | ||||
| 11.1 urodynamic stress incontinence (only) | 2 | 183 | Risk Ratio (M‐H, Fixed, 95% CI) | 1.73 [1.01, 2.96] |
| 11.2 stress urinary incontinence (symptoms only) | 0 | 0 | Risk Ratio (M‐H, Fixed, 95% CI) | 0.0 [0.0, 0.0] |
| 11.3 mixed urinary incontinence | 1 | 60 | Risk Ratio (M‐H, Fixed, 95% CI) | 1.31 [0.64, 2.69] |
| 12 Bladder perforations Show forest plot | 7 | 563 | Risk Ratio (M‐H, Fixed, 95% CI) | 0.62 [0.34, 1.11] |
| Analysis 9.12 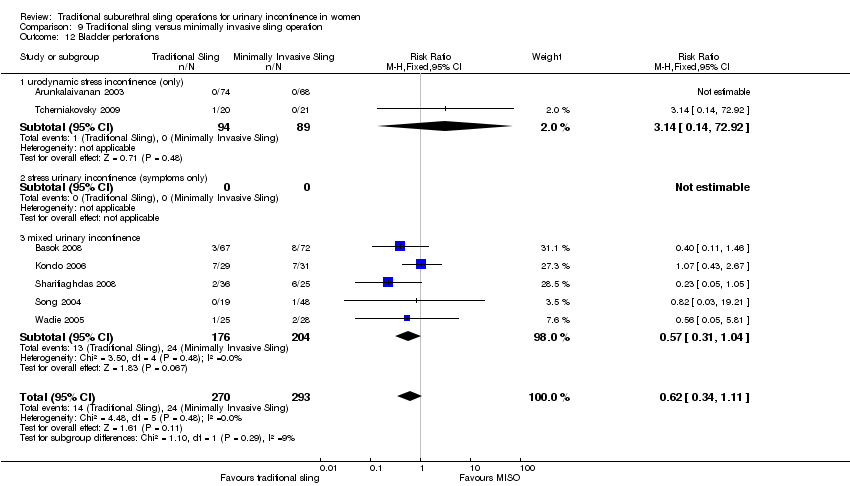 Comparison 9 Traditional sling versus minimally invasive sling operation, Outcome 12 Bladder perforations. | ||||
| 12.1 urodynamic stress incontinence (only) | 2 | 183 | Risk Ratio (M‐H, Fixed, 95% CI) | 3.14 [0.14, 72.92] |
| 12.2 stress urinary incontinence (symptoms only) | 0 | 0 | Risk Ratio (M‐H, Fixed, 95% CI) | 0.0 [0.0, 0.0] |
| 12.3 mixed urinary incontinence | 5 | 380 | Risk Ratio (M‐H, Fixed, 95% CI) | 0.57 [0.31, 1.04] |
| 13 Urethral injury Show forest plot | 1 | Risk Ratio (M‐H, Fixed, 95% CI) | Totals not selected | |
| Analysis 9.13  Comparison 9 Traditional sling versus minimally invasive sling operation, Outcome 13 Urethral injury. | ||||
| 13.1 urodynamic stress incontinence (only) | 0 | Risk Ratio (M‐H, Fixed, 95% CI) | 0.0 [0.0, 0.0] | |
| 13.2 stress urinary incontinence (symptoms only) | 0 | Risk Ratio (M‐H, Fixed, 95% CI) | 0.0 [0.0, 0.0] | |
| 13.3 mixed urinary incontinence | 1 | Risk Ratio (M‐H, Fixed, 95% CI) | 0.0 [0.0, 0.0] | |
| 14 De novo detrusor urgency or urge symptoms Show forest plot | 3 | 174 | Risk Ratio (M‐H, Fixed, 95% CI) | 3.13 [0.96, 10.24] |
| Analysis 9.14  Comparison 9 Traditional sling versus minimally invasive sling operation, Outcome 14 De novo detrusor urgency or urge symptoms. | ||||
| 14.1 urodynamic stress incontinence (only) | 0 | 0 | Risk Ratio (M‐H, Fixed, 95% CI) | 0.0 [0.0, 0.0] |
| 14.2 stress urinary incontinence (symptoms only) | 0 | 0 | Risk Ratio (M‐H, Fixed, 95% CI) | 0.0 [0.0, 0.0] |
| 14.3 mixed urinary incontinence | 3 | 174 | Risk Ratio (M‐H, Fixed, 95% CI) | 3.13 [0.96, 10.24] |
| 15 De novo detrusor overactivity (urodynamic diagnosis) Show forest plot | 3 | 245 | Risk Ratio (M‐H, Fixed, 95% CI) | 3.21 [1.29, 8.03] |
| Analysis 9.15 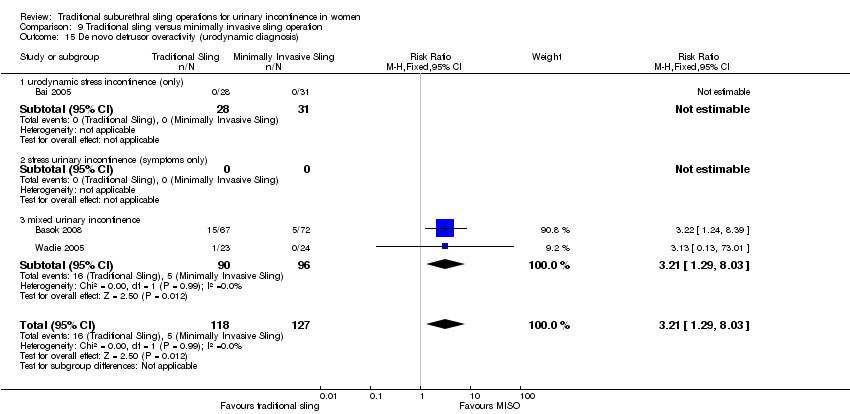 Comparison 9 Traditional sling versus minimally invasive sling operation, Outcome 15 De novo detrusor overactivity (urodynamic diagnosis). | ||||
| 15.1 urodynamic stress incontinence (only) | 1 | 59 | Risk Ratio (M‐H, Fixed, 95% CI) | 0.0 [0.0, 0.0] |
| 15.2 stress urinary incontinence (symptoms only) | 0 | 0 | Risk Ratio (M‐H, Fixed, 95% CI) | 0.0 [0.0, 0.0] |
| 15.3 mixed urinary incontinence | 2 | 186 | Risk Ratio (M‐H, Fixed, 95% CI) | 3.21 [1.29, 8.03] |
| 16 Voiding dysfunction Show forest plot | 5 | 375 | Risk Ratio (M‐H, Fixed, 95% CI) | 1.60 [0.94, 2.71] |
| Analysis 9.16  Comparison 9 Traditional sling versus minimally invasive sling operation, Outcome 16 Voiding dysfunction. | ||||
| 16.1 urodynamic stress incontinence (only) | 2 | 201 | Risk Ratio (M‐H, Fixed, 95% CI) | 0.97 [0.42, 2.25] |
| 16.2 stress urinary incontinence (symptoms only) | 0 | 0 | Risk Ratio (M‐H, Fixed, 95% CI) | 0.0 [0.0, 0.0] |
| 16.3 mixed urinary incontinence | 3 | 174 | Risk Ratio (M‐H, Fixed, 95% CI) | 2.28 [1.13, 4.62] |
| 17 Release of sling required Show forest plot | 2 | 202 | Risk Ratio (M‐H, Fixed, 95% CI) | 3.67 [0.95, 14.22] |
| Analysis 9.17  Comparison 9 Traditional sling versus minimally invasive sling operation, Outcome 17 Release of sling required. | ||||
| 17.1 urodynamic stress incontinence (only) | 1 | 142 | Risk Ratio (M‐H, Fixed, 95% CI) | 2.30 [0.46, 11.45] |
| 17.2 stress urinary incontinence (symptoms only) | 0 | 0 | Risk Ratio (M‐H, Fixed, 95% CI) | 0.0 [0.0, 0.0] |
| 17.3 mixed urinary incontinence | 1 | 60 | Risk Ratio (M‐H, Fixed, 95% CI) | 9.6 [0.54, 170.84] |
| 18 Retention up to 6 weeks Show forest plot | 1 | Risk Ratio (M‐H, Fixed, 95% CI) | Totals not selected | |
| Analysis 9.18  Comparison 9 Traditional sling versus minimally invasive sling operation, Outcome 18 Retention up to 6 weeks. | ||||
| 18.1 urodynamic stress incontinence (only) | 1 | Risk Ratio (M‐H, Fixed, 95% CI) | 0.0 [0.0, 0.0] | |
| 18.2 stress urinary incontinence (symptoms only) | 0 | Risk Ratio (M‐H, Fixed, 95% CI) | 0.0 [0.0, 0.0] | |
| 18.3 mixed urinary incontinence | 0 | Risk Ratio (M‐H, Fixed, 95% CI) | 0.0 [0.0, 0.0] | |
| 19 Vaginal erosion Show forest plot | 2 | Risk Ratio (M‐H, Fixed, 95% CI) | Totals not selected | |
| Analysis 9.19  Comparison 9 Traditional sling versus minimally invasive sling operation, Outcome 19 Vaginal erosion. | ||||
| 19.1 urodynamic stress incontinence (only) | 1 | Risk Ratio (M‐H, Fixed, 95% CI) | 0.0 [0.0, 0.0] | |
| 19.2 stress urinary incontinence (symptoms only) | 0 | Risk Ratio (M‐H, Fixed, 95% CI) | 0.0 [0.0, 0.0] | |
| 19.3 mixed urinary incontinence | 1 | Risk Ratio (M‐H, Fixed, 95% CI) | 0.0 [0.0, 0.0] | |
| 20 Wound pain (6 months) Show forest plot | 1 | Risk Ratio (M‐H, Fixed, 95% CI) | Totals not selected | |
| Analysis 9.20 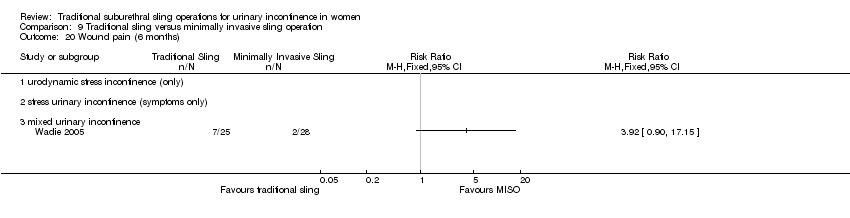 Comparison 9 Traditional sling versus minimally invasive sling operation, Outcome 20 Wound pain (6 months). | ||||
| 20.1 urodynamic stress incontinence (only) | 0 | Risk Ratio (M‐H, Fixed, 95% CI) | 0.0 [0.0, 0.0] | |
| 20.2 stress urinary incontinence (symptoms only) | 0 | Risk Ratio (M‐H, Fixed, 95% CI) | 0.0 [0.0, 0.0] | |
| 20.3 mixed urinary incontinence | 1 | Risk Ratio (M‐H, Fixed, 95% CI) | 0.0 [0.0, 0.0] | |
| Outcome or subgroup title | No. of studies | No. of participants | Statistical method | Effect size |
| 1 Number with incontinence (worse, unchanged or improved) within the first year (women's observations) Show forest plot | 3 | 307 | Risk Ratio (M‐H, Fixed, 95% CI) | 0.89 [0.66, 1.19] |
| Analysis 10.1  Comparison 10 One type of traditional sling versus another, Outcome 1 Number with incontinence (worse, unchanged or improved) within the first year (women's observations). | ||||
| 1.1 urodynamic stress incontinence (only) | 3 | 307 | Risk Ratio (M‐H, Fixed, 95% CI) | 0.89 [0.66, 1.19] |
| 1.2 stress urinary incontinence (symptoms only) | 0 | 0 | Risk Ratio (M‐H, Fixed, 95% CI) | 0.0 [0.0, 0.0] |
| 1.3 mixed urinary incontinence | 0 | 0 | Risk Ratio (M‐H, Fixed, 95% CI) | 0.0 [0.0, 0.0] |
| 2 Number not improved (worse or unchanged) within the first year (women's observations) Show forest plot | 3 | Risk Ratio (M‐H, Fixed, 95% CI) | Subtotals only | |
| Analysis 10.2  Comparison 10 One type of traditional sling versus another, Outcome 2 Number not improved (worse or unchanged) within the first year (women's observations). | ||||
| 2.1 urodynamic stress incontinence (only) | 2 | 163 | Risk Ratio (M‐H, Fixed, 95% CI) | 0.22 [0.08, 0.59] |
| 2.2 stress urinary incontinence (symptoms only) | 0 | 0 | Risk Ratio (M‐H, Fixed, 95% CI) | 0.0 [0.0, 0.0] |
| 2.3 mixed urinary incontinence | 1 | 48 | Risk Ratio (M‐H, Fixed, 95% CI) | 6.70 [0.40, 111.94] |
| 3 Number with incontinence (worse, unchanged or improved) after first year (women's observations) Show forest plot | 4 | 379 | Risk Ratio (M‐H, Fixed, 95% CI) | 0.89 [0.72, 1.10] |
| Analysis 10.3 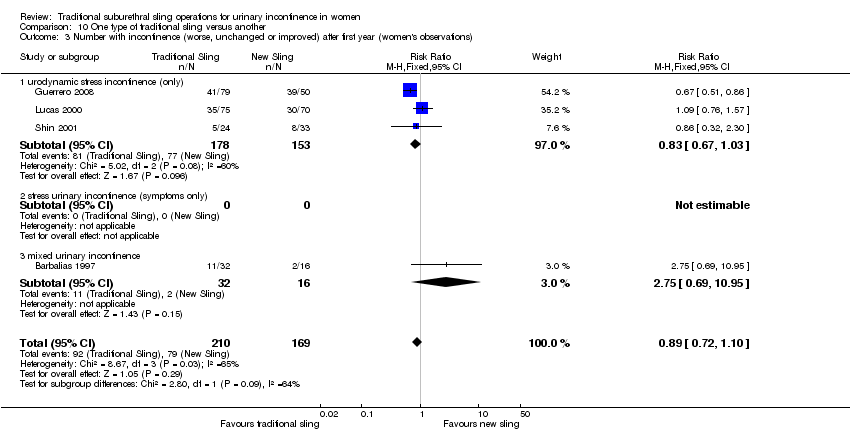 Comparison 10 One type of traditional sling versus another, Outcome 3 Number with incontinence (worse, unchanged or improved) after first year (women's observations). | ||||
| 3.1 urodynamic stress incontinence (only) | 3 | 331 | Risk Ratio (M‐H, Fixed, 95% CI) | 0.83 [0.67, 1.03] |
| 3.2 stress urinary incontinence (symptoms only) | 0 | 0 | Risk Ratio (M‐H, Fixed, 95% CI) | 0.0 [0.0, 0.0] |
| 3.3 mixed urinary incontinence | 1 | 48 | Risk Ratio (M‐H, Fixed, 95% CI) | 2.75 [0.69, 10.95] |
| 4 Number not improved (worse or unchanged) after the first year (women's observations) Show forest plot | 3 | Risk Ratio (M‐H, Fixed, 95% CI) | Subtotals only | |
| Analysis 10.4  Comparison 10 One type of traditional sling versus another, Outcome 4 Number not improved (worse or unchanged) after the first year (women's observations). | ||||
| 4.1 urodynamic stress incontinence (only) | 2 | 186 | Risk Ratio (M‐H, Fixed, 95% CI) | 0.33 [0.17, 0.64] |
| 4.2 stress urinary incontinence (symptoms only) | 0 | 0 | Risk Ratio (M‐H, Fixed, 95% CI) | 0.0 [0.0, 0.0] |
| 4.3 mixed urinary incontinence | 1 | 48 | Risk Ratio (M‐H, Fixed, 95% CI) | 0.0 [0.0, 0.0] |
| 5 Number with incontinence (worse, unchanged or improved) after five years (women's observations) Show forest plot | 1 | Risk Ratio (M‐H, Fixed, 95% CI) | Totals not selected | |
| Analysis 10.5  Comparison 10 One type of traditional sling versus another, Outcome 5 Number with incontinence (worse, unchanged or improved) after five years (women's observations). | ||||
| 5.1 urodynamic stress incontinence (only) | 1 | Risk Ratio (M‐H, Fixed, 95% CI) | 0.0 [0.0, 0.0] | |
| 5.2 stress urinary incontinence (symptoms only) | 0 | Risk Ratio (M‐H, Fixed, 95% CI) | 0.0 [0.0, 0.0] | |
| 5.3 mixed urinary incontinence | 0 | Risk Ratio (M‐H, Fixed, 95% CI) | 0.0 [0.0, 0.0] | |
| 6 Pad test: mean weight of urine Show forest plot | 1 | Mean Difference (IV, Fixed, 95% CI) | Totals not selected | |
| Analysis 10.6  Comparison 10 One type of traditional sling versus another, Outcome 6 Pad test: mean weight of urine. | ||||
| 6.1 urodynamic stress incontinence (only) | 1 | Mean Difference (IV, Fixed, 95% CI) | 0.0 [0.0, 0.0] | |
| 6.2 stress urinary incontinence (symptoms only) | 0 | Mean Difference (IV, Fixed, 95% CI) | 0.0 [0.0, 0.0] | |
| 6.3 mixed urinary incontinence | 0 | Mean Difference (IV, Fixed, 95% CI) | 0.0 [0.0, 0.0] | |
| 7 Operative time (mins) Show forest plot | 1 | Mean Difference (IV, Fixed, 95% CI) | Totals not selected | |
| Analysis 10.7  Comparison 10 One type of traditional sling versus another, Outcome 7 Operative time (mins). | ||||
| 7.1 urodynamic stress incontinence (only) | 1 | Mean Difference (IV, Fixed, 95% CI) | 0.0 [0.0, 0.0] | |
| 7.2 stress urinary incontinence (symptoms only) | 0 | Mean Difference (IV, Fixed, 95% CI) | 0.0 [0.0, 0.0] | |
| 7.3 mixed urinary incontinence | 0 | Mean Difference (IV, Fixed, 95% CI) | 0.0 [0.0, 0.0] | |
| 8 Peri operative surgical complications Show forest plot | 2 | Risk Ratio (M‐H, Fixed, 95% CI) | Totals not selected | |
| Analysis 10.8  Comparison 10 One type of traditional sling versus another, Outcome 8 Peri operative surgical complications. | ||||
| 8.1 urodynamic stress incontinence (only) | 1 | Risk Ratio (M‐H, Fixed, 95% CI) | 0.0 [0.0, 0.0] | |
| 8.2 stress urinary incontinence (symptoms only) | 0 | Risk Ratio (M‐H, Fixed, 95% CI) | 0.0 [0.0, 0.0] | |
| 8.3 mixed urinary incontinence | 1 | Risk Ratio (M‐H, Fixed, 95% CI) | 0.0 [0.0, 0.0] | |
| 9 Bladder perforation Show forest plot | 1 | Risk Ratio (M‐H, Fixed, 95% CI) | Totals not selected | |
| Analysis 10.9  Comparison 10 One type of traditional sling versus another, Outcome 9 Bladder perforation. | ||||
| 9.1 urodynamic stress incontinence (only) | 1 | Risk Ratio (M‐H, Fixed, 95% CI) | 0.0 [0.0, 0.0] | |
| 9.2 stress urinary incontinence (symptoms only) | 0 | Risk Ratio (M‐H, Fixed, 95% CI) | 0.0 [0.0, 0.0] | |
| 9.3 mixed urinary incontinence | 0 | Risk Ratio (M‐H, Fixed, 95% CI) | 0.0 [0.0, 0.0] | |
| 10 Urinary tract infection Show forest plot | 1 | Risk Ratio (M‐H, Fixed, 95% CI) | Totals not selected | |
| Analysis 10.10  Comparison 10 One type of traditional sling versus another, Outcome 10 Urinary tract infection. | ||||
| 10.1 urodynamic stress incontinence (only) | 1 | Risk Ratio (M‐H, Fixed, 95% CI) | 0.0 [0.0, 0.0] | |
| 10.2 stress urinary incontinence (symptoms only) | 0 | Risk Ratio (M‐H, Fixed, 95% CI) | 0.0 [0.0, 0.0] | |
| 10.3 mixed urinary incontinence | 0 | Risk Ratio (M‐H, Fixed, 95% CI) | 0.0 [0.0, 0.0] | |
| 11 De novo detrusor urgency or urge symptoms or detrusor overactivity Show forest plot | 1 | Risk Ratio (M‐H, Fixed, 95% CI) | Totals not selected | |
| Analysis 10.11 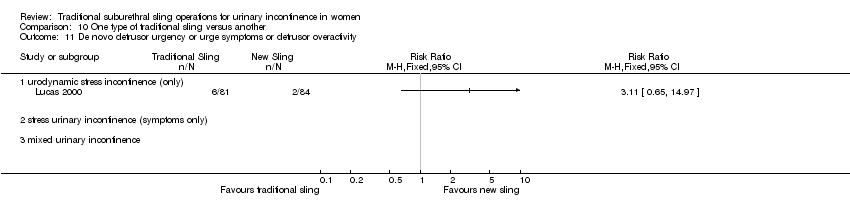 Comparison 10 One type of traditional sling versus another, Outcome 11 De novo detrusor urgency or urge symptoms or detrusor overactivity. | ||||
| 11.1 urodynamic stress incontinence (only) | 1 | Risk Ratio (M‐H, Fixed, 95% CI) | 0.0 [0.0, 0.0] | |
| 11.2 stress urinary incontinence (symptoms only) | 0 | Risk Ratio (M‐H, Fixed, 95% CI) | 0.0 [0.0, 0.0] | |
| 11.3 mixed urinary incontinence | 0 | Risk Ratio (M‐H, Fixed, 95% CI) | 0.0 [0.0, 0.0] | |
| 12 Voiding dysfunction Show forest plot | 1 | Risk Ratio (M‐H, Fixed, 95% CI) | Totals not selected | |
| Analysis 10.12  Comparison 10 One type of traditional sling versus another, Outcome 12 Voiding dysfunction. | ||||
| 12.1 urodynamic stress incontinence (only) | 1 | Risk Ratio (M‐H, Fixed, 95% CI) | 0.0 [0.0, 0.0] | |
| 12.2 stress urinary incontinence (symptoms only) | 0 | Risk Ratio (M‐H, Fixed, 95% CI) | 0.0 [0.0, 0.0] | |
| 12.3 mixed urinary incontinence | 0 | Risk Ratio (M‐H, Fixed, 95% CI) | 0.0 [0.0, 0.0] | |
| 13 De novo detrusor overactivity (urodynamic diagnosis) Show forest plot | 2 | Risk Ratio (M‐H, Fixed, 95% CI) | Subtotals only | |
| Analysis 10.13  Comparison 10 One type of traditional sling versus another, Outcome 13 De novo detrusor overactivity (urodynamic diagnosis). | ||||
| 13.1 urodynamic stress incontinence (only) | 1 | 57 | Risk Ratio (M‐H, Fixed, 95% CI) | 1.72 [0.52, 5.74] |
| 13.2 stress urinary incontinence (symptoms only) | 0 | 0 | Risk Ratio (M‐H, Fixed, 95% CI) | 0.0 [0.0, 0.0] |
| 13.3 mixed urinary incontinence | 1 | 48 | Risk Ratio (M‐H, Fixed, 95% CI) | 0.67 [0.17, 2.63] |
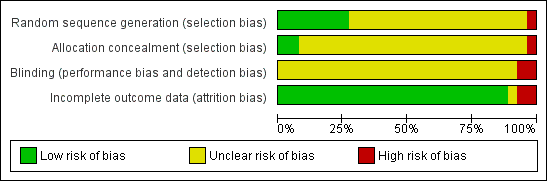
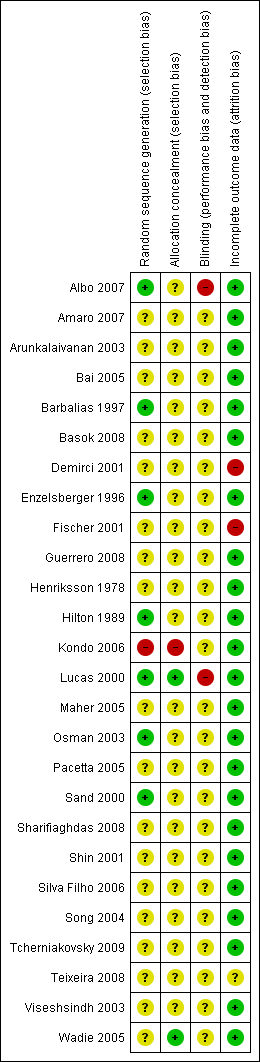

Comparison 3 Sling versus drugs, Outcome 1 Number with incontinence (worse, unchanged or improved) within the first year (women's observations).
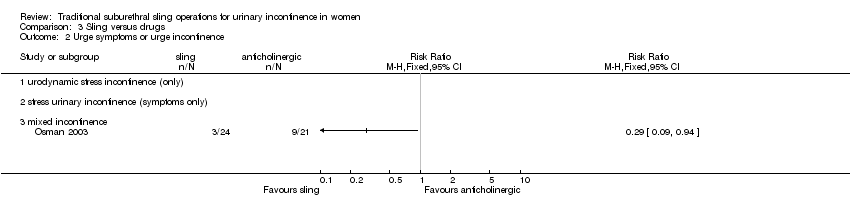
Comparison 3 Sling versus drugs, Outcome 2 Urge symptoms or urge incontinence.

Comparison 4 Sling versus injectable, Outcome 1 Number with incontinence (worse, unchanged or improved) within the first year (women's observations).
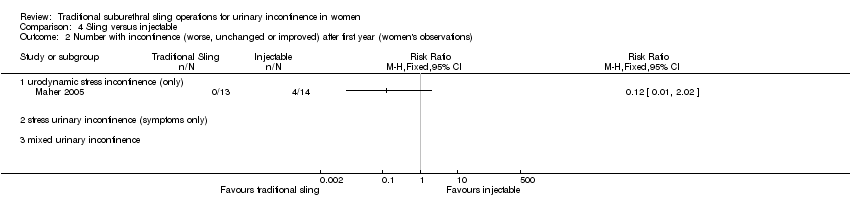
Comparison 4 Sling versus injectable, Outcome 2 Number with incontinence (worse, unchanged or improved) after first year (women's observations).

Comparison 4 Sling versus injectable, Outcome 3 Number with incontinence (clinician's observations) within first year.

Comparison 4 Sling versus injectable, Outcome 4 Voiding dysfunction.

Comparison 4 Sling versus injectable, Outcome 5 De novo detrusor overactivity (urodynamic diagnosis).
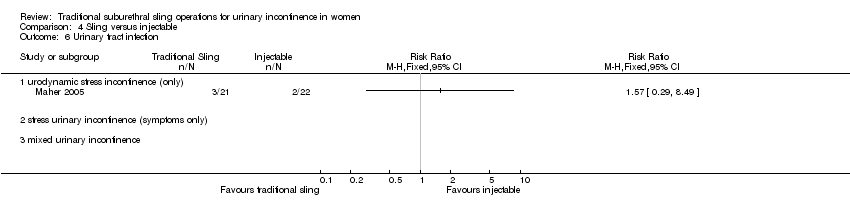
Comparison 4 Sling versus injectable, Outcome 6 Urinary tract infection.

Comparison 5 Sling versus open abdominal retropubic suspension, Outcome 1 Number with incontinence (worse, unchanged or improved) within the first year (women's observations).
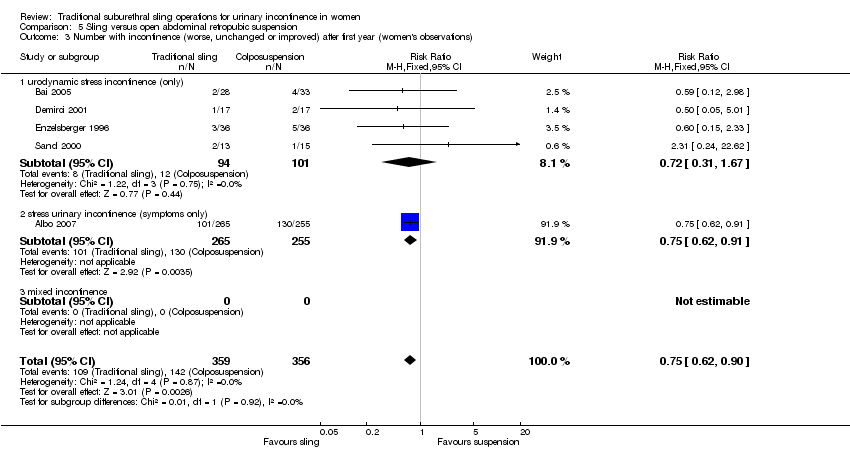
Comparison 5 Sling versus open abdominal retropubic suspension, Outcome 3 Number with incontinence (worse, unchanged or improved) after first year (women's observations).
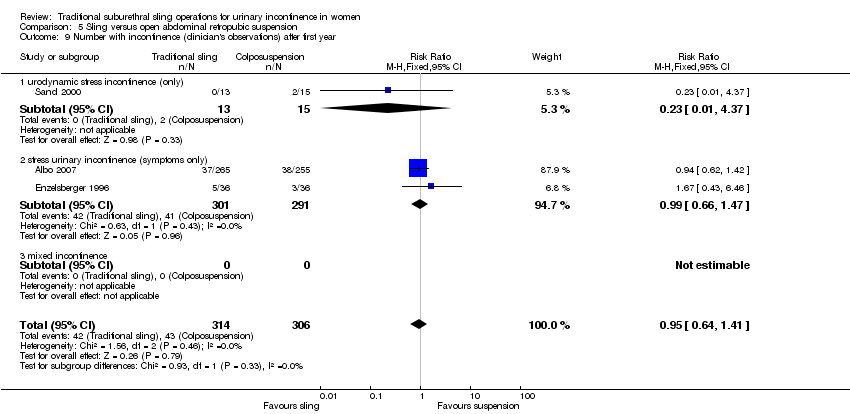
Comparison 5 Sling versus open abdominal retropubic suspension, Outcome 9 Number with incontinence (clinician's observations) after first year.

Comparison 5 Sling versus open abdominal retropubic suspension, Outcome 10 Operative time (minutes).

Comparison 5 Sling versus open abdominal retropubic suspension, Outcome 11 Time to catheter removal (days).
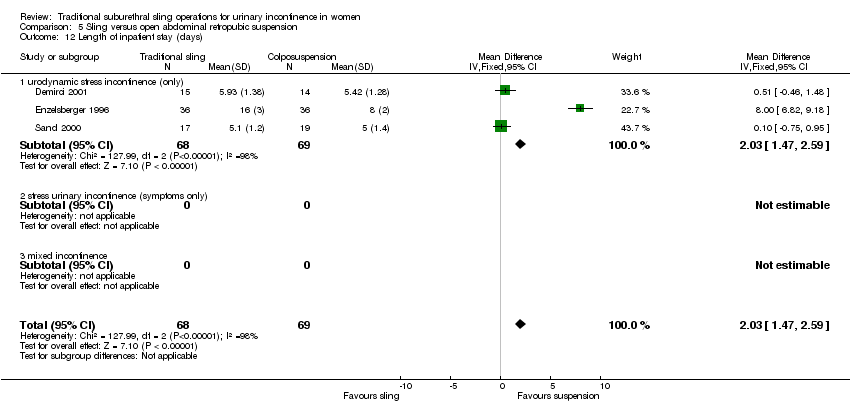
Comparison 5 Sling versus open abdominal retropubic suspension, Outcome 12 Length of inpatient stay (days).
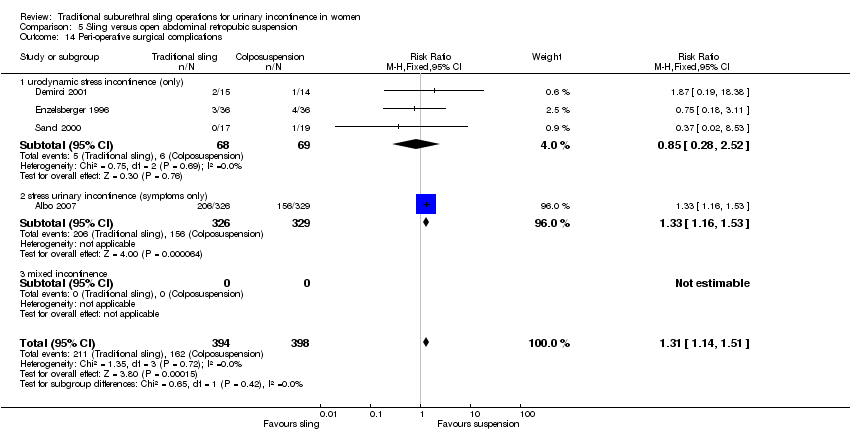
Comparison 5 Sling versus open abdominal retropubic suspension, Outcome 14 Peri‐operative surgical complications.

Comparison 5 Sling versus open abdominal retropubic suspension, Outcome 15 Bladder perforation.
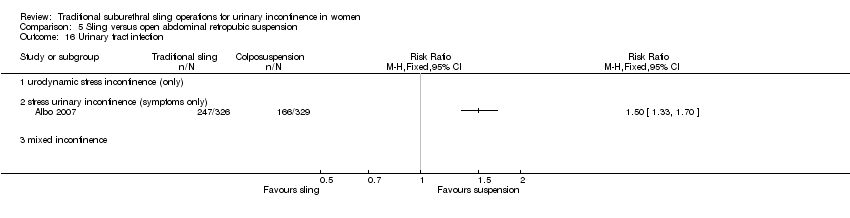
Comparison 5 Sling versus open abdominal retropubic suspension, Outcome 16 Urinary tract infection.

Comparison 5 Sling versus open abdominal retropubic suspension, Outcome 17 Urge symptoms or urge incontinence.

Comparison 5 Sling versus open abdominal retropubic suspension, Outcome 18 Detrusor overactivity (urodynamic diagnosis).

Comparison 5 Sling versus open abdominal retropubic suspension, Outcome 19 Voiding dysfunction after three months.
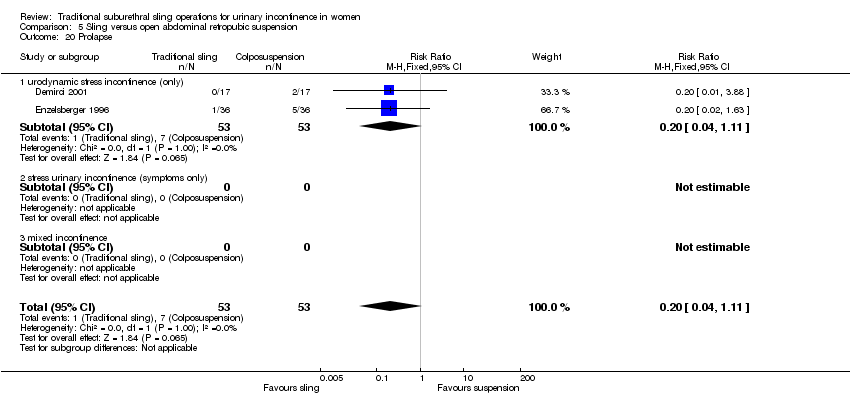
Comparison 5 Sling versus open abdominal retropubic suspension, Outcome 20 Prolapse.

Comparison 6 Sling versus bladder neck (needle) suspension, Outcome 1 Number with incontinence (worse, unchanged or improved) within the first year (women's observations).

Comparison 6 Sling versus bladder neck (needle) suspension, Outcome 2 Number with incontinence (worse, unchanged or improved) after the first year (women's observations).
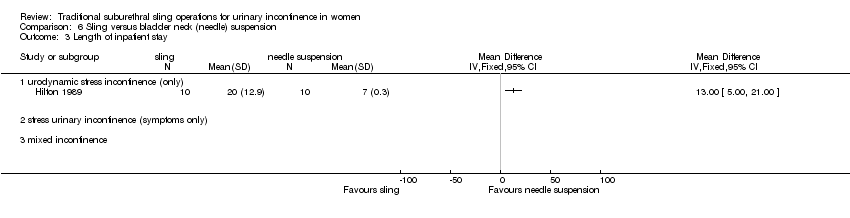
Comparison 6 Sling versus bladder neck (needle) suspension, Outcome 3 Length of inpatient stay.
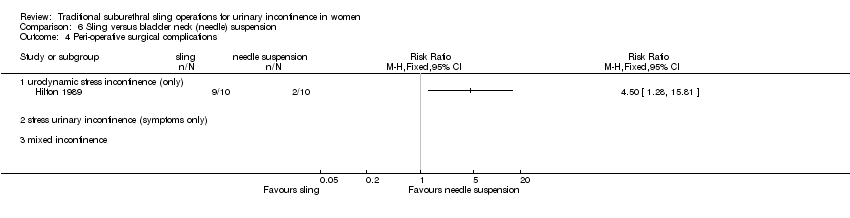
Comparison 6 Sling versus bladder neck (needle) suspension, Outcome 4 Peri‐operative surgical complications.
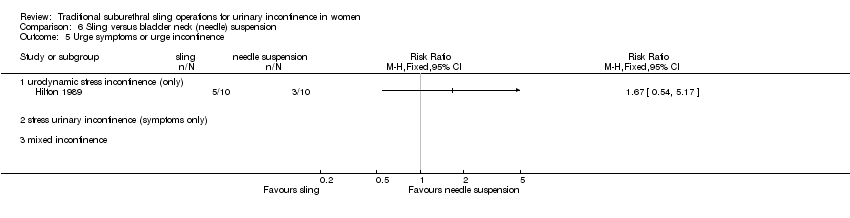
Comparison 6 Sling versus bladder neck (needle) suspension, Outcome 5 Urge symptoms or urge incontinence.

Comparison 6 Sling versus bladder neck (needle) suspension, Outcome 6 Voiding dysfunction after three months.

Comparison 6 Sling versus bladder neck (needle) suspension, Outcome 7 Detrusor overactivity (urodynamic diagnosis).

Comparison 9 Traditional sling versus minimally invasive sling operation, Outcome 1 Number with incontinence (worse, unchanged or improved) within the first year (women's observations).

Comparison 9 Traditional sling versus minimally invasive sling operation, Outcome 2 Number not improved (worse or unchanged) within the first year (women's observations).

Comparison 9 Traditional sling versus minimally invasive sling operation, Outcome 3 Number with incontinence (worse, unchanged or improved) after first year (women's observations).

Comparison 9 Traditional sling versus minimally invasive sling operation, Outcome 4 Number not improved (worse or unchanged) after the first year (women's observations).

Comparison 9 Traditional sling versus minimally invasive sling operation, Outcome 5 Pad test: mean weight of urine.

Comparison 9 Traditional sling versus minimally invasive sling operation, Outcome 6 Number with incontinence (clinician's observations) within first year.

Comparison 9 Traditional sling versus minimally invasive sling operation, Outcome 7 Number with incontinence (clinician's observations) after first year.

Comparison 9 Traditional sling versus minimally invasive sling operation, Outcome 8 Operative time (mins).

Comparison 9 Traditional sling versus minimally invasive sling operation, Outcome 9 Length of hospital stay (days).

Comparison 9 Traditional sling versus minimally invasive sling operation, Outcome 10 Time to catheter removal (days).
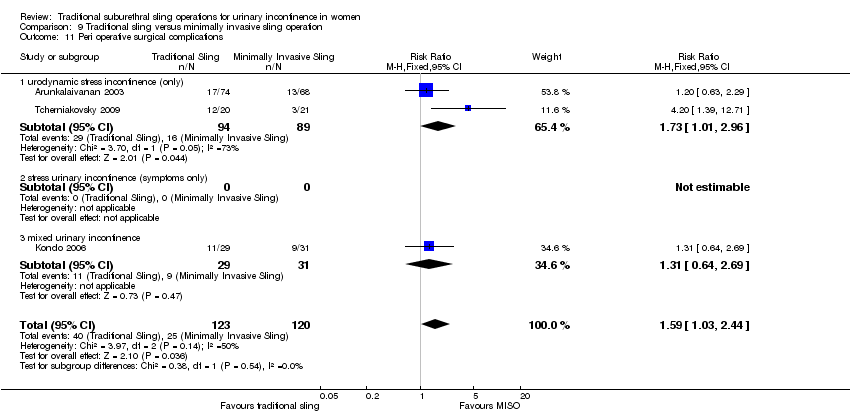
Comparison 9 Traditional sling versus minimally invasive sling operation, Outcome 11 Peri operative surgical complications.

Comparison 9 Traditional sling versus minimally invasive sling operation, Outcome 12 Bladder perforations.

Comparison 9 Traditional sling versus minimally invasive sling operation, Outcome 13 Urethral injury.

Comparison 9 Traditional sling versus minimally invasive sling operation, Outcome 14 De novo detrusor urgency or urge symptoms.

Comparison 9 Traditional sling versus minimally invasive sling operation, Outcome 15 De novo detrusor overactivity (urodynamic diagnosis).

Comparison 9 Traditional sling versus minimally invasive sling operation, Outcome 16 Voiding dysfunction.
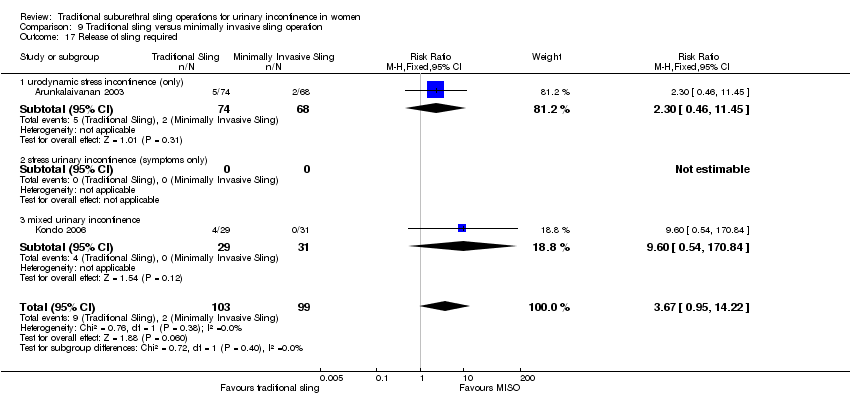
Comparison 9 Traditional sling versus minimally invasive sling operation, Outcome 17 Release of sling required.
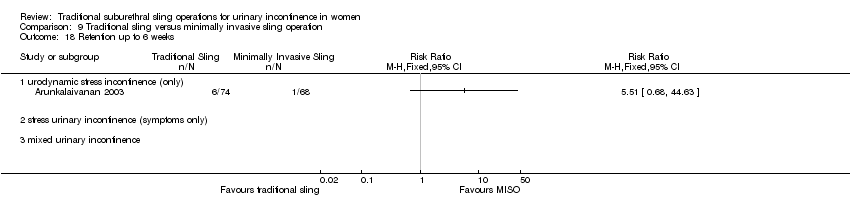
Comparison 9 Traditional sling versus minimally invasive sling operation, Outcome 18 Retention up to 6 weeks.
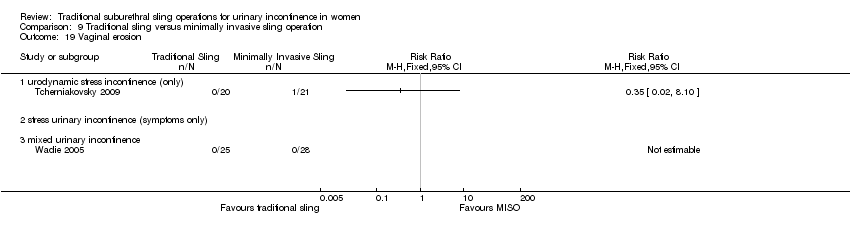
Comparison 9 Traditional sling versus minimally invasive sling operation, Outcome 19 Vaginal erosion.

Comparison 9 Traditional sling versus minimally invasive sling operation, Outcome 20 Wound pain (6 months).
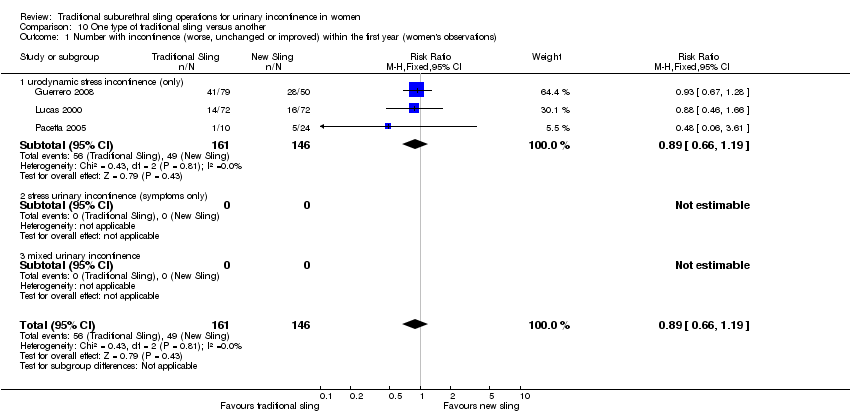
Comparison 10 One type of traditional sling versus another, Outcome 1 Number with incontinence (worse, unchanged or improved) within the first year (women's observations).

Comparison 10 One type of traditional sling versus another, Outcome 2 Number not improved (worse or unchanged) within the first year (women's observations).

Comparison 10 One type of traditional sling versus another, Outcome 3 Number with incontinence (worse, unchanged or improved) after first year (women's observations).

Comparison 10 One type of traditional sling versus another, Outcome 4 Number not improved (worse or unchanged) after the first year (women's observations).

Comparison 10 One type of traditional sling versus another, Outcome 5 Number with incontinence (worse, unchanged or improved) after five years (women's observations).

Comparison 10 One type of traditional sling versus another, Outcome 6 Pad test: mean weight of urine.

Comparison 10 One type of traditional sling versus another, Outcome 7 Operative time (mins).

Comparison 10 One type of traditional sling versus another, Outcome 8 Peri operative surgical complications.

Comparison 10 One type of traditional sling versus another, Outcome 9 Bladder perforation.
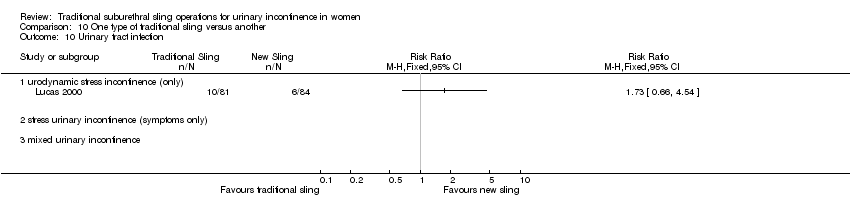
Comparison 10 One type of traditional sling versus another, Outcome 10 Urinary tract infection.

Comparison 10 One type of traditional sling versus another, Outcome 11 De novo detrusor urgency or urge symptoms or detrusor overactivity.

Comparison 10 One type of traditional sling versus another, Outcome 12 Voiding dysfunction.

Comparison 10 One type of traditional sling versus another, Outcome 13 De novo detrusor overactivity (urodynamic diagnosis).
| Traditional suburethral slings compared to injectable treatment for stress urinary incontinence | ||||||
| Patient or population: women with stress urinary incontinence | ||||||
| Outcomes | Illustrative comparative risks* (95% CI) | Relative effect | No of participants | Quality of the evidence | Comments | |
| Assumed risk | Corresponding risk | |||||
| Injectable treatment | Traditional suburethral slings | |||||
| 4.1 Number with incontinence (worse, unchanged or improved) within the first year (women's observations) | 227 per 10001 | 95 per 1000 | RR 0.42 | 43 | ⊕⊝⊝⊝ | Single trial with few participants |
| 4.2 Number with incontinence (worse, unchanged or improved) after first year (women's observations) | 286 per 10001 | 34 per 1000 | RR 0.12 | 27 | ⊕⊕⊝⊝ | Single trial with few participants |
| 4.4 Voiding dysfunction | 45 per 10001 | 189 per 1000 | RR 4.19 | 43 | ⊕⊕⊝⊝ | Single trial with few participants |
| *The basis for the assumed risk (e.g. the median control group risk across studies) is provided in footnotes. The corresponding risk (and its 95% confidence interval) is based on the assumed risk in the comparison group and the relative effect of the intervention (and its 95% CI). | ||||||
| GRADE Working Group grades of evidence | ||||||
| 1Illustrative comparative risks were based upon the mean risk on control intervention in the studies included in the meta‐analysis. | ||||||
| Traditional suburethral sling operation compared to open abdominal retropubic suspension for stress urinary incontinence | ||||||
| Patient or population: women with stress urinary incontinence | ||||||
| Outcomes | Illustrative comparative risks* (95% CI) | Relative effect | No of participants | Quality of the evidence | Comments | |
| Assumed risk | Corresponding risk | |||||
| Open abdominal retropubic suspension | Traditional suburethral sling operation | |||||
| 5.1 Number with incontinence (worse, unchanged or improved) within the first year (women's observations) | 92 per 10001 | 37 per 1000 | RR 0.4 | 147 | ⊕⊕⊝⊝ | Fischer trial did not account for incomplete outcome data |
| 5.3 Number with incontinence (worse, unchanged or improved) after first year (women's observations) | 399 per 10001 | 299 per 1000 | RR 0.75 | 715 | ⊕⊕⊕⊝ | Demirci did not account for incomplete outcome data |
| 5.14 Peri‐operative surgical complications | 407 per 10001 | 533 per 1000 | RR 1.31 | 792 | ⊕⊕⊕⊝ | |
| 5.15 Bladder perforation | 30 per 10001 | 0 per 1000 | RR 0 | 655 | ⊕⊕⊕⊝ | Single study thus no pooled data available |
| 5.18 Voiding dysfunction after three months | 21 per 10001 | 128 per 1000 | RR 6.08 | 853 | ⊕⊕⊕⊝ | |
| 5.21 Repeat incontinence surgery ‐ not reported | See comment | See comment | Not estimable | ‐ | See comment | No data |
| *The basis for the assumed risk (e.g. the median control group risk across studies) is provided in footnotes. The corresponding risk (and its 95% confidence interval) is based on the assumed risk in the comparison group and the relative effect of the intervention (and its 95% CI). | ||||||
| GRADE Working Group grades of evidence | ||||||
| 1Illustrative comparative risks were based upon the mean risk on control intervention in the studies included in the meta‐analysis. | ||||||
| Traditional suburethral sling operation compared to bladder neck (needle) suspension for stress urinary incontinence | ||||||
| Patient or population: women with stress urinary incontinence | ||||||
| Outcomes | Illustrative comparative risks* (95% CI) | Relative effect | No of participants | Quality of the evidence | Comments | |
| Assumed risk | Corresponding risk | |||||
| Bladder neck (needle) suspension | Traditional suburethral sling operation | |||||
| 6.1 Number with incontinence (worse, unchanged or improved) within the first year (women's observations) | 200 per 10001 | 100 per 1000 | RR 0.5 | 20 | ⊕⊝⊝⊝ | |
| 6.2 Number with incontinence (worse, unchanged or improved) after the first year (women's observations) | 300 per 10001 | 99 per 1000 | RR 0.33 | 20 | ⊕⊝⊝⊝ | |
| 6.4 Peri‐operative surgical complications | 200 per 10001 | 900 per 1000 | RR 4.5 | 20 | ⊕⊕⊝⊝ | |
| 6.6 Voiding dysfunction after three months ‐ urodynamic stress incontinence (only) | 200 per 10001 | 400 per 1000 | RR 2 | 20 | ⊕⊝⊝⊝ | |
| *The basis for the assumed risk (e.g. the median control group risk across studies) is provided in footnotes. The corresponding risk (and its 95% confidence interval) is based on the assumed risk in the comparison group and the relative effect of the intervention (and its 95% CI). | ||||||
| GRADE Working Group grades of evidence | ||||||
| 1Illustrative comparative risks were based upon the mean risk on control intervention in the studies included in the meta‐analysis. | ||||||
| Traditional suburethral sling operation compared to minimally invasive synthetic slings for stress urinary incontinence | ||||||
| Patient or population: women with stress urinary incontinence | ||||||
| Outcomes | Illustrative comparative risks* (95% CI) | Relative effect | No of participants | Quality of the evidence | Comments | |
| Assumed risk | Corresponding risk | |||||
| Minimally invasive slings | Traditional suburethral sling operation | |||||
| 9.1 Number with incontinence (worse, unchanged or improved) within the first year (women's observations) | 275 per 10001 | 267 per 1000 | RR 0.97 | 693 | ⊕⊕⊕⊕ | |
| 9.3 Number with incontinence (worse, unchanged or improved) after first year (women's observations) | 253 per 10001 | 311 per 1000 | RR 1.23 | 382 | ⊕⊕⊝⊝ | |
| 9.11 Peri‐operative surgical complications | 208 per 10001 | 331 per 1000 | RR 1.59 | 243 | ⊕⊕⊝⊝ | |
| 9.12 Bladder perforations | 82 per 10001 | 51 per 1000 | RR 0.62 | 563 | ⊕⊕⊕⊝ | |
| 9.16 Voiding dysfunction | 98 per 10001 | 157 per 1000 | RR 1.6 | 375 | ⊕⊕⊕⊝ | |
| *The basis for the assumed risk (e.g. the median control group risk across studies) is provided in footnotes. The corresponding risk (and its 95% confidence interval) is based on the assumed risk in the comparison group and the relative effect of the intervention (and its 95% CI). | ||||||
| GRADE Working Group grades of evidence | ||||||
| 1Illustrative comparative risks were based upon the mean risk on control intervention in the studies included in the meta‐analysis. | ||||||
| Traditional suburethral sling operation compared to another traditional suburethral sling for stress urinary incontinence | ||||||
| Patient or population: women with stress urinary incontinence | ||||||
| Outcomes | Illustrative comparative risks* (95% CI) | Relative effect | No of participants | Quality of the evidence | Comments | |
| Assumed risk | Corresponding risk | |||||
| Another traditional suburethral sling | Traditional suburethral sling operation | |||||
| 10.1 Number with incontinence (worse, unchanged or improved) within the first year (women's observations) | 336 per 10001 | 299 per 1000 | RR 0.89 | 307 | ⊕⊕⊕⊝ | |
| 10.3 Number with incontinence (worse, unchanged or improved) after first year (women's observations) | 467 per 10001 | 416 per 1000 | RR 0.89 | 379 | ⊕⊕⊕⊝ | |
| 10.8 Peri‐operative surgical complications | 360 per 10001 | 335 per 1000 | RR 0.93 | 213 | ⊕⊕⊝⊝ | |
| 10.12 Voiding dysfunction | 202 per 10001 | 234 per 1000 | RR 1.16 | 165 | ⊕⊕⊕⊝ | |
| *The basis for the assumed risk (e.g. the median control group risk across studies) is provided in footnotes. The corresponding risk (and its 95% confidence interval) is based on the assumed risk in the comparison group and the relative effect of the intervention (and its 95% CI). | ||||||
| GRADE Working Group grades of evidence | ||||||
| 1Illustrative comparative risks were based upon the mean risk on control intervention in the studies included in the meta‐analysis. | ||||||
| Outcome or subgroup title | No. of studies | No. of participants | Statistical method | Effect size |
| 1 Number with incontinence (worse, unchanged or improved) within the first year (women's observations) Show forest plot | 1 | Risk Ratio (M‐H, Fixed, 95% CI) | Totals not selected | |
| 1.1 urodynamic stress incontinence (only) | 0 | Risk Ratio (M‐H, Fixed, 95% CI) | 0.0 [0.0, 0.0] | |
| 1.2 stress urinary incontinence (symptoms only) | 0 | Risk Ratio (M‐H, Fixed, 95% CI) | 0.0 [0.0, 0.0] | |
| 1.3 mixed incontinence | 1 | Risk Ratio (M‐H, Fixed, 95% CI) | 0.0 [0.0, 0.0] | |
| 2 Urge symptoms or urge incontinence Show forest plot | 1 | Risk Ratio (M‐H, Fixed, 95% CI) | Totals not selected | |
| 2.1 urodynamic stress incontinence (only) | 0 | Risk Ratio (M‐H, Fixed, 95% CI) | 0.0 [0.0, 0.0] | |
| 2.2 stress urinary incontinence (symptoms only) | 0 | Risk Ratio (M‐H, Fixed, 95% CI) | 0.0 [0.0, 0.0] | |
| 2.3 mixed incontinence | 1 | Risk Ratio (M‐H, Fixed, 95% CI) | 0.0 [0.0, 0.0] | |
| Outcome or subgroup title | No. of studies | No. of participants | Statistical method | Effect size |
| 1 Number with incontinence (worse, unchanged or improved) within the first year (women's observations) Show forest plot | 1 | Risk Ratio (M‐H, Fixed, 95% CI) | Totals not selected | |
| 1.1 urodynamic stress incontinence (only) | 1 | Risk Ratio (M‐H, Fixed, 95% CI) | 0.0 [0.0, 0.0] | |
| 1.2 stress urinary incontinence (symptoms only) | 0 | Risk Ratio (M‐H, Fixed, 95% CI) | 0.0 [0.0, 0.0] | |
| 1.3 mixed urinary incontinence | 0 | Risk Ratio (M‐H, Fixed, 95% CI) | 0.0 [0.0, 0.0] | |
| 2 Number with incontinence (worse, unchanged or improved) after first year (women's observations) Show forest plot | 1 | Risk Ratio (M‐H, Fixed, 95% CI) | Totals not selected | |
| 2.1 urodynamic stress incontinence (only) | 1 | Risk Ratio (M‐H, Fixed, 95% CI) | 0.0 [0.0, 0.0] | |
| 2.2 stress urinary incontinence (symptoms only) | 0 | Risk Ratio (M‐H, Fixed, 95% CI) | 0.0 [0.0, 0.0] | |
| 2.3 mixed urinary incontinence | 0 | Risk Ratio (M‐H, Fixed, 95% CI) | 0.0 [0.0, 0.0] | |
| 3 Number with incontinence (clinician's observations) within first year Show forest plot | 1 | Risk Ratio (M‐H, Fixed, 95% CI) | Totals not selected | |
| 3.1 urodynamic stress incontinence (only) | 1 | Risk Ratio (M‐H, Fixed, 95% CI) | 0.0 [0.0, 0.0] | |
| 3.2 stress urinary incontinence (symptoms only) | 0 | Risk Ratio (M‐H, Fixed, 95% CI) | 0.0 [0.0, 0.0] | |
| 3.3 mixed urinary incontinence | 0 | Risk Ratio (M‐H, Fixed, 95% CI) | 0.0 [0.0, 0.0] | |
| 4 Voiding dysfunction Show forest plot | 1 | Risk Ratio (M‐H, Fixed, 95% CI) | Totals not selected | |
| 4.1 urodynamic stress incontinence (only) | 1 | Risk Ratio (M‐H, Fixed, 95% CI) | 0.0 [0.0, 0.0] | |
| 4.2 stress urinary incontinence (symptoms only) | 0 | Risk Ratio (M‐H, Fixed, 95% CI) | 0.0 [0.0, 0.0] | |
| 4.3 mixed urinary incontinence | 0 | Risk Ratio (M‐H, Fixed, 95% CI) | 0.0 [0.0, 0.0] | |
| 5 De novo detrusor overactivity (urodynamic diagnosis) Show forest plot | 1 | Risk Ratio (M‐H, Fixed, 95% CI) | Totals not selected | |
| 5.1 urodynamic stress incontinence (only) | 1 | Risk Ratio (M‐H, Fixed, 95% CI) | 0.0 [0.0, 0.0] | |
| 5.2 stress urinary incontinence (symptoms only) | 0 | Risk Ratio (M‐H, Fixed, 95% CI) | 0.0 [0.0, 0.0] | |
| 5.3 mixed urinary incontinence | 0 | Risk Ratio (M‐H, Fixed, 95% CI) | 0.0 [0.0, 0.0] | |
| 6 Urinary tract infection Show forest plot | 1 | Risk Ratio (M‐H, Fixed, 95% CI) | Totals not selected | |
| 6.1 urodynamic stress incontinence (only) | 1 | Risk Ratio (M‐H, Fixed, 95% CI) | 0.0 [0.0, 0.0] | |
| 6.2 stress urinary incontinence (symptoms only) | 0 | Risk Ratio (M‐H, Fixed, 95% CI) | 0.0 [0.0, 0.0] | |
| 6.3 mixed urinary incontinence | 0 | Risk Ratio (M‐H, Fixed, 95% CI) | 0.0 [0.0, 0.0] | |
| Outcome or subgroup title | No. of studies | No. of participants | Statistical method | Effect size |
| 1 Number with incontinence (worse, unchanged or improved) within the first year (women's observations) Show forest plot | 4 | 147 | Risk Ratio (M‐H, Fixed, 95% CI) | 0.40 [0.11, 1.41] |
| 1.1 urodynamic stress incontinence (only) | 4 | 147 | Risk Ratio (M‐H, Fixed, 95% CI) | 0.40 [0.11, 1.41] |
| 1.2 stress urinary incontinence (symptoms only) | 0 | 0 | Risk Ratio (M‐H, Fixed, 95% CI) | 0.0 [0.0, 0.0] |
| 1.3 mixed incontinence | 0 | 0 | Risk Ratio (M‐H, Fixed, 95% CI) | 0.0 [0.0, 0.0] |
| 2 Number not improved (worse or unchanged) within the first year (women's observations) | 0 | 0 | Risk Ratio (M‐H, Fixed, 95% CI) | 0.0 [0.0, 0.0] |
| 2.1 urodynamic stress incontinence (only) | 0 | 0 | Risk Ratio (M‐H, Fixed, 95% CI) | 0.0 [0.0, 0.0] |
| 2.2 stress urinary incontinence (symptoms only) | 0 | 0 | Risk Ratio (M‐H, Fixed, 95% CI) | 0.0 [0.0, 0.0] |
| 2.3 mixed incontinence | 0 | 0 | Risk Ratio (M‐H, Fixed, 95% CI) | 0.0 [0.0, 0.0] |
| 3 Number with incontinence (worse, unchanged or improved) after first year (women's observations) Show forest plot | 5 | 715 | Risk Ratio (M‐H, Fixed, 95% CI) | 0.75 [0.62, 0.90] |
| 3.1 urodynamic stress incontinence (only) | 4 | 195 | Risk Ratio (M‐H, Fixed, 95% CI) | 0.72 [0.31, 1.67] |
| 3.2 stress urinary incontinence (symptoms only) | 1 | 520 | Risk Ratio (M‐H, Fixed, 95% CI) | 0.75 [0.62, 0.91] |
| 3.3 mixed incontinence | 0 | 0 | Risk Ratio (M‐H, Fixed, 95% CI) | 0.0 [0.0, 0.0] |
| 4 Number not improved (worse or unchanged) after first year (women's observations) | 0 | 0 | Risk Ratio (M‐H, Fixed, 95% CI) | 0.0 [0.0, 0.0] |
| 4.1 urodynamic stress incontinence (only) | 0 | 0 | Risk Ratio (M‐H, Fixed, 95% CI) | 0.0 [0.0, 0.0] |
| 4.2 stress urinary incontinence (symptoms only) | 0 | 0 | Risk Ratio (M‐H, Fixed, 95% CI) | 0.0 [0.0, 0.0] |
| 4.3 mixed incontinence | 0 | 0 | Risk Ratio (M‐H, Fixed, 95% CI) | 0.0 [0.0, 0.0] |
| 5 Pad changes over 24 hours | 0 | 0 | Mean Difference (IV, Fixed, 95% CI) | 0.0 [0.0, 0.0] |
| 5.1 urodynamic stress incontinence (only) | 0 | 0 | Mean Difference (IV, Fixed, 95% CI) | 0.0 [0.0, 0.0] |
| 5.2 stress urinary incontinence (symptoms only) | 0 | 0 | Mean Difference (IV, Fixed, 95% CI) | 0.0 [0.0, 0.0] |
| 5.3 mixed incontinence | 0 | 0 | Mean Difference (IV, Fixed, 95% CI) | 0.0 [0.0, 0.0] |
| 6 Incontinent episodes over 24 hours | 0 | 0 | Mean Difference (IV, Fixed, 95% CI) | 0.0 [0.0, 0.0] |
| 6.1 urodynamic stress incontinence (only) | 0 | 0 | Mean Difference (IV, Fixed, 95% CI) | 0.0 [0.0, 0.0] |
| 6.2 stress urinary incontinence (symptoms only) | 0 | 0 | Mean Difference (IV, Fixed, 95% CI) | 0.0 [0.0, 0.0] |
| 6.3 mixed incontinence | 0 | 0 | Mean Difference (IV, Fixed, 95% CI) | 0.0 [0.0, 0.0] |
| 7 Pad test weights | 0 | 0 | Mean Difference (IV, Fixed, 95% CI) | 0.0 [0.0, 0.0] |
| 7.1 urodynamic stress incontinence (only) | 0 | 0 | Mean Difference (IV, Fixed, 95% CI) | 0.0 [0.0, 0.0] |
| 7.2 stress urinary incontinence (symptoms only) | 0 | 0 | Mean Difference (IV, Fixed, 95% CI) | 0.0 [0.0, 0.0] |
| 7.3 mixed incontinence | 0 | 0 | Mean Difference (IV, Fixed, 95% CI) | 0.0 [0.0, 0.0] |
| 8 Number with incontinence (clinician's observations) within the first year | 0 | 0 | Risk Ratio (M‐H, Fixed, 95% CI) | 0.0 [0.0, 0.0] |
| 8.1 urodynamic stress incontinence (only) | 0 | 0 | Risk Ratio (M‐H, Fixed, 95% CI) | 0.0 [0.0, 0.0] |
| 8.2 stress urinary incontinence (symptoms only) | 0 | 0 | Risk Ratio (M‐H, Fixed, 95% CI) | 0.0 [0.0, 0.0] |
| 8.3 mixed incontinence | 0 | 0 | Risk Ratio (M‐H, Fixed, 95% CI) | 0.0 [0.0, 0.0] |
| 9 Number with incontinence (clinician's observations) after first year Show forest plot | 3 | 620 | Risk Ratio (M‐H, Fixed, 95% CI) | 0.95 [0.64, 1.41] |
| 9.1 urodynamic stress incontinence (only) | 1 | 28 | Risk Ratio (M‐H, Fixed, 95% CI) | 0.23 [0.01, 4.37] |
| 9.2 stress urinary incontinence (symptoms only) | 2 | 592 | Risk Ratio (M‐H, Fixed, 95% CI) | 0.99 [0.66, 1.47] |
| 9.3 mixed incontinence | 0 | 0 | Risk Ratio (M‐H, Fixed, 95% CI) | 0.0 [0.0, 0.0] |
| 10 Operative time (minutes) Show forest plot | 1 | Mean Difference (IV, Fixed, 95% CI) | Totals not selected | |
| 10.1 urodynamic stress incontinence (only) | 1 | Mean Difference (IV, Fixed, 95% CI) | 0.0 [0.0, 0.0] | |
| 10.2 stress urinary incontinence (symptoms only) | 0 | Mean Difference (IV, Fixed, 95% CI) | 0.0 [0.0, 0.0] | |
| 10.3 mixed incontinence | 0 | Mean Difference (IV, Fixed, 95% CI) | 0.0 [0.0, 0.0] | |
| 11 Time to catheter removal (days) Show forest plot | 2 | 108 | Mean Difference (IV, Fixed, 95% CI) | 8.01 [6.84, 9.18] |
| 11.1 urodynamic stress incontinence (only) | 1 | 36 | Mean Difference (IV, Fixed, 95% CI) | 9.5 [‐4.27, 23.27] |
| 11.2 stress urinary incontinence (symptoms only) | 1 | 72 | Mean Difference (IV, Fixed, 95% CI) | 8.0 [6.82, 9.18] |
| 11.3 mixed incontinence | 0 | 0 | Mean Difference (IV, Fixed, 95% CI) | 0.0 [0.0, 0.0] |
| 12 Length of inpatient stay (days) Show forest plot | 3 | 137 | Mean Difference (IV, Fixed, 95% CI) | 2.03 [1.47, 2.59] |
| 12.1 urodynamic stress incontinence (only) | 3 | 137 | Mean Difference (IV, Fixed, 95% CI) | 2.03 [1.47, 2.59] |
| 12.2 stress urinary incontinence (symptoms only) | 0 | 0 | Mean Difference (IV, Fixed, 95% CI) | 0.0 [0.0, 0.0] |
| 12.3 mixed incontinence | 0 | 0 | Mean Difference (IV, Fixed, 95% CI) | 0.0 [0.0, 0.0] |
| 13 Time to return to normal activity level | 0 | 0 | Mean Difference (IV, Fixed, 95% CI) | 0.0 [0.0, 0.0] |
| 13.1 urodynamic stress incontinence (only) | 0 | 0 | Mean Difference (IV, Fixed, 95% CI) | 0.0 [0.0, 0.0] |
| 13.2 stress urinary incontinence (symptoms only) | 0 | 0 | Mean Difference (IV, Fixed, 95% CI) | 0.0 [0.0, 0.0] |
| 13.3 mixed incontinence | 0 | 0 | Mean Difference (IV, Fixed, 95% CI) | 0.0 [0.0, 0.0] |
| 14 Peri‐operative surgical complications Show forest plot | 4 | 792 | Risk Ratio (M‐H, Fixed, 95% CI) | 1.31 [1.14, 1.51] |
| 14.1 urodynamic stress incontinence (only) | 3 | 137 | Risk Ratio (M‐H, Fixed, 95% CI) | 0.85 [0.28, 2.52] |
| 14.2 stress urinary incontinence (symptoms only) | 1 | 655 | Risk Ratio (M‐H, Fixed, 95% CI) | 1.33 [1.16, 1.53] |
| 14.3 mixed incontinence | 0 | 0 | Risk Ratio (M‐H, Fixed, 95% CI) | 0.0 [0.0, 0.0] |
| 15 Bladder perforation Show forest plot | 1 | Risk Ratio (M‐H, Fixed, 95% CI) | Totals not selected | |
| 15.1 urodynamic stress incontinence (only) | 0 | Risk Ratio (M‐H, Fixed, 95% CI) | 0.0 [0.0, 0.0] | |
| 15.2 stress urinary incontinence (symptoms only) | 1 | Risk Ratio (M‐H, Fixed, 95% CI) | 0.0 [0.0, 0.0] | |
| 15.3 mixed incontinence | 0 | Risk Ratio (M‐H, Fixed, 95% CI) | 0.0 [0.0, 0.0] | |
| 16 Urinary tract infection Show forest plot | 1 | Risk Ratio (M‐H, Fixed, 95% CI) | Totals not selected | |
| 16.1 urodynamic stress incontinence (only) | 0 | Risk Ratio (M‐H, Fixed, 95% CI) | 0.0 [0.0, 0.0] | |
| 16.2 stress urinary incontinence (symptoms only) | 1 | Risk Ratio (M‐H, Fixed, 95% CI) | 0.0 [0.0, 0.0] | |
| 16.3 mixed incontinence | 0 | Risk Ratio (M‐H, Fixed, 95% CI) | 0.0 [0.0, 0.0] | |
| 17 Urge symptoms or urge incontinence Show forest plot | 1 | Risk Ratio (M‐H, Fixed, 95% CI) | Totals not selected | |
| 17.1 urodynamic stress incontinence (only) | 1 | Risk Ratio (M‐H, Fixed, 95% CI) | 0.0 [0.0, 0.0] | |
| 17.2 stress urinary incontinence (symptoms only) | 0 | Risk Ratio (M‐H, Fixed, 95% CI) | 0.0 [0.0, 0.0] | |
| 17.3 mixed incontinence | 0 | Risk Ratio (M‐H, Fixed, 95% CI) | 0.0 [0.0, 0.0] | |
| 18 Detrusor overactivity (urodynamic diagnosis) Show forest plot | 4 | 203 | Risk Ratio (M‐H, Fixed, 95% CI) | 1.42 [0.52, 3.87] |
| 18.1 urodynamic stress incontinence (only) | 4 | 203 | Risk Ratio (M‐H, Fixed, 95% CI) | 1.42 [0.52, 3.87] |
| 18.2 stress urinary incontinence (symptoms only) | 0 | 0 | Risk Ratio (M‐H, Fixed, 95% CI) | 0.0 [0.0, 0.0] |
| 18.3 mixed incontinence | 0 | 0 | Risk Ratio (M‐H, Fixed, 95% CI) | 0.0 [0.0, 0.0] |
| 19 Voiding dysfunction after three months Show forest plot | 5 | 853 | Risk Ratio (M‐H, Fixed, 95% CI) | 6.08 [3.10, 11.95] |
| 19.1 urodynamic stress incontinence (only) | 4 | 198 | Risk Ratio (M‐H, Fixed, 95% CI) | 4.48 [1.16, 17.36] |
| 19.2 stress urinary incontinence (symptoms only) | 1 | 655 | Risk Ratio (M‐H, Fixed, 95% CI) | 6.63 [3.04, 14.47] |
| 19.3 mixed incontinence | 0 | 0 | Risk Ratio (M‐H, Fixed, 95% CI) | 0.0 [0.0, 0.0] |
| 20 Prolapse Show forest plot | 2 | 106 | Risk Ratio (M‐H, Fixed, 95% CI) | 0.2 [0.04, 1.11] |
| 20.1 urodynamic stress incontinence (only) | 2 | 106 | Risk Ratio (M‐H, Fixed, 95% CI) | 0.2 [0.04, 1.11] |
| 20.2 stress urinary incontinence (symptoms only) | 0 | 0 | Risk Ratio (M‐H, Fixed, 95% CI) | 0.0 [0.0, 0.0] |
| 20.3 mixed incontinence | 0 | 0 | Risk Ratio (M‐H, Fixed, 95% CI) | 0.0 [0.0, 0.0] |
| 21 Repeat incontinence surgery | 0 | 0 | Risk Ratio (M‐H, Fixed, 95% CI) | 0.0 [0.0, 0.0] |
| 21.1 urodynamic stress incontinence (only) | 0 | 0 | Risk Ratio (M‐H, Fixed, 95% CI) | 0.0 [0.0, 0.0] |
| 21.2 stress urinary incontinence (symptoms only) | 0 | 0 | Risk Ratio (M‐H, Fixed, 95% CI) | 0.0 [0.0, 0.0] |
| 21.3 mixed incontinence | 0 | 0 | Risk Ratio (M‐H, Fixed, 95% CI) | 0.0 [0.0, 0.0] |
| 22 Health status measures | 0 | 0 | Mean Difference (IV, Fixed, 95% CI) | 0.0 [0.0, 0.0] |
| 22.1 urodynamic stress incontinence (only) | 0 | 0 | Mean Difference (IV, Fixed, 95% CI) | 0.0 [0.0, 0.0] |
| 22.2 stress urinary incontinence (symptoms only) | 0 | 0 | Mean Difference (IV, Fixed, 95% CI) | 0.0 [0.0, 0.0] |
| 22.3 mixed incontinence | 0 | 0 | Mean Difference (IV, Fixed, 95% CI) | 0.0 [0.0, 0.0] |
| Outcome or subgroup title | No. of studies | No. of participants | Statistical method | Effect size |
| 1 Number with incontinence (worse, unchanged or improved) within the first year (women's observations) Show forest plot | 1 | Risk Ratio (M‐H, Fixed, 95% CI) | Totals not selected | |
| 1.1 urodynamic stress incontinence (only) | 1 | Risk Ratio (M‐H, Fixed, 95% CI) | 0.0 [0.0, 0.0] | |
| 1.2 stress urinary incontinence (symptoms only) | 0 | Risk Ratio (M‐H, Fixed, 95% CI) | 0.0 [0.0, 0.0] | |
| 1.3 mixed incontinence | 0 | Risk Ratio (M‐H, Fixed, 95% CI) | 0.0 [0.0, 0.0] | |
| 2 Number with incontinence (worse, unchanged or improved) after the first year (women's observations) Show forest plot | 1 | Risk Ratio (M‐H, Fixed, 95% CI) | Totals not selected | |
| 2.1 urodynamic stress incontinence (only) | 1 | Risk Ratio (M‐H, Fixed, 95% CI) | 0.0 [0.0, 0.0] | |
| 2.2 stress urinary incontinence (symptoms only) | 0 | Risk Ratio (M‐H, Fixed, 95% CI) | 0.0 [0.0, 0.0] | |
| 2.3 mixed incontinence | 0 | Risk Ratio (M‐H, Fixed, 95% CI) | 0.0 [0.0, 0.0] | |
| 3 Length of inpatient stay Show forest plot | 1 | Mean Difference (IV, Fixed, 95% CI) | Totals not selected | |
| 3.1 urodynamic stress incontinence (only) | 1 | Mean Difference (IV, Fixed, 95% CI) | 0.0 [0.0, 0.0] | |
| 3.2 stress urinary incontinence (symptoms only) | 0 | Mean Difference (IV, Fixed, 95% CI) | 0.0 [0.0, 0.0] | |
| 3.3 mixed incontinence | 0 | Mean Difference (IV, Fixed, 95% CI) | 0.0 [0.0, 0.0] | |
| 4 Peri‐operative surgical complications Show forest plot | 1 | Risk Ratio (M‐H, Fixed, 95% CI) | Totals not selected | |
| 4.1 urodynamic stress incontinence (only) | 1 | Risk Ratio (M‐H, Fixed, 95% CI) | 0.0 [0.0, 0.0] | |
| 4.2 stress urinary incontinence (symptoms only) | 0 | Risk Ratio (M‐H, Fixed, 95% CI) | 0.0 [0.0, 0.0] | |
| 4.3 mixed incontinence | 0 | Risk Ratio (M‐H, Fixed, 95% CI) | 0.0 [0.0, 0.0] | |
| 5 Urge symptoms or urge incontinence Show forest plot | 1 | Risk Ratio (M‐H, Fixed, 95% CI) | Totals not selected | |
| 5.1 urodynamic stress incontinence (only) | 1 | Risk Ratio (M‐H, Fixed, 95% CI) | 0.0 [0.0, 0.0] | |
| 5.2 stress urinary incontinence (symptoms only) | 0 | Risk Ratio (M‐H, Fixed, 95% CI) | 0.0 [0.0, 0.0] | |
| 5.3 mixed incontinence | 0 | Risk Ratio (M‐H, Fixed, 95% CI) | 0.0 [0.0, 0.0] | |
| 6 Voiding dysfunction after three months Show forest plot | 1 | Risk Ratio (M‐H, Fixed, 95% CI) | Totals not selected | |
| 6.1 urodynamic stress incontinence (only) | 1 | Risk Ratio (M‐H, Fixed, 95% CI) | 0.0 [0.0, 0.0] | |
| 6.2 stress urinary incontinence (symptoms only) | 0 | Risk Ratio (M‐H, Fixed, 95% CI) | 0.0 [0.0, 0.0] | |
| 6.3 mixed incontinence | 0 | Risk Ratio (M‐H, Fixed, 95% CI) | 0.0 [0.0, 0.0] | |
| 7 Detrusor overactivity (urodynamic diagnosis) Show forest plot | 1 | Risk Ratio (M‐H, Fixed, 95% CI) | Totals not selected | |
| 7.1 urodynamic stress incontinence (only) | 1 | Risk Ratio (M‐H, Fixed, 95% CI) | 0.0 [0.0, 0.0] | |
| 7.2 stress urinary incontinence (symptoms only) | 0 | Risk Ratio (M‐H, Fixed, 95% CI) | 0.0 [0.0, 0.0] | |
| 7.3 mixed incontinence | 0 | Risk Ratio (M‐H, Fixed, 95% CI) | 0.0 [0.0, 0.0] | |
| Outcome or subgroup title | No. of studies | No. of participants | Statistical method | Effect size |
| 1 Number with incontinence (worse, unchanged or improved) within the first year (women's observations) Show forest plot | 8 | 693 | Risk Ratio (M‐H, Fixed, 95% CI) | 0.97 [0.78, 1.20] |
| 1.1 urodynamic stress incontinence (only) | 5 | 434 | Risk Ratio (M‐H, Fixed, 95% CI) | 1.01 [0.76, 1.34] |
| 1.2 stress urinary incontinence (symptoms only) | 0 | 0 | Risk Ratio (M‐H, Fixed, 95% CI) | 0.0 [0.0, 0.0] |
| 1.3 mixed urinary incontinence | 3 | 259 | Risk Ratio (M‐H, Fixed, 95% CI) | 0.91 [0.66, 1.27] |
| 2 Number not improved (worse or unchanged) within the first year (women's observations) Show forest plot | 3 | 432 | Risk Ratio (M‐H, Fixed, 95% CI) | 0.78 [0.48, 1.27] |
| 2.1 urodynamic stress incontinence (only) | 2 | 293 | Risk Ratio (M‐H, Fixed, 95% CI) | 0.92 [0.39, 2.13] |
| 2.2 stress urinary incontinence (symptoms only) | 0 | 0 | Risk Ratio (M‐H, Fixed, 95% CI) | 0.0 [0.0, 0.0] |
| 2.3 mixed urinary incontinence | 1 | 139 | Risk Ratio (M‐H, Fixed, 95% CI) | 0.72 [0.40, 1.29] |
| 3 Number with incontinence (worse, unchanged or improved) after first year (women's observations) Show forest plot | 4 | 382 | Risk Ratio (M‐H, Fixed, 95% CI) | 1.23 [0.91, 1.66] |
| 3.1 urodynamic stress incontinence (only) | 3 | 338 | Risk Ratio (M‐H, Fixed, 95% CI) | 1.17 [0.86, 1.60] |
| 3.2 stress urinary incontinence (symptoms only) | 0 | 0 | Risk Ratio (M‐H, Fixed, 95% CI) | 0.0 [0.0, 0.0] |
| 3.3 mixed urinary incontinence | 1 | 44 | Risk Ratio (M‐H, Fixed, 95% CI) | 1.92 [0.65, 5.63] |
| 4 Number not improved (worse or unchanged) after the first year (women's observations) Show forest plot | 2 | 279 | Risk Ratio (M‐H, Fixed, 95% CI) | 1.30 [0.57, 2.94] |
| 4.1 urodynamic stress incontinence (only) | 2 | 279 | Risk Ratio (M‐H, Fixed, 95% CI) | 1.30 [0.57, 2.94] |
| 4.2 stress urinary incontinence (symptoms only) | 0 | 0 | Risk Ratio (M‐H, Fixed, 95% CI) | 0.0 [0.0, 0.0] |
| 4.3 mixed urinary incontinence | 0 | 0 | Risk Ratio (M‐H, Fixed, 95% CI) | 0.0 [0.0, 0.0] |
| 5 Pad test: mean weight of urine Show forest plot | 1 | 20 | Mean Difference (IV, Fixed, 95% CI) | ‐29.00 [‐57.53, ‐4.47] |
| 5.1 urodynamic stress incontinence (only) | 1 | 20 | Mean Difference (IV, Fixed, 95% CI) | ‐29.00 [‐57.53, ‐4.47] |
| 5.2 stress urinary incontinence (symptoms only) | 0 | 0 | Mean Difference (IV, Fixed, 95% CI) | 0.0 [0.0, 0.0] |
| 5.3 mixed urinary incontinence | 0 | 0 | Mean Difference (IV, Fixed, 95% CI) | 0.0 [0.0, 0.0] |
| 6 Number with incontinence (clinician's observations) within first year Show forest plot | 2 | 105 | Risk Ratio (M‐H, Fixed, 95% CI) | 1.29 [0.45, 3.71] |
| 6.1 urodynamic stress incontinence (only) | 0 | 0 | Risk Ratio (M‐H, Fixed, 95% CI) | 0.0 [0.0, 0.0] |
| 6.2 stress urinary incontinence (symptoms only) | 0 | 0 | Risk Ratio (M‐H, Fixed, 95% CI) | 0.0 [0.0, 0.0] |
| 6.3 mixed urinary incontinence | 2 | 105 | Risk Ratio (M‐H, Fixed, 95% CI) | 1.29 [0.45, 3.71] |
| 7 Number with incontinence (clinician's observations) after first year Show forest plot | 1 | 44 | Risk Ratio (M‐H, Fixed, 95% CI) | 1.72 [0.82, 3.61] |
| 7.1 urodynamic stress incontinence (only) | 0 | 0 | Risk Ratio (M‐H, Fixed, 95% CI) | 0.0 [0.0, 0.0] |
| 7.2 stress urinary incontinence (symptoms only) | 0 | 0 | Risk Ratio (M‐H, Fixed, 95% CI) | 0.0 [0.0, 0.0] |
| 7.3 mixed urinary incontinence | 1 | 44 | Risk Ratio (M‐H, Fixed, 95% CI) | 1.72 [0.82, 3.61] |
| 8 Operative time (mins) Show forest plot | 5 | 225 | Mean Difference (IV, Fixed, 95% CI) | 59.90 [56.62, 63.18] |
| 8.1 urodynamic stress incontinence (only) | 2 | 61 | Mean Difference (IV, Fixed, 95% CI) | 46.91 [42.31, 51.52] |
| 8.2 stress urinary incontinence (symptoms only) | 0 | 0 | Mean Difference (IV, Fixed, 95% CI) | 0.0 [0.0, 0.0] |
| 8.3 mixed urinary incontinence | 3 | 164 | Mean Difference (IV, Fixed, 95% CI) | 73.26 [68.59, 77.94] |
| 9 Length of hospital stay (days) Show forest plot | 2 | 64 | Mean Difference (IV, Fixed, 95% CI) | 0.49 [0.26, 0.72] |
| 9.1 urodynamic stress incontinence (only) | 1 | 20 | Mean Difference (IV, Fixed, 95% CI) | 0.65 [0.39, 0.91] |
| 9.2 stress urinary incontinence (symptoms only) | 0 | 0 | Mean Difference (IV, Fixed, 95% CI) | 0.0 [0.0, 0.0] |
| 9.3 mixed urinary incontinence | 1 | 44 | Mean Difference (IV, Fixed, 95% CI) | 0.0 [‐0.46, 0.46] |
| 10 Time to catheter removal (days) Show forest plot | 2 | 113 | Mean Difference (IV, Fixed, 95% CI) | 0.11 [‐0.07, 0.30] |
| 10.1 urodynamic stress incontinence (only) | 0 | 0 | Mean Difference (IV, Fixed, 95% CI) | 0.0 [0.0, 0.0] |
| 10.2 stress urinary incontinence (symptoms only) | 0 | 0 | Mean Difference (IV, Fixed, 95% CI) | 0.0 [0.0, 0.0] |
| 10.3 mixed urinary incontinence | 2 | 113 | Mean Difference (IV, Fixed, 95% CI) | 0.11 [‐0.07, 0.30] |
| 11 Peri operative surgical complications Show forest plot | 3 | 243 | Risk Ratio (M‐H, Fixed, 95% CI) | 1.59 [1.03, 2.44] |
| 11.1 urodynamic stress incontinence (only) | 2 | 183 | Risk Ratio (M‐H, Fixed, 95% CI) | 1.73 [1.01, 2.96] |
| 11.2 stress urinary incontinence (symptoms only) | 0 | 0 | Risk Ratio (M‐H, Fixed, 95% CI) | 0.0 [0.0, 0.0] |
| 11.3 mixed urinary incontinence | 1 | 60 | Risk Ratio (M‐H, Fixed, 95% CI) | 1.31 [0.64, 2.69] |
| 12 Bladder perforations Show forest plot | 7 | 563 | Risk Ratio (M‐H, Fixed, 95% CI) | 0.62 [0.34, 1.11] |
| 12.1 urodynamic stress incontinence (only) | 2 | 183 | Risk Ratio (M‐H, Fixed, 95% CI) | 3.14 [0.14, 72.92] |
| 12.2 stress urinary incontinence (symptoms only) | 0 | 0 | Risk Ratio (M‐H, Fixed, 95% CI) | 0.0 [0.0, 0.0] |
| 12.3 mixed urinary incontinence | 5 | 380 | Risk Ratio (M‐H, Fixed, 95% CI) | 0.57 [0.31, 1.04] |
| 13 Urethral injury Show forest plot | 1 | Risk Ratio (M‐H, Fixed, 95% CI) | Totals not selected | |
| 13.1 urodynamic stress incontinence (only) | 0 | Risk Ratio (M‐H, Fixed, 95% CI) | 0.0 [0.0, 0.0] | |
| 13.2 stress urinary incontinence (symptoms only) | 0 | Risk Ratio (M‐H, Fixed, 95% CI) | 0.0 [0.0, 0.0] | |
| 13.3 mixed urinary incontinence | 1 | Risk Ratio (M‐H, Fixed, 95% CI) | 0.0 [0.0, 0.0] | |
| 14 De novo detrusor urgency or urge symptoms Show forest plot | 3 | 174 | Risk Ratio (M‐H, Fixed, 95% CI) | 3.13 [0.96, 10.24] |
| 14.1 urodynamic stress incontinence (only) | 0 | 0 | Risk Ratio (M‐H, Fixed, 95% CI) | 0.0 [0.0, 0.0] |
| 14.2 stress urinary incontinence (symptoms only) | 0 | 0 | Risk Ratio (M‐H, Fixed, 95% CI) | 0.0 [0.0, 0.0] |
| 14.3 mixed urinary incontinence | 3 | 174 | Risk Ratio (M‐H, Fixed, 95% CI) | 3.13 [0.96, 10.24] |
| 15 De novo detrusor overactivity (urodynamic diagnosis) Show forest plot | 3 | 245 | Risk Ratio (M‐H, Fixed, 95% CI) | 3.21 [1.29, 8.03] |
| 15.1 urodynamic stress incontinence (only) | 1 | 59 | Risk Ratio (M‐H, Fixed, 95% CI) | 0.0 [0.0, 0.0] |
| 15.2 stress urinary incontinence (symptoms only) | 0 | 0 | Risk Ratio (M‐H, Fixed, 95% CI) | 0.0 [0.0, 0.0] |
| 15.3 mixed urinary incontinence | 2 | 186 | Risk Ratio (M‐H, Fixed, 95% CI) | 3.21 [1.29, 8.03] |
| 16 Voiding dysfunction Show forest plot | 5 | 375 | Risk Ratio (M‐H, Fixed, 95% CI) | 1.60 [0.94, 2.71] |
| 16.1 urodynamic stress incontinence (only) | 2 | 201 | Risk Ratio (M‐H, Fixed, 95% CI) | 0.97 [0.42, 2.25] |
| 16.2 stress urinary incontinence (symptoms only) | 0 | 0 | Risk Ratio (M‐H, Fixed, 95% CI) | 0.0 [0.0, 0.0] |
| 16.3 mixed urinary incontinence | 3 | 174 | Risk Ratio (M‐H, Fixed, 95% CI) | 2.28 [1.13, 4.62] |
| 17 Release of sling required Show forest plot | 2 | 202 | Risk Ratio (M‐H, Fixed, 95% CI) | 3.67 [0.95, 14.22] |
| 17.1 urodynamic stress incontinence (only) | 1 | 142 | Risk Ratio (M‐H, Fixed, 95% CI) | 2.30 [0.46, 11.45] |
| 17.2 stress urinary incontinence (symptoms only) | 0 | 0 | Risk Ratio (M‐H, Fixed, 95% CI) | 0.0 [0.0, 0.0] |
| 17.3 mixed urinary incontinence | 1 | 60 | Risk Ratio (M‐H, Fixed, 95% CI) | 9.6 [0.54, 170.84] |
| 18 Retention up to 6 weeks Show forest plot | 1 | Risk Ratio (M‐H, Fixed, 95% CI) | Totals not selected | |
| 18.1 urodynamic stress incontinence (only) | 1 | Risk Ratio (M‐H, Fixed, 95% CI) | 0.0 [0.0, 0.0] | |
| 18.2 stress urinary incontinence (symptoms only) | 0 | Risk Ratio (M‐H, Fixed, 95% CI) | 0.0 [0.0, 0.0] | |
| 18.3 mixed urinary incontinence | 0 | Risk Ratio (M‐H, Fixed, 95% CI) | 0.0 [0.0, 0.0] | |
| 19 Vaginal erosion Show forest plot | 2 | Risk Ratio (M‐H, Fixed, 95% CI) | Totals not selected | |
| 19.1 urodynamic stress incontinence (only) | 1 | Risk Ratio (M‐H, Fixed, 95% CI) | 0.0 [0.0, 0.0] | |
| 19.2 stress urinary incontinence (symptoms only) | 0 | Risk Ratio (M‐H, Fixed, 95% CI) | 0.0 [0.0, 0.0] | |
| 19.3 mixed urinary incontinence | 1 | Risk Ratio (M‐H, Fixed, 95% CI) | 0.0 [0.0, 0.0] | |
| 20 Wound pain (6 months) Show forest plot | 1 | Risk Ratio (M‐H, Fixed, 95% CI) | Totals not selected | |
| 20.1 urodynamic stress incontinence (only) | 0 | Risk Ratio (M‐H, Fixed, 95% CI) | 0.0 [0.0, 0.0] | |
| 20.2 stress urinary incontinence (symptoms only) | 0 | Risk Ratio (M‐H, Fixed, 95% CI) | 0.0 [0.0, 0.0] | |
| 20.3 mixed urinary incontinence | 1 | Risk Ratio (M‐H, Fixed, 95% CI) | 0.0 [0.0, 0.0] | |
| Outcome or subgroup title | No. of studies | No. of participants | Statistical method | Effect size |
| 1 Number with incontinence (worse, unchanged or improved) within the first year (women's observations) Show forest plot | 3 | 307 | Risk Ratio (M‐H, Fixed, 95% CI) | 0.89 [0.66, 1.19] |
| 1.1 urodynamic stress incontinence (only) | 3 | 307 | Risk Ratio (M‐H, Fixed, 95% CI) | 0.89 [0.66, 1.19] |
| 1.2 stress urinary incontinence (symptoms only) | 0 | 0 | Risk Ratio (M‐H, Fixed, 95% CI) | 0.0 [0.0, 0.0] |
| 1.3 mixed urinary incontinence | 0 | 0 | Risk Ratio (M‐H, Fixed, 95% CI) | 0.0 [0.0, 0.0] |
| 2 Number not improved (worse or unchanged) within the first year (women's observations) Show forest plot | 3 | Risk Ratio (M‐H, Fixed, 95% CI) | Subtotals only | |
| 2.1 urodynamic stress incontinence (only) | 2 | 163 | Risk Ratio (M‐H, Fixed, 95% CI) | 0.22 [0.08, 0.59] |
| 2.2 stress urinary incontinence (symptoms only) | 0 | 0 | Risk Ratio (M‐H, Fixed, 95% CI) | 0.0 [0.0, 0.0] |
| 2.3 mixed urinary incontinence | 1 | 48 | Risk Ratio (M‐H, Fixed, 95% CI) | 6.70 [0.40, 111.94] |
| 3 Number with incontinence (worse, unchanged or improved) after first year (women's observations) Show forest plot | 4 | 379 | Risk Ratio (M‐H, Fixed, 95% CI) | 0.89 [0.72, 1.10] |
| 3.1 urodynamic stress incontinence (only) | 3 | 331 | Risk Ratio (M‐H, Fixed, 95% CI) | 0.83 [0.67, 1.03] |
| 3.2 stress urinary incontinence (symptoms only) | 0 | 0 | Risk Ratio (M‐H, Fixed, 95% CI) | 0.0 [0.0, 0.0] |
| 3.3 mixed urinary incontinence | 1 | 48 | Risk Ratio (M‐H, Fixed, 95% CI) | 2.75 [0.69, 10.95] |
| 4 Number not improved (worse or unchanged) after the first year (women's observations) Show forest plot | 3 | Risk Ratio (M‐H, Fixed, 95% CI) | Subtotals only | |
| 4.1 urodynamic stress incontinence (only) | 2 | 186 | Risk Ratio (M‐H, Fixed, 95% CI) | 0.33 [0.17, 0.64] |
| 4.2 stress urinary incontinence (symptoms only) | 0 | 0 | Risk Ratio (M‐H, Fixed, 95% CI) | 0.0 [0.0, 0.0] |
| 4.3 mixed urinary incontinence | 1 | 48 | Risk Ratio (M‐H, Fixed, 95% CI) | 0.0 [0.0, 0.0] |
| 5 Number with incontinence (worse, unchanged or improved) after five years (women's observations) Show forest plot | 1 | Risk Ratio (M‐H, Fixed, 95% CI) | Totals not selected | |
| 5.1 urodynamic stress incontinence (only) | 1 | Risk Ratio (M‐H, Fixed, 95% CI) | 0.0 [0.0, 0.0] | |
| 5.2 stress urinary incontinence (symptoms only) | 0 | Risk Ratio (M‐H, Fixed, 95% CI) | 0.0 [0.0, 0.0] | |
| 5.3 mixed urinary incontinence | 0 | Risk Ratio (M‐H, Fixed, 95% CI) | 0.0 [0.0, 0.0] | |
| 6 Pad test: mean weight of urine Show forest plot | 1 | Mean Difference (IV, Fixed, 95% CI) | Totals not selected | |
| 6.1 urodynamic stress incontinence (only) | 1 | Mean Difference (IV, Fixed, 95% CI) | 0.0 [0.0, 0.0] | |
| 6.2 stress urinary incontinence (symptoms only) | 0 | Mean Difference (IV, Fixed, 95% CI) | 0.0 [0.0, 0.0] | |
| 6.3 mixed urinary incontinence | 0 | Mean Difference (IV, Fixed, 95% CI) | 0.0 [0.0, 0.0] | |
| 7 Operative time (mins) Show forest plot | 1 | Mean Difference (IV, Fixed, 95% CI) | Totals not selected | |
| 7.1 urodynamic stress incontinence (only) | 1 | Mean Difference (IV, Fixed, 95% CI) | 0.0 [0.0, 0.0] | |
| 7.2 stress urinary incontinence (symptoms only) | 0 | Mean Difference (IV, Fixed, 95% CI) | 0.0 [0.0, 0.0] | |
| 7.3 mixed urinary incontinence | 0 | Mean Difference (IV, Fixed, 95% CI) | 0.0 [0.0, 0.0] | |
| 8 Peri operative surgical complications Show forest plot | 2 | Risk Ratio (M‐H, Fixed, 95% CI) | Totals not selected | |
| 8.1 urodynamic stress incontinence (only) | 1 | Risk Ratio (M‐H, Fixed, 95% CI) | 0.0 [0.0, 0.0] | |
| 8.2 stress urinary incontinence (symptoms only) | 0 | Risk Ratio (M‐H, Fixed, 95% CI) | 0.0 [0.0, 0.0] | |
| 8.3 mixed urinary incontinence | 1 | Risk Ratio (M‐H, Fixed, 95% CI) | 0.0 [0.0, 0.0] | |
| 9 Bladder perforation Show forest plot | 1 | Risk Ratio (M‐H, Fixed, 95% CI) | Totals not selected | |
| 9.1 urodynamic stress incontinence (only) | 1 | Risk Ratio (M‐H, Fixed, 95% CI) | 0.0 [0.0, 0.0] | |
| 9.2 stress urinary incontinence (symptoms only) | 0 | Risk Ratio (M‐H, Fixed, 95% CI) | 0.0 [0.0, 0.0] | |
| 9.3 mixed urinary incontinence | 0 | Risk Ratio (M‐H, Fixed, 95% CI) | 0.0 [0.0, 0.0] | |
| 10 Urinary tract infection Show forest plot | 1 | Risk Ratio (M‐H, Fixed, 95% CI) | Totals not selected | |
| 10.1 urodynamic stress incontinence (only) | 1 | Risk Ratio (M‐H, Fixed, 95% CI) | 0.0 [0.0, 0.0] | |
| 10.2 stress urinary incontinence (symptoms only) | 0 | Risk Ratio (M‐H, Fixed, 95% CI) | 0.0 [0.0, 0.0] | |
| 10.3 mixed urinary incontinence | 0 | Risk Ratio (M‐H, Fixed, 95% CI) | 0.0 [0.0, 0.0] | |
| 11 De novo detrusor urgency or urge symptoms or detrusor overactivity Show forest plot | 1 | Risk Ratio (M‐H, Fixed, 95% CI) | Totals not selected | |
| 11.1 urodynamic stress incontinence (only) | 1 | Risk Ratio (M‐H, Fixed, 95% CI) | 0.0 [0.0, 0.0] | |
| 11.2 stress urinary incontinence (symptoms only) | 0 | Risk Ratio (M‐H, Fixed, 95% CI) | 0.0 [0.0, 0.0] | |
| 11.3 mixed urinary incontinence | 0 | Risk Ratio (M‐H, Fixed, 95% CI) | 0.0 [0.0, 0.0] | |
| 12 Voiding dysfunction Show forest plot | 1 | Risk Ratio (M‐H, Fixed, 95% CI) | Totals not selected | |
| 12.1 urodynamic stress incontinence (only) | 1 | Risk Ratio (M‐H, Fixed, 95% CI) | 0.0 [0.0, 0.0] | |
| 12.2 stress urinary incontinence (symptoms only) | 0 | Risk Ratio (M‐H, Fixed, 95% CI) | 0.0 [0.0, 0.0] | |
| 12.3 mixed urinary incontinence | 0 | Risk Ratio (M‐H, Fixed, 95% CI) | 0.0 [0.0, 0.0] | |
| 13 De novo detrusor overactivity (urodynamic diagnosis) Show forest plot | 2 | Risk Ratio (M‐H, Fixed, 95% CI) | Subtotals only | |
| 13.1 urodynamic stress incontinence (only) | 1 | 57 | Risk Ratio (M‐H, Fixed, 95% CI) | 1.72 [0.52, 5.74] |
| 13.2 stress urinary incontinence (symptoms only) | 0 | 0 | Risk Ratio (M‐H, Fixed, 95% CI) | 0.0 [0.0, 0.0] |
| 13.3 mixed urinary incontinence | 1 | 48 | Risk Ratio (M‐H, Fixed, 95% CI) | 0.67 [0.17, 2.63] |