Operaciones con cabestrillos suburetrales tradicionales para la incontinencia urinaria en mujeres
Resumen
Antecedentes
La incontinencia urinaria de esfuerzo constituye una carga sanitaria y económica importante para la sociedad. Los cabestrillos suburetrales tradicionales son operaciones quirúrgicas que se utilizan para tratar a las mujeres con síntomas de incontinencia urinaria de esfuerzo.
Objetivos
Evaluar la efectividad de los procedimientos tradicionales con cabestrillos suburetrales para el tratamiento de la incontinencia urinaria de esfuerzo en las mujeres; y resumir los hallazgos principales de las evaluaciones económicas pertinentes.
Métodos de búsqueda
Se realizaron búsquedas en el Registro Especializado del Grupo Cochrane de Incontinencia (Cochrane Incontinence Specialised Register), que contiene ensayos identificados del Registro Cochrane Central de Ensayos Controlados (Cochrane Central Register of Controlled Trials, CENTRAL), así como en MEDLINE, MEDLINE In‐Process, MEDLINE Epub Ahead of Print, the Cumulative Index to Nursing and Allied Health Literature (CINAHL), ClinicalTrials.gov, y la International Clinical Trials Registry Platform de la Organización Mundial de la Salud (ICTRP de la OMS); se realizaron búsquedas manuales en revistas y actas de congresos (búsqueda del 27 de febrero 2017) y en las listas de referencias de los artículos pertinentes. El 23 de enero 2019 se actualizó esta búsqueda; como resultado, varios informes adicionales de estudios están a la espera de ser clasificados.
Criterios de selección
Ensayos aleatorizados o cuasialeatorizados que evaluaron los cabestrillos suburetrales tradicionales para el tratamiento de la incontinencia urinaria de esfuerzo o mixta.
Obtención y análisis de los datos
Dos autores de la revisión, de forma independiente, extrajeron los datos de los estudios incluidos y evaluaron el riesgo de sesgo. Cuando fue apropiado, se calculó una estadística resumida: el riesgo relativo (RR) para los datos dicotómicos, el odds ratio (OR) para las tasas de continencia y resolución que se esperaba que fueran altas, y la diferencia de medias (DM) para los datos continuos. Se utilizaron los criterios GRADE para evaluar la calidad de la evidencia.
Resultados principales
Se incluyó un total de 34 ensayos con 3244 mujeres. Los cabestrillos tradicionales se compararon con otros 10 tratamientos y entre sí.
No se identificaron ensayos que compararan los cabestrillos suburetrales con ningún tratamiento o tratamiento simulado, tratamiento conservador, reparación anterior o colposuspensión retropúbica laparoscópica. La mayoría de los ensayos no distinguieron entre las mujeres sometidas a una cirugía para la incontinencia primaria o recurrente. Un ensayo comparó los cabestrillos tradicionales con la suspensión con agujas del cuello de la vejiga, y otro ensayo comparó los cabestrillos tradicionales con los de una única incisión. Ambos ensayos fueron demasiado pequeños para ser informativos.
Operación con cabestrillos suburetrales tradicionales frente a fármacos
Un ensayo pequeño comparó las operaciones con cabestrillos suburetrales tradicionales frente a la oxibutinina para el tratamiento de las mujeres con incontinencia urinaria mixta. Este ensayo no informó de ninguno de los resultados específicos según los criterios GRADE. No se sabe con certeza si la cirugía comparada con la oxibutinina da lugar a que más mujeres no presenten pérdidas (83% vs 0%; OR 195,89; intervalo de confianza [IC] del 95%: 9,91 a 3871,03) o a que presenten menos incontinencia urinaria de urgencia (13% vs 43%; RR 0,29; IC del 95%: 0,09 a 0,94) debido a que la calidad de esta evidencia es muy baja.
Cabestrillo suburetral tradicional frente a los inyectables
Un ensayo pequeño comparó los cabestrillos tradicionales con el tratamiento con inyección suburetral. La repercusión de la cirugía frente a los inyectables es incierta en cuanto al número de mujeres continentes (el 100% no presentó pérdidas con un cabestrillo tradicional frente al 71% con el inyectable después del primer año; OR 11,57; IC del 95%: 0,56 a 239,74), la necesidad de repetir la cirugía para la incontinencia urinaria (RR 0,52; IC del 95%: 0,05 a 5,36) o la aparición de complicaciones perioperatorias (RR 1,57; IC del 95%: 0,29 a 8,49), debido a que la calidad de la evidencia es muy baja.
Cabestrillo suburetral tradicional frente a la colposuspensión retropúbica abdominal abierta
Ocho ensayos compararon los cabestrillos con la colposuspensión retropúbica abdominal abierta. La evidencia de calidad moderada muestra que el cabestrillo suburetral tradicional probablemente da lugar a que más mujeres sean continentes a plazo medio (de uno a cinco años) (69% frente a 59% después de la colposuspensión: OR 1,70; IC del 95%: 1,22 a 2,37). La evidencia de calidad alta muestra que las mujeres tuvieron menos probabilidades de necesitar una cirugía de continencia repetida después de una operación con cabestrillo tradicional que después de una colposuspensión (RR 0,15; IC del 95%: 0,05 a 0,42). No se encontró evidencia de una diferencia en las complicaciones perioperatorias entre los dos grupos, pero el IC fue muy amplio y la calidad de la evidencia fue muy baja (RR 1,24; IC del 95%: 0,83 a 1,86).
Operación con cabestrillo suburetral tradicional frente a cabestrillos mediouretrales
Catorce ensayos compararon las operaciones con cabestrillos tradicionales y las operaciones con cabestrillos mediouretrales. Dependiendo de los juicios sobre lo que constituye una diferencia clínicamente importante entre las intervenciones con respecto a la continencia, los cabestrillos suburetrales tradicionales probablemente no son mejores, y pueden ser menos efectivos, que los cabestrillos mediouretrales en cuanto al número de mujeres continentes a plazo medio (de uno a cinco años) (67% frente a 74%; OR 0,67; IC del 95%: 0,44 a 1,02; n = 458; evidencia de calidad moderada). Un ensayo informó de más mujeres continentes con el cabestrillo tradicional después de 10 años (51% frente a 32%: OR 2,22; IC del 95%: 1,07 a 4,61). Los cabestrillos mediouretrales pueden asociarse con menos complicaciones perioperatorias (RR 1,74; IC del 95%: 1,16 a 2,60; evidencia de calidad baja).
Un tipo de operación con cabestrillo tradicional frente a otro tipo de operación con cabestrillo tradicional
Nueve ensayos compararon un tipo de operación con cabestrillo tradicional con otro. Los diferentes tipos de cabestrillos tradicionales, junto con el número de materiales diferentes que se utilizaron, dan lugar a que los resultados de los ensayos no se hayan podido agrupar debido a la heterogeneidad clínica. Dos ensayos informaron sobre las complicaciones: uno que comparaba el Goretex no absorbible con un cabestrillo de fascia rectal, y el segundo que comparaba Pelvicol con un cabestrillo de fascia rectal. El impacto fue incierto debido a la calidad muy baja de la evidencia.
Conclusiones de los autores
La evidencia de calidad baja indica que es más probable que las mujeres sean continentes a plazo medio (de uno a cinco años) después de una cirugía con cabestrillo suburetral tradicional que después de una colposuspensión. Es muy incierto si existe una diferencia en la incontinencia urinaria después de un cabestrillo suburetral tradicional en comparación con un cabestrillo mediouretral a plazo medio. Sin embargo, estos hallazgos deben interpretarse con cautela, debido a que en la mayoría de los ensayos no se disponía de datos de seguimiento a largo plazo. Es esencial el seguimiento a largo plazo de los ensayos controlados aleatorizados (ECA) que comparan los cabestrillos tradicionales con la colposuspensión y los cabestrillos mediouretrales. No hay evidencia suficiente que indique si los cabestrillos suburetrales tradicionales pueden ser mejores o peores que otras técnicas de tratamiento. Esta revisión se limita a los ECA y, por lo tanto, es posible que no identifique todos los efectos adversos que pueden estar asociados con estos procedimientos.
En un breve comentario económico (BCE) se identificaron tres evaluaciones económicas elegibles, que no son directamente comparables debido a las diferencias en los métodos, los horizontes temporales y los entornos. Los usuarios finales de esta revisión deberán evaluar en qué medida los métodos y resultados de la evaluación económica pueden ser aplicables (o transferibles) a su propio entorno.
PICO
Resumen en términos sencillos
Operaciones con cabestrillos suburetrales tradicionales para la incontinencia urinaria en mujeres
Pregunta de la revisión
¿Qué efectividad tienen los cabestrillos tradicionales comparados con otros tratamientos quirúrgicos o conservadores para mujeres con incontinencia urinaria de esfuerzo (IUE)?
Antecedentes
Una operación tradicional con cabestrillo suburetral es una de las opciones quirúrgicas para el tratamiento de la IUE en las mujeres. La incontinencia urinaria de esfuerzo es la pérdida de orina al toser, reírse, estornudar o realizar ejercicio. Puede deberse a un daño en los músculos que sostienen el cuello de la vejiga o a un daño en sus nervios, lo cual a menudo se produce durante el parto. Cuando la incontinencia urinaria de esfuerzo se produce junto con una necesidad de evacuar que es difícil de diferir (incontinencia urinaria de urgencia [IUU]), se conoce como incontinencia urinaria mixta (IUM). La cirugía tradicional con cabestrillo suburetral tiene por objeto sostener el cuello de la vejiga con una tira de material que puede ser biológico (hecho de tejido humano o animal) o de plástico sintético no absorbible (malla/cinta).
¿Cuán actualizada está esta revisión?
La evidencia está actualizada hasta el 27 de febrero 2017. Una nueva búsqueda realizada el 23 de enero 2019 no se incorporó en su totalidad a la revisión.
Características de los estudios
Se encontraron 34 ensayos controlados aleatorizados (ECA) que incluían a 3244 mujeres y que comparaban los cabestrillos tradicionales con fármacos u otros tipos de cirugía (colposuspensión, cabestrillos mediouretrales, suspensión con agujas del cuello de la vejiga, cabestrillos de incisión única [minicabestrillos]; un tipo de cabestrillo tradicional con otro; y cabestrillos tradicionales con inyectables. Todos los ensayos incluyeron a mujeres con IUE, pero algunos también incluyeron a mujeres con IUU, es decir, IUM.
No se encontraron estudios que compararan los cabestrillos suburetrales con ningún tratamiento o con un tratamiento simulado, con un tratamiento conservador como los ejercicios del suelo pelviano, la reparación anterior o la colposuspensión laparoscópica.
Fuentes de financiación de los estudios
Pocos autores informaron que habían financiado su trabajo.
Resultados clave
La cirugía parece funcionar mejor que los medicamentos para tratar la incontinencia urinaria. Alguna evidencia sugiere que las mujeres tuvieron menos pérdidas con los cabestrillos tradicionales a plazo medio (de uno a cinco años) en comparación con las sometidas a una colposuspensión (una cirugía abdominal importante), y menos pacientes necesitaron repetir la cirugía en un ensayo. Sin embargo, existe una falta de información sobre los efectos adversos. No está claro si los cabestrillos tradicionales fueron mejores o peores que los cabestrillos mediouretrales (cinta sintética) a plazo medio, aunque un ensayo pequeño demostró que las mujeres sometidas a la cirugía con cabestrillo tradicional podrían tener menos pérdidas 10 años después. No está claro si los cabestrillos tradicionales fueron mejores o peores que el tratamiento inyectable, la suspensión con agujas del cuello de la vejiga o los minicabestrillos. No se encontró información suficiente sobre los diferentes tipos de cabestrillos comparados entre sí, excepto que los cabestrillos hechos de dermis porcina (Pelvicol) presentaron más probabilidades de fracaso que otros materiales. Los cabestrillos hechos de Goretex sintético no absorbible implicaron más complicaciones.
Calidad de la evidencia
Muchos ensayos eran pequeños y utilizaron diferentes formas de medir el éxito, lo que dificultó la combinación de la información. La calidad de la evidencia para la mayoría de los resultados se consideró baja o muy baja. Este hecho significa que la mayoría de las conclusiones sobre los cabestrillos tradicionales son inciertas.
Conclusiones de los autores
Alguna evidencia sugiere que las mujeres tuvieron menos pérdidas con los cabestrillos tradicionales a plazo medio (de uno a cinco años) en comparación con las sometidas a una colposuspensión (una cirugía abdominal importante), y menos pacientes necesitaron repetir la cirugía en un ensayo. La evidencia sobre la comparación de los cabestrillos suburetrales tradicionales con otros tratamientos es insuficiente. Tres evaluaciones económicas elegibles informaron de resultados similares, pero no son directamente comparables debido a las diferencias en sus métodos. Esta revisión se limita a los ensayos controlados aleatorizados (ECA) y, por lo tanto, es posible que no identifique todos los efectos adversos que pueden estar asociados con estos procedimientos.
Conclusiones de los autores
Summary of findings
| Traditional suburethral sling operation versus no treatment or sham operation | ||||||
| Patient or population: women with urinary incontinence | ||||||
| Outcomes | Illustrative comparative risks* (95% CI) | Relative effect | Number of participants | Quality of the evidence | Comments | |
| Assumed risk | Corresponding risk | |||||
| No treatment or sham treatment | Sling | |||||
| Number of continent (dry) women (any definition) in the medium term (1 to 5 years) | Not reported | |||||
| Repeat surgery for urinary incontinence | Not reported | |||||
| Perioperative surgical complications | Not reported | |||||
| Long‐term adverse effects | Not reported | |||||
| Condition‐specific quality of life | Not reported | |||||
| *The basis for the assumed risk (e.g. the median control group risk across studies) is provided in footnotes. The corresponding risk (and its 95% confidence interval) is based on the assumed risk in the comparison group and the relative effect of the intervention (and its 95% CI). | ||||||
| GRADE Working Group grades of evidence. | ||||||
| Traditional suburethral sling operation versus conservative management | ||||||
| Patient or population: women with urinary incontinence | ||||||
| Outcomes | Illustrative comparative risks* (95% CI) | Relative effect | Number of participants | Quality of the evidence | Comments | |
| Assumed risk | Corresponding risk | |||||
| Conservative treatment | Sling | |||||
| Number of continent (dry) women (any definition) in the medium term (1 to 5 years) | Not reported | |||||
| Repeat surgery for urinary incontinence | Not reported | |||||
| Perioperative surgical complications | Not reported | |||||
| Long‐term adverse effects | Not reported | |||||
| Condition‐specific quality of life | Not reported | |||||
| *The basis for the assumed risk (e.g. the median control group risk across studies) is provided in footnotes. The corresponding risk (and its 95% confidence interval) is based on the assumed risk in the comparison group and the relative effect of the intervention (and its 95% CI). | ||||||
| GRADE Working Group grades of evidence. | ||||||
| Traditional suburethral sling operation versus drugs | ||||||
| Patient or population: women with urinary incontinence | ||||||
| Outcomes | Illustrative comparative risks* (95% CI) | Relative effect | Number of participants | Quality of the evidence | Comments | |
| Assumed risk | Corresponding risk | |||||
| Drugs | Sling | |||||
| Number of continent (dry) women (any definition) in the medium term (1 to 5 years) | Not reported | |||||
| Repeat surgery for urinary incontinence | Not reported | |||||
| Perioperative surgical complications | Not reported | |||||
| Long‐term adverse effects | Not reported | |||||
| Condition‐specific quality of life | Not reported | |||||
| *The basis for the assumed risk (e.g. the median control group risk across studies) is provided in footnotes. The corresponding risk (and its 95% confidence interval) is based on the assumed risk in the comparison group and the relative effect of the intervention (and its 95% CI). | ||||||
| GRADE Working Group grades of evidence. | ||||||
| Traditional suburethral sling operation versus injectables | ||||||
| Patient or population: women with urinary incontinence | ||||||
| Outcomes | Illustrative comparative risks* (95% CI) | Relative effect | Number of participants | Quality of the evidence | Comments | |
| Assumed risk | Corresponding risk | |||||
| Injectable | Sling | |||||
| Number of continent (dry) women (any definition) in the medium term (1 to 5 years) | 714 per 1000 | 967 per 1000 (583 to 998) | OR 11.57 (0.56 to 239.7) | 43 | ⊕⊝⊝⊝ | 252 more women, per 1000, with traditional sling (131 fewer to 284 more) |
| Repeat surgery for urinary incontinence ‐ urodynamic stress incontinence (only) | 91 per 1000 | 47 per 1000 (5 to 487) | RR 0.52 (0.05 to 5.36) | 43 | ⊕⊝⊝⊝ | 44 fewer women, per 1000, with traditional sling (86 fewer to 396 more) |
| Perioperative surgical complications | 91 per 1000 | 143 per 1000 | RR 1.57 | 43 | ⊕⊝⊝⊝ | 52 more women, per 1000, with traditional sling (65 fewer to 681 more) |
| Long‐term adverse effects | Not reported | |||||
| Condition‐specific quality of life | Not reported | |||||
| *The basis for the assumed risk (e.g. the median control group risk across studies) is provided in footnotes. The corresponding risk (and its 95% confidence interval) is based on the assumed risk in the comparison group and the relative effect of the intervention (and its 95% CI). | ||||||
| GRADE Working Group grades of evidence. | ||||||
| aDowngraded one level due to serious risk of bias (unclear for sequence generation, allocation concealment, and blinding) and two levels for imprecision (95% CI very wide, 0.56 to 239.74; crosses line of no effect). bDowngraded two levels due to very serious imprecision: single trial with small sample size. | ||||||
| Traditional suburethral sling operation versus anterior repair | ||||||
| Patient or population: women with urinary incontinence | ||||||
| Outcomes | Illustrative comparative risks* (95% CI) | Relative effect | Number of participants | Quality of the evidence | Comments | |
| Assumed risk | Corresponding risk | |||||
| Anterior repair | Sling | |||||
| Number of continent (dry) women (any definition) in the medium term (1 to 5 years) | Not reported | |||||
| Repeat surgery for urinary incontinence | Not reported | |||||
| Perioperative surgical complications | Not reported | |||||
| Long‐term adverse effects | Not reported | |||||
| Condition‐specific quality of life | Not reported | |||||
| *The basis for the assumed risk (e.g. the median control group risk across studies) is provided in footnotes. The corresponding risk (and its 95% confidence interval) is based on the assumed risk in the comparison group and the relative effect of the intervention (and its 95% CI). | ||||||
| GRADE Working Group grades of evidence. | ||||||
| Traditional suburethral sling operation versus bladder neck needle suspension (abdominal and vaginal) | ||||||
| Patient or population: women with urinary incontinence | ||||||
| Outcomes | Illustrative comparative risks* (95% CI) | Relative effect | Number of participants | Quality of the evidence | Comments | |
| Assumed risk | Corresponding risk | |||||
| Bladder neck needle suspension | Sling | |||||
| Number of continent (dry) women (any definition) in the medium term (1 to 5 years) | 700 per 1000 | 900 per 1000 (435 to 991) | OR 3.86 0.33 to 45.57 | 20 | ⊕⊝⊝⊝ | 200 more women, per 1000, with traditional sling (265 fewer to 291 more) |
| Repeat surgery for urinary incontinence | Not reported | |||||
| Perioperative surgical complications ‐ urodynamic stress incontinence (only) | 200 per 1000 | 900 per 1000 | RR 4.5 | 20 | ⊕⊝⊝⊝ | 700 more women, per 1000, with traditional sling (56 fewer to 2962 more) |
| Long‐term adverse effects | Not reported | |||||
| Condition‐specific quality of life | Not reported | |||||
| *The basis for the assumed risk (e.g. the median control group risk across studies) is provided in footnotes. The corresponding risk (and its 95% confidence interval) is based on the assumed risk in the comparison group and the relative effect of the intervention (and its 95% CI). | ||||||
| GRADE Working Group grades of evidence. | ||||||
| aDowngraded two levels for risk of bias (evidence comes from a single trial that was judged to be unclear for allocation concealment and blinding) and two levels for imprecision (95% CI very wide). | ||||||
| Traditional suburethral sling operation versus open abdominal retropubic suspension | ||||||
| Patient or population: women with urinary incontinence | ||||||
| Outcomes | Illustrative comparative risks* (95% CI) | Relative effect | Number of participants | Quality of the evidence | Comments | |
| Assumed risk | Corresponding risk | |||||
| Open abdominal retropubic suspension | Sling | |||||
| Number of continent (dry) women (any definition) in the medium term (1 to 5 years) | 589 per 1000 | 711 per 1000 (638 to 774) | OR 1.70 (1.22 to 2.37) | 687 (4 RCTs) | ⊕⊕⊕⊝ | 120 more dry women, per 1000, with traditional sling (47 more to 186 more) |
| Repeat surgery for urinary incontinence‐stress urinary incontinence (symptoms only) | 119 per 1000 | 18 per 1000 | RR 0.15 (0.05 to 0.42) | 450 | ⊕⊕⊕⊕ | 101 fewer women having repeat continence surgery, per 1000, with traditional sling (113 fewer to 69 fewer) |
| Perioperative surgical complications | 95 per 1000 | 118 per 1000 | RR 1.24 | 792 | ⊕⊝⊝⊝ | 23 more women, per 1000, with traditional sling (16 fewer to 82 more) |
| Long‐term adverse effects | 92 per 1000 | 94 per 1000 | RR 1.02 (0.57 to 1.82) | 453 | ⊕⊕⊝⊝ | 2 more women, per 1000, with traditional sling (39 fewer to 75 more) |
| Condition‐specific quality of life | Mean IIQ score in the control group was 44.8 | Mean condition‐specific quality of life in the intervention groups was | 453 | ⊕⊝⊝⊝ | Another trial reported no evidence of a difference between colposuspension groups and sling groups in IIQ and UDI scores but reported no actual numbers | |
| *The basis for the assumed risk (e.g. the median control group risk across studies) is provided in footnotes. The corresponding risk (and its 95% confidence interval) is based on the assumed risk in the comparison group and the relative effect of the intervention (and its 95% CI). | ||||||
| GRADE Working Group grades of evidence. | ||||||
| aDowngraded one level due to serious risk of bias (unclear randomisation and allocation concealment in two of the smaller trials), but the trial carrying 90% of weight in the meta‐analysis was judged to have low risk of selection bias. bDowngraded one level for risk of bias (sequence generation was unclear in one‐fourth of trials and allocation concealment was unclear in three‐quarters of trials taking part in the meta‐analysis; participants were not blinded) and one level for imprecision (95% confidence interval was very wide). cDowngraded two levels for imprecision (95% confidence interval was very wide; 0.57 to 1.82). dDowngraded two levels for risk of bias (sequence generation and allocation concealment were judged to be "low risk"; blinding of participants was judged to be "high risk") and two levels for imprecision (95% confidence interval was very wide; ‐11.96 to 15.36). | ||||||
| Traditional suburethral sling operation versus laparoscopic colposuspension | ||||||
| Patient or population: women with urinary incontinence | ||||||
| Outcomes | Illustrative comparative risks* (95% CI) | Relative effect | Number of participants | Quality of the evidence | Comments | |
| Assumed risk | Corresponding risk | |||||
| Laparoscopic procedures | Sling | |||||
| Number of continent (dry) women (any definition) in the medium term (1 to 5 years) | Not reported | |||||
| Repeat surgery for urinary incontinence | Not reported | |||||
| Perioperative surgical complications | Not reported | |||||
| Voiding dysfunction | Not reported | |||||
| Long‐term adverse effects | Not reported | |||||
| Condition‐specific quality of life | Not reported | |||||
| *The basis for the assumed risk (e.g. the median control group risk across studies) is provided in footnotes. The corresponding risk (and its 95% confidence interval) is based on the assumed risk in the comparison group and the relative effect of the intervention (and its 95% CI). | ||||||
| GRADE Working Group grades of evidence. | ||||||
| Traditional suburethral sling operation versus a mid‐urethral sling or tape | ||||||
| Patient or population: women with urinary incontinence | ||||||
| Outcomes | Illustrative comparative risks* (95% CI) | Relative effect | Number of participants | Quality of the evidence | Comments | |
| Assumed risk | Corresponding risk | |||||
| Minimally invasive sling operation | Traditional sling | |||||
| Number of continent (dry) women (any definition) in the medium term (1 to 5 years) | 737 per 1000 | 652 per 1000 (552 to 741) | OR 0.67 (0.44 to 1.02) | 445 (6 RCTs) | ⊕⊕⊕⊝ | 85 fewer women, per 1000, with traditional sling (185 fewer to 4 more) |
| Repeat surgery for urinary incontinence ‐ urodynamic stress incontinence (only) | One trial reported the numbers of women having repeat continence surgery at 10‐year follow‐up: traditional sling: 0/67; mid‐urethral sling: 2/69 | 136 | ⊕⊕⊝⊝ | |||
| Perioperative surgical complications | 193 per 1000 | 336 per 1000 | RR 1.74 | 293 | ⊕⊕⊝⊝ | 143 more women, per 1000, with traditional sling (31 more to 309 more) |
| Long‐term adverse effects | 25 per 1000 | 62 per 1000 | RR 2.53 | 326 | ⊕⊝⊝⊝ | 38 more women, per 1000, with traditional sling (3 fewer to 157 more) |
| Condition‐specific quality of life | Mean IIQ‐7 score in the control group was 24.4 | Mean condition‐specific quality of life score in the intervention groups was | 63 | ⊕⊝⊝⊝ | Eight other trials reported some measure of QoL but the data were unsuitable for met‐analysis. Overall, there was no evidence of a difference between groups in QoL scores | |
| *The basis for the assumed risk (e.g. the median control group risk across studies) is provided in footnotes. The corresponding risk (and its 95% confidence interval) is based on the assumed risk in the comparison group and the relative effect of the intervention (and its 95% CI). | ||||||
| GRADE Working Group grades of evidence. | ||||||
| 1Downgraded one level due to serious risk of bias: 2/6 trials had high risk of selection bias. 2Downgraded two levels due to very serious imprecision: single study with small sample size. 3Downgraded two levels for risk of bias (sequence generation and allocation concealment were high or unclear risk in all four trials taking part in the meta‐analysis). 4Downgraded two levels for risk of bias (sequence generation and allocation concealment were high or unclear risk in two of three trials taking part in the meta‐analysis) and two levels for imprecision (95% confidence interval was very wide: 0.87 to 7.35). 5Downgraded two levels for risk of bias (sequence generation was judged to be high risk, and allocation concealment was judged to be low risk; outcome data were incomplete) and two levels for imprecision (95% confidence interval was very wide: ‐10.17 to 11.37). | ||||||
| Traditional suburethral sling operation versus a single‐incision sling (mini‐sling) | ||||||
| Patient or population: women with urinary incontinence | ||||||
| Outcomes | Illustrative comparative risks* (95% CI) | Relative effect | Number of participants | Quality of the evidence | Comments | |
| Assumed risk | Corresponding risk | |||||
| Number of continent (dry) women (any definition) in the medium term (1 to 5 years) | 886 per 1000 | 886 per 1000 (641 to 971) | OR 1.00 (0.23 to 4.36) | 70 | ⊕⊝⊝⊝ | 0 fewer women, per 1000, with traditional sling (245 fewer to 86 more) |
| Repeat surgery for urinary incontinence | not reported | |||||
| Perioperative surgical complications ‐ bladder perforation | 0 per 1000 | 0 per 1000 (0 to 0) | RR 3 (0.13 to 71.22) | 70 | ⊕⊝⊝⊝ | |
| Long‐term adverse effects | not reported | |||||
| Condition‐specific quality of life IIQ | Mean IIQ score in the control group was 42.7 | Mean condition‐specific quality of life score in the intervention groups was 50.2 higher (2.23 higher to 12.77 higher) | 70 | ⊕⊝⊝⊝ | Based on mean IIQ score, quality of life was worse in the traditional sling group compared with the mini‐sling group | |
| *The basis for the assumed risk (e.g. the median control group risk across studies) is provided in footnotes. The corresponding risk (and its 95% confidence interval) is based on the assumed risk in the comparison group and the relative effect of the intervention (and its 95% CI). | ||||||
| GRADE Working Group grades of evidence. | ||||||
| aDowngraded two levels due to very serious risk of bias: unclear randomisation and inadequate blinding. bDowngraded two levels due to very serious imprecision: single trial, small sample size, wide 95% confidence intervals. | ||||||
| One type of traditional sling operation versus another type of traditional sling operation | ||||||
| Patient or population: women with urinary incontinence | ||||||
| Outcomes | Illustrative comparative risks* (95% CI) | Relative effect | Number of participants | Quality of the evidence | Comments | |
| Assumed risk | Corresponding risk | |||||
| Another type of traditional sling | One type of traditional sling | |||||
| Number of continent (dry) women (any definition) in the medium term (1 to 5 years) | Not estimable | 749 | ⊕⊝⊝⊝ | Results not pooled (Analysis 11.2) | ||
| Repeat surgery for urinary incontinence at first year Fascial sling vs Pelvicol sling | 196 per 1000 | 8 per 1000 (0 to 119) | RR 0.04 (0.00 to 0.61) | 113 | ⊕⊕⊝⊝2 | 188 fewer women, per 1000, with fascial sling (0 fewer to 76 fewer) (Analysis 11.4 |
| Perioperative surgical complications | Not estimable | 239 | ⊕⊝⊝⊝ | Results not pooled (Analysis 11.14) | ||
| Long‐term adverse effects | Not estimable | 421 | ⊕⊝⊝⊝ | Results not pooled (Analysis 11.23) | ||
| Condition‐specific quality of life | Not estimable | 282 | ⊕⊝⊝⊝ | Results not pooled* (Analysis 11.25) | ||
| *The basis for the assumed risk (e.g. the median control group risk across studies) is provided in footnotes. The corresponding risk (and its 95% confidence interval) is based on the assumed risk in the comparison group and the relative effect of the intervention (and its 95% CI). | ||||||
| GRADE Working Group grades of evidence. | ||||||
| 1Downgraded two levels for imprecision (Analysis 11.2) and two levels for heterogeneity, as the trials used different materials for the traditional sling procedure. 2Downgraded two levels for imprecision (Analysis 11.4) 3Downgraded one level for risk of bias (sequence generation was judged to be at low risk of bias in two of three trials and unclear in the third trial; allocation concealment was unclear in two of three trials). Blinding (performance bias and detection bias) was judged to be unclear (two of three) or high risk (one of three). Downgraded two levels for heterogeneity, as the trials used three different materials for the traditional sling procedure, and one level for inconsistency, as 95% CIs did not overlap (Analysis 11.14). 4Downgraded two levels for heterogeneity, as the trials used four different materials for the traditional sling procedure, and one level for imprecision, as the 95% CIs were very wide (Analysis 11.23). 5Downgraded two levels for heterogeneity, as the trials used three different materials for the traditional sling procedure, and one level for inconsistency, as 95% CIs did not overlap (Analysis 11.25). * Data from two other trials were identified and are reported narratively in the text. These two trials did not report their data in a form suitable for meta‐analysis | ||||||
Antecedentes
Descripción de la afección
La incontinencia urinaria (IU) en las mujeres es una afección angustiosa que influye en el bienestar físico, psicológico y social de los individuos afectados, con un impacto considerable en las mujeres, los cuidadores y los servicios de salud (NICE 2013). La prevalencia de la incontinencia urinaria varía ampliamente en los distintos estudios debido a las diferencias en la definición y la población, pero oscila entre el 8% y el 45%, siendo la incontinencia urinaria de esfuerzo el tipo más común (Agarwal 2017). La prevalencia de la incontinencia urinaria aumenta con la edad, la paridad, el tabaquismo y el índice de masa corporal (IMC) (Amaral 2015; Lasserre 2009).
La International Continence Society define la incontinencia urinaria como la pérdida involuntaria de orina (Haylen 2010). La incontinencia (urinaria) de esfuerzo (IUE) se define como la pérdida involuntaria de orina al realizar un ejercicio o un esfuerzo físico (por ejemplo, actividades deportivas) o al estornudar o toser (Haylen 2010). Se reconocen dos mecanismos para la incontinencia de esfuerzo: la hipermovilidad o el desplazamiento significativo de la uretra y el cuello de la vejiga durante el esfuerzo, y la deficiencia intrínseca del esfínter uretral (Blaivas 1988). Entre las mujeres, estos mecanismos pueden coexistir (O'Donnell 1994). Pocos ensayos clínicos han distinguido entre las dos afecciones, probablemente debido a que hasta la fecha no se dispone de ninguna prueba estandarizada y validada (Abrams 2006; Blaivas 1988; McGuire 1993; McGuire 2004), y no están definidas por una terminología reconocida (Haylen 2010). Las mujeres cuya incontinencia puede deberse a cualquiera de estos dos mecanismos se considerarán conjuntamente en esta revisión.
El diagnóstico de la incontinencia urodinámica de esfuerzo requiere una investigación urodinámica para excluir la hiperactividad del detrusor, además de la toma de antecedentes, el examen físico, el uso de gráficos de frecuencia/volumen y el análisis de orina. Algunos autores del estudio han descrito a mujeres que solo tienen síntomas de incontinencia de esfuerzo (diagnóstico realizado de acuerdo a la evaluación clínica sin urodinámica). Las mujeres con incontinencia de esfuerzo, con y sin investigación urodinámica, serán incluidas en esta revisión.
La incontinencia urinaria de urgencia (IUU) es el síntoma de una pérdida involuntaria de orina acompañada o precedida inmediatamente por un fuerte deseo repentino (urgencia) de orinar que es difícil de retrasar. La mujer tiene una sensación de urgencia debido a que la vejiga se contrae demasiado. La hiperactividad del detrusor (HD) es un diagnóstico urodinámico caracterizado por la aparición de contracciones involuntarias del detrusor (músculo de la vejiga). Cuando se conoce una causa neurológica, se utiliza el término hiperactividad neurogénica del detrusor. La hiperactividad idiopática del detrusor denota la ausencia de alguna causa identificada (Haylen 2010). Las mujeres con estos síntomas y el diagnóstico urodinámico de hiperactividad del detrusor se incluirán en la revisión solo si presentan incontinencia urinaria de esfuerzo coexistente y predominante (incontinencia urinaria mixta [IUM]).
Las mujeres con incontinencia mixta incluidas en esta revisión tendrán síntomas de incontinencia urinaria de esfuerzo y de urgencia (diagnosticada clínicamente), o incontinencia urodinámica de esfuerzo e hiperactividad del detrusor (diagnosticada mediante urodinámica).
La incontinencia urinaria de esfuerzo está asociada a diversos costes económicos directos e indirectos. Por ejemplo, un estudio realizado en los Estados Unidos encontró que las mujeres que estaban a punto de ser sometidas a una cirugía de Burch o con cabestrillo de fascia para la IUE tenían un coste promedio de bolsillo (para suministros, lavandería y limpieza en seco) equivalente a 19 dólares (DE = 30) por semana en términos actuales (dólares de 2019; convertidos a partir de dólares de 2012 ‐ Shemilt 2010 ‐ al inicio) (Subak 2014). Las mujeres que participaron en este estudio tenían una edad promedio de 53 años (DE = 10) y una frecuencia inicial promedio (media) de episodios de IU de 23 por semana (DE = 21); el 48% había sido sometida a tratamiento no quirúrgico previo para la IU; y el 16% había sido sometida a cirugía previa para la IU. Otro estudio estimó que en un solo año (2012), solo en España, se perdió un total nacional de más de 350 000 años de vida ajustados por calidad entre las mujeres a partir de 60 años debido a la IU (Villoro 2016).
Descripción de la intervención
Los tratamientos para la IUE incluyen intervenciones conservadoras, mecánicas, farmacológicas y quirúrgicas.
-
El tratamiento conservador se centra en métodos físicos que incluyen el entrenamiento muscular del suelo pelviano, estimulación eléctrica, biorretroalimentación y uso de conos vaginales con peso.
-
Existen dispositivos mecánicos que evitan o reducen la pérdida urinaria, como tapones metálicos/parches y dispositivos insertados en la uretra o la vagina.
-
Se pueden utilizar tratamientos farmacológicos, principalmente estrógenos y con menos frecuencia agentes alfa‐adrenérgicos. Por lo general, se realiza un ensayo del tratamiento conservador antes de realizar la cirugía.
Estas intervenciones son el tema de otras revisiones Cochrane.
Por lo general, los procedimientos quirúrgicos para remediar la incontinencia de esfuerzo tienen como objetivo elevar y soportar la salida del cuello de la vejiga (unión uretrovesical). Sin embargo, existe desacuerdo con respecto al mecanismo preciso mediante el cual se logra la incontinencia. La elección del procedimiento suele ser influenciada por problemas coexistentes, las preferencias de los cirujanos o las mujeres y las características físicas de la persona afectada.
Se han descrito numerosos métodos quirúrgicos, pero básicamente corresponden a nueve categorías:
-
Suspensión abdominal retropúbica abierta (p.ej., colposuspensión [Burch], Marshall‐Marchetti‐Krantz [MMK]) (Lapitan 2017).
-
Suspensión retropúbica laparoscópica (Dean 2017).
-
Reparación vaginal anterior (colporrafía anterior) (Glazener 2017a).
-
Cabestrillos suburetrales tradicionales (revisión actual).
-
Cabestrillos mediouretrales (cintas retropúbicas o transobturadoras) (Ford 2017).
-
Cabestrillos de una única incisión (minicabestrillos) (Nambiar 2017).
-
Suspensiones con agujas del cuello de la vejiga (Glazener 2017b).
-
Inyecciones periuretrales (Kirchin 2017).
-
Esfínteres artificiales.
Esta revisión se concentrará en las operaciones con cabestrillos suburetrales tradicionales.
De qué manera podría funcionar la intervención
El objetivo de la operación con cabestrillo suburetral es restablecer o mejorar el apoyo uretral del paciente durante los movimientos bruscos, como los asociados con la tos o los estornudos. Lo anterior se logra elevando y apoyando la unión uretrovesical con material autólogo o sintético. Una operación con cabestrillos suburetrales tradicionales requiere un abordaje abdominal y vaginal combinado. Las tiras de material se canalizan bajo la uretra y se fijan al músculo del recto o a los ligamentos ileopectineales. Los materiales utilizados para los cabestrillos pueden ser biológicos o sintéticos.
Los materiales biológicos autólogos incluyen la fascia rectal, la fascia lata, el músculo pubococcígeo, la pared vaginal, la aponeurosis y la fascia piramidal. Los materiales biológicos exógenos incluyen fascia de buey y dermis porcina (Pelvicol). Los materiales sintéticos incluyen Teflón, cinta de Mersilene en un tubo de silicio, liodura, politetrafluoroetileno (Goretex), malla de Marlex y Silástico.
Una modificación del procedimiento con cabestrillo suburetral es la malla de polipropileno sintético mediouretral «mínimamente invasiva» (cabestrillo/cinta) aplicada por vía retropúbica o transobturador. En esta operación se introduce una cinta bajo la uretra media con trocares pero sin fijación de los extremos libres de la cinta. Este procedimiento puede realizarse con el paciente bajo anestesia general o local (Smith 2002). Estos procedimientos han sido considerados en una revisión Cochrane separada (Ford 2017). En esta revisión solo se incluyen las operaciones con cabestrillos tradicionales que utilizan un enfoque abdominal abierto y la fijación con suturas.
Por qué es importante realizar esta revisión
La amplia variedad de tratamientos quirúrgicos para la incontinencia urinaria sugiere una falta de consenso sobre cuál es el mejor procedimiento. Es probable que la evidencia más sólida provenga de la consideración de todos los ensayos controlados aleatorizados (ECA) bien diseñados. Por consiguiente, se necesita una revisión sistemática exhaustiva, de fácilmente acceso y actualizada periódicamente de dichos ensayos para identificar la práctica óptima y poner de relieve las brechas en la base de evidencia. Las conclusiones de esta revisión, tomadas en contexto con los hallazgos de otras revisiones de la cirugía para la continencia, proporcionarán a las mujeres y a sus cuidadores la evidencia más sólida disponible para que puedan tomar una decisión informada sobre la conveniencia de ser sometidas a una cirugía y, en caso afirmativo, de qué tipo.
Objetivos
Evaluar la efectividad de los procedimientos tradicionales con cabestrillos suburetrales para el tratamiento de la incontinencia urinaria de esfuerzo en las mujeres; y resumir los hallazgos principales de las evaluaciones económicas pertinentes.
Métodos
Criterios de inclusión de estudios para esta revisión
Tipos de estudios
Ensayos controlados aleatorizados o cuasialeatorizados de mujeres con incontinencia de esfuerzo (diagnóstico urodinámico) o síntomas de incontinencia urinaria de esfuerzo o mixta (diagnóstico clínico), en los que al menos un brazo del ensayo incluyera procedimientos con cabestrillos suburetrales tradicionales.
Tipos de participantes
Mujeres adultas con IUE causada por hipermovilidad o deficiencia intrínseca del esfínter, diagnosticadas clínicamente o con urodinámica, o con incontinencia urinaria mixta. La clasificación de los diagnósticos se aceptó tal como la definieron los autores de los ensayos.
Tipos de intervenciones
Al menos un brazo del estudio debía incluir procedimientos con cabestrillos suburetrales tradicionales para tratar la incontinencia urinaria de esfuerzo o mixta. Las intervenciones de comparación pueden incluir otras técnicas quirúrgicas e intervenciones no quirúrgicas. Se realizaron las siguientes comparaciones para los procedimientos con cabestrillos suburetrales tradicionales (abdominales y vaginales).
-
Operación con cabestrillo suburetral tradicional frente a ningún tratamiento o cirugía simulada.
-
Operación con cabestrillo suburetral tradicional frente al tratamiento conservador (por ejemplo, entrenamiento de los músculos del suelo pelviano, estimulación eléctrica, conos, biorretroalimentación).
-
Operación con cabestrillo suburetral tradicional frente a los fármacos.
-
Operación con cabestrillo suburetral tradicional frente a los inyectables.
-
Operación con cabestrillo suburetral tradicional frente a la reparación anterior.
-
Operación con cabestrillo suburetral tradicional frente a la suspensión con agujas del cuello de la vejiga (abdominal y vaginal).
-
Operación con cabestrillo suburetral tradicional frente a la colposuspensión retropúbica abdominal abierta.
-
Operación con cabestrillo suburetral tradicional frente a la colposuspensión laparoscópica.
-
Operación con cabestrillo suburetral tradicional frente a un cabestrillo o cinta mediouretral.
-
Operación con cabestrillo suburetral tradicional frente a un cabestrillo de una única incisión (minicabestrillo).
-
Un tipo de operación con cabestrillo tradicional frente a otro tipo de operación con cabestrillo tradicional.
Tipos de medida de resultado
Las medidas de resultado utilizadas en esta revisión se seleccionaron sobre la base de su pertinencia para la resolución clínica o la mejoría de la incontinencia. Se considera que las medidas de eficacia principales son la proporción de mujeres cuya incontinencia se resolvió después de la cirugía y la proporción de mujeres con una mejoría en la incontinencia.
Resultados primarios
-
Incontinencia urinaria
-
Número de mujeres continentes (sin pérdidas) a corto plazo (menos de 12 meses), a plazo medio (de uno a cinco años) y a largo plazo (más de cinco años) según la definición de los informes de las mujeres, las medidas cuantificadas, las observaciones de los médicos o las medidas combinadas (según la definición de los autores de los ensayos; Tabla 1)
-
Número de mujeres que han sido sometidas a una cirugía de continencia repetida
-
Resultados secundarios
-
Observaciones de las pacientes
-
Número de mujeres con resolución al año o más tarde (observaciones de las mujeres)
-
Número de mujeres que mejoraron (con resolución o mejoría) a corto plazo (menos de 12 meses), a plazo medio (de uno a cinco años) y a largo plazo (más de cinco años)
-
Número de mujeres satisfechas
-
-
Cuantificación de los síntomas
-
Cambios de protectores absorbentes en 24 horas (a partir del número autoinformado de protectores absorbentes utilizados)
-
Episodios de incontinencia en 24 horas (a partir de un gráfico vesical completado por la paciente)
-
Prueba con protectores de las pérdidas cuantificadas (peso medio de la pérdida de orina)
-
-
Observaciones del médico
-
Número de mujeres con incontinencia urinaria (observación del médico) a corto plazo (menos de 12 meses), a plazo medio (de uno a cinco años) y a largo plazo (más de cinco años)
-
-
Medidas de resultado quirúrgicas
-
Duración de la operación
-
Duración de la estancia hospitalaria
-
Tiempo transcurrido hasta retomar al nivel normal de actividad
-
Pérdida de sangre
-
-
Tratamiento adicional
-
Número de mujeres que requieren tratamiento por prolapso de órganos pélvicos
-
-
Eventos adversos
-
Complicaciones quirúrgicas perioperatorias
-
Perforación vesical
-
Infecciones urinarias
-
Síntomas de urgencia urinaria, incontinencia urinaria de urgencia
-
Hiperactividad del detrusor (hiperactividad urodinámica)
-
Disfunción de la micción (con o sin confirmación urodinámica)
-
Efectos adversos a largo plazo como exposición de la malla, dolor pelviano, dispareunia o liberación del cabestrillo
-
-
Calidad de vida
-
Medidas específicas de la afección para evaluar la calidad de vida (por ejemplo, cuestionario Bristol Female Lower Urinary Tract Symptoms [BFLUTS]) (Jackson 1996)
-
Medidas del estado de salud general (p.ej. el Short Form 36 [Ware 1993]).
-
Resultados principales de las tablas de "Resumen de resultados"
Se adoptaron los criterios GRADE para evaluar la calidad de la evidencia de los siguientes cinco resultados:
-
Número de mujeres continentes (sin pérdidas) (cualquier definición) a plazo medio (1 a 5 años)
-
Cirugía repetida para la incontinencia urinaria.
-
Complicaciones quirúrgicas perioperatorias.
-
Efectos adversos a largo plazo como exposición de la malla, dolor y dispareunia.
-
Calidad de vida específica de la afección.
Definición de resolución e incontinencia urinaria
Luego del debate, los autores de la revisión acordaron añadir otro resultado: el informe de las mujeres sobre la resolución de la incontinencia urinaria. Se identificaron las definiciones de resolución e incontinencia utilizadas en cada uno de los ensayos incluidos (Tabla 1). Sin embargo, solo 14 ensayos utilizaron el informe de las mujeres sobre la resolución o la incontinencia para determinar la resolución. En el resto se utilizaron métodos cuantitativos (como si los protectores estaban húmedos o secos, las puntuaciones del cuestionario o los diarios) (siete ensayos), las pérdidas de orina observadas o comunicadas por el médico (11 ensayos) o una definición combinada sin un informe de los elementos por separado (10 ensayos). Algunos ensayos informaron sobre la incontinencia en más de un sentido. Por lo tanto, se decidió utilizar como resultado primario el número de mujeres continentes (sin pérdidas), con cualquier método utilizado para medir o informar sobre la incontinencia urinaria, pero se añadió el resultado adicional de la «resolución» según lo informado por las mujeres a los 12 meses o más tarde.
Métodos de búsqueda para la identificación de los estudios
We did not impose language or other restrictions on any of these searches.
Búsquedas electrónicas
Search for clinical effectiveness studies
We drew on the search strategy developed for Cochrane Incontinence. We identified relevant trials from the Cochrane Incontinence Specialised Register. For more details of the search methods used to build the Specialised Register, please see the Group's webpages, where details of the Register's development (from inception) and of the most recent searches performed to populate the Register can be found. To summarise, the Register contains trials identified by searching the Cochrane Central Register of Controlled Trials (CENTRAL), MEDLINE, MEDLINE In‐Process, MEDLINE Epub Ahead of Print, the Cumulative Index to Nursing and Allied Health Literature (CINAHL), ClinicalTrials.gov, and WHO ICTRP, and by handsearching journals and conference proceedings. Many of the trials in the Cochrane Incontinence Specialised Register are also contained in CENTRAL.
The date of the last fully incorporated search was 27 February 2017.
A further updated search was conducted on 23 January 2019, the results of which were not fully incorporated into the review.
The terms used to search the Cochrane Incontinence Specialised Register are given in Appendix 1.
For previous versions of this review, one of the review authors performed extra literature searches. These are described in Appendix 2.
Search for economic evaluations
We performed additional searches of the following databases for the brief economic commentary (BEC).
-
MEDLINE on Ovid SP (1 January 1946 to week 5 July 2018), searched on 10 August 2018.
-
Embase on Ovid SP (1 January 1980 to week 32 2018), searched on 10 August 2018.
-
National Health Service Economic Evaluation Database (NHS EED) on Ovid SP (first quarter 2016), searched on 6 April 2017 (this database is no longer updated by the producer).
Search strategies used for the BEC are given in Appendix 3.
Búsqueda de otros recursos
We searched the reference lists of relevant articles for other possibly relevant trials.
Obtención y análisis de los datos
Selección de los estudios
At least two review authors evaluated the appropriateness of including reports of all possibly eligible studies without prior consideration of the results. We retrieved the reports of potentially eligible trials in full. We resolved any differences of opinion by discussion between the review authors.
Extracción y manejo de los datos
At least three review authors undertook data extraction independently using a standard form containing pre‐specified outcomes. When data may have been collected but not reported, we sought clarification from the trialists.
Any differences of opinion related to study inclusion, data extraction, or risk of bias assessment were resolved by discussion among the review authors and, when necessary, were referred to a fourth review author for arbitration. We conducted the review using the standard Cochrane RevMan software.
Evaluación del riesgo de sesgo de los estudios incluidos
Each review author independently assessed risk of bias using Cochrane's 'Risk of bias' tool as described in the Cochrane Handbook for Systematic Reviews of Interventions (Higgins 2011). The following questions were assessed and reported in the 'Risk of bias' tables.
-
Was the random sequence adequately generated (selection bias)?
-
Was allocation adequately concealed (selection bias)?
-
Were the participants or caregivers (performance bias) or outcome assessors (detection bias) blinded?
-
Were incomplete outcome data adequately addressed (attrition bias)?
We judged studies to be at low risk of bias if the method of blinding was adequate, or if lack of blinding could not have affected the results or could not be avoided. Each element was assessed as having low risk, high risk, or unclear risk of bias (the latter usually when no information was supplied).
Medidas del efecto del tratamiento
When appropriate, we calculated a combined estimate of treatment effect across similar studies for each pre‐specified outcome, using risk ratios (RRs) for dichotomous data and mean differences (MDs) for continuous outcomes, along with 95% confidence intervals (CIs) when possible. For categorical (dichotomous) outcomes, the numbers reporting an outcome were related to the numbers at risk in each group to derive a risk ratio (RR). We have, however, used the odds ratio (OR) when reporting the number of continent or cured women, as event rates were expected to be high. For continuous variables, we used means and standard deviations to derive a mean difference (MD). We undertook a fixed‐effect approach to the analysis unless we noted evidence of heterogeneity across studies.
Cuestiones relativas a la unidad de análisis
We analysed studies with multiple treatment groups by treating each pair of arms as a separate comparison, as appropriate. Studies based on a non‐standard design, such as cross‐over trials and cluster‐randomised trials, would have been analysed as described in the Cochrane Handbook for Systematic Reviews of Interventions (Higgins 2011).
Manejo de los datos faltantes
We included data as they were reported. If women's subjective reporting of (cure of) urinary incontinence was not provided, we used the objective clinician's observations or other measures of urine leakage as surrogate data to maximise information available for the primary outcome ‐ the number of continent (dry) women (Table 1 shows data used). We did not contact authors of trials for missing data or further details for this version of the review.
Evaluación de la heterogeneidad
We investigated differences between trials when apparent from visual inspection of the results, or when statistically significant heterogeneity was demonstrated, by using the Chi² test at the 10% probability level or assessment of the I² statistic (Higgins 2003). If we found no obvious reason for the heterogeneity (after consideration of populations, interventions, outcomes, and settings of individual trials), or if heterogeneity persisted despite removal of outlying trials, we used a random‐effects model.
Evaluación de los sesgos de notificación
We would have examined publication bias through a funnel plot if 10 or more studies had been included in a meta‐analysis.
Síntesis de los datos
We sought data on the number of participants with each outcome event by allocated treated group, irrespective of compliance and whether or not the participant was later thought to be ineligible or otherwise excluded from treatment or follow‐up, to allow an intention‐to‐treat (ITT) analysis when possible. We defined an ITT analysis to mean that all participants were analysed in their randomised groups whether or not they received the allocated intervention. We used the Mantel‐Haenszel statistical method for meta‐analysis. We used a fixed‐effect approach to the analysis, unless we found evidence of heterogeneity across studies, in which case we adopted a random‐effects model. We used a narrative review of eligible studies when statistical synthesis of data from than one study was not possible or was considered not appropriate.
Análisis de subgrupos e investigación de la heterogeneidad
We grouped trial data by type of incontinence: urodynamic stress incontinence based on a urodynamic diagnosis, or stress or mixed urinary incontinence based on symptom classification. It is unclear whether there is a clinical difference between women who had SUI alone (diagnosed by urodynamics to exclude concomitant detrusor contractions, which might be indicative of overactive bladder or urgency urinary incontinence) and women whose diagnosis of SUI was based on their report of symptoms alone. Women who have MUI (stress plus urgency) may have a worse outcome than those with SUI alone. We wished to explore whether different interventions had a differential effect among women with different types of incontinence. Quantitative synthesis was done when more than one eligible study was identified.
We also planned to examine whether findings would vary among women with primary versus recurrent SUI, or with presence or absence of prolapse, but this was not possible due to lack of information provided by the included trials.
In addition, we examined whether biological materials were associated with different outcomes compared with synthetic materials used for traditional sling arms in a separate comparison (comparison 11). It is biologically feasible that biological materials might be reabsorbed by the body tissues and thus might not be as long‐lasting as non‐absorbable synthetic materials.
Análisis de sensibilidad
We would have carried out sensitivity analysis based on eligibility criteria, such as by including and excluding results from abstract‐only publications or quasi‐randomised trials, if we had identified enough trials.
'Summary of findings' tables and assessing the quality of evidence
The GRADE Working Group strongly recommends including up to seven outcomes in 'Summary of findings' tables in a systematic review (Guyatt 2011a; Guyatt 2011b; Guyatt 2013a; Guyatt 2013b). We classified the primary and secondary outcomes in the Types of outcome measures as 'critical', 'important', or 'not important' for decision‐making from the patient's perspective, and we used this hierarchy to decide which outcomes should be included in the 'Summary of findings' tables. We also made judgements about which adverse events may be important to patients.
We implemented the GRADE method for assessing the quality of evidence.
Incorporating economics evidence
Following the search outlined under Search methods for identification of studies, we developed a brief economic commentary (BEC) to summarise the availability and principal findings of full economic evaluations that compare traditional sling operations for urinary incontinence in women (Shemilt 2019). This BEC encompasses full economic evaluations (i.e. cost‐effectiveness analyses, cost‐utility analyses, and cost‐benefit analyses), conducted alongside or based upon one or more RCTs included in the main review of intervention effects. This commentary focuses on the extent to which principal findings of eligible economic evaluations indicate that an intervention might be judged favourably or unfavourably from an economic perspective when implemented in different settings.
Results
Description of studies
Results of the search
We screened a total of 582 records produced by the literature search for this fourth update and retrieved 167 full‐text articles that appeared to meet the eligibility criteria for this review. After assessing the full‐text articles, we identified 115 reports of 34 included studies and 50 reports of 38 excluded studies. Additionally, we found reports of two ongoing studies (Hilton 2000; Zhu 2014). The flow of literature through the assessment process can be seen in Figure 1.

PRISMA study flow diagram ‐ search for clinical effectiveness studies.
For this update, eight new trials were included (Abouhashem 2014; Al‐Azzawi 2014; Choe 2000; Helmy 2012; Okulu 2013; Sharifiaghdas 2015; Teleb 2011; Zargham 2013). A further four have been updated with new information (Albo 2007; Amaro 2007; Guerrero 2008; Wadie 2005). In total, the review now contains 34 included trials, 38 excluded trials, and two ongoing studies.
A further updated search of the Cochrane Incontinence Specialised Register was conducted on 23 January 2019. This search was not fully incorporated into the review. A total of 28 records retrieved by the search were screened. Four reports of trials were eligible for inclusion in the review ‐ for transparency, all four eligible reports have been added to Studies awaiting classification, and details can be found under Characteristics of studies awaiting classification. In brief, the authors of Sharifiaghdas 2008 published a 10‐year update in 2017, but the data have not yet been added to the review (Sharifiaghdas 2017). Abou Hashem 2017 served as another report of the already included study (Abouhashem 2014); however, this appears to be exactly the same conference abstract as the one included study report (also a conference abstract); no new details or data are available in this additional report. Two new ongoing studies were also identified (Hassan 2018; Kajbafzadeh 2017), but their data have not yet been added to the review.
Our search for economic evaluations produced a total of 465 titles and abstracts to be screened, from which we selected four reports of three economic evaluations for further assessment (Berman 1997; Kilonzo 2004; Kumar 2017). The flow of literature through the assessment process is shown in Figure 2.

PRISMA study flow diagram ‐ search for economic evaluations for the BEC.
Included studies
We included a total of 34 RCTs, reporting data on outcomes of 3244 women, with sample sizes ranging from 20 to 655 participants. Three trials are quasi‐randomised (Choe 2000; Kondo 2006; Zargham 2013), and two are multi‐arm trials (Bai 2005; Guerrero 2008). With the exception of Albo 2007 and Sand 2000, the included trials were small and had short follow‐up.
Participants
Inclusion criteria were not always clearly defined. Ten trials included women (some or all) with stress‐predominant MUI, both stress and urgency (Al‐Azzawi 2014; Barbalias 1997; Basok 2008; Kondo 2006; Okulu 2013; Osman 2003; Sand 2000; Song 2004; Teleb 2011; Zargham 2013). Two trials involved women with self‐reported or predominant SUI (Albo 2007; Wadie 2005). All others were restricted to women with a urodynamic diagnosis of stress incontinence (USI, previously known as genuine stress incontinence). Data from two trials were insufficient, with only abstracts available (Abouhashem 2014; Helmy 2012). All trials included both pre‐menopausal and postmenopausal women, but none included women who were treated with hormone replacement therapy. One study was restricted to women with vaginal narrowing due to atrophic vaginitis or previous surgical scars (Hilton 1989).
Previous continence surgery status
Two trials included only women without previous interventions for incontinence (Henriksson 1978; Silva Filho 2006), and another included only women who had recurrent incontinence after a previous vaginal hysterectomy and at least one anterior repair (Enzelsberger 1996). The others included women with both primary and recurrent SUI but did not report outcome data separately according to previous continence surgery.
Presence or absence of pelvic organ prolapse
This information was not routinely reported in the included trials, and when it was, data were not reported separately.
Interventions
Fifteen materials were used for the traditional sling procedure across 34 studies.
Autologous biological materials
-
Autologous dermal graft patch (Shin 2001)
-
Autologous fascia lata (Song 2004)
-
Autologous rectus fascia (Abouhashem 2014; Al‐Azzawi 2014; Albo 2007; Amaro 2007; Bai 2005; Barbalias 1997; Demirci 2001; Guerrero 2008; Helmy 2012; Kondo 2006; Lucas 2000; Maher 2005; Osman 2003; Pacetta 2005; Sharifiaghdas 2008; Sharifiaghdas 2015; Silva Filho 2006; Tcherniakovsky 2009; Teleb 2011; Viseshsindh 2003; Wadie 2005)
-
Autologous vaginal wall sling (Choe 2000; Teleb 2011; Viseshsindh 2003; Zargham 2013)
Other biological materials
-
Cadaveric fascia lata (Basok 2008; Shin 2001)
-
Fortaperm (Pacetta 2005)
-
Lyphohilised dura matter (Enzelsberger 1996)
-
Porcine dermis, also known as Pelvicol (Arunkalaivanan 2003; Guerrero 2008; Hilton 1989, Teixeira 2008)
Synthetic non‐absorbable materials
-
Goretex sling operation (Barbalias 1997)
-
Polytetrafluoroethylene ‐ PTFE (Sand 2000)
-
Polytetrafluoroethylene impregnated with silver diacetate and chlorhexidine; Antimicrobial Mycromesh (Choe 2000)
-
Teflon sling (Henriksson 1978)
-
Ultrapro mesh: synthetic monofilament combined mesh, non‐absorbable with absorbable coating (Okulu 2013)
-
Prolene or prolene light mesh (Okulu 2013; Teleb 2011)
-
Vypro mesh: semi‐absorbable multi‐filament mesh (Okulu 2013)
One trial, reported in abstract form, did not mention the type of material used for the suburethral sling (Fischer 2001).
Comparators
The 34 included trials reported the following comparisons.
-
One compared traditional suburethral sling operations with oxybutynin for treating women with mixed urinary incontinence (Osman 2003).
-
One compared traditional suburethral sling operations with suburethral injectable treatment (Maher 2005).
-
One compared traditional suburethral sling operations with bladder neck needle suspension (Hilton 1989).
-
Eight compared traditional suburethral sling operations with open abdominal retropubic colposuspension (Albo 2007; Bai 2005; Demirci 2001; Enzelsberger 1996; Fischer 2001; Helmy 2012; Henriksson 1978; Sand 2000). There were no useable data in one of the trials identified in the updated search (Helmy 2012), and one trial was updated with new information (Albo 2007).
-
Fifteen trials compared traditional suburethral sling operations with mid‐urethral sling operations (Abouhashem 2014; Al‐Azzawi 2014; Amaro 2007; Arunkalaivanan 2003; Bai 2005; Basok 2008; Guerrero 2008; Kondo 2006; Sharifiaghdas 2008; Silva Filho 2006; Song 2004; Tcherniakovsky 2009; Teixeira 2008; Wadie 2005; Zargham 2013). Of these, three were added to this comparison in this version of the review (Abouhashem 2014; Al‐Azzawi 2014; Zargham 2013), but one did not provide any useable data (Abouhashem 2014). One trial did not provide data after the first week (Al‐Azzawi 2014), and further data were identified for three trials (Amaro 2007; Guerrero 2008; Wadie 2005).
-
One compared a traditional suburethral sling with a single‐incision sling (mini‐sling) (Sharifiaghdas 2015).
-
Nine trials compared one type of traditional suburethral sling with another (Barbalias 1997; Choe 2000; Guerrero 2008; Lucas 2000; Okulu 2013; Pacetta 2005; Shin 2001; Teleb 2011; Viseshsindh 2003). Of these, three are new to this comparison for this version of the review (Choe 2000; Okulu 2013; Teleb 2011), and one trial was updated with further data (Guerrero 2008).
No trials compared suburethral slings with anterior repair, laparoscopic retropubic colposuspension, or artificial sphincters.
There were seven non‐traditional sling comparators across 25 studies.
-
Anticholinergic (Osman 2003).
-
Intravaginal slingplasty (Basok 2008).
-
Mid‐urethral sling (Abouhashem 2014; Al‐Azzawi 2014; Amaro 2007; Arunkalaivanan 2003; Bai 2005, Guerrero 2008; Kondo 2006; Sharifiaghdas 2008; Silva Filho 2006; Song 2004; Tcherniakovsky 2009; Teixeira 2008; Wadie 2005; Zargham 2013).
-
Retropubic colposuspension: Burch colposuspension (Albo 2007; Bai 2005; Demirci 2001; Enzelsberger 1996; Fischer 2001; Helmy 2012; Osman 2003; Sand 2000); Marshall‐Marchetti‐Krantz (Henriksson 1978).
-
Stamey bladder neck (needle) suspension (Hilton 1989).
-
Transurethral Macroplastique (injectable material) (Maher 2005).
-
Single‐incision sling (mini‐sling) (Sharifiaghdas 2015).
One trial was designed to study an anticholinergic agent (oxybutynin) in comparison with surgery (Burch or sling) for women with MUI (Osman 2003). It was possible to extract only the data from sling surgery in comparison with medical treatment for inclusion in the analysis.
Outcome measures (definition of incontinence)
Outcome measures were not reported in a standardised fashion (Table 1).
-
Fourteen trials used women's self‐report of cure or absence of incontinence to define urinary incontinence.
-
Seven trials used quantitative methods (such as based on wet or dry pads, questionnaire scores, or diaries).
-
Eleven trials used clinician‐observed or ‐reported urine leakage (such as the stress test, or at urodynamics).
-
Ten trials used a combined definition without reporting the elements separately.
The primary outcome was the number of continent (dry) women using at least one of these definitions of urine leakage (32/34 trials). If woman‐reported leakage alone or clinician‐observed leakage was reported separately, those were also reported in separate outcomes. Only two trials did not report any measure of urine leakage (Al‐Azzawi 2014; Teixeira 2008).
Follow‐up
Trials varied in their reports of initial and long‐term follow‐up, reporting data on outcomes of 3244 women at last follow‐up.
-
Ten trialists presented their results at three‐ and/or six‐ and/or nine‐month assessment (Bai 2005; Choe 2000; Fischer 2001; Henriksson 1978; Osman 2003; Silva Filho 2006; Sand 2000; Song 2004; Teleb 2011; Viseshsindh 2003).
-
One trial followed up women to one year and beyond but did not provide any outcome data after the first week, such that cure data were not useable (Al‐Azzawi 2014).
-
Eleven trials presented follow‐up at around one year (Arunkalaivanan 2003; Basok 2008; Demirci 2001; Guerrero 2008; Lucas 2000; Maher 2005; Pacetta 2005; Sharifiaghdas 2008; Sharifiaghdas 2015; Shin 2001; Tcherniakovsky 2009).
-
Eleven trials described follow‐up between one and five years (Albo 2007; Amaro 2007; Arunkalaivanan 2003; Barbalias 1997; Enzelsberger 1996; Hilton 1989; Kondo 2006; Okulu 2013; Teixeira 2008; Wadie 2005; Zargham 2013).
-
Three trials have now reported data on the outcomes of 892 women at the last follow‐up at five years or later (Albo 2007; Guerrero 2008; Sand 2000).
For more details about the characteristics of these trials, please see Characteristics of included studies.
Excluded studies
In total, 38 studies were excluded. For further details, please see Characteristics of excluded studies.
-
Seventeen trials compared mid‐urethral or variant sling procedures with each other or with other operations (Amat 2007; Chong 2003; Corcos 2001; Darai 2007; Gamble 2010; Halaska 2001; Han 2001; Kocjancic 2008; Liapis 2002; Lim 2005; Naumann 2006; Oremus 2010; O'Sullivan 2000; Palomba 2008; Seo 2007; Ward 2002a; Yoo 2007). Mid‐urethral sling and open colposuspension procedures are considered in other Cochrane Reviews (Ford 2017; Lapitan 2017).
-
Eleven studies were not randomised (Atherton 2000; Brandt 2009; Bruschini 2005; Debodinance 1994; Giri 2004; Giri 2006; Hung 2001; Ishenko 1999; Kuo 2001; Obrink 1978; Schostak 2001).
-
There was uncertainty regarding the population included in two trials (Aurunkalaivanan 2001; Barrington 2003).
-
Five trials included some participants who did not have SUI (Debodinance 1993; Goldberg 2001; Kwon 2002; Meschia 2001; Trezza 2001).
-
Three trials were excluded for other reasons: Choe 2001 randomised women to having urodynamic evaluation or not; Wang 1999 randomised women to different types of anaesthetic; Lemieux 1991 compared clamping and non‐clamping of catheters after incontinence surgery.
Risk of bias in included studies
Risk of bias findings for the included trials are summarised in Figure 3 and Figure 4.

Risk of bias graph: review authors' judgements about each risk of bias item presented as percentages across all included studies.

Risk of bias summary: review authors' judgements about each risk of bias item for each included study.
Allocation
Adequate sequence generation
Eight trials used an adequate method of sequence generation (Al‐Azzawi 2014; Albo 2007; Amaro 2007; Barbalias 1997; Guerrero 2008; Okulu 2013; Osman 2003; Sand 2000). Two trials used randomisation charts to generate the randomisation sequence without providing further information about the process (Enzelsberger 1996; Hilton 1989). Nevertheless, these were judged to be adequate. In one of these trials, one woman was randomised to one arm of the study and was compared with two women randomised to the other intervention (Barbalias 1997).
Sequence generation was inadequate in three trials, which were therefore categorised as quasi‐randomised trials. Kondo 2006 used date of birth with even dates assigned to one group and odd dates to the other. In two trials, women were randomised in alternate fashion (Choe 2000; Zargham 2013).
In the remainder, women were stated to be randomised but no other details of the process were provided.
Allocation concealment
The reported method of concealment of randomisation was secure in seven trials (Albo 2007; Amaro 2007; Guerrero 2008; Lucas 2000; Okulu 2013; Sharifiaghdas 2015; Wadie 2005). Allocation concealment was unknown for most of the remaining trials, as study authors did not record it. Another trial used sealed opaque envelopes but made no mention of numbering and thus was judged as unclear for allocation concealment (Sharifiaghdas 2008).
Inadequate allocation concealment was noted in three quasi‐randomised trials (Kondo 2006; Choe 2000; Zargham 2013).
Blinding
Masking of women or surgeons was not reported in most trials, but this is difficult to achieve in surgical trials. Only two trials attempted or reported blinding of participants or care providers (Guerrero 2008; Wadie 2005). Third party outcome assessment was not performed in any of the trials.
Incomplete outcome data
Most trials had complete outcome data at follow‐up, or losses were evenly distributed between randomised groups, and this was unlikely to have a significant effect on the final analysis. Two trials did not account for losses at follow‐up, which might potentially have been a source of bias (Demirci 2001; Fischer 2001). One trial had a differential dropout at two years' follow‐up (Wadie 2005).
Other potential sources of bias
Comparability of groups at baseline
Baseline comparisons between groups were provided in 19 trials (Albo 2007; Arunkalaivanan 2003; Bai 2005; Basok 2008; Choe 2000; Demirci 2001; Enzelsberger 1996; Hilton 1989; Kondo 2006; Lucas 2000; Maher 2005; Okulu 2013; Sand 2000; Sharifiaghdas 2008; Song 2004; Tcherniakovsky 2009; Teleb 2011; Wadie 2005; Zargham 2013). Henriksson 1978 stated that the two groups were comparable without supplying data, and the remainder did not mention baseline comparisons between groups.
Although we did not formally assess 'selective reporting' or 'other bias' (other than comparability of groups at baseline, as above), we had no concerns for these two domains across studies.
Effects of interventions
See: Summary of findings for the main comparison Traditional suburethral sling operation versus no treatment or sham operation; Summary of findings 2 Traditional suburethral sling operation versus conservative management; Summary of findings 3 Traditional suburethral sling operation versus drugs; Summary of findings 4 Traditional suburethral sling operation versus injectables; Summary of findings 5 Traditional suburethral sling operation versus anterior repair; Summary of findings 6 Traditional suburethral sling operation versus bladder neck needle suspension (abdominal and vaginal); Summary of findings 7 Traditional suburethral sling operation versus open abdominal retropubic colposuspension; Summary of findings 8 Traditional suburethral sling operation versus laparoscopic colposuspension; Summary of findings 9 Traditional suburethral sling operation versus a mid‐urethral sling or tape; Summary of findings 10 Traditional suburethral sling operation versus a single‐incision sling (mini‐sling); Summary of findings 11 One type of traditional sling operation versus another traditional sling operation
Comparison 1. Traditional suburethral sling operation versus no treatment or sham operation
No trials were identified.
Comparison 2. Traditional suburethral sling operation versus conservative management
No trials were identified.
Comparison 3. Traditional suburethral sling operation versus drugs
One trial included 75 women with MUI treated with surgery (either Burch colposuspension (n = 24) or rectus fascia sling (n = 26)) or oxybutynin (an anticholinergic drug treatment for urinary incontinence, overactive bladder, and detrusor overactivity ‐ not for stress incontinence; n = 25)) (Osman 2003). The type of surgery was selected according to Valsalva leak point pressure (VLPP) ‐ those with VLPP of less than 90 cm of water had rectus fascia sling, and those with VLPP of more than 90 cm of water had Burch colposuspension.
Results for the surgically managed group were similar to those for the subgroup having slings. Due to small sample sizes, the data were too few to be reliable, and we therefore compared only data from oxybutynin versus sling patients in tables (Table 2).
| Comparison 3. Traditional suburethral sling operation versus drugs | |
| Osman 2003 included 75 women with mixed urinary incontinence treated with surgery (either Burch colposuspension (n = 24) or rectus fascia sling (n = 26)) or oxybutynin (an anticholinergic drug treatment for urinary incontinence, overactive bladder, and detrusor overactivity ‐ not for stress incontinence; n = 25) (Osman 2003). The type of surgery was selected according to Valsalva leak point pressure (VLPP) ‐ those with VLPP < 90 cm of water had rectus fascia sling, and those with VLPP > 90 cm of water had Burch colposuspension) Results for the surgically managed group were similar to those of the subgroup having slings. Due to small sample sizes, data were too few to be reliable; we therefore compared only data from oxybutynin versus sling patients provided in tables Primary outcomes Number of continent (dry) women Data suggest that, within the first year, women were significantly more likely to be continent after undergoing surgery with slings than after treatment with oxybutynin (20/24; 83% vs 0/21; OR 195.89, 95% CI 9.91 to 3871.03; n = 45; Analysis 3.1) Number of women who have repeat continence surgery Not reported Secondary outcomes Fewer women had persistent urgency urinary incontinence after traditional sling surgery (3/24; 13% vs 9/21; 43% with oxybutynin; RR 0.29, 95% CI 0.09 to 0.94; n = 45; Analysis 3.2) | |
| Comparison 4. Traditional suburethral sling operation vs injectables | |
| Maher 2005 compared slings (21) vs injectable Macroplastique (22) in 45 women. Due to the small size of the trial, the data were too few to be reliable Primary outcomes Number of continent (dry) women Short‐term: data from 1 small trial were too few to reliably identify evidence of a difference between traditional sling and injectables in the number of continent women within the first year (OR 2.79, 95% CI 0.48 to 16.33; n = 43; Maher 2005; Analysis 4.1) Medium‐term: Maher 2005 found no evidence of a difference between groups in the number of continent women after the first year (13/13; 100% continent with a traditional sling vs 10/14, 71% with the injectable; OR 11.57, 95% CI 0.56 to 239.74; n = 27; very low‐quality evidence; Analysis 4.2;summary of findings Table 4) Number of women who have repeat continence surgery We found no evidence of a difference between groups in the numbers of women having repeat surgery for urinary incontinence (1 after traditional sling vs 2 after injectable: RR 0.52, 95% CI 0.05 to 5.36; n = 43; very low‐quality evidence; Maher 2005; Analysis 4.3;summary of findings Table 4) Secondary outcomes Number of women cured at 1 year or later (women's observations) The trial was too small to reliably identify evidence of a difference between groups in the number of women cured after the first year (OR 11.57, 95% CI 0.56 to 239.74; n = 27; Analysis 4.4) Number of women improved Not reported Number of women satisfied Data from Maher 2005 were too few to identify a difference between groups in satisfaction rates at 6 months (P = 0.41) or at 5 years (RR 2.42, 95% CI 0.98 to 5.98; n = 27; Analysis 4.5) Quantification of symptoms Not reported Clinician's observations Data suggest there were more women with incontinence (clinician‐observed) within the first year with injectables compared with the traditional sling: 4/21 vs 20/22 (RR 0.21, 95% 0.09 to 0.21; n = 43; Maher 2005; Analysis 4.6) Surgical outcome measures Injectables were quicker to perform, involved shorter hospital stay and time to catheter removal, and led to quicker return to normal activity than after traditional sling surgery, but the data were not suitable for meta‐analysis (Maher 2005) Further treatment Not reported Adverse events Perioperative surgical complications Not reported Bladder perforation Not reported Urinary tract infection Maher 2005 reported no evidence of a difference between traditional slings and injectables in the numbers of women with urinary tract infection (RR 1.57, 95% CI 0.29 to 8.49; very low‐quality evidence; Analysis 4.7;summary of findings Table 4) Urinary urgency symptoms, urgency urinary incontinence Not reported Detrusor overactivity (urodynamic overactivity) Maher 2005 reported no evidence of a difference between traditional slings and injectables in the numbers of women with de novo detrusor overactivity (RR 3.14, 95% CI 0.13 to 72.96; Analysis 4.8) Voiding dysfunction (with or without urodynamic confirmation) Maher 2005 reported no evidence of a difference between traditional slings and injectables in the numbers of women with voiding dysfunction (RR 4.19, 95% CI 0.51 to 34.50; Analysis 4.9) Long‐term adverse effects Not reported Quality of life Maher 2005 reported a significant reduction in Incontinence Impact Questionnaire (IIQ) scores compared with baseline (P < 0.01) in both groups, although he provided no data | |
| Comparison 6. Traditional suburethral sling operation vs bladder neck needle suspension (abdominal and vaginal) | |
| Only 1 trial compared porcine dermis sling vs Stamey needle suspension (Hilton 1989). This was a small trial with only 10 women in each arm. The women were unsuitable for abdominal colposuspension (the study author's preferred procedure) because they had vaginal narrowing secondary to previous interventions or atrophic vaginitis. Thus they constitute a population of women with SUI who are not typical of the majority. All women had urodynamic stress incontinence. Groups were comparable for age, parity, previous interventions, and hormonal status. Follow‐up was reported at 3 months and 24 months. Due to the small size of the trial, the data were too few to be reliable Primary outcomes Number of continent (dry) women Short‐term: within the first year after surgery, 1 small trial reported 9/10 and 8/10 continent women in the traditional sling and needle suspension groups, respectively (OR 2.25, 95% CI 0.17 to 29.77; n = 20; Hilton 1989; Analysis 6.1) Medium‐term: very low‐quality evidence from 1 trial comparing slings vs bladder neck needle suspension suggested no evidence of a difference between groups in the likelihood of being continent at 2 years after surgery (OR 3.86, 95% CI 0.33 to 45.57; n = 20; Hilton 1989; Analysis 6.2;summary of findings Table 6) Long‐term: not reported Number of women who have repeat continence surgery Not reported Secondary outcomes Women's observations Number of women cured at 1 year or later (women's observations) Evidence from 1 small trial comparing slings vs bladder neck needle suspension suggests no difference between groups in cure rates at 2 years after surgery (OR 3.86, 95% CI 0.33 to 45.57; n = 20; Hilton 1989) Quantification of symptoms Pad test at 12 months and 24 months stated but not reported (Hilton 1989) Clinician's observations Not reported Surgical outcome measures Duration of operation Not reported Length of hospital stay Sling group needed an indwelling catheter for longer and more adjuvant therapy, resulting in a longer stay in hospital than those with bladder neck needle suspension (MD 13 days longer, 95% CI 5 to 21; n = 20; Hilton 1989; Analysis 6.4) Time to return to normal activity level Not reported Blood loss Not reported Further treatment Not reported Adverse events Perioperative surgical complications Nine of the 10 women who had sling operations had complications, compared with 2/10 who had needle suspension. These included pyrexia, blood loss, wound infection, and pulmonary embolus (RR 4.50, 95% CI 1.28 to 15.81; n = 20; very low‐quality evidence; Hilton 1989; Analysis 6.5;summary of findings Table 6) Bladder perforation Not reported Urinary tract infection Not reported Urinary urgency symptoms, urgency urinary incontinence At 3 months: sling: 5/10, needle suspension: 3/10 (Hilton 1989; Analysis 6.6) Detrusor overactivity (urodynamic overactivity) At 3 months: sling: 2/10, needle suspension: 1/10 (Hilton 1989; Analysis 6.7) Voiding dysfunction (with or without urodynamic confirmation) At 3 months: sling: 4/10, needle suspension: 2/10 (Hilton 1989; Analysis 6.8) Long‐term adverse effects Not reported Quality of life Not reported | |
| Comparison 10. Traditional suburethral sling operation vs a single‐incision sling (mini‐sling) | |
| One small trial compared a rectus fascia pubovaginal traditional sling vs a single‐incision sling (mini‐sling; Ophira) and included women with urodynamically diagnosed stress urinary incontinence (USI) (Sharifiaghdas 2015) Due to the small size of the trial, the data were too few to be reliable Primary outcomes Number of continent (dry) women Short‐term: not reported Medium‐term: exactly the same proportion of women were continent at 1 year after surgery (traditional sling: 31/35; mini‐sling: 31/35; very low‐quality evidence; Sharifiaghdas 2015; Analysis 10.1;summary of findings Table 10) Long‐term: not reported Number of women who have repeat continence surgery Not reported Secondary outcomes Women's observations Cure For self‐report of cure at 1 year after surgery, exactly the same proportion of women were cured (traditional sling: 31/35; mini‐sling: 31/35; Sharifiaghdas 2015; Analysis 10.2) Number of women improved Not reported Number of women satisfied 10/35 women in the traditional sling group and 7/35 in the mini‐sling group reported that they were satisfied with their treatment at 1 year (RR 0.89, 95% CI 0.68 to 1.17; n = 70; Sharifiaghdas 2015; Analysis 10.3) Quantification of symptoms Not reported Clinician's observations The clinician's report of observed stress incontinence concurred with that reported by women ‐ 4 in each group (RR 1.00, 95% CI 0.27 to 3.69; n = 70; Sharifiaghdas 2015) Surgical outcome measures Not reported Further treatment Not reported Adverse effects Perioperative complications Not reported Bladder perforation One woman (of 35) had a bladder perforation in the traditional sling group compared with none (of 35) in the mini‐sling group (very low‐quality evidence; Sharifiaghdas 2008; Analysis 10.5;summary of findings Table 10) Urinary tract infection Not reported Urinary urgency symptoms, urgency urinary incontinence More women in the traditional sling group reported urinary urgency incontinence (5/35) compared with the mini‐sling group (1/35) (RR 5.00, 95% CI 0.62 to 40.64; n = 70; Sharifiaghdas 2015; Analysis 10.6) Detrusor overactivity (urodynamic overactivity) Not reported Voiding dysfunction (with or without urodynamic confirmation) Not reported Long‐term adverse effects Dyspareunia: 3/35 and 4/35 in traditional sling and mini‐sling groups, respectively, reported pain with intercourse (RR 0.75, 95% CI 0.18 to 3.11; n = 70; Sharifiaghdas 2008; Analysis 10.7) Tape or mesh exposure: 1 woman in the traditional sling group and 2 in the mini‐sling group were found to have tape or mesh exposure (RR 0.50, 95% CI 0.05 to 5.27; n = 70; Sharifiaghdas 2008; Analysis 10.8) Quality of life Based on mean IIQ score, quality of life was lower in the traditional sling group compared with the mini‐sling group (MD 7.50, 95% CI 2.23 to 12.77; very low‐quality evidence; Analysis 10.9;summary of findings Table 10) | |
USI: urodynamically diagnosed stress urinary incontinence
VLPP: Valsalva leak point pressure
Comparison 4. Traditional suburethral sling operation versus injectables
Maher 2005 compared slings (n = 21) with injectable Macroplastique (n = 22). Based on very low‐quality evidence, we are uncertain about the impact of surgery versus injectables in terms of the number of continent women (100% were dry with a traditional sling vs 71% with the injectable after the first year; odds ratio (OR) 11.57, 95% confidence interval (CI) 0.56 to 239.74; Analysis 4.2), the need for repeat surgery for urinary incontinence (risk ratio (RR) 0.52, 95% CI 0.05 to 5.36; Analysis 4.3), or perioperative complications such as urinary tract infection (RR 1.57, 95% CI 0.29 to 8.49; Analysis 4.7).
Due to the small size of the trial, the data were too few to be reliable (summary of findings Table 4; Table 2).
Comparison 5. Traditional suburethral sling operation versus anterior repair
No trials were identified.
Comparison 6. Traditional suburethral sling operation versus bladder neck needle suspension (abdominal and vaginal)
Only one trial compared porcine dermis sling with Stamey needle suspension (Hilton 1989). This was a small trial with only 10 women in each arm. The women were unsuitable for abdominal colposuspension (the study author's preferred procedure) because they had vaginal narrowing secondary to previous interventions or atrophic vaginitis. Thus they constitute a population of women with SUI who are not typical of the majority. All women had USI. Groups were comparable for age, parity, previous interventions, and hormonal status. Follow‐up was reported at 3 months and at 24 months.
Due to the small size of the trial, the data were too few to be reliable (summary of findings Table 6; Table 2).
Comparison 7. Traditional suburethral sling operation versus open abdominal retropubic colposuspension
Eight trials compared slings with open abdominal retropubic colposuspension (Albo 2007; Bai 2005; Demirci 2001; Enzelsberger 1996; Fischer 2001; Helmy 2012; Henriksson 1978; Sand 2000). One of these trials provided no data (Helmy 2012). The extent to which the trials could be considered together was limited because of differences in procedures compared, populations studied, outcomes assessed, and length of follow‐up. Two trials involved a pubovaginal sling technique using autologous rectus fascia (Albo 2007; Demirci 2001). One trial used a lyodura sling (Enzelsberger 1996). Another trial used the Zoedler sling made of Teflon (Henriksson 1978). Still another trial used the Gortex type (Sand 2000). These were all biological materials except in two trials (Henriksson 1978; Sand 2000). Fischer 2001 did not specify the sling material used.
Only two of these trials reported follow‐up for longer than five years and presented both short‐term and long‐term data in two full reports (Albo 2007; Sand 2000).
Primary outcomes
Number of continent (dry) women
Short term
Data from four trials suggested no evidence of a difference in the likelihood of being continent within a year after treatment when comparing slings to open abdominal colposuspension (OR 2.70, 95% CI 0.69 to 10.55; n = 147; Analysis 7.1) (Bai 2005; Fischer 2001; Henriksson 1978; Sand 2000).
Medium term
Moderate‐quality evidence from four trials show that women were more likely to be continent between one and five years after surgery with slings compared with open abdominal colposuspension (OR 1.70, 95% CI 1.22 to 2.37; n = 687; Analysis 7.2;summary of findings Table 7) (Albo 2007; Bai 2005; Demirci 2001; Enzelsberger 1996).
Long term
At five years post surgery and beyond, evidence from two trials suggests that women were more likely to be continent after surgery with slings than after open abdominal colposuspension (OR 1.55, 95% CI 1.06 to 2.27; n = 190; Analysis 7.3) (Albo 2007; Sand 2000).
Number of women who had repeat continence surgery
High‐quality evidence from one trial shows that the risk of required repeat continence surgery was lower after traditional slings compared to after open abdominal colposuspension (RR 0.15, 95% CI 0.05, 0.42; n = 450; Analysis 7.4; summary of findings Table 7) (Albo 2007).
Secondary outcomes
Women's observations
Number of women cured at one year or later (women's observations)
Data from three trials suggest that women undergoing surgery with slings were more likely to report subjective cure than women having open abdominal colposuspension (OR 1.56, 95% CI 1.07 to 2.28; n = 221; Analysis 7.5) (Albo 2007; Demirci 2001; Sand 2000).
Number of women improved
This was not reported.
Number of women satisfied
Data from one trial indicate that more women were likely to be satisfied with surgery with slings than with open abdominal colposuspension (RR 1.14, 95% CI 1.02 to 1.27; n = 352; Analysis 7.6) (Albo 2007).
Quantification of symptoms
This was not reported.
Clinician's observations
Number of women with urinary incontinence (clinician's observations)
Short term
This was not reported.
Medium term and long term
Researchers found no evidence of a difference between slings and open abdominal colposuspension in the numbers of women with urinary incontinence at one to five years (RR 0.88, 95% CI 0.59 to 1.31; n = 626; Analysis 7.8) (Albo 2007; Demirci 2001; Enzelsberger 1996). Depending on judgements about what constitutes a clinically important difference between interventions with regard to continence, traditional suburethral slings are probably no worse, and may be slightly more effective, than colposuspension beyond five years (RR 0.90, 95% CI 0.80 to 1.01, n = 461; Analysis 7.9) (Albo 2007; Sand 2000).
Surgical outcome measures
Duration of operation
One trial was too small to reliably detect a difference in operating times between slings (61 minutes) and open abdominal colposuspension (55 minutes) (mean difference (MD) 6.02, 95% CI ‐0.52 to 12.56; Analysis 7.10) (Demirci 2001). Moreover, the difference in the duration of operation time observed was too small to be of clinical importance.
Length of hospital stay/time to catheter removal
Data from three trials suggest that women undergoing surgery with slings had longer hospital stays than women having open abdominal colposuspension (MD 2.03 days, 95% CI 1.47 to 2.59; n = 137; Analysis 7.11) (Demirci 2001; Enzelsberger 1996; Sand 2000). This may have been due in part to a difference in the time of catheter use after surgery (women in the sling group used a sling for eight days longer (MD) after sling than after colposuspension; 95% CI 6.84 to 9.18, n = 108; Analysis 7.12). However, it is unclear if this was due to the procedures themselves or to differences in hospital policies.
Time to return to normal activity level
This was not reported.
Blood loss
This was not reported.
Further treatment
Three trials reported that significantly more women required treatment for a new or recurrent prolapse after open colposuspension (12/282; 4.3%) compared to after a sling procedure (2/277; 0.7%; RR 0.20, 95% CI 0.05 to 0.77; n = 559; Analysis 7.14) (Albo 2007; Demirci 2001; Enzelsberger 1996). However, trial authors provided no information about subsequent surgery for prolapse in any trial.
Adverse events
Perioperative surgical complications
Four trials reported similar numbers of perioperative complications in the groups (47/394; 12% vs 38/398; 10%; RR 1.24, 95% CI 0.83 to 1.86; n = 792; low‐quality evidence; Analysis 7.15;summary of findings Table 7) (Albo 2007; Demirci 2001; Enzelsberger 1996; Sand 2000).
Bladder perforation
One large trial reported significantly lower risk of bladder perforation with the sling procedure (RR 0.20, 95% CI 0.04 to 0.91; Analysis 7.16) (Albo 2007).
Urinary tract infection
Researchers reported significantly more urinary tract infections with the sling procedure soon after surgery compared with colposuspension (RR 1.50, 95% CI 1.33 to 1.70; n = 655; Analysis 7.17). However, the risk of recurrent urinary tract infection (UTI) was not statistically different at five years or later (RR 1.02, 95% CI 0.57 to 1.82; n = 453; low‐quality evidence; Analysis 7.18;summary of findings Table 7) (Albo 2007).
Urinary urgency symptoms; urgency urinary incontinence
Two trials reported data on de novo urgency symptoms or incontinence: the evidence was insufficient to identify whether there was a difference between sling and colposuspension groups (RR 1.10, 95% CI 0.74 to 1.64; Analysis 7.19) (Albo 2007; Enzelsberger 1996).
Detrusor overactivity (urodynamic overactivity)
Evidence from four small trials was insufficient to show whether there was a difference in detrusor overactivity between sling and colposuspension groups (RR 1.42, 95% CI 0.52 to 3.87; Analysis 7.20) (Bai 2005; Demirci 2001; Enzelsberger 1996; Sand 2000).
Voiding dysfunction (with or without urodynamic confirmation)
Pooled data from five trials show that significantly more women had voiding dysfunction after sling (13% vs 2% after open colposuspension; RR 6.08, 95% CI 3.10 to 11.95; moderate‐quality evidence; Analysis 7.21) (Albo 2007; Bai 2005; Demirci 2001; Enzelsberger 1996; Sand 2000). One trial reported long‐term voiding dysfunction at five years or later (Albo 2007). Very few women still reported this complication (seven after sling vs one after colposuspension).
Long‐term adverse effects
This was not reported.
Quality of life
Data were reported in different formats; thus meta‐analysis was not possible.
One trial reported quality of life scores at over five years (Albo 2007). Women reported better quality of life after the sling surgery on one scale (Urogenital Distress Inventory (UDI)) (MD ‐10, 95% CI ‐18.91 to ‐1.09) but no difference on another scale (Incontinence Impact Questionnaire (IIQ)) (MD 1.70, 95% CI ‐11.96 to 15.36; very low‐quality evidence; summary of findings Table 7).
One trial reported no significant difference in IIQ and UDI scores between the colposuspension group and the sling group, although actual numbers were not reported (Fischer 2001).
Comparison 8. Traditional suburethral sling operation versus laparoscopic colposuspension
No trials were identified.
Comparison 9. Traditional suburethral sling operation versus mid‐urethral sling or tape
Fifteen trials addressed this comparison (Abouhashem 2014; Al‐Azzawi 2014; Amaro 2007; Arunkalaivanan 2003; Bai 2005; Basok 2008; Guerrero 2008; Kondo 2006; Sharifiaghdas 2008; Silva Filho 2006; Song 2004; Tcherniakovsky 2009; Teixeira 2008; Wadie 2005; Zargham 2013). Two new trials were added in this update (Abouhashem 2014; Zargham 2013). However, one of the new trials did not provide any useable data (Abouhashem 2014). Three trials were updated (Amaro 2007; Guerrero 2008; Wadie 2005).
Primary outcomes
Number of continent (dry) women
Short term
Data from 11 trials suggest there was no evidence of a difference between traditional slings and mid‐urethral slings in the likelihood of being continent within one year (73% vs 75%; OR 0.94, 95% CI 0.67 to 1.32; n = 841; Analysis 9.1) (Amaro 2007; Arunkalaivanan 2003; Bai 2005; Basok 2008; Guerrero 2008; Kondo 2006; Sharifiaghdas 2008; Song 2004; Tcherniakovsky 2009; Wadie 2005; Zargham 2013).
Medium term
Depending on judgements about what constitutes a clinically important difference between interventions with regard to continence, traditional suburethral slings are probably no better, and may be less effective, than mid‐urethral slings in terms of number of women continent in the medium term (one to five years). However, the results were not statistically significant (67% vs 74%, OR 0.67, 95% CI 0.44 to 1.02; n = 458; moderate‐quality evidence); Analysis 9.2;summary of findings Table 9) (Amaro 2007; Arunkalaivanan 2003; Bai 2005; Guerrero 2008; Kondo 2006; Zargham 2013).
Long term
Data from one small trial suggest that women undergoing traditional sling operations were nearly twice as likely to be continent at five years after traditional sling surgery as women who had received a mid‐urethral sling (51% vs 32%; OR 2.22, 95% CI 1.07 to 4.61; n = 124; Analysis 9.3) (Guerrero 2008).
Number of women who had repeat continence surgery
Low‐quality evidence from one trial reported the numbers of women having repeat continence surgery; no women in either arm required repeat surgery (traditional sling: 0/67; mid‐urethral sling: 0/69; Analysis 7.4;summary of findings Table 9) (Guerrero 2008). By 10 years, 2 of 63 women still being followed‐up after a mid‐urethral sling had required repeat continence surgery compared to none in the traditional sling group.
Secondary outcomes
Women's observations
Number of women cured after the first year (women's observations)
Four trials provided no evidence of a difference between traditional slings and mid‐urethral slings in the likelihood of cure at one year or later (OR 1.06, 95% CI 0.65 to 1.72; n = 337; Analysis 9.5) (Amaro 2007; Arunkalaivanan 2003; Guerrero 2008; Kondo 2006).
Number of women improved or cured
Trials provided no evidence of a difference between traditional slings and mid‐urethral slings in the likelihood of improvement or cure:
-
within one year (OR 1.33, 95% CI 0.74 to 2.39; n = 425; Analysis 9.6) (Arunkalaivanan 2003; Basok 2008; Guerrero 2008);
-
at one to five years (OR 0.76, 95% CI 0.31 to 1.87; n = 264; (Analysis 9.7) (Arunkalaivanan 2003; Guerrero 2008); or
-
after five years (OR 1.13, 95% CI 0.51 to 2.54; n = 124; Analysis 9.8) (Guerrero 2008).
Number of women satisfied
No evidence suggests a difference between traditional slings and mid‐urethral slings in the likelihood of women being satisfied (RR 1.09, 95% CI 0.89 to 1.33; n = 163; Analysis 9.9) (Amaro 2007; Guerrero 2008).
Quantification of symptoms
Pad changes over 24 hours (from self‐reported number of pads used)
This was not reported.
Incontinent episodes over 24 hours (from self‐completed bladder chart)
This was not reported.
Pad test of quantified leakage (mean weight of urine loss)
One small trial reported the mean weight of urine on a pad test (Silva Filho 2006). Data show less incontinence in the traditional sling group compared with the mid‐urethral sling group (MD ‐31.00 grams, 95% CI ‐57.53 to ‐4.47; n = 20; Analysis 9.10).
Clinician's observations
Number of women with urinary incontinence
Short term
Clinician‐reported incontinence within one year, defined as complete absence of urinary leakage during a cough‐stress test, was assessed in two small trials (Kondo 2006; Sharifiaghdas 2008), which provided no evidence of a difference between the two groups (RR 1.29, 95% CI 0.45 to 3.71; Analysis 9.11).
One trial further addressed objective cure after the first year, but again the evidence was insufficient to reveal whether there was a difference between groups, as the confidence interval was wide (RR 1.72, 95% CI 0.82 to 3.61; n = 44; Analysis 9.12) (Kondo 2006).
Surgical outcome measures
Duration of operation
Traditional suburethral sling operations took significantly longer to complete (MD 57.08 minutes, 95% CI 54.67 to 59.49; Analysis 9.13). There was statistically significant heterogeneity that could not be explained by differences in populations, interventions, or settings of the individual trials. This heterogeneity persisted even after sensitivity analysis was performed. This excludes the largest trial, which showed a much longer operating time for the traditional sling operation than was seen in the other trials (Song 2004). It also excludes another trial in which women also had concomitant prolapse surgery in both arms, and in the mid‐urethral sling arm, an additional mesh kit was used to repair the prolapse (Zargham 2013). Because of heterogeneity in trials that included women with MUI, some of whom also had concomitant prolapse surgery, a sensitivity analysis was performed excluding the four trials (Al‐Azzawi 2014; Kondo 2006; Song 2004; Zargham 2013). The mean difference in operative time was 44 minutes longer for traditional sling surgery (95% CI 40 to 48; analysis not shown).
Length of hospital stay and duration of catheterisation
In four small trials, the length of hospital stay was longer after traditional sling operations (RR 0.74 days, 95% CI 0.55 to 0.93; Analysis 9.14) (Al‐Azzawi 2014; Kondo 2006; Silva Filho 2006; Zargham 2013). Two trials reported no evidence of a difference between groups in length of time to catheter removal (MD 0.11 days, 95% ‐0.07 to 0.30; Analysis 9.15) (Kondo 2006; Wadie 2005).
Time to return to normal activity level
This was not reported.
Blood loss
This was not reported.
Further treatment
This was not reported.
Adverse events
Perioperative complications
Low‐quality evidence from four trials was insufficient to identify whether risk of perioperative complications was higher after traditional sling operations (49/148; 33.1% vs 28/145; 19.3% after a mid‐urethral sling; RR 1.74, 95% CI 1.16 to 2.60; n = 293; Analysis 9.16;summary of findings Table 9) (Arunkalaivanan 2003; Kondo 2006; Tcherniakovsky 2009; Zargham 2013).
Bladder perforation
Evidence from 10 RCTs shows that traditional slings may have fewer bladder perforations compared with mid‐urethral slings. However, whilst there is no evidence of a statistical difference in the number of bladder perforations, the confidence interval may rule out clinically important reductions for mid‐urethral slings (17/414; 4.1% vs 30/430; 6.9%; RR 0.59, 95% CI 0.34 to 1.01; n = 844; Analysis 9.17) (Al‐Azzawi 2014; Arunkalaivanan 2003; Bai 2005; Guerrero 2008; Kondo 2006; Sharifiaghdas 2008; Song 2004; Tcherniakovsky 2009; Wadie 2005; Zargham 2013).
Urinary tract infection
Trials provided no evidence of a difference between traditional slings and mid‐urethral slings in the number of women with urinary tract infections (RR 1.00, 95% CI 0.22 to 4.49; n = 50; Analysis 9.20) (Zargham 2013).
Urinary urgency symptoms; urgency urinary incontinence
Combined results from four trials were insufficient to show whether there was a difference between traditional slings and mid‐urethral slings in the number of women with urinary urgency symptoms (RR 1.50, 95% CI 0.58 to 3.88; Analysis 9.22) (Guerrero 2008; Kondo 2006; Sharifiaghdas 2008; Zargham 2013).
Detrusor overactivity (urodynamic overactivity)
Data from four trials suggest higher risk of detrusor overactivity after traditional sling operations than after mid‐urethral sling operations (RR 2.61, 95% CI 1.17 to 5.84; n = 325; Analysis 9.23) (Al‐Azzawi 2014; Bai 2005; Basok 2008; Wadie 2005). This was principally due to the higher weighting given to the largest trial (Basok 2008).
Voiding dysfunction
Very low‐quality evidence from eight trials suggests no difference between traditional slings and mid‐urethral slings in the number of women with voiding dysfunction (RR 1.34, 95% CI 0.85 to 2.12; n = 629; summary of findings Table 9) (Al‐Azzawi 2014; Arunkalaivanan 2003; Bai 2005; Guerrero 2008; Kondo 2006; Sharifiaghdas 2008; Wadie 2005; Zargham 2013).
Long‐term adverse effects
Wound pain
Three trials reported that more women had long‐term wound pain in the traditional sling groups (17/126 vs 2/131; RR 6.40, 95% CI 1.94 to 21.12; n = 257; Analysis 9.25) (Al‐Azzawi 2014; Guerrero 2008; Wadie 2005).
Mesh exposure
Evidence from five trials was insufficient to reveal whether there was a difference in vaginal exposure (RR 0.28, 95% CI 0.05 to 1.65; n = 348; Analysis 9.26) (Al‐Azzawi 2014; Guerrero 2008; Tcherniakovsky 2009; Wadie 2005; Zargham 2013). Only four cases of mesh exposure (from 177 women) were reported in the mid‐urethral sling group compared with none among 171 women in the traditional sling arms. The five trials all used a biological graft as traditional sling material.
Release of sling
Very low‐quality evidence from three trials suggests no difference between traditional slings and mid‐urethral slings in the numbers of women requiring release of sling (11/164; 6.7% vs 4/162; 2.5%: RR 2.53, 95% CI 0.87 to 7.35; n = 326; Analysis 9.24;summary of findings Table 9) (Arunkalaivanan 2003; Guerrero 2008; Kondo 2006).
Other adverse effects
One trial further reported urethral injury alone, which suggests no evidence of a difference between groups (RR 0.36, 95% CI 0.02 to 8.39) (Kondo 2006).
Finally, one small trial reported vaginal bleeding and UTI (Analysis 9.19;Analysis 9.20) (Zargham 2013). Results show no significant difference in the risk of vaginal bleeding (RR 1.67, 95% CI 0.45 to 6.24).
Quality of life
Quality of life (QoL) was assessed in nine trials (Amaro 2007; Arunkalaivanan 2003; Basok 2008; Guerrero 2008; Kondo 2006; Okulu 2013; Sharifiaghdas 2008; Silva Filho 2006; Wadie 2005). Data were reported in different ways; thus meta‐analysis was not possible and individual results are reported below. In this section, results are reported qualitatively according to how trialists reported their findings. Therefore, use of 'statistically significant' is as reported in the trials ‐ not as interpreted by the review authors ‐ and we have not changed this.
-
Amaro 2007 used the Portuguese version of King's Health Questionnaire (KHQ), reporting no statistically significant differences between groups in general health condition; impact of incontinence; role, physical, and social limitations; personal relationships; emotions; sleep; and severity perception of urinary incontinence at 36 months.
-
A 10‐point questionnaire‐based assessment was used by Arunkalaivanan 2003. The mean score was 8.03 for mid‐urethral synthetic suburethral slings and 8.05 for traditional slings, with a median score of 9 for both groups.
-
A subjective 10‐point patient satisfaction questionnaire was used by Basok 2008, which provided no evidence of a difference between groups, with satisfaction rates of 82% and 87.5% with the traditional sling and the mid‐urethral sling, respectively.
-
Trialists found no significant difference in any domain of the Bristol Female Lower Urinary Tract Symptom (BFLUTS) score, as assessed in Guerrero 2008.
-
Statistically significant improvement was noted postoperatively on the IIQ Short Form (IIQ‐7) and the UDI Short Form (UDI‐6) within both groups, but no significant difference in the degree of improvement was evident between groups (Kondo 2006).
-
One study assessed quality of life using the ICIQ‐Short form score. While there was improvement from baseline in all groups, there were no significant differences between randomised groups (Okulu 2013).
-
IIQ score was also used by Sharifiaghdas 2008 to determine subjective cure. Means were reported as 44.3 (range 35.2 to 61.5) for the mid‐urethral procedure and 48.5 (range 38.5 to 69.7) for the sling operation (P = 0.46). A score less than 50 represents good quality of life, between 50 and 70 moderate quality of life, and greater than 70 poor quality of life. There was no significant difference in QoL between groups; 15 (72%) in the mid‐urethral group and 20 (55%) in the sling group were satisfied with the operation (P = 0.3, as reported by trialists).
-
The KHQ was used in Silva Filho 2006 to show significantly greater improvement in those who underwent the traditional suburethral sling operation in the following domains: general health perception; physical, social, and role limitations; emotions and severity measures. There were no significant differences in incontinence impact, personal relationships, sleep, and energy domains.
-
In one small trial (Wadie 2005), researchers reported UDI‐6 and IIQ‐7 scores, which show no statistically significant differences between trial arms (Analysis 9.27;Analysis 9.28
Comparison 10. Traditional suburethral sling operation versus single‐incision sling (mini‐sling)
One small trial compared a rectus fascia pubovaginal traditional sling with a single‐incision sling (mini‐sling; Ophira) and included women with urodynamically diagnosed stress urinary incontinence (USI) (Sharifiaghdas 2015).
Due to the small size of the trial, the data were too few to be reliable (Table 2).
Comparison 11. One type of traditional sling operation versus another type of traditional sling operation
Nine trials addressed this comparison (Barbalias 1997; Choe 2000; Guerrero 2008; Lucas 2000; Okulu 2013; Pacetta 2005; Shin 2001; Teleb 2011; Viseshsindh 2003). Three of these were newly added in this update (Choe 2000; Okulu 2013; Teleb 2011). One was updated (Guerrero 2008).
The traditional slings in this comparison used the following materials to suspend the urethra.
-
Autologous biological materials: rectus fascial sling (Barbalias 1997; Guerrero 2008; Lucas 2000; Teleb 2011); dermal graft patch (Shin 2001); tissue removed from the vaginal wall (Choe 2000; Teleb 2011; Viseshsindh 2003).
-
Other biological materials: cadaveric fascia lata (Shin 2001); Fortaperm porcine collagen matrix (Pacetta 2005); Pelvicol (Guerrero 2008).
-
Synthetic materials: Goretex (Barbalias 1997); antimicrobial MycroMesh (Choe 2000); Vypro, Ultrapro, and Prolene (Okulu 2013); Prolene (Teleb 2011).
Some trials compared three different materials: these have been presented as pair‐wise comparisons. One trial compared the same material (autologous rectus fascia) but with different lengths of the material used (Lucas 2000). It is not possible to pool data from any of these trials because different materials were compared, and each individual trial was too small for findings to be conclusive.
Primary outcomes
Number of continent (dry) women
Short term
Five trials reported the number of continent women within the first year after surgery (Guerrero 2008; Lucas 2000; Okulu 2013; Pacetta 2005; Viseshsindh 2003). A total of 437 women studied within the first 12 months after surgery showed similar incontinence rates between traditional sling operations using biological or synthetic materials. However, the confidence intervals were wide (Analysis 11.1).
Medium term
Seven trials reported the number of continent women from one to five years after surgery (Barbalias 1997; Choe 2000; Guerrero 2008; Lucas 2000; Okulu 2013; Shin 2001; Teleb 2011). Again, it is not possible to pool any of these trials because different materials were compared. With one exception, none of the comparisons suggest any evidence of a difference between different materials. One small trial suggests that women were more likely to be continent with autologous fascial sling operations than with Pelvicol graft (OR 3.29, 95% 1.41 to 7.69; n = 113; Analysis 11.2.1; summary of findings Table 11) (Guerrero 2008). This effect was evident early and led to premature closure of the Pelvicol arm.
Long term
One trial measured continence rates at six years after surgery and found no evidence of a difference between a standard (long) sling and a short sling (31/73 and 35/69 continent women, respectively) (OR 0.72, 95% CI 0.37 to 1.39, n = 142; Analysis 11.3) (Lucas 2000).
Number of women who had repeat continence surgery
One trial reported the number of women requiring repeat continence surgery at 1 year and at 10 years (Guerrero 2008). Only women who received the biological material Pelvicol required any repeat surgery (9/46; 20%; RR 0.04, 95% CI 0.00 to 0.61; Analysis 11.4; summary of findings Table 11) compared to 0 of 67 women in the rectus fascia group requiring repeat surgery 10 years later. This was statistically significant in favour of the traditional sling with rectus fascia; as a result, Pelvicol is no longer used in traditional sling surgery.
Secondary outcomes
Women's observations
Number of women cured at one year or later (women's observations)
Three trials reported women's perception of cure of incontinence (Guerrero 2008; Lucas 2000; Shin 2001). Only one reported any evidence of a difference between groups; fascial slings were significantly better than Pelvicol slings (OR 3.29, 95% CI 1.41 to 7.69; Analysis 11.5.1) (Guerrero 2008).
Number of women improved
Short term
Three trials reported women’s perception of improvement within one year (Barbalias 1997; Guerrero 2008; Pacetta 2005). Only one reported a difference between groups; women having fascial slings were more likely to perceive themselves as improved compared to women having Pelvicol slings (69/73 vs 33/34; OR 6.27, 95% CI 1.88 to 20.94; Analysis 11.6.1) (Guerrero 2008).
Medium term
Four trials reported women’s perception of improvement after one year (Barbalias 1997; Guerrero 2008; Shin 2001; Teleb 2011). Only one reported a difference between groups; women having fascial slings were more likely to perceive themselves as improved compared to women having Pelvicol slings (60/67 vs 28/46; RR 1.47, 95% CI 1.15 to 1.88; Analysis 11.7.1) (Guerrero 2008).
Long term
This was not reported.
Number of women satisfied
Three trials reported satisfaction, but results could not be combined and individually, numbers were too small to be conclusive (Analysis 11.8) (Choe 2000; Guerrero 2008; Okulu 2013). Study authors provided no evidence of a difference between groups in any comparison.
Quantification of symptoms
Two trials reported data on mean weight of urine on a pad test (Analysis 11.9) (Lucas 2000; Okulu 2013).
In the short term, trials provided no reliable evidence of a difference between groups (Analysis 11.9), but after one year, one trial showed that Ultrapro was better than both Vypro and Prolene light for this outcome (Analysis 11.10) (Okulu 2013).
Clinician's observations
This was not reported.
Surgical outcome measures
Duration of operation
The duration of operation for the traditional long length sling procedure was significantly longer in one trial, which compared long and short lengths of autologous fascia (MD 8 minutes, 95% CI 3 to 13; Analysis 11.7) (Lucas 2000). In another trial comparing three materials, duration of operation was shortest for Prolene (36 minutes), intermediate for anterior vaginal wall patch (42 minutes), and longest when rectus sheath was used as a sling (52 minutes) (Analysis 11.11) (Teleb 2011). However, it is unclear whether these differences in operating time would be enough to be clinically important.
Length of hospital stay
Length of hospital stay was reported in one trial (Teleb 2011). Hospital stay was longest for women having the anterior rectus sheath sling compared to women with the other two materials (Analysis 11.13).
Time to return to normal activity level
This was not reported.
Blood loss
Blood loss was significantly less with Prolene compared to the other two materials (Analysis 11.12) (Teleb 2011).
-
Anterior rectus sheath sling versus prolene strip: MD 32.00 mL, 95% CI 7.14 to 56.86; n = 24.
-
Anterior rectus sheath sling versus anterior vaginal wall patch: ‐20.00 mL, 95% CI ‐46.93 to 6.93; n = 20.
-
Prolene strip versus anterior vaginal wall patch: MD ‐52.00 mL, 95% CI ‐77.41 to ‐26.59; n = 20.
However, total differences in volumes of blood lost were small, and their clinical importance is uncertain.
Further treatment
This was not reported.
Adverse events
Perioperative surgical complications
The three trials that reported any perioperative complications could not be combined because different materials were compared (Barbalias 1997; Lucas 2000; Viseshsindh 2003). More complications were reported with the use of synthetic non‐absorbable Goretex in one trial (RR 0.05, 95% CI 0.00 to 0.80; Analysis 11.14.2) (Barbalias 1997). In the other trial, evidence was insufficient to show whether there was a difference between two biological slings (RR 1.14, 95% CI 0.78 to 1.66; Analysis 11.14.1; summary of findings Table 11) (Lucas 2000). There were no perioperative complications in the third trial between the two groups (Viseshsindh 2003).
Bladder perforation
Three trials reported the number of bladder perforations (Guerrero 2008; Lucas 2000; Teleb 2011), showing no evidence of a difference between groups in any comparison (Analysis 11.15).
Urinary tract infection
Two trials reported the number of women with urinary tract infection (Choe 2000; Lucas 2000), providing no evidence of a difference between groups in any comparison (Analysis 11.16).
Urinary urgency symptoms; urgency urinary incontinence
Three trials reported the number of women with urgency symptoms (Barbalias 1997; Lucas 2000; Okulu 2013), revealing no evidence of a difference between groups in any comparison (Analysis 11.20).
Detrusor overactivity (urodynamic overactivity)
One trial reported 4 of 33 women in the autologous dermal graft patch group with de novo detrusor overactivity compared with 5 of 20 in the cadaveric fascia lata group (RR 0.48, 95% CI 0.15 to 1.60; n = 53; Analysis 11.21) (Shin 2001).
Voiding dysfunction (with or without urodynamic confirmation)
Six trials reported the number of women with voiding dysfunction (Choe 2000; Guerrero 2008; Lucas 2000; Okulu 2013; Teleb 2011; Viseshsindh 2003), showing no evidence of a difference between groups in any comparison (Analysis 11.19).
Long‐term adverse effects
One trial reported the number of women with wound pain: 2 of 61 and 0 of 38 in the fascial sling and Pelvicol groups, respectively (RR 3.15, 95% CI 0.16 to 63.80; n = 99; Guerrero 2008). The same trial also reported 2 of 61 and 1 of 38 women requiring release of sling (RR 1.25, 95% CI 0.12 to 13.28; n = 99).
Two women in one trial reported long‐term scar pain after a rectus fascial sling compared to none in the Pelvicol group; there were no graft exposures in either group (Guerrero 2008). In another trial, when participants all received a different type of synthetic mesh, five instances of mesh exposure were reported among 141 women in the three mesh groups (Okulu 2013). One trial of a synthetic versus a biological material reported no mesh exposures (Analysis 11.23; summary of findings Table 11) (Choe 2000).
Other adverse effects
One trial reported 1 of 20 women with vaginal bleeding after anterior wall vaginal sling compared with 0 of 20 in the biosynthetic mesh group (RR 3.00, 95% CI 0.13 to 69.52; n = 40) (Choe 2000).
Quality of life
Data were reported in different ways; thus meta‐analysis was not possible (summary of findings Table 11).
-
Lucas 2000 showed significant improvement in average scores for the UDI‐6 (reported P = 0.007) and the IIQ‐7 (P = 0.002) when compared with baseline. Scores between groups were similar.
-
Pacetta 2005 evaluated women using the Incontinence Quality of Life questionnaire (I‐QOL), reporting improvement from 45 at baseline to 97 at one year in the autologous fascia group, and from 39 to 92 in the Fortaperm group.
-
Okulu 2013 used the International Consultation on Incontinence Questionnaire (ICIQ) Short Form urinary incontinence scale to compare three synthetic meshes. Ultrapro was better than Prolene light, which was better than Vypro, in the short term and in the medium term (Analysis 11.24; Analysis 11.25).
Discusión
A continuación se examina la revisión sistemática principal de los efectos, pero se trató de complementar esta revisión mediante la identificación de evaluaciones económicas que compararan las operaciones con cabestrillos suburetrales tradicionales con cualquiera de las otras categorías principales de métodos quirúrgicos enumerados en la sección de Antecedentes. Las evaluaciones económicas identificadas se han resumido en un breve comentario económico. Una búsqueda complementaria en Ovid NHS EED, MEDLINE, y Embase identificó dos de estas evaluaciones económicas. Los detalles de las estrategias de búsqueda se proporcionan en el Apéndice 3.
Resumen de los resultados principales
Se incluyeron 34 ensayos con 3244 pacientes. Los cabestrillos tradicionales se compararon con otros 10 tratamientos y entre sí; pero no se identificó ningún ensayo que comparara los cabestrillos suburetrales con ningún tratamiento o tratamiento simulado, tratamiento conservador, reparación anterior o colposuspensión retropúbica laparoscópica. Un ensayo comparó los cabestrillos tradicionales con la suspensión con agujas del cuello de la vejiga (Resumen de resultados, tabla 6), y otro ensayo comparó los cabestrillos tradicionales con cabestrillos de una única incisión (Resumen de resultados, tabla 10). Ambos ensayos fueron demasiado pequeños para ser informativos.
Operación con cabestrillo suburetral tradicional frente a los fármacos
Un pequeño ensayo que comparó los cabestrillos tradicionales con la oxibutinina para mujeres con incontinencia urinaria mixta no informó de ninguno de los resultados utilizados en las tablas de «Resumen de resultados». Sin embargo, no se sabe con certeza si la cirugía comparada con la oxibutinina da lugar a que más mujeres no presenten pérdidas (83% frente a 0%; odds ratio [OR] 195,89, intervalo de confianza [IC] del 95%: 9,91 a 3871,03) o que tengan menos incontinencia urinaria de urgencia (13% frente a 43%; riesgo relativo [RR] 0,29;IC del 95%: 0,09 a 0,94) (Resumen de resultados, tabla 3).
Operación con cabestrillo suburetral tradicional frente a los inyectables
Sobre la base de evidencia de calidad muy baja de un ensayo pequeño, no existe seguridad en cuanto al impacto de la cirugía frente a los inyectables en cuanto al número de mujeres continentes (el 100% estuvo libre de pérdidas con un cabestrillo tradicional frente al 71% con el inyectable después del primer año; OR 11,57, IC del 95%: 0,56 a 239,74) o la necesidad de repetir la cirugía para la incontinencia urinaria (RR 0,52, IC del 95%: 0,05 a 5,36) o la aparición de complicaciones perioperatorias (RR 1,57, IC del 95%: 0,29 a 8,49) (Resumen de resultados, tabla 4).
Operación con cabestrillo suburetral tradicional frente a colposuspensión retropúbica abdominal abierta
Ocho ensayos compararon los cabestrillos con la colposuspensión retropúbica abdominal abierta. Las evidencia de calidad moderada muestra que el cabestrillo suburetral tradicional probablemente da lugar a más mujeres continentes a plazo medio (de uno a cinco años) (69% frente a 59% después de la colposuspensión: OR 1,70; IC del 95%: 1,22 a 2,37). La evidencia de calidad alta indica que las mujeres presentaron menos probabilidades de necesitar una cirugía de continencia repetida después de una operación con cabestrillo tradicional que después de una colposuspensión (RR 0,15; IC del 95%: 0,05 a 0,42). No se encontró evidencia de una diferencia en las complicaciones perioperatorias entre los dos grupos, pero el IC fue muy amplio y la calidad de la evidencia fue muy baja (RR 1,24; IC del 95%: 0,83 a 1,86; Resumen de resultados, tabla 7).
Operación con cabestrillo suburetral tradicional frente a operación con cabestrillo mediouretral
Catorce ensayos consideraron la comparación entre las operaciones con cabestrillo tradicional y las operaciones con cabestrillo mediouretral. Dependiendo de los juicios sobre lo que constituye una diferencia clínicamente importante entre las intervenciones con respecto a la continencia, los cabestrillos suburetrales tradicionales probablemente no son mejores, y pueden ser menos efectivos, que los cabestrillos mediouretrales en cuanto al número de mujeres continentes a plazo medio (de uno a cinco años) (67% frente a 74%; OR 0,67; IC del 95%: 0,44 a 1,02; n = 458; evidencia de calidad moderada). Un ensayo informó sobre más mujeres continentes con el cabestrillo tradicional después de 10 años (51% frente a 32%; OR 2,22; IC del 95%: 1,07 a 4,61), pero este hallazgo debe replicarse en otros ensayos. Los cabestrillos mediouretrales pueden asociarse con menos complicaciones perioperatorias (RR 1,74; IC del 95%: 1,16 a 2,60; evidencia de calidad baja; Resumen de resultados, tabla 9).
Un tipo de operación con cabestrillo tradicional frente a otro tipo de operación con cabestrillo tradicional
Nueve ensayos compararon un tipo de cabestrillo tradicional con otro. Se utilizaron diferentes materiales como dermis porcina, duramadre liofilizada, fascia lata, pared vaginal, dermis autóloga y fascia rectal. Los resultados de los estudios no pudieron ser agrupados debido a la heterogeneidad clínica, ya que se utilizaron diferentes materiales o tipos de cabestrillos tradicionales. Dos ensayos informaron sobre las complicaciones: uno que comparaba el Goretex no absorbible con un cabestrillo de fascia rectal, y el segundo que comparaba Pelvicol con un cabestrillo de fascia rectal. El impacto fue incierto debido a la calidad muy baja de la evidencia (Resumen de resultados, tabla 11).
Compleción y aplicabilidad general de las pruebas
Históricamente, las intervenciones con cabestrillos suburetrales tradicionales se utilizaban en mujeres que presentaban incontinencia de esfuerzo recurrente (después del fracaso de una intervención anterior para la continencia). Sin embargo, la revisión actual incluye tanto a mujeres con incontinencia nueva como recurrente, sin informar los resultados por separado. Dichas operaciones se diseñan para restaurar el apoyo de la unión uretrovesical normal al comprimir o retorcer mecánicamente la uretra proximal.
En la mayoría de los ensayos se dispuso de evidencia relacionada con el resultado primario ‐ continencia urinaria ‐ de una forma u otra para determinar la efectividad de las operaciones con cabestrillo suburetral tradicional para el tratamiento de la incontinencia urinaria. Sin embargo, los resultados del estudio fueron consistentes independientemente del método de determinación de la continencia utilizado (pérdida de orina utilizando cualquier definición, informe de la mujer, observación del médico, combinaciones de los anteriores, o métodos de cuantificación como pruebas relacionadas con el peso de los protectores). En la actualidad se dispone de más datos a largo plazo, que sugieren que los cabestrillos tradicionales pueden presentar la misma efectividad o ser más efectivos que otros tratamientos quirúrgicos actualmente disponibles (como la colposuspensión y los cabestrillos mediouretrales). Sin embargo, la mayoría de los ensayos no proporcionaron suficiente información para juzgar de forma adecuada el riesgo de sesgo; por lo tanto, la mayoría de los ensayos tuvieron que ser juzgados como en «riesgo de sesgo poco claro» debido al informe inadecuado.
Ninguno de los ensayos incluidos contenía todos los resultados pertinentes informados por los pacientes. Habría sido útil disponer de más datos sobre el dolor después de diferentes procedimientos (tanto posoperatorios como a largo plazo) y el tiempo hasta el retorno a la vida diaria «normal» después de la cirugía. En particular, no se dispone de información sobre los efectos adversos a plazo medio y a largo plazo ni sobre la necesidad de repetir la cirugía de continencia a largo plazo, pero dicha información sería esencial para tomar decisiones fundamentadas.
Esta revisión Cochrane solo se limita a ensayos controlados aleatorizados (ECA). Debido a que los eventos adversos fueron relativamente poco frecuentes y pueden no haber sido informados, no es posible inferir datos precisos sobre su frecuencia o tipo.
La importancia de disponer de una gama de opciones quirúrgicas es que la mujer pueda elegir el procedimiento con el que se sienta más cómoda, por ejemplo, cambiar la eficacia por la posibilidad de experimentar menos efectos adversos o un procedimiento menos invasivo. Los cabestrillos tradicionales parecen presentar la misma efectividad o más que los cabestrillos de colposuspensión y los cabestrillos mediouretrales, pero sin los riesgos que se perciben como asociados a la malla sintética.
Esta revisión Cochrane puede no ser aplicable a los médicos de cualquier país. Las naciones de ingresos altos han estado utilizando cada vez más los procedimientos mediouretrales con materiales sintéticos como tratamiento de primera línea para la incontinencia urinaria de esfuerzo durante unos 20 años, pero debido a que la seguridad de estas operaciones se ha puesto en duda, esta práctica puede disminuir en el futuro. El uso de las operaciones suburetrales tradicionales, que parecen presentar la misma efectividad, podría reservarse a los países en que no se dispone de nueva tecnología o donde la misma es demasiado costosa. Para las mujeres que desean evitar las posibles complicaciones de los materiales sintéticos, los materiales biológicos como la fascia rectal (pero no la dermis porcina) parecen presentar la misma efectividad que los cabestrillos sintéticos mediouretrales.
Cuando fue posible, los datos se analizaron en subgrupos según las características clínicas del tipo de incontinencia (incontinencia urodinámica de esfuerzo, síntomas de incontinencia de esfuerzo o incontinencia urinaria mixta). Los hallazgos del estudio fueron similares independientemente de cómo se diagnosticó originalmente la incontinencia. Debido a que no se disponía de información sobre esta base, no fue posible determinar si algún tipo de cirugía fue más efectiva para las mujeres que habían sido sometidas a una cirugía previa de continencia fallida. No fue posible realizar más análisis según las características clínicas de las mujeres, como la incontinencia urinaria de esfuerzo primaria frente a la recurrente y la presencia o ausencia de prolapso, debido a la falta de información. También podría ser útil examinar las posibles diferencias según la deficiencia intrínseca del esfínter uretral frente a la hipermovilidad uretral (aunque en la actualidad no hay apoyo clínico en cuanto al uso de estos términos; Abrams 2006), la obesidad, el origen étnico, el parto vaginal frente a la cesárea, o la experiencia del cirujano. Lo anterior podría dar lugar a que los hallazgos de esta revisión fuesen más generalizables. Sin embargo, la mayoría de los ensayos no han informado de estas características.
La calidad de vida, el bienestar emocional y las repercusiones sociales se comunicaron de manera deficiente o se evaluaron con diversos instrumentos, lo que impidió realizar un metanálisis. Estos resultados son de gran importancia para las mujeres y para los encargados de tomar decisiones.
Se han realizado dos búsquedas desde la última búsqueda totalmente incorporada (9 de octubre 2017 y 23 de enero 2019). Cuatro estudios están en espera de evaluación: Abou Hashem 2017; Hassan 2018; Kajbafzadeh 2017; Sharifiaghdas 2017. De los mismos, dos son ensayos en curso (Hassan 2018; Kajbafzadeh 2017), uno es una segunda publicación, aunque idéntica, de un ensayo incluido sin datos utilizables (Abou Hashem 2017; Abouhashem 2014, respectivamente), y uno es una actualización a 10 años de un ensayo ya incluido (Sharifiaghdas 2017; Sharifiaghdas 2008, respectivamente).
Calidad de la evidencia
La calidad de la evidencia desempeña un papel crucial en la confianza en la estimación del efecto. La mayoría de los resultados específicos de los criterios GRADE se consideraron de calidad «baja» o «muy baja». Este hecho indica que cuando se dispone de más evidencia, es probable que la estimación del efecto se modifique o que cualquier estimación del efecto sea muy incierta. En esta revisión sistemática, se evaluaron los defectos metodológicos de los ensayos incluidos mediante los informes de los ensayos. Por lo tanto, el juicio sobre el riesgo de sesgo y la calidad de la evidencia fue influenciado por el informe.
Aunque los autores de los ensayos declararon que los ensayos eran aleatorizados, la mayoría de los informes no proporcionaron suficientes detalles sobre el método de generación de la secuencia o la ocultación de la asignación. Diez ensayos utilizaron un método de asignación al azar adecuado. En general, no fue posible el cegamiento de los cirujanos o las mujeres, pero solo dos ensayos informaron de que los resultados fueron evaluados por una enfermera que estaba cegada a la asignación. El número total de mujeres incluidas fue de 3244; pero algunos ensayos incluyeron solo a 10 mujeres por brazo. Además, se compararon varios tipos de cabestrillos con diferentes intervenciones, lo que significa que hubo que agrupar diferentes materiales para poder compararlos. Por lo tanto, las cifras de cada comparación eran pequeñas y los intervalos de confianza eran amplios; por esta razón varios resultados fueron disminuidos debido a la imprecisión.
Las poblaciones de estudio variaron, e incluyeron a mujeres con y sin cirugía previa, y un estudio incluyó solo a mujeres que se consideraron no aptas para otro procedimiento (Hilton 1989). Aunque la mayoría de los participantes del estudio tenían incontinencia urodinámica de esfuerzo, algunos ensayos incluyeron a mujeres con incontinencia urinaria mixta. La comparabilidad inicial de los grupos no se informó en todos los ensayos. Varios ensayos evaluaron diferentes tipos de cabestrillo en comparación con la fascia rectal autóloga, lo que sugiere que esta última se consideró como el comparador «estándar».
Aunque en ocho ensayos se utilizó la colposuspensión retropúbica abdominal abierta como comparador, cada uno utilizó un tipo diferente de cabestrillo, y tres hicieron un seguimiento de las mujeres durante solo seis meses. Catorce ensayos utilizaron un cabestrillo mediouretral como comparador, ya que podría decirse que se ha convertido en el procedimiento de referencia para la cirugía de la continencia en muchos países.
En general, la mayoría de los ensayos informaron sobre diferentes medidas de resultado, a menudo de manera deficiente. La medida principal de efectividad utilizada en la mayoría de los estudios fue la proporción de mujeres con incontinencia después de la cirugía. Pocos investigadores han considerado otros resultados, como las actividades de la vida diaria y la calidad de vida. Pocos han considerado el estado de salud general, la repetición de la cirugía de incontinencia, la cirugía de prolapso posterior o el tiempo hasta el retorno al nivel de actividad normal. La satisfacción con el tratamiento y la aceptabilidad del mismo también se consideraron en raras ocasiones, pero son factores importantes para la elección del tratamiento.
Sesgos potenciales en el proceso de revisión
Se realizaron búsquedas en todas las bases de datos pertinentes y no se impuso ninguna restricción de idioma durante el proceso de búsqueda, lo que permitió incluir el mayor número posible de ensayos potencialmente elegibles. Es posible que no se publiquen algunos informes de ensayos, por lo que es probable que no se haya captado la totalidad de los datos. Para tener en cuenta cualquier posible sesgo en el proceso de revisión, la extracción de datos y la evaluación del riesgo de sesgo fueron realizadas por al menos dos autores de la revisión independientes.
Aunque la mayoría de los ensayos informaron de los resultados que mencionaron en sus secciones de métodos, ninguno informó de todos los resultados de interés para esta revisión, incluidos, en muchos casos, los resultados primarios de la incontinencia urinaria y la cirugía de continencia repetida (Figura 4).
La revisión procuró utilizar métodos rigurosos de síntesis en todo momento y ha tratado de identificar evidencia estadística de las diferencias entre las intervenciones. En algunas comparaciones no se identificó evidencia estadística de una diferencia, pero el examen de los intervalos de confianza producidos indica que las diferencias de importancia clínica pueden ser poco probables. Dichas conclusiones requieren juicios sobre la magnitud de la diferencia mínima (clínicamente) importante. Dichos juicios pueden ser impugnados.
Acuerdos y desacuerdos con otros estudios o revisiones
Ninguna otra revisión sistemática comparable de ECA ha considerado el uso específico de los cabestrillos tradicionales para tratar a las mujeres con incontinencia urinaria de esfuerzo.
Breve comentario económico
Para complementar la revisión sistemática principal, se buscaron evaluaciones económicas que compararan los cabestrillos suburetrales tradicionales con una variedad de intervenciones quirúrgicas para el tratamiento de mujeres con incontinencia urinaria de esfuerzo.
Tres estudios, seleccionados a partir de una búsqueda realizada el 10 de agosto 2018; proporcionaron un análisis de costes (Berman 1997), un análisis de coste‐utilidad (Kilonzo 2004) y otro análisis de coste‐utilidad (Kumar 2017).
En el análisis comparativo de costes realizado por Berman 1997 se utilizaron datos de un estudio observacional retrospectivo realizado en los Estados Unidos, en el que se compararon los procedimientos con cabestrillo retropúbico suburetral tradicional frente a las inyecciones transuretrales de colágeno en mujeres con incontinencia urinaria de esfuerzo. Este estudio incluyó a un total de 14 mujeres de ambos brazos, cada una de las cuales había sufrido incontinencia urinaria de esfuerzo y había sido sometida a un promedio de 1,1 procedimientos entre diciembre 1993 y octubre 1995. El análisis retrospectivo determinó que el cabestrillo tradicional tuvo un tiempo medio de cirugía de 186 minutos y requirió una estancia hospitalaria promedio de 2,9 días. El coste total por paciente fue en promedio de 16 229 dólares (en dólares internacionales de 2019; 10 381 dólares de 1995). El tratamiento con colágeno fue en promedio menos costoso (P < 0,001) con un coste promedio en dólares internacionales de 2019 de 7810 (o 4996 en dólares de 1995). El tiempo promedio del procedimiento para las inyecciones de colágeno fue de 57 minutos, y no hubo tiempo de hospitalización. Un porcentaje alto de los costes del brazo del estudio del cabestrillo tradicional incluyó los del médico (33%) y los de la sala de operaciones (36%), y los costes del brazo de colágeno incluyeron el colágeno (40%) y los honorarios del médico (22%). La atención posoperatoria del cabestrillo tradicional costó 1927 dólares internacionales de 2019 (1233 dólares de 1995), que fue casi el doble del coste de la inyección de colágeno: 980 dólares en dólares internacionales de 2019 (627 dólares de 1995).
Antes del procedimiento, no había evidencia de que hubiera diferencias en la aparición de incontinencia entre los grupos. Sin embargo, el número promedio de protectores disminuyó después del procedimiento de 4,7 a 1,4 y de 5,2 a 2,3 para el cabestrillo tradicional y la inyección de colágeno, respectivamente (P = 0,049).
Se realizó un seguimiento de las mujeres durante 15 meses después de la cirugía, y el 71,4% de las que estaban en el brazo del cabestrillo tradicional no presentaban síntomas, en comparación con el 26,7% del brazo de inyección de colágeno (P = 0,05), y el 85% del brazo de cabestrillo tradicional presentaba una incontinencia mínima o ninguna incontinencia (utilizaban un protector o ningún protector por día).
A pesar de los costos menores asociados con la inyección de colágeno, el brazo de cabestrillo tradicional mostró una mejoría general y tuvo menores tasas de nueva cirugía. El autor del estudio estableció la conclusión de que el cabestrillo tradicional podría ser más coste‐efectivo en comparación con la inyección de colágeno.
En un análisis del coste‐utilidad que utilizó un modelo de Markov se comparó el cabestrillo mediouretral con la colposuspensión retropúbica abdominal abierta, la colposuspensión laparoscópica, el cabestrillo retropúbico suburetral tradicional y los inyectables (Kilonzo 2004). Este estudio ofrece un resumen de la labor presentada en la revisión de la evaluación de la tecnología realizada para el National Institute for Clinical Excellence (NICE) del Reino Unido (Cody 2003). Los autores del estudio utilizaron los datos clínicos de una revisión sistemática de los ECA realizados hasta mediados de 2003 (Lapitan 2003; Moehrer 2002; Ward 2002b), y estos resultados se basaron en la modelización económica para un horizonte temporal de hasta 10 años; todos los costes se comunicaron originalmente en libras esterlinas para 2001 y se ajustaron a dólares internacionales para 2019.
En dicho estudio se supuso, sobre la base de las conclusiones de Cody 2003; que el cabestrillo tradicional y la colposuspensión retropúbica abdominal abierta tenían una efectividad equivalente. Este hecho contrasta con la evidencia de la revisión actual que muestra que los cabestrillos tradicionales son más efectivos (Resumen de resultados, tabla 7).
El coste de los cabestrillos tradicionales era de 2756 dólares por mujer (dólares internacionales de 2019; 1340 libras esterlinas de 2001), con un tiempo de cirugía de 46 minutos y una estancia hospitalaria media de 7,2 días. Los cabestrillos mediouretrales cuestan 2176 dólares (dólares internacionales de 2019; 1058 libras esterlinas de 2001) por mujer, con una estancia hospitalaria media de 2,9 días y una duración de la cirugía de 30 minutos, aunque estos costes fueron excluidos. La colposuspensión abierta cuesta 2676 dólares por mujer (dólares internacionales de 2019; 1301 libras esterlinas de 2001), con un tiempo de cirugía de 52 minutos y una estancia hospitalaria media de 7,1 días, y la colposuspensión laparoscópica cuesta 2709 dólares (dólares internacionales de 2019; 1317 libras esterlinas de 2001), con un tiempo de cirugía de 60 minutos y una estancia hospitalaria promedio de 4,6 días. No se realizó una comparación formal del coste‐efectividad de los cabestrillos tradicionales con ninguna de las otras intervenciones. Sin embargo, Kilonzo 2004 estimó que había una probabilidad del 86% de que los cabestrillos mediouretrales fueran coste‐efectivos en comparación con la colposuspensión abierta, si la sociedad estaba dispuesta a pagar aproximadamente 62 000 dólares (dólares internacionales de 2019; 30 000 libras esterlinas de 2001) por año de vida ajustado por calidad (AVAC) ganado. Debido a las presuposiciones del modelo (los cabestrillos tradicionales son más costosos y presentan la misma efectividad que la colposuspensión abierta), por implicación, en esta evaluación los cabestrillos tradicionales no se considerarían coste‐efectivos en comparación con los cabestrillos mediouretrales o la colposuspensión abierta.
Un análisis del coste‐utilidad (modelo Markov) de Kumar 2017 comparó la efectividad del cabestrillo tradicional con la colposuspensión de Burch. Este estudio utilizó datos de ECA publicados que incluían a mujeres a partir de los 60 años de edad con incontinencia urinaria de esfuerzo, que comparaban los dos procedimientos (Albo 2007; Bai 2005; Culligan 2003; Sand 2000). El seguimiento de estos estudios varió de tres a 73 meses. Sin embargo, el modelo extrapoló el seguimiento de las mujeres para un horizonte temporal de 16 años. La perspectiva de los costes no se indicó de forma explícita, pero parece ser la del paciente y del profesional sanitario de los Estados Unidos basado en los costes captados (costes de los procedimientos y costes de la atención del paciente con el fracaso del tratamiento durante un año). Estos costes fueron originalmente informados en dólares para 2015 y fueron convertidos a dólares internacionales de 2019.
La literatura que describe este análisis de coste‐utilidad muestra que la tasa de resolución de la colposuspensión de Burch a los tres; 12; 36 y 73 meses fue del 90%, el 87%, el 49% y el 84,6%, respectivamente, y que la del cabestrillo tradicional fue del 100% a los tres y 73 meses, del 87,8% a los 12 meses y del 66% a los 36 meses. Los estudios informaron de que el coste total del cabestrillo tradicional por mujer fue de 8186 dólares (dólares internacionales de 2019; 7619 dólares de 2015) menos que el coste total de la colposuspensión de Burch. El análisis de coste‐utilidad estableció la conclusión de que el cabestrillo tradicional era más efectivo que la colposuspensión de Burch basado en los AVAC ganados. Las mujeres del brazo de cabestrillo tradicional (11,18 AVAC) tuvieron 0,99 AVAC más en comparación con las del brazo de colposuspensión de Burch (10,19 AVAC), con un coste incremental por AVAC de 8251 dólares (dólares Internacionales de 2019; 7696 dólares de 2015). Kumar 2017 declaró que sería importante tener datos publicados de los ensayos a gran escala antes de que se pudiera proporcionar una recomendación definitiva.
Las evaluaciones económicas elegibles no fueron directamente comparables debido a las diferencias en los métodos, los horizontes temporales y los entornos. No se intentó determinar las posibles razones por las que los resultados difieren entre los estudios, ni se realizó ninguna evaluación crítica. Por consiguiente, no se intenta establecer ninguna conclusión sólida o general con respecto a los costes relativos o la eficiencia de los cabestrillos retropúbicos suburetrales tradicionales para el tratamiento quirúrgico de la incontinencia urinaria de esfuerzo en comparación con las alternativas actuales.
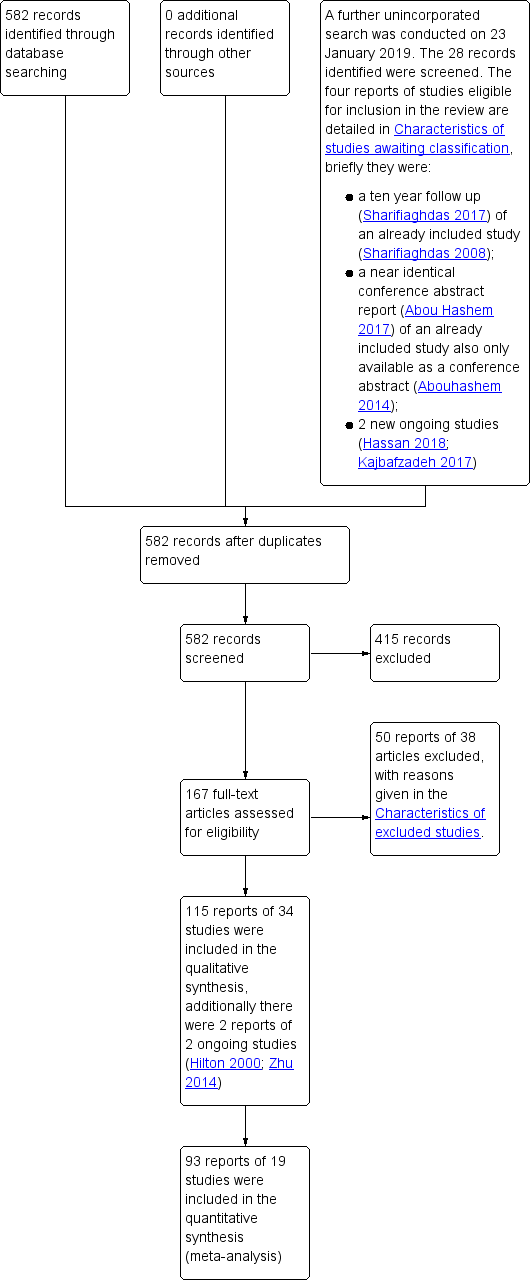
PRISMA study flow diagram ‐ search for clinical effectiveness studies.

PRISMA study flow diagram ‐ search for economic evaluations for the BEC.
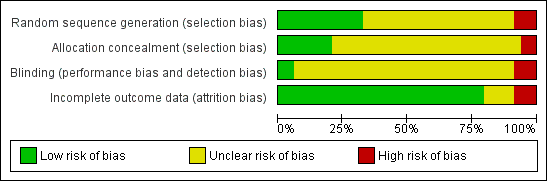
Risk of bias graph: review authors' judgements about each risk of bias item presented as percentages across all included studies.
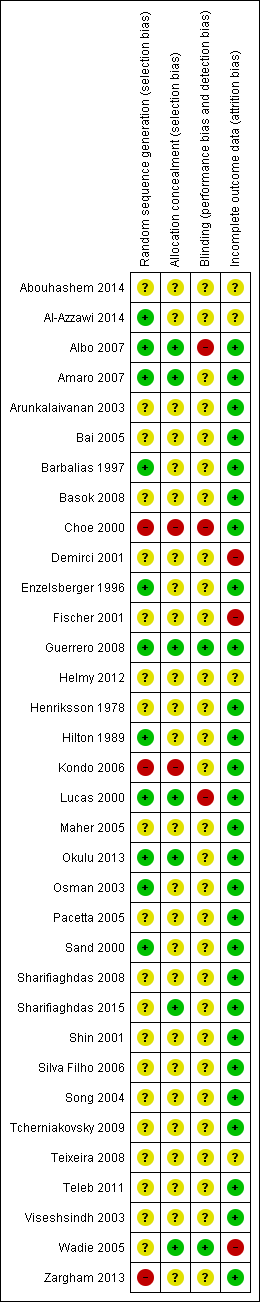
Risk of bias summary: review authors' judgements about each risk of bias item for each included study.
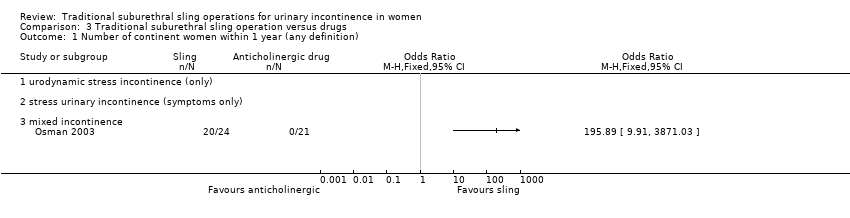
Comparison 3 Traditional suburethral sling operation versus drugs, Outcome 1 Number of continent women within 1 year (any definition).
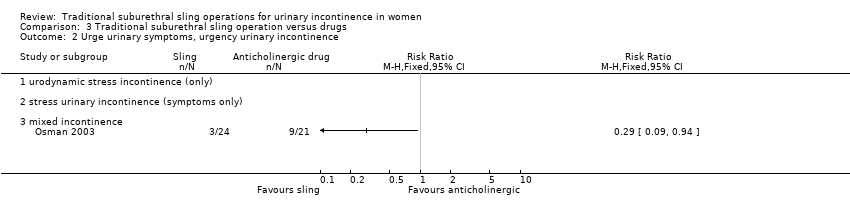
Comparison 3 Traditional suburethral sling operation versus drugs, Outcome 2 Urge urinary symptoms, urgency urinary incontinence.

Comparison 4 Traditional suburethral sling operation versus injectables, Outcome 1 Number of continent women within 1 year (any definition).

Comparison 4 Traditional suburethral sling operation versus injectables, Outcome 2 Number of continent women at 1 to 5 years (any definition).

Comparison 4 Traditional suburethral sling operation versus injectables, Outcome 3 Repeat surgery for urinary incontinence.
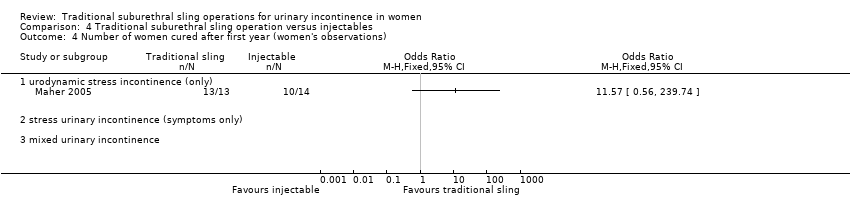
Comparison 4 Traditional suburethral sling operation versus injectables, Outcome 4 Number of women cured after first year (women's observations).
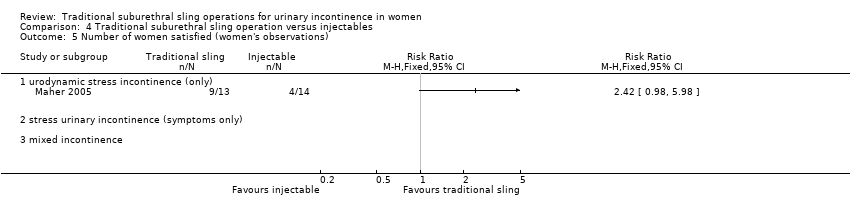
Comparison 4 Traditional suburethral sling operation versus injectables, Outcome 5 Number of women satisfied (women's observations).
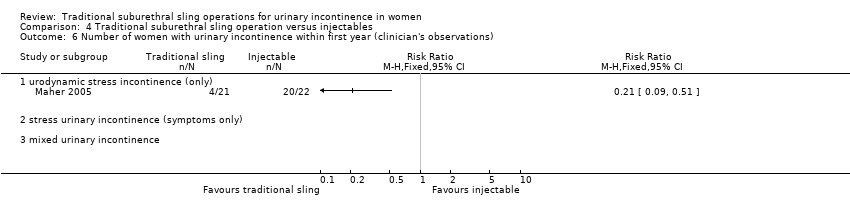
Comparison 4 Traditional suburethral sling operation versus injectables, Outcome 6 Number of women with urinary incontinence within first year (clinician's observations).

Comparison 4 Traditional suburethral sling operation versus injectables, Outcome 7 Urinary tract infection.

Comparison 4 Traditional suburethral sling operation versus injectables, Outcome 8 De novo detrusor overactivity (urodynamic diagnosis).

Comparison 4 Traditional suburethral sling operation versus injectables, Outcome 9 Voiding dysfunction.

Comparison 6 Traditional suburethral sling operation versus bladder neck needle suspension (abdominal and vaginal), Outcome 1 Number of continent women within 1 year (any definition).
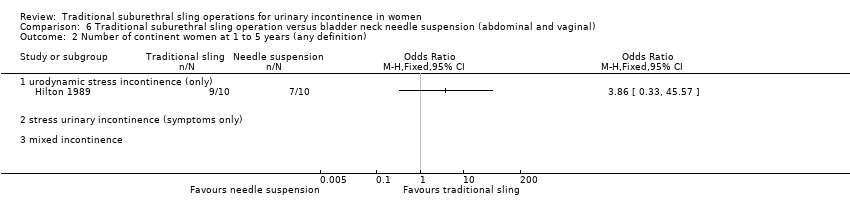
Comparison 6 Traditional suburethral sling operation versus bladder neck needle suspension (abdominal and vaginal), Outcome 2 Number of continent women at 1 to 5 years (any definition).
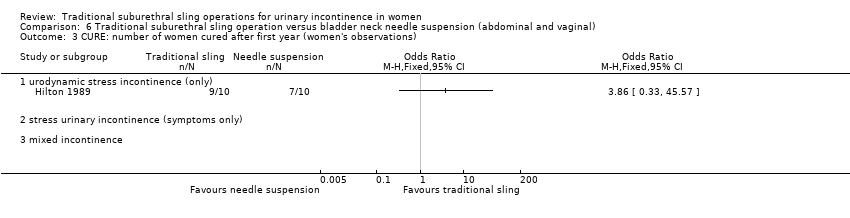
Comparison 6 Traditional suburethral sling operation versus bladder neck needle suspension (abdominal and vaginal), Outcome 3 CURE: number of women cured after first year (women's observations).

Comparison 6 Traditional suburethral sling operation versus bladder neck needle suspension (abdominal and vaginal), Outcome 4 Length of hospital stay (hours).

Comparison 6 Traditional suburethral sling operation versus bladder neck needle suspension (abdominal and vaginal), Outcome 5 Perioperative surgical complications.

Comparison 6 Traditional suburethral sling operation versus bladder neck needle suspension (abdominal and vaginal), Outcome 6 Urinary urgency symptoms, urgency urinary incontinence.

Comparison 6 Traditional suburethral sling operation versus bladder neck needle suspension (abdominal and vaginal), Outcome 7 Detrusor overactivity (urodynamic diagnosis).

Comparison 6 Traditional suburethral sling operation versus bladder neck needle suspension (abdominal and vaginal), Outcome 8 Voiding dysfunction after 3 months.
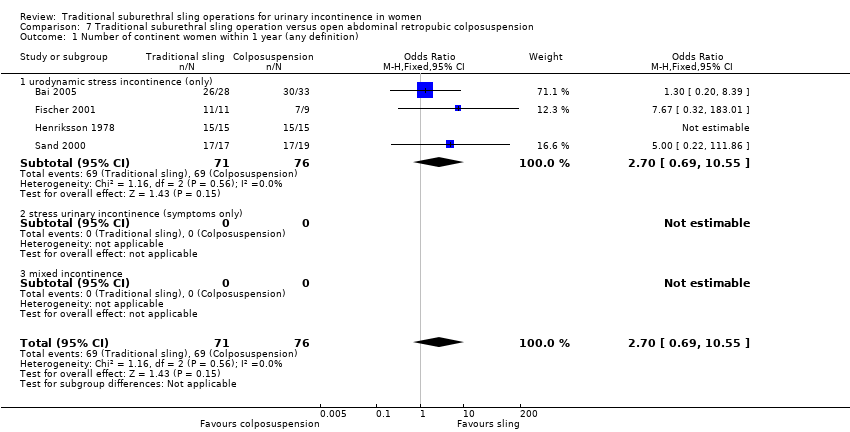
Comparison 7 Traditional suburethral sling operation versus open abdominal retropubic colposuspension, Outcome 1 Number of continent women within 1 year (any definition).

Comparison 7 Traditional suburethral sling operation versus open abdominal retropubic colposuspension, Outcome 2 Number of continent women at 1 to 5 years (any definition).
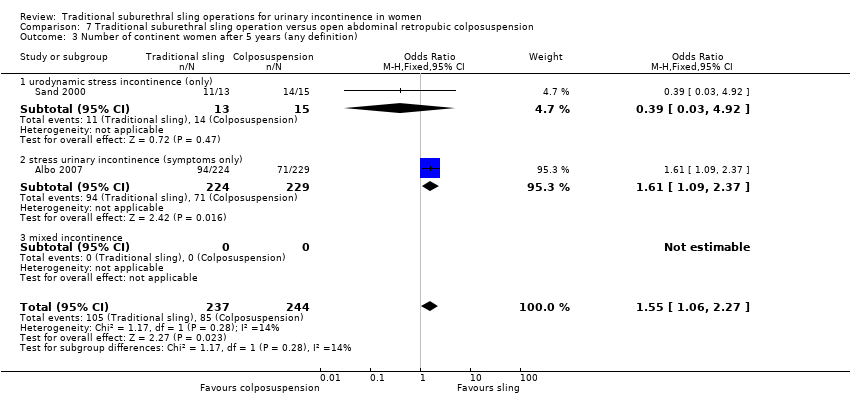
Comparison 7 Traditional suburethral sling operation versus open abdominal retropubic colposuspension, Outcome 3 Number of continent women after 5 years (any definition).

Comparison 7 Traditional suburethral sling operation versus open abdominal retropubic colposuspension, Outcome 4 Repeat surgery for urinary incontinence.

Comparison 7 Traditional suburethral sling operation versus open abdominal retropubic colposuspension, Outcome 5 Number of women cured after first year (women's observations).

Comparison 7 Traditional suburethral sling operation versus open abdominal retropubic colposuspension, Outcome 6 Number of women satisfied (women's observations).
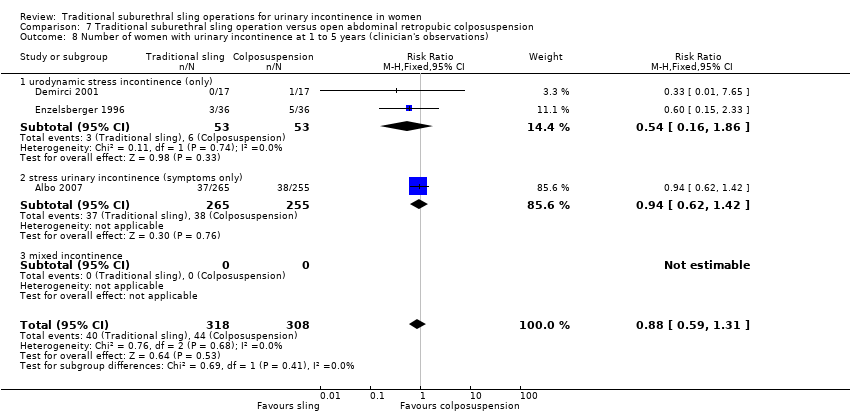
Comparison 7 Traditional suburethral sling operation versus open abdominal retropubic colposuspension, Outcome 8 Number of women with urinary incontinence at 1 to 5 years (clinician's observations).
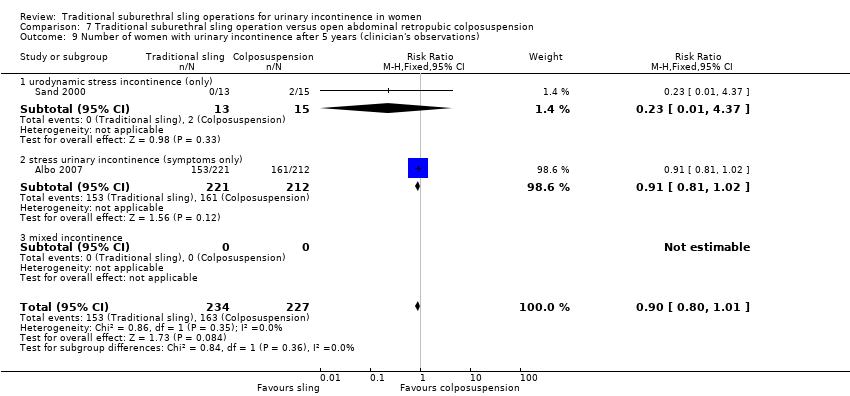
Comparison 7 Traditional suburethral sling operation versus open abdominal retropubic colposuspension, Outcome 9 Number of women with urinary incontinence after 5 years (clinician's observations).
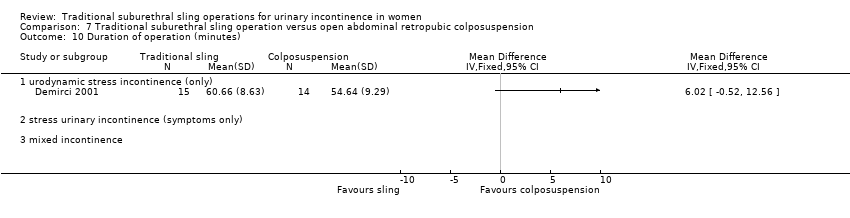
Comparison 7 Traditional suburethral sling operation versus open abdominal retropubic colposuspension, Outcome 10 Duration of operation (minutes).

Comparison 7 Traditional suburethral sling operation versus open abdominal retropubic colposuspension, Outcome 11 Length of hospital stay (days).

Comparison 7 Traditional suburethral sling operation versus open abdominal retropubic colposuspension, Outcome 12 Time to catheter removal (days).
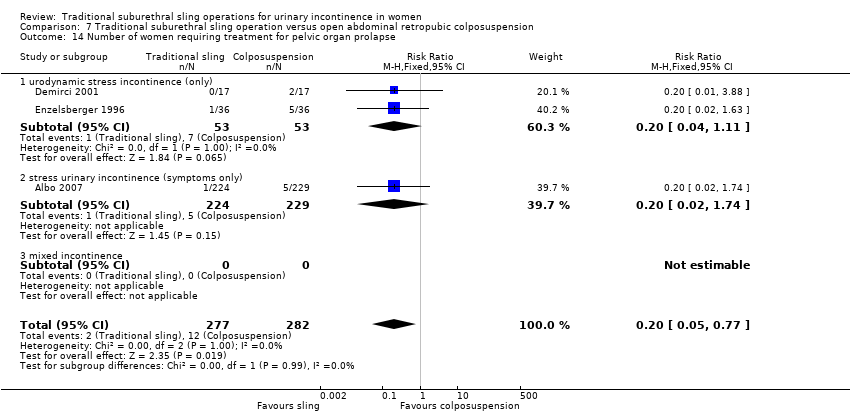
Comparison 7 Traditional suburethral sling operation versus open abdominal retropubic colposuspension, Outcome 14 Number of women requiring treatment for pelvic organ prolapse.

Comparison 7 Traditional suburethral sling operation versus open abdominal retropubic colposuspension, Outcome 15 Perioperative surgical complications.

Comparison 7 Traditional suburethral sling operation versus open abdominal retropubic colposuspension, Outcome 16 Bladder perforation.
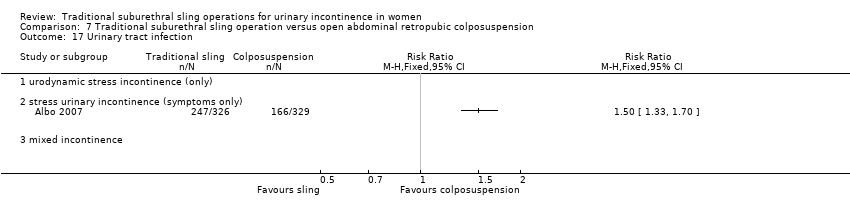
Comparison 7 Traditional suburethral sling operation versus open abdominal retropubic colposuspension, Outcome 17 Urinary tract infection.
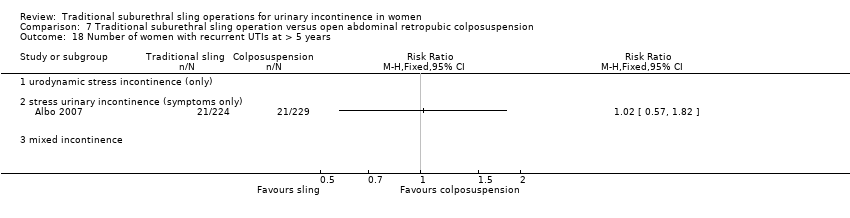
Comparison 7 Traditional suburethral sling operation versus open abdominal retropubic colposuspension, Outcome 18 Number of women with recurrent UTIs at > 5 years.

Comparison 7 Traditional suburethral sling operation versus open abdominal retropubic colposuspension, Outcome 19 Urinary urgency symptoms, urgency urinary incontinence.
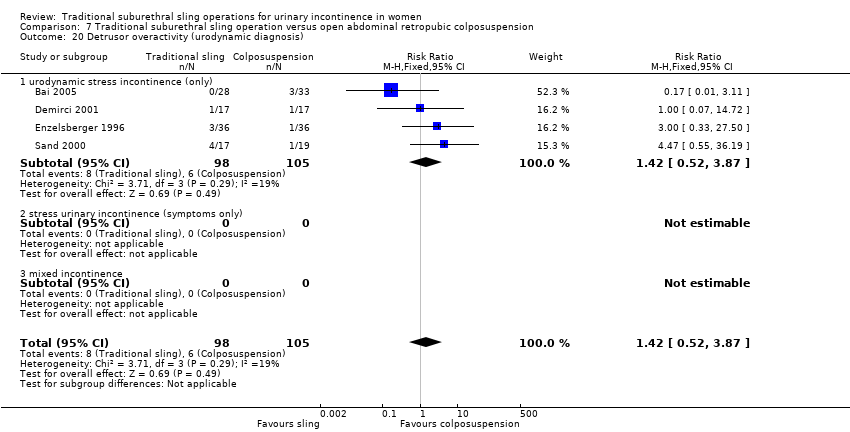
Comparison 7 Traditional suburethral sling operation versus open abdominal retropubic colposuspension, Outcome 20 Detrusor overactivity (urodynamic diagnosis).

Comparison 7 Traditional suburethral sling operation versus open abdominal retropubic colposuspension, Outcome 21 Voiding dysfunction after 3 months.

Comparison 7 Traditional suburethral sling operation versus open abdominal retropubic colposuspension, Outcome 22 Long‐term voiding dysfunction > 5 years.
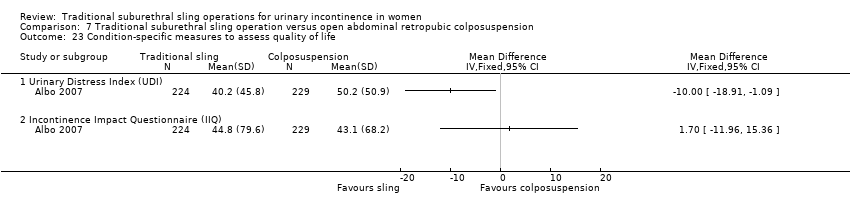
Comparison 7 Traditional suburethral sling operation versus open abdominal retropubic colposuspension, Outcome 23 Condition‐specific measures to assess quality of life.

Comparison 9 Traditional suburethral sling operation versus mid‐urethral sling or tape, Outcome 1 Number of continent women within 1 year (any definition).
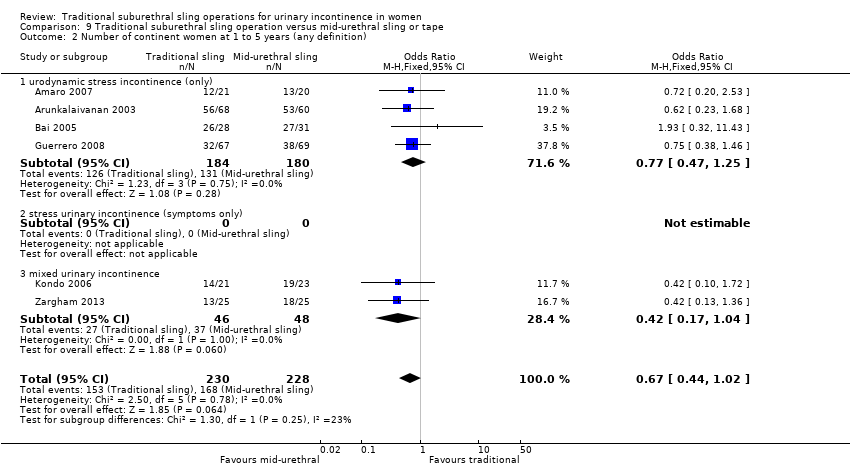
Comparison 9 Traditional suburethral sling operation versus mid‐urethral sling or tape, Outcome 2 Number of continent women at 1 to 5 years (any definition).
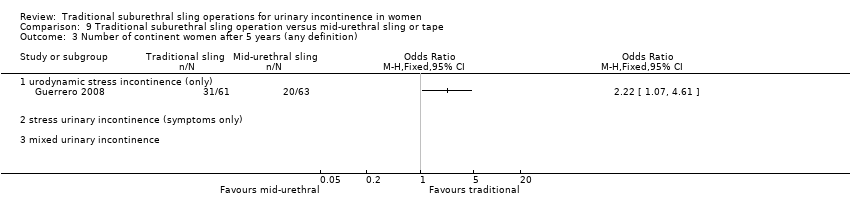
Comparison 9 Traditional suburethral sling operation versus mid‐urethral sling or tape, Outcome 3 Number of continent women after 5 years (any definition).

Comparison 9 Traditional suburethral sling operation versus mid‐urethral sling or tape, Outcome 4 Repeat surgery for urinary incontinence.
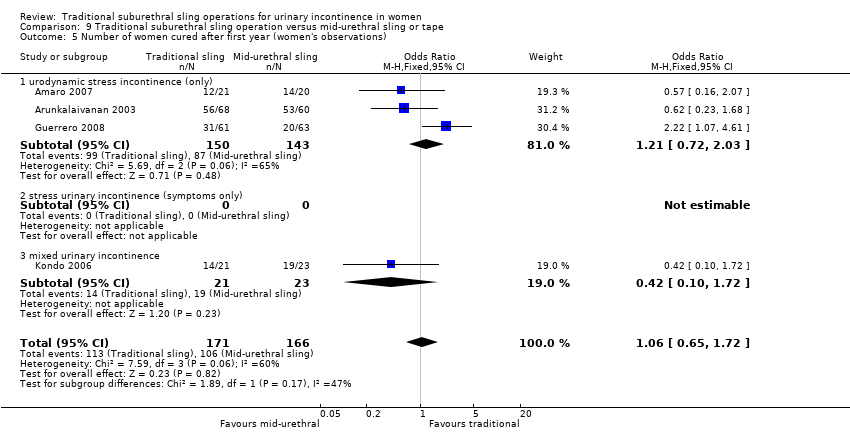
Comparison 9 Traditional suburethral sling operation versus mid‐urethral sling or tape, Outcome 5 Number of women cured after first year (women's observations).

Comparison 9 Traditional suburethral sling operation versus mid‐urethral sling or tape, Outcome 6 Number of women improved or cured within 1 year (women's observations).

Comparison 9 Traditional suburethral sling operation versus mid‐urethral sling or tape, Outcome 7 Number of women improved or cured at 1 to 5 years (women's observations).

Comparison 9 Traditional suburethral sling operation versus mid‐urethral sling or tape, Outcome 8 Number of women improved or cured after 5 years (women's observations).

Comparison 9 Traditional suburethral sling operation versus mid‐urethral sling or tape, Outcome 9 Number of women satisfied (women's observations).

Comparison 9 Traditional suburethral sling operation versus mid‐urethral sling or tape, Outcome 10 Pad test of quantified leakage (mean weight of urine lost).

Comparison 9 Traditional suburethral sling operation versus mid‐urethral sling or tape, Outcome 11 Number of women with urinary incontinence within first year (clinician's observations).
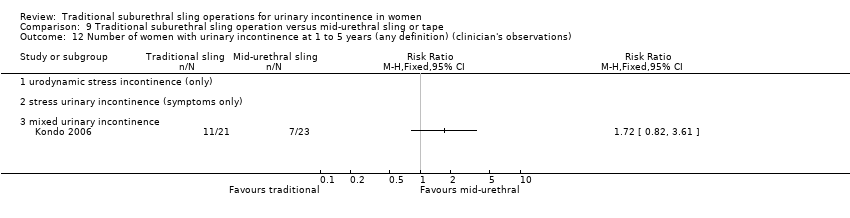
Comparison 9 Traditional suburethral sling operation versus mid‐urethral sling or tape, Outcome 12 Number of women with urinary incontinence at 1 to 5 years (any definition) (clinician's observations).

Comparison 9 Traditional suburethral sling operation versus mid‐urethral sling or tape, Outcome 13 Duration of operation (minutes).

Comparison 9 Traditional suburethral sling operation versus mid‐urethral sling or tape, Outcome 14 Length of hospital stay (days).

Comparison 9 Traditional suburethral sling operation versus mid‐urethral sling or tape, Outcome 15 Time to catheter removal (days).

Comparison 9 Traditional suburethral sling operation versus mid‐urethral sling or tape, Outcome 16 Perioperative surgical complications.

Comparison 9 Traditional suburethral sling operation versus mid‐urethral sling or tape, Outcome 17 Bladder perforations.

Comparison 9 Traditional suburethral sling operation versus mid‐urethral sling or tape, Outcome 18 Urethral injury.
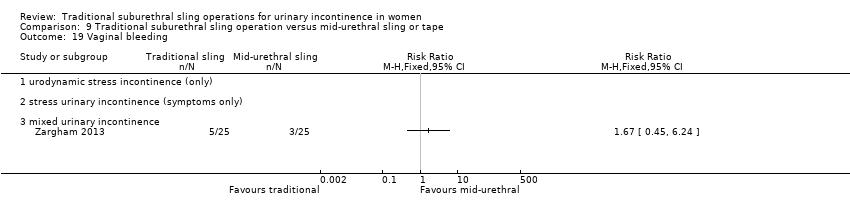
Comparison 9 Traditional suburethral sling operation versus mid‐urethral sling or tape, Outcome 19 Vaginal bleeding.

Comparison 9 Traditional suburethral sling operation versus mid‐urethral sling or tape, Outcome 20 Urinary tract infection.

Comparison 9 Traditional suburethral sling operation versus mid‐urethral sling or tape, Outcome 21 Voiding dysfunction.

Comparison 9 Traditional suburethral sling operation versus mid‐urethral sling or tape, Outcome 22 Urinary urgency symptoms, urgency urinary incontinence.

Comparison 9 Traditional suburethral sling operation versus mid‐urethral sling or tape, Outcome 23 De novo detrusor overactivity (urodynamic diagnosis).

Comparison 9 Traditional suburethral sling operation versus mid‐urethral sling or tape, Outcome 24 Long‐term adverse effects (release of sling required).

Comparison 9 Traditional suburethral sling operation versus mid‐urethral sling or tape, Outcome 25 Long‐term adverse effects (wound pain at 6 months).

Comparison 9 Traditional suburethral sling operation versus mid‐urethral sling or tape, Outcome 26 Long‐term adverse effects (vaginal mesh or graft exposure).

Comparison 9 Traditional suburethral sling operation versus mid‐urethral sling or tape, Outcome 27 Condition‐specific measures to assess quality of life: UDI‐6.

Comparison 9 Traditional suburethral sling operation versus mid‐urethral sling or tape, Outcome 28 Condition‐specific measures to assess quality of life: IIQ‐7.
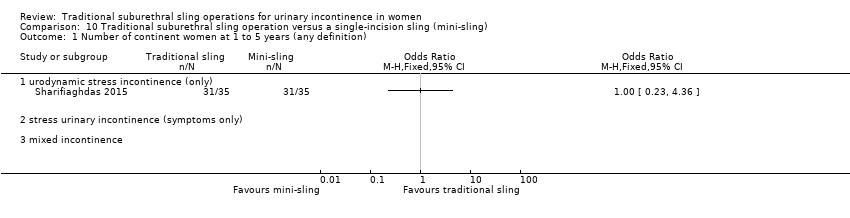
Comparison 10 Traditional suburethral sling operation versus a single‐incision sling (mini‐sling), Outcome 1 Number of continent women at 1 to 5 years (any definition).
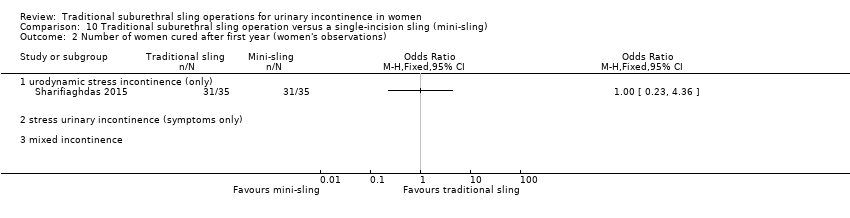
Comparison 10 Traditional suburethral sling operation versus a single‐incision sling (mini‐sling), Outcome 2 Number of women cured after first year (women's observations).

Comparison 10 Traditional suburethral sling operation versus a single‐incision sling (mini‐sling), Outcome 3 Number of women satisfied (women's observations).
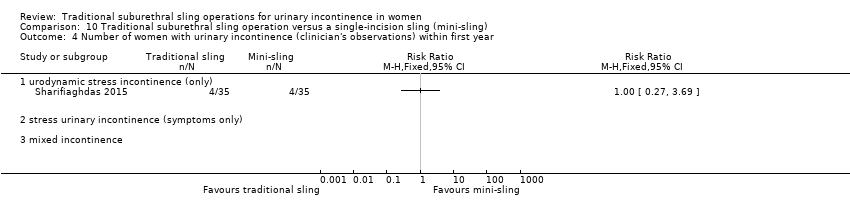
Comparison 10 Traditional suburethral sling operation versus a single‐incision sling (mini‐sling), Outcome 4 Number of women with urinary incontinence (clinician's observations) within first year.
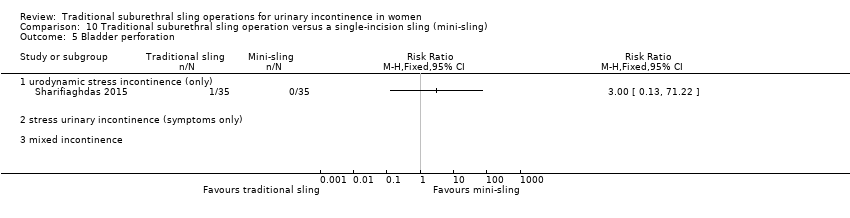
Comparison 10 Traditional suburethral sling operation versus a single‐incision sling (mini‐sling), Outcome 5 Bladder perforation.

Comparison 10 Traditional suburethral sling operation versus a single‐incision sling (mini‐sling), Outcome 6 Urinary urgency symptoms, urgency urinary incontinence.

Comparison 10 Traditional suburethral sling operation versus a single‐incision sling (mini‐sling), Outcome 7 Pain with intercourse (dyspareunia).

Comparison 10 Traditional suburethral sling operation versus a single‐incision sling (mini‐sling), Outcome 8 Long‐term adverse effects (vaginal mesh or graft exposure).

Comparison 10 Traditional suburethral sling operation versus a single‐incision sling (mini‐sling), Outcome 9 Condition‐specific measures to assess quality of life: IIQ score.

Comparison 11 One type of traditional sling operation versus another type of traditional sling operation, Outcome 1 Number of continent women within 1 year (any definition).
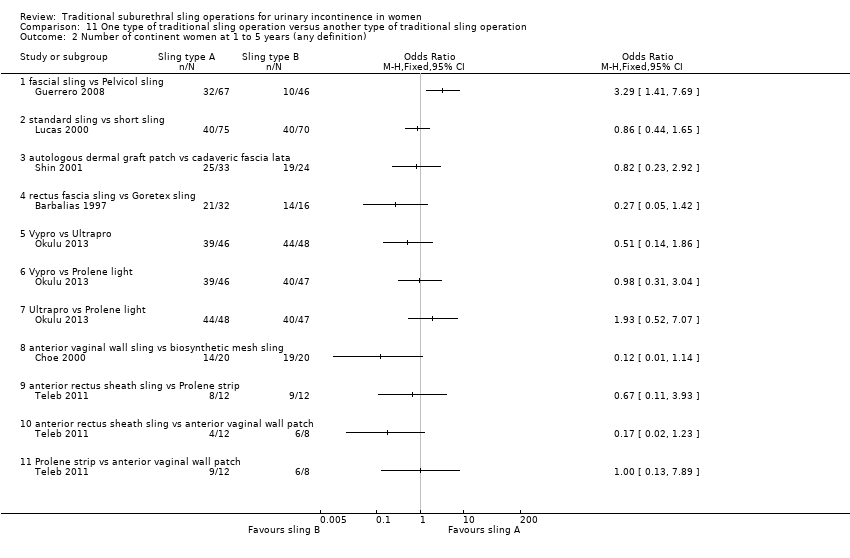
Comparison 11 One type of traditional sling operation versus another type of traditional sling operation, Outcome 2 Number of continent women at 1 to 5 years (any definition).
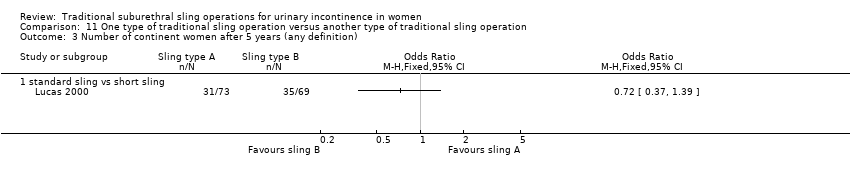
Comparison 11 One type of traditional sling operation versus another type of traditional sling operation, Outcome 3 Number of continent women after 5 years (any definition).
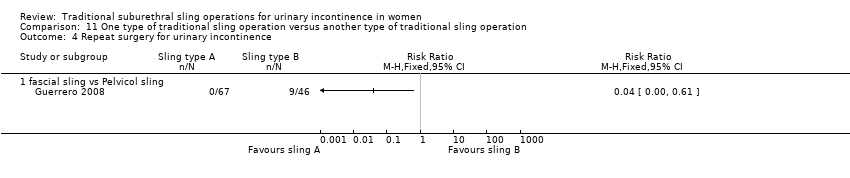
Comparison 11 One type of traditional sling operation versus another type of traditional sling operation, Outcome 4 Repeat surgery for urinary incontinence.
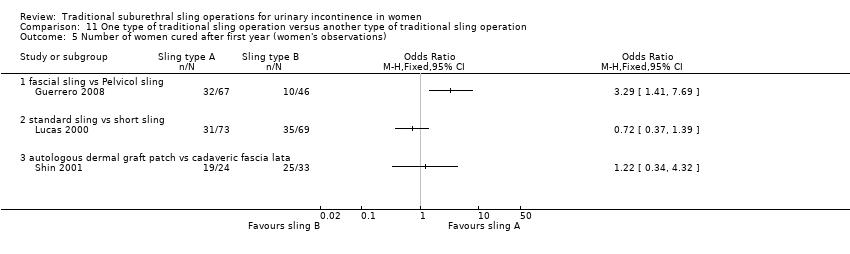
Comparison 11 One type of traditional sling operation versus another type of traditional sling operation, Outcome 5 Number of women cured after first year (women's observations).
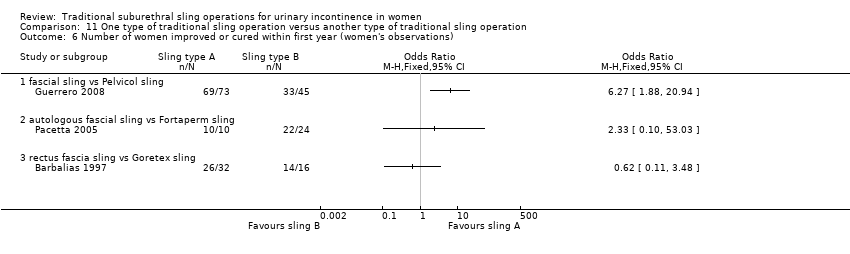
Comparison 11 One type of traditional sling operation versus another type of traditional sling operation, Outcome 6 Number of women improved or cured within first year (women's observations).

Comparison 11 One type of traditional sling operation versus another type of traditional sling operation, Outcome 7 Number of women improved or cured at 1 to 5 years (women's observations).
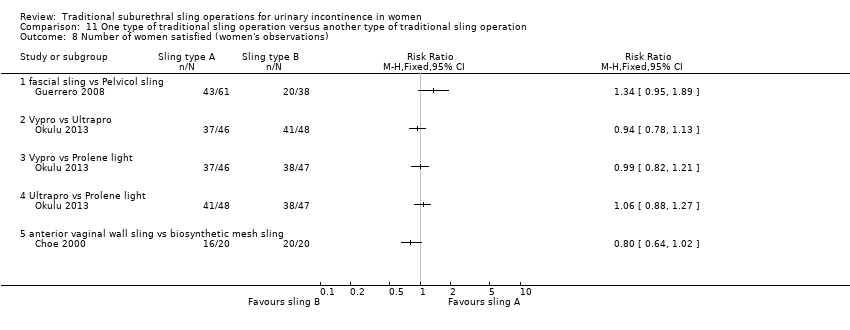
Comparison 11 One type of traditional sling operation versus another type of traditional sling operation, Outcome 8 Number of women satisfied (women's observations).

Comparison 11 One type of traditional sling operation versus another type of traditional sling operation, Outcome 9 Pad test of quantified leakage (mean weight of urine lost) within 1 year.

Comparison 11 One type of traditional sling operation versus another type of traditional sling operation, Outcome 10 Pad test of quantified leakage (mean weight of urine lost) at 1 to 5 years.

Comparison 11 One type of traditional sling operation versus another type of traditional sling operation, Outcome 11 Duration of operation (minutes).

Comparison 11 One type of traditional sling operation versus another type of traditional sling operation, Outcome 12 Blood loss (mL).

Comparison 11 One type of traditional sling operation versus another type of traditional sling operation, Outcome 13 Length of hospital stay (days).

Comparison 11 One type of traditional sling operation versus another type of traditional sling operation, Outcome 14 Perioperative surgical complications.

Comparison 11 One type of traditional sling operation versus another type of traditional sling operation, Outcome 15 Bladder perforation.

Comparison 11 One type of traditional sling operation versus another type of traditional sling operation, Outcome 16 Urinary tract infection.

Comparison 11 One type of traditional sling operation versus another type of traditional sling operation, Outcome 17 Vaginal bleeding.

Comparison 11 One type of traditional sling operation versus another type of traditional sling operation, Outcome 18 Long‐term adverse effects (wound pain).
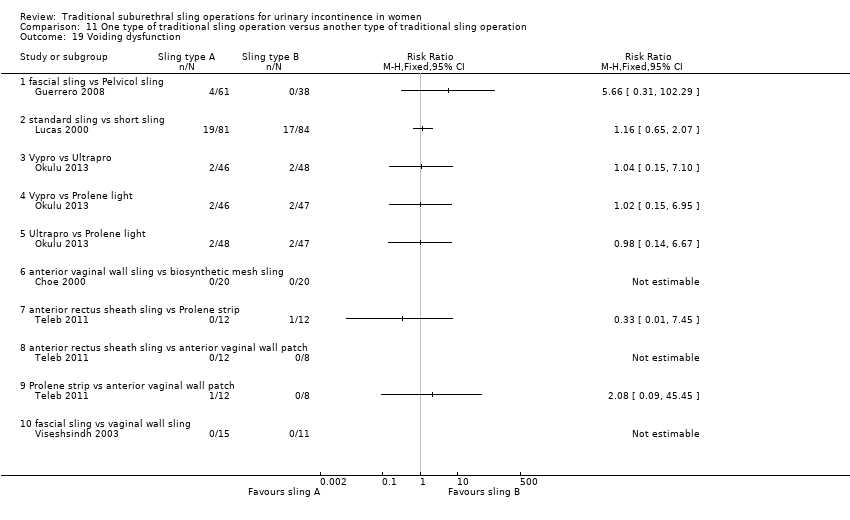
Comparison 11 One type of traditional sling operation versus another type of traditional sling operation, Outcome 19 Voiding dysfunction.

Comparison 11 One type of traditional sling operation versus another type of traditional sling operation, Outcome 20 Urinary urgency symptoms, urgency urinary incontinence.

Comparison 11 One type of traditional sling operation versus another type of traditional sling operation, Outcome 21 Detrusor overactivity (urodynamic overactivity).

Comparison 11 One type of traditional sling operation versus another type of traditional sling operation, Outcome 22 Long‐term adverse effects (release of sling required).

Comparison 11 One type of traditional sling operation versus another type of traditional sling operation, Outcome 23 Long‐term adverse effects (vaginal mesh or graft exposure).

Comparison 11 One type of traditional sling operation versus another type of traditional sling operation, Outcome 24 Condition‐specific measures to assess quality of life (ICI‐Q short form UI score at 1 year).

Comparison 11 One type of traditional sling operation versus another type of traditional sling operation, Outcome 25 Condition‐specific measures to assess quality of life (ICI‐Q short form UI score at 1 to 5 years).
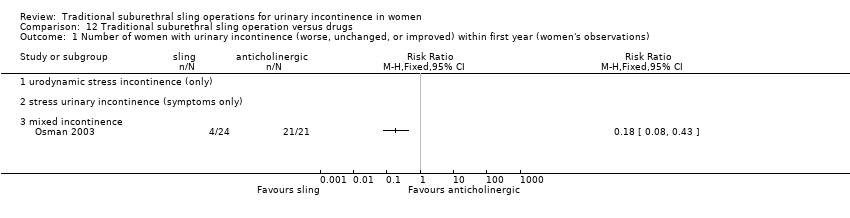
Comparison 12 Traditional suburethral sling operation versus drugs, Outcome 1 Number of women with urinary incontinence (worse, unchanged, or improved) within first year (women's observations).

Comparison 12 Traditional suburethral sling operation versus drugs, Outcome 2 Urge urinary symptoms, urgency urinary incontinence.
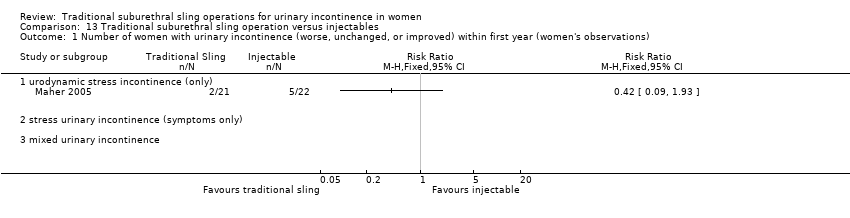
Comparison 13 Traditional suburethral sling operation versus injectables, Outcome 1 Number of women with urinary incontinence (worse, unchanged, or improved) within first year (women's observations).

Comparison 13 Traditional suburethral sling operation versus injectables, Outcome 2 Number of women with urinary incontinence (worse, unchanged, or improved) after first year (women's observations).

Comparison 13 Traditional suburethral sling operation versus injectables, Outcome 3 Number of women with urinary incontinence (clinician's observations) within first year.

Comparison 13 Traditional suburethral sling operation versus injectables, Outcome 4 CURE: number of women cured after first year (women's observations).

Comparison 13 Traditional suburethral sling operation versus injectables, Outcome 5 Voiding dysfunction.

Comparison 13 Traditional suburethral sling operation versus injectables, Outcome 6 De novo detrusor overactivity (urodynamic diagnosis).
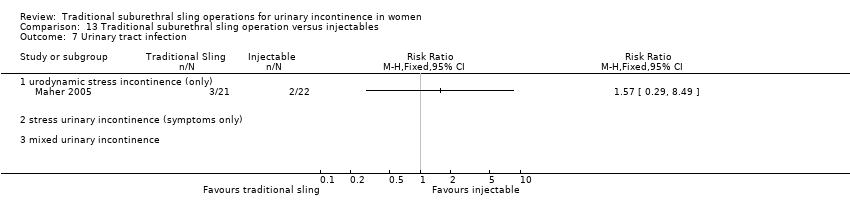
Comparison 13 Traditional suburethral sling operation versus injectables, Outcome 7 Urinary tract infection.

Comparison 13 Traditional suburethral sling operation versus injectables, Outcome 8 Repeat surgery for urinary incontinence.
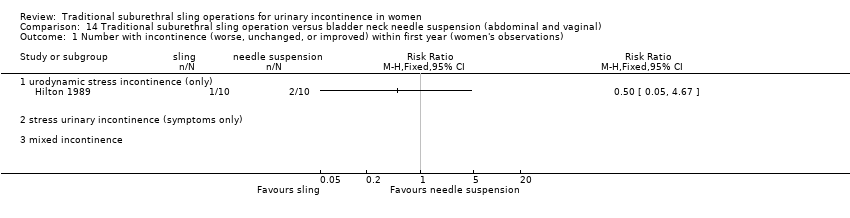
Comparison 14 Traditional suburethral sling operation versus bladder neck needle suspension (abdominal and vaginal), Outcome 1 Number with incontinence (worse, unchanged, or improved) within first year (women's observations).

Comparison 14 Traditional suburethral sling operation versus bladder neck needle suspension (abdominal and vaginal), Outcome 2 Number with incontinence (worse, unchanged, or improved) after first year (women's observations).

Comparison 14 Traditional suburethral sling operation versus bladder neck needle suspension (abdominal and vaginal), Outcome 3 CURE: number of women cured after first year (women's observations).
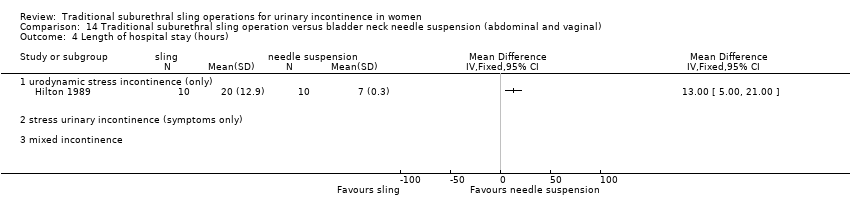
Comparison 14 Traditional suburethral sling operation versus bladder neck needle suspension (abdominal and vaginal), Outcome 4 Length of hospital stay (hours).

Comparison 14 Traditional suburethral sling operation versus bladder neck needle suspension (abdominal and vaginal), Outcome 5 Perioperative surgical complications.

Comparison 14 Traditional suburethral sling operation versus bladder neck needle suspension (abdominal and vaginal), Outcome 6 Urge urinary symptoms, urgency urinary incontinence.
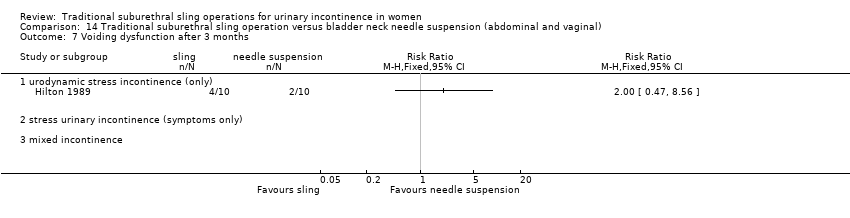
Comparison 14 Traditional suburethral sling operation versus bladder neck needle suspension (abdominal and vaginal), Outcome 7 Voiding dysfunction after 3 months.
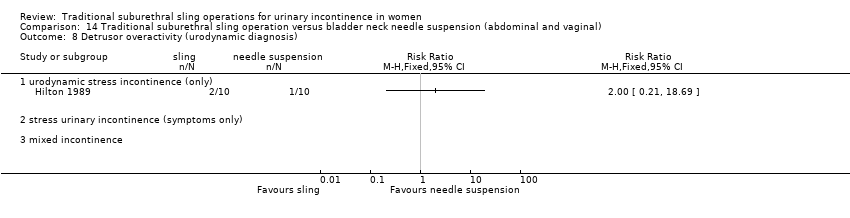
Comparison 14 Traditional suburethral sling operation versus bladder neck needle suspension (abdominal and vaginal), Outcome 8 Detrusor overactivity (urodynamic diagnosis).

Comparison 15 Traditional suburethral sling operation versus open abdominal retropubic colposuspension, Outcome 1 Number of women with urinary incontinence (worse, unchanged, or improved) within first year (women's observations).

Comparison 15 Traditional suburethral sling operation versus open abdominal retropubic colposuspension, Outcome 3 Number of women with urinary incontinence (worse, unchanged, or improved) at 1 to 5 years (women's observations).
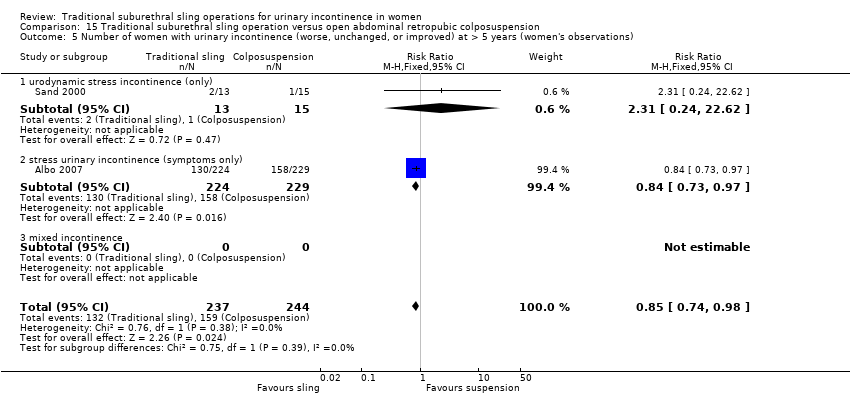
Comparison 15 Traditional suburethral sling operation versus open abdominal retropubic colposuspension, Outcome 5 Number of women with urinary incontinence (worse, unchanged, or improved) at > 5 years (women's observations).

Comparison 15 Traditional suburethral sling operation versus open abdominal retropubic colposuspension, Outcome 6 CURE: number of women cured at > 1 year (women's observations).

Comparison 15 Traditional suburethral sling operation versus open abdominal retropubic colposuspension, Outcome 7 Number of women not satisfied at > 5 years.

Comparison 15 Traditional suburethral sling operation versus open abdominal retropubic colposuspension, Outcome 10 Number of women with urinary incontinence (clinician's observations) at 1 to 5 years.

Comparison 15 Traditional suburethral sling operation versus open abdominal retropubic colposuspension, Outcome 11 Number of women with urinary incontinence (clinician's observations) at > 5 years.
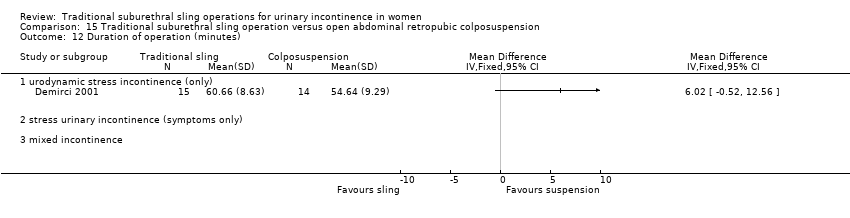
Comparison 15 Traditional suburethral sling operation versus open abdominal retropubic colposuspension, Outcome 12 Duration of operation (minutes).

Comparison 15 Traditional suburethral sling operation versus open abdominal retropubic colposuspension, Outcome 13 Time to catheter removal (days).

Comparison 15 Traditional suburethral sling operation versus open abdominal retropubic colposuspension, Outcome 14 Length of hospital stay (days).

Comparison 15 Traditional suburethral sling operation versus open abdominal retropubic colposuspension, Outcome 16 Perioperative surgical complications.
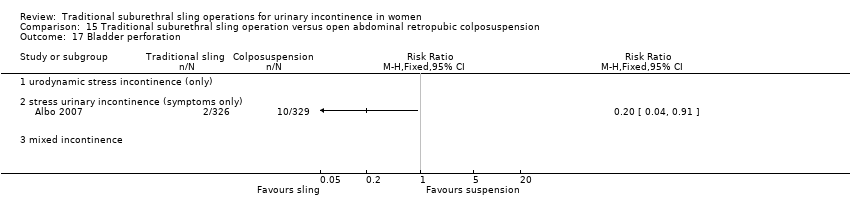
Comparison 15 Traditional suburethral sling operation versus open abdominal retropubic colposuspension, Outcome 17 Bladder perforation.
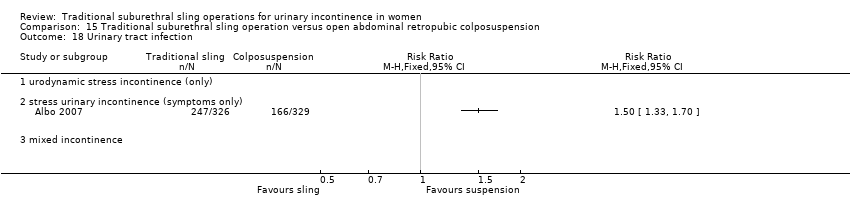
Comparison 15 Traditional suburethral sling operation versus open abdominal retropubic colposuspension, Outcome 18 Urinary tract infection.
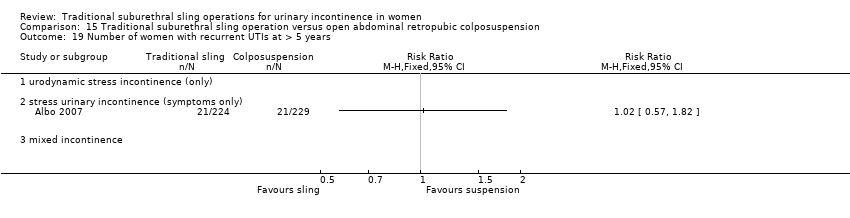
Comparison 15 Traditional suburethral sling operation versus open abdominal retropubic colposuspension, Outcome 19 Number of women with recurrent UTIs at > 5 years.
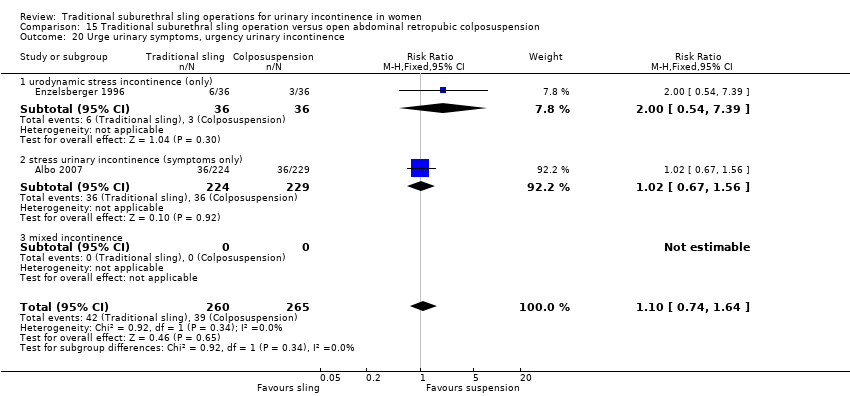
Comparison 15 Traditional suburethral sling operation versus open abdominal retropubic colposuspension, Outcome 20 Urge urinary symptoms, urgency urinary incontinence.

Comparison 15 Traditional suburethral sling operation versus open abdominal retropubic colposuspension, Outcome 21 Detrusor overactivity (urodynamic diagnosis).
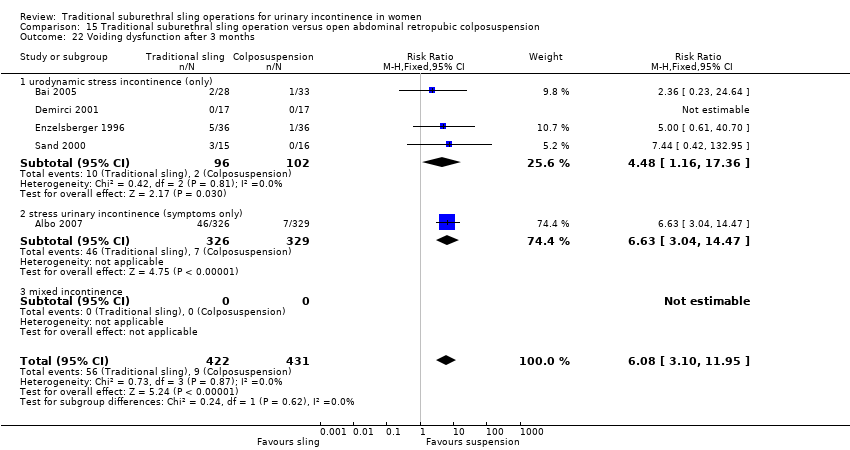
Comparison 15 Traditional suburethral sling operation versus open abdominal retropubic colposuspension, Outcome 22 Voiding dysfunction after 3 months.
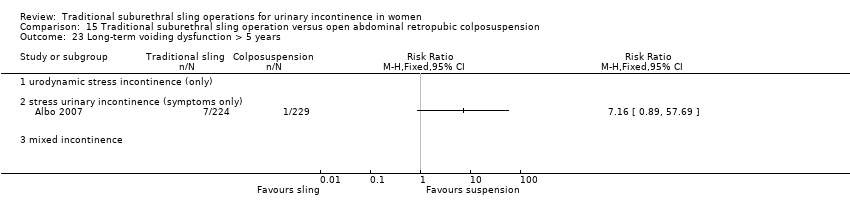
Comparison 15 Traditional suburethral sling operation versus open abdominal retropubic colposuspension, Outcome 23 Long‐term voiding dysfunction > 5 years.
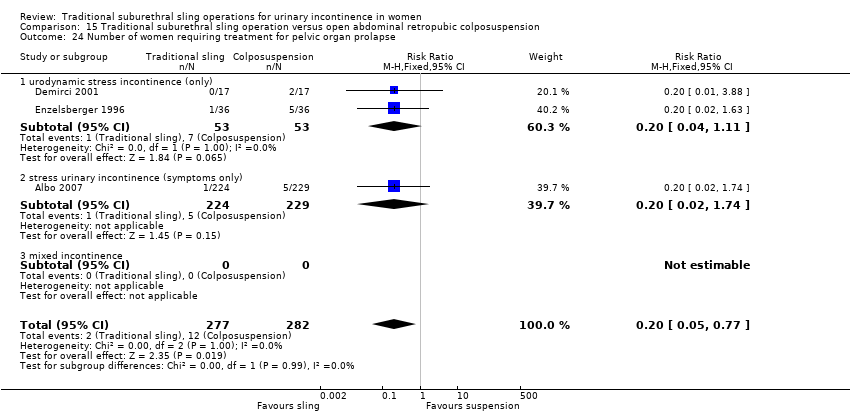
Comparison 15 Traditional suburethral sling operation versus open abdominal retropubic colposuspension, Outcome 24 Number of women requiring treatment for pelvic organ prolapse.

Comparison 15 Traditional suburethral sling operation versus open abdominal retropubic colposuspension, Outcome 25 Repeat surgery for urinary incontinence.

Comparison 15 Traditional suburethral sling operation versus open abdominal retropubic colposuspension, Outcome 26 Condition‐specific measures to assess quality of life.

Comparison 16 Traditional suburethral sling operation versus a mid‐urethral sling or tape, Outcome 1 Number of women with urinary incontinence (worse, unchanged, or improved) within first year (women's observations).

Comparison 16 Traditional suburethral sling operation versus a mid‐urethral sling or tape, Outcome 2 Number not improved (worse or unchanged) within first year (women's observations).

Comparison 16 Traditional suburethral sling operation versus a mid‐urethral sling or tape, Outcome 3 Number of women with urinary incontinence (worse, unchanged, or improved) at 1 to 5 years (women's observations).

Comparison 16 Traditional suburethral sling operation versus a mid‐urethral sling or tape, Outcome 4 Number not improved (worse or unchanged) after first year (women's observations).

Comparison 16 Traditional suburethral sling operation versus a mid‐urethral sling or tape, Outcome 5 Number of women with urinary incontinence after 5 years (women's observations).

Comparison 16 Traditional suburethral sling operation versus a mid‐urethral sling or tape, Outcome 6 Number with incontinence not improved after 5 years (women's observations).
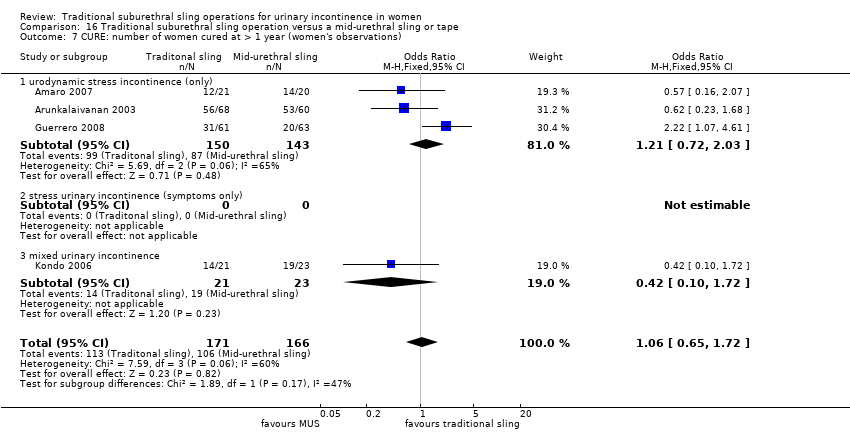
Comparison 16 Traditional suburethral sling operation versus a mid‐urethral sling or tape, Outcome 7 CURE: number of women cured at > 1 year (women's observations).

Comparison 16 Traditional suburethral sling operation versus a mid‐urethral sling or tape, Outcome 8 Repeat surgery for urinary incontinence.

Comparison 16 Traditional suburethral sling operation versus a mid‐urethral sling or tape, Outcome 9 Number of women not satisfied.

Comparison 16 Traditional suburethral sling operation versus a mid‐urethral sling or tape, Outcome 10 Pad test of quantified leakage (mean weight of urine loss).
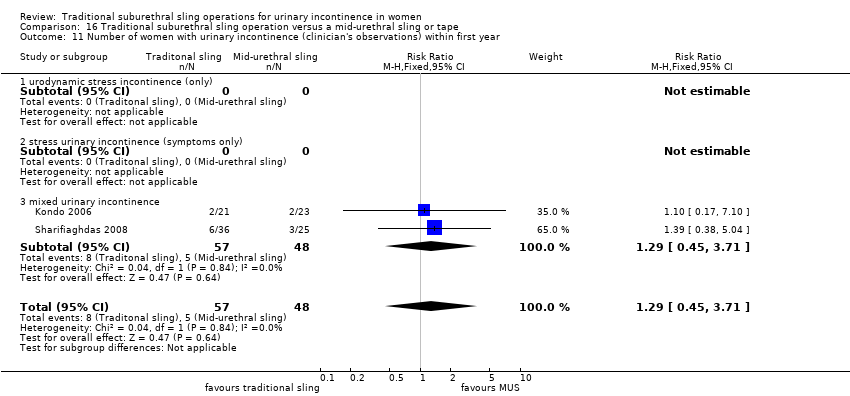
Comparison 16 Traditional suburethral sling operation versus a mid‐urethral sling or tape, Outcome 11 Number of women with urinary incontinence (clinician's observations) within first year.

Comparison 16 Traditional suburethral sling operation versus a mid‐urethral sling or tape, Outcome 12 Number of women with urinary incontinence (clinician's observations) after first year.

Comparison 16 Traditional suburethral sling operation versus a mid‐urethral sling or tape, Outcome 13 Duration of operation (minutes).

Comparison 16 Traditional suburethral sling operation versus a mid‐urethral sling or tape, Outcome 14 Length of hospital stay (days).

Comparison 16 Traditional suburethral sling operation versus a mid‐urethral sling or tape, Outcome 15 Time to catheter removal (days).

Comparison 16 Traditional suburethral sling operation versus a mid‐urethral sling or tape, Outcome 16 Perioperative surgical complications.

Comparison 16 Traditional suburethral sling operation versus a mid‐urethral sling or tape, Outcome 17 Bladder perforations.
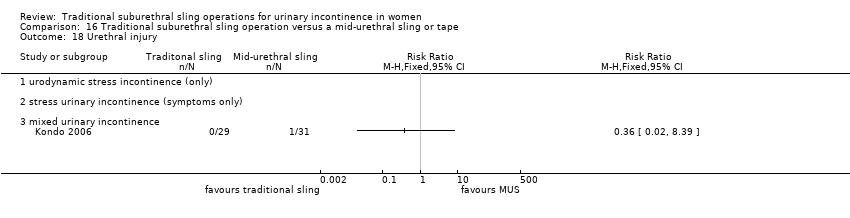
Comparison 16 Traditional suburethral sling operation versus a mid‐urethral sling or tape, Outcome 18 Urethral injury.

Comparison 16 Traditional suburethral sling operation versus a mid‐urethral sling or tape, Outcome 19 Vaginal bleeding.

Comparison 16 Traditional suburethral sling operation versus a mid‐urethral sling or tape, Outcome 20 Urinary tract infection.

Comparison 16 Traditional suburethral sling operation versus a mid‐urethral sling or tape, Outcome 21 Voiding dysfunction.

Comparison 16 Traditional suburethral sling operation versus a mid‐urethral sling or tape, Outcome 22 De novo detrusor urgency or urge symptoms.

Comparison 16 Traditional suburethral sling operation versus a mid‐urethral sling or tape, Outcome 23 De novo detrusor overactivity (urodynamic diagnosis).

Comparison 16 Traditional suburethral sling operation versus a mid‐urethral sling or tape, Outcome 24 Long‐term adverse effects (release of sling required).
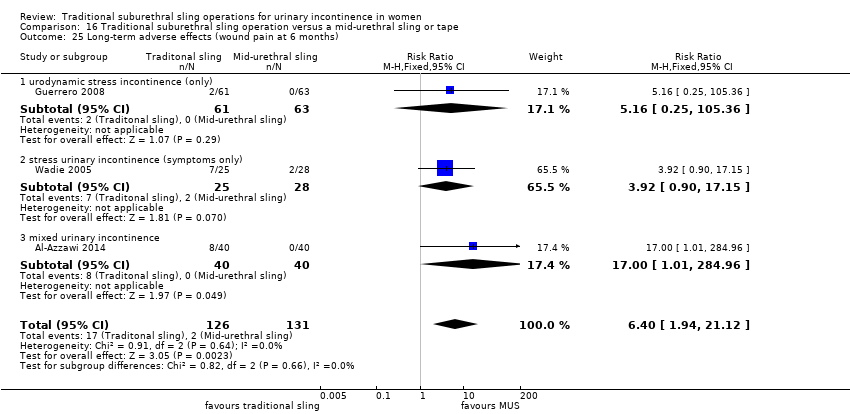
Comparison 16 Traditional suburethral sling operation versus a mid‐urethral sling or tape, Outcome 25 Long‐term adverse effects (wound pain at 6 months).
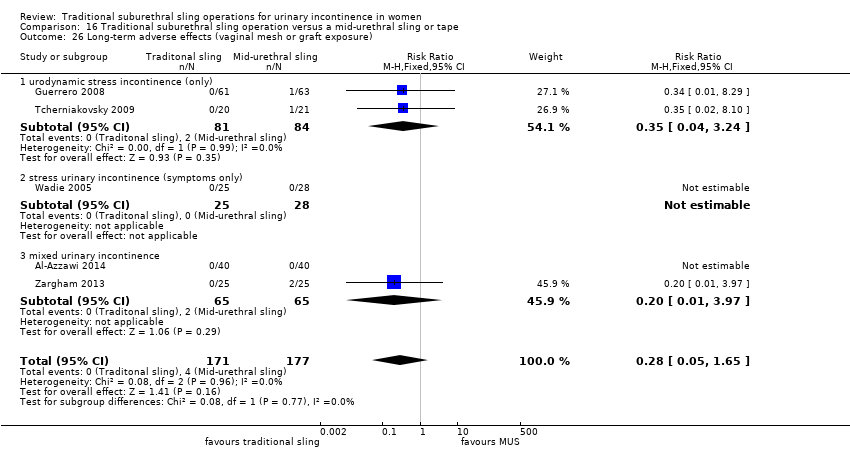
Comparison 16 Traditional suburethral sling operation versus a mid‐urethral sling or tape, Outcome 26 Long‐term adverse effects (vaginal mesh or graft exposure).

Comparison 16 Traditional suburethral sling operation versus a mid‐urethral sling or tape, Outcome 27 Condition‐specific measures to assess quality of life: UDI‐6.
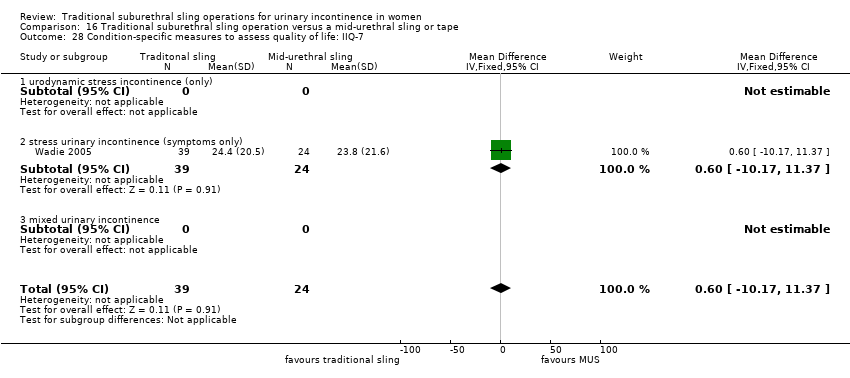
Comparison 16 Traditional suburethral sling operation versus a mid‐urethral sling or tape, Outcome 28 Condition‐specific measures to assess quality of life: IIQ‐7.

Comparison 17 Traditional suburethral sling operation versus a single‐incision sling (mini‐sling), Outcome 1 Number of women with urinary incontinence in the medium term (1 to 5 years).

Comparison 17 Traditional suburethral sling operation versus a single‐incision sling (mini‐sling), Outcome 2 Number of women not satisfied within first year.

Comparison 17 Traditional suburethral sling operation versus a single‐incision sling (mini‐sling), Outcome 3 Number of women with urinary incontinence (clinician's observations) within first year.
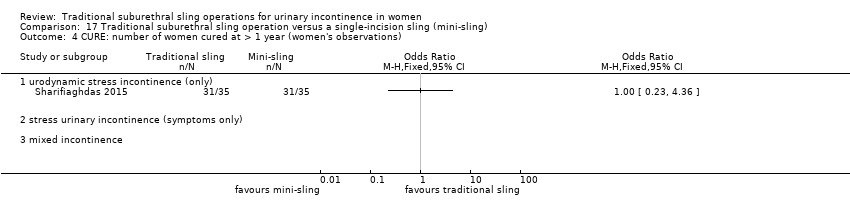
Comparison 17 Traditional suburethral sling operation versus a single‐incision sling (mini‐sling), Outcome 4 CURE: number of women cured at > 1 year (women's observations).

Comparison 17 Traditional suburethral sling operation versus a single‐incision sling (mini‐sling), Outcome 5 Bladder perforation.
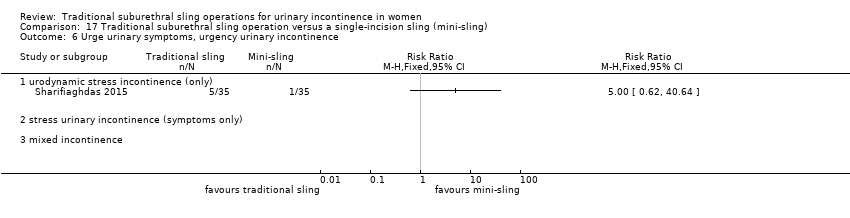
Comparison 17 Traditional suburethral sling operation versus a single‐incision sling (mini‐sling), Outcome 6 Urge urinary symptoms, urgency urinary incontinence.
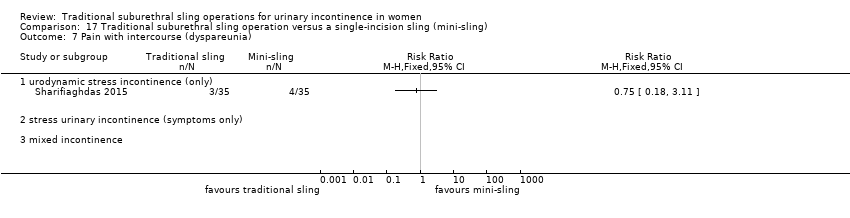
Comparison 17 Traditional suburethral sling operation versus a single‐incision sling (mini‐sling), Outcome 7 Pain with intercourse (dyspareunia).
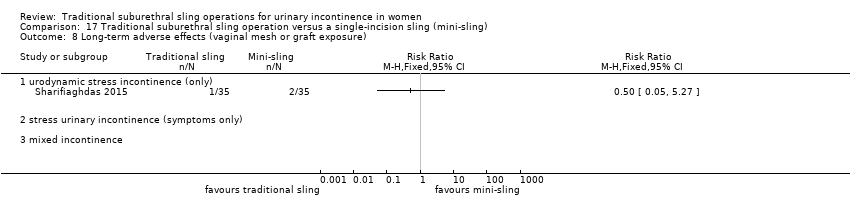
Comparison 17 Traditional suburethral sling operation versus a single‐incision sling (mini‐sling), Outcome 8 Long‐term adverse effects (vaginal mesh or graft exposure).
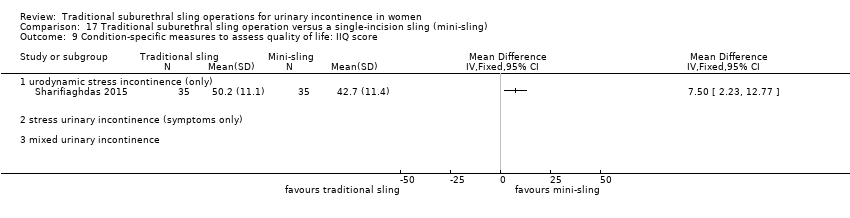
Comparison 17 Traditional suburethral sling operation versus a single‐incision sling (mini‐sling), Outcome 9 Condition‐specific measures to assess quality of life: IIQ score.
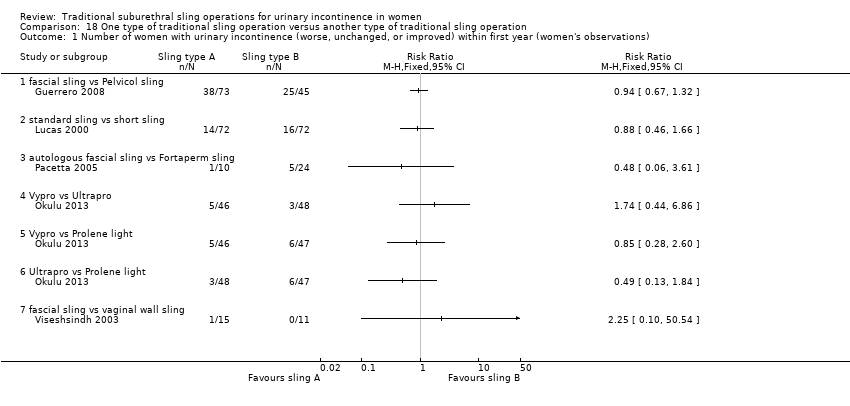
Comparison 18 One type of traditional sling operation versus another type of traditional sling operation, Outcome 1 Number of women with urinary incontinence (worse, unchanged, or improved) within first year (women's observations).
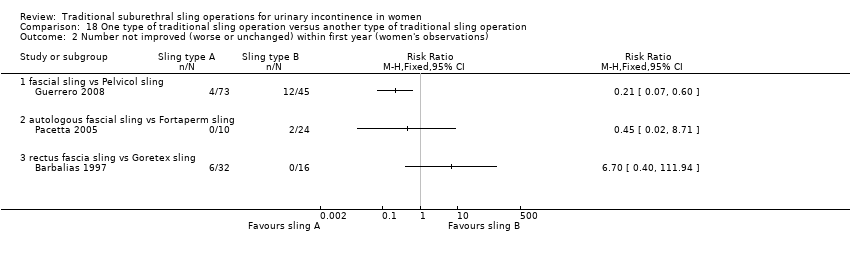
Comparison 18 One type of traditional sling operation versus another type of traditional sling operation, Outcome 2 Number not improved (worse or unchanged) within first year (women's observations).
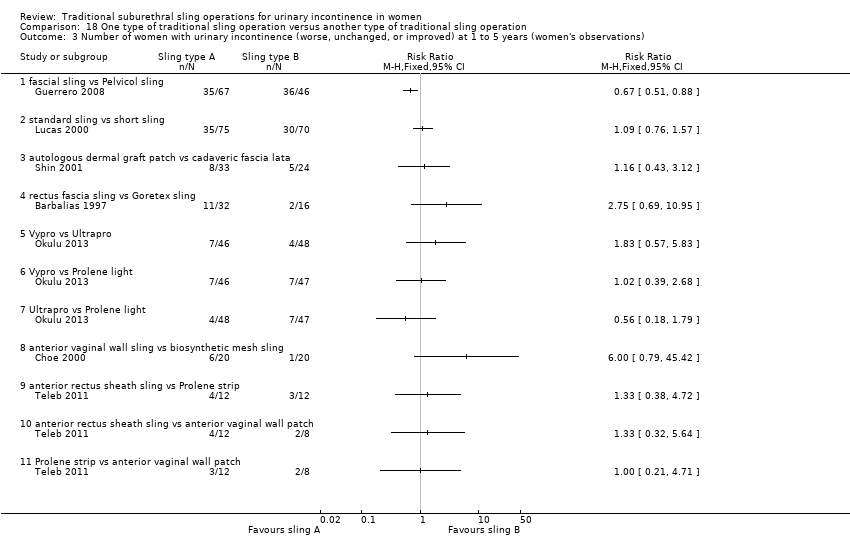
Comparison 18 One type of traditional sling operation versus another type of traditional sling operation, Outcome 3 Number of women with urinary incontinence (worse, unchanged, or improved) at 1 to 5 years (women's observations).

Comparison 18 One type of traditional sling operation versus another type of traditional sling operation, Outcome 4 Number not improved (worse or unchanged) after first year (women's observations).

Comparison 18 One type of traditional sling operation versus another type of traditional sling operation, Outcome 5 Number of women with urinary incontinence (worse, unchanged, or improved) after 5 years (women's observations).

Comparison 18 One type of traditional sling operation versus another type of traditional sling operation, Outcome 6 CURE: number of women with urinary incontinence > 1 year (women's observations).

Comparison 18 One type of traditional sling operation versus another type of traditional sling operation, Outcome 7 Number of women not satisfied.

Comparison 18 One type of traditional sling operation versus another type of traditional sling operation, Outcome 8 Pad test of quantified leakage (mean weight of urine loss) at 1 year.

Comparison 18 One type of traditional sling operation versus another type of traditional sling operation, Outcome 9 Pad test of quantified leakage (mean weight of urine loss) at 1 to 5 years.
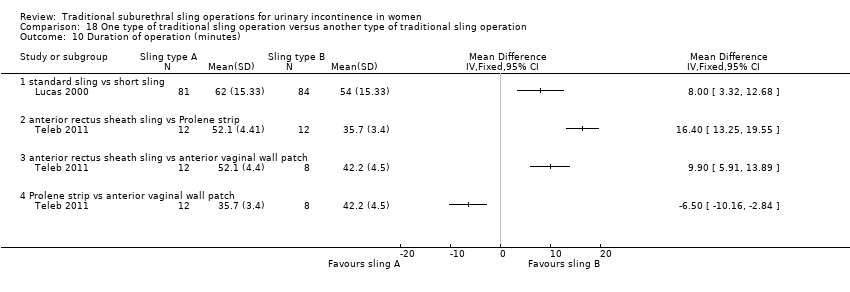
Comparison 18 One type of traditional sling operation versus another type of traditional sling operation, Outcome 10 Duration of operation (minutes).

Comparison 18 One type of traditional sling operation versus another type of traditional sling operation, Outcome 11 Blood loss (mL).
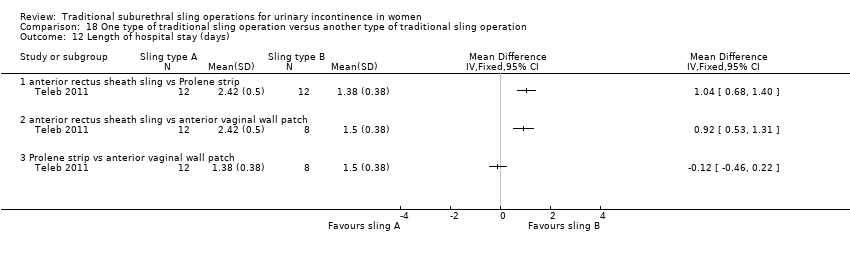
Comparison 18 One type of traditional sling operation versus another type of traditional sling operation, Outcome 12 Length of hospital stay (days).
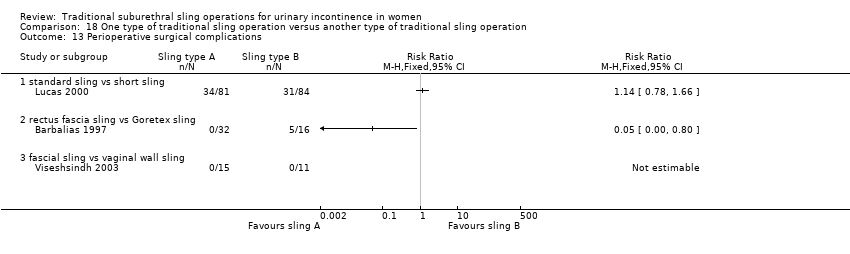
Comparison 18 One type of traditional sling operation versus another type of traditional sling operation, Outcome 13 Perioperative surgical complications.

Comparison 18 One type of traditional sling operation versus another type of traditional sling operation, Outcome 14 Bladder perforation.
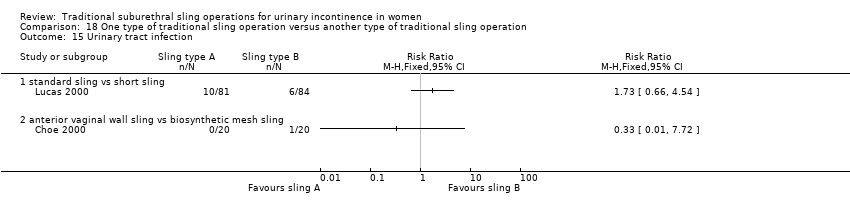
Comparison 18 One type of traditional sling operation versus another type of traditional sling operation, Outcome 15 Urinary tract infection.
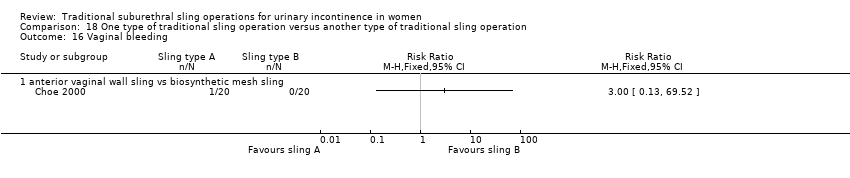
Comparison 18 One type of traditional sling operation versus another type of traditional sling operation, Outcome 16 Vaginal bleeding.

Comparison 18 One type of traditional sling operation versus another type of traditional sling operation, Outcome 17 Long‐term adverse effects (wound pain).

Comparison 18 One type of traditional sling operation versus another type of traditional sling operation, Outcome 18 Voiding dysfunction.
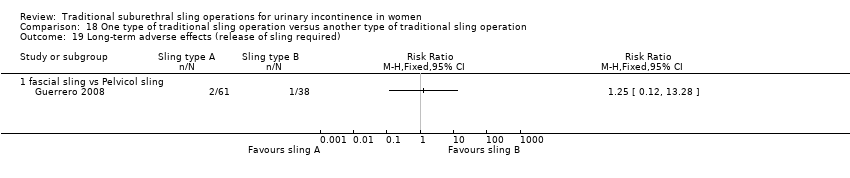
Comparison 18 One type of traditional sling operation versus another type of traditional sling operation, Outcome 19 Long‐term adverse effects (release of sling required).

Comparison 18 One type of traditional sling operation versus another type of traditional sling operation, Outcome 20 De novo detrusor urgency or urge symptoms or detrusor overactivity.
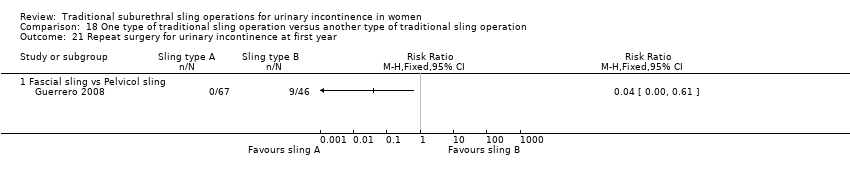
Comparison 18 One type of traditional sling operation versus another type of traditional sling operation, Outcome 21 Repeat surgery for urinary incontinence at first year.
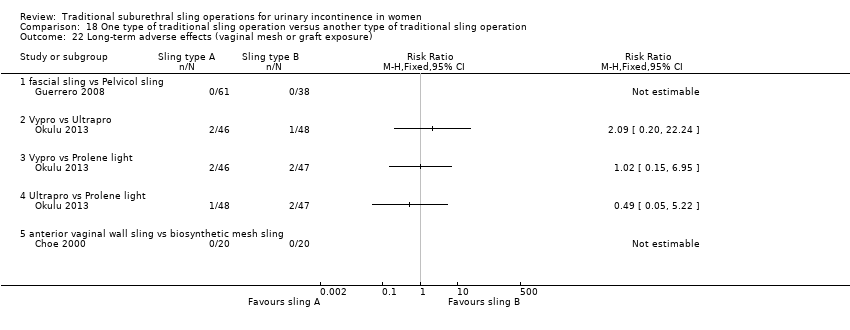
Comparison 18 One type of traditional sling operation versus another type of traditional sling operation, Outcome 22 Long‐term adverse effects (vaginal mesh or graft exposure).

Comparison 18 One type of traditional sling operation versus another type of traditional sling operation, Outcome 23 Condition‐specific measures to assess quality of life (ICI‐Q short form UI score at 1 year).

Comparison 18 One type of traditional sling operation versus another type of traditional sling operation, Outcome 24 Condition‐specific measures to assess quality of life (ICI‐Q short form UI score at 1 to 5 years).
| Traditional suburethral sling operation versus no treatment or sham operation | ||||||
| Patient or population: women with urinary incontinence | ||||||
| Outcomes | Illustrative comparative risks* (95% CI) | Relative effect | Number of participants | Quality of the evidence | Comments | |
| Assumed risk | Corresponding risk | |||||
| No treatment or sham treatment | Sling | |||||
| Number of continent (dry) women (any definition) in the medium term (1 to 5 years) | Not reported | |||||
| Repeat surgery for urinary incontinence | Not reported | |||||
| Perioperative surgical complications | Not reported | |||||
| Long‐term adverse effects | Not reported | |||||
| Condition‐specific quality of life | Not reported | |||||
| *The basis for the assumed risk (e.g. the median control group risk across studies) is provided in footnotes. The corresponding risk (and its 95% confidence interval) is based on the assumed risk in the comparison group and the relative effect of the intervention (and its 95% CI). | ||||||
| GRADE Working Group grades of evidence. | ||||||
| Traditional suburethral sling operation versus conservative management | ||||||
| Patient or population: women with urinary incontinence | ||||||
| Outcomes | Illustrative comparative risks* (95% CI) | Relative effect | Number of participants | Quality of the evidence | Comments | |
| Assumed risk | Corresponding risk | |||||
| Conservative treatment | Sling | |||||
| Number of continent (dry) women (any definition) in the medium term (1 to 5 years) | Not reported | |||||
| Repeat surgery for urinary incontinence | Not reported | |||||
| Perioperative surgical complications | Not reported | |||||
| Long‐term adverse effects | Not reported | |||||
| Condition‐specific quality of life | Not reported | |||||
| *The basis for the assumed risk (e.g. the median control group risk across studies) is provided in footnotes. The corresponding risk (and its 95% confidence interval) is based on the assumed risk in the comparison group and the relative effect of the intervention (and its 95% CI). | ||||||
| GRADE Working Group grades of evidence. | ||||||
| Traditional suburethral sling operation versus drugs | ||||||
| Patient or population: women with urinary incontinence | ||||||
| Outcomes | Illustrative comparative risks* (95% CI) | Relative effect | Number of participants | Quality of the evidence | Comments | |
| Assumed risk | Corresponding risk | |||||
| Drugs | Sling | |||||
| Number of continent (dry) women (any definition) in the medium term (1 to 5 years) | Not reported | |||||
| Repeat surgery for urinary incontinence | Not reported | |||||
| Perioperative surgical complications | Not reported | |||||
| Long‐term adverse effects | Not reported | |||||
| Condition‐specific quality of life | Not reported | |||||
| *The basis for the assumed risk (e.g. the median control group risk across studies) is provided in footnotes. The corresponding risk (and its 95% confidence interval) is based on the assumed risk in the comparison group and the relative effect of the intervention (and its 95% CI). | ||||||
| GRADE Working Group grades of evidence. | ||||||
| Traditional suburethral sling operation versus injectables | ||||||
| Patient or population: women with urinary incontinence | ||||||
| Outcomes | Illustrative comparative risks* (95% CI) | Relative effect | Number of participants | Quality of the evidence | Comments | |
| Assumed risk | Corresponding risk | |||||
| Injectable | Sling | |||||
| Number of continent (dry) women (any definition) in the medium term (1 to 5 years) | 714 per 1000 | 967 per 1000 (583 to 998) | OR 11.57 (0.56 to 239.7) | 43 | ⊕⊝⊝⊝ | 252 more women, per 1000, with traditional sling (131 fewer to 284 more) |
| Repeat surgery for urinary incontinence ‐ urodynamic stress incontinence (only) | 91 per 1000 | 47 per 1000 (5 to 487) | RR 0.52 (0.05 to 5.36) | 43 | ⊕⊝⊝⊝ | 44 fewer women, per 1000, with traditional sling (86 fewer to 396 more) |
| Perioperative surgical complications | 91 per 1000 | 143 per 1000 | RR 1.57 | 43 | ⊕⊝⊝⊝ | 52 more women, per 1000, with traditional sling (65 fewer to 681 more) |
| Long‐term adverse effects | Not reported | |||||
| Condition‐specific quality of life | Not reported | |||||
| *The basis for the assumed risk (e.g. the median control group risk across studies) is provided in footnotes. The corresponding risk (and its 95% confidence interval) is based on the assumed risk in the comparison group and the relative effect of the intervention (and its 95% CI). | ||||||
| GRADE Working Group grades of evidence. | ||||||
| aDowngraded one level due to serious risk of bias (unclear for sequence generation, allocation concealment, and blinding) and two levels for imprecision (95% CI very wide, 0.56 to 239.74; crosses line of no effect). bDowngraded two levels due to very serious imprecision: single trial with small sample size. | ||||||
| Traditional suburethral sling operation versus anterior repair | ||||||
| Patient or population: women with urinary incontinence | ||||||
| Outcomes | Illustrative comparative risks* (95% CI) | Relative effect | Number of participants | Quality of the evidence | Comments | |
| Assumed risk | Corresponding risk | |||||
| Anterior repair | Sling | |||||
| Number of continent (dry) women (any definition) in the medium term (1 to 5 years) | Not reported | |||||
| Repeat surgery for urinary incontinence | Not reported | |||||
| Perioperative surgical complications | Not reported | |||||
| Long‐term adverse effects | Not reported | |||||
| Condition‐specific quality of life | Not reported | |||||
| *The basis for the assumed risk (e.g. the median control group risk across studies) is provided in footnotes. The corresponding risk (and its 95% confidence interval) is based on the assumed risk in the comparison group and the relative effect of the intervention (and its 95% CI). | ||||||
| GRADE Working Group grades of evidence. | ||||||
| Traditional suburethral sling operation versus bladder neck needle suspension (abdominal and vaginal) | ||||||
| Patient or population: women with urinary incontinence | ||||||
| Outcomes | Illustrative comparative risks* (95% CI) | Relative effect | Number of participants | Quality of the evidence | Comments | |
| Assumed risk | Corresponding risk | |||||
| Bladder neck needle suspension | Sling | |||||
| Number of continent (dry) women (any definition) in the medium term (1 to 5 years) | 700 per 1000 | 900 per 1000 (435 to 991) | OR 3.86 0.33 to 45.57 | 20 | ⊕⊝⊝⊝ | 200 more women, per 1000, with traditional sling (265 fewer to 291 more) |
| Repeat surgery for urinary incontinence | Not reported | |||||
| Perioperative surgical complications ‐ urodynamic stress incontinence (only) | 200 per 1000 | 900 per 1000 | RR 4.5 | 20 | ⊕⊝⊝⊝ | 700 more women, per 1000, with traditional sling (56 fewer to 2962 more) |
| Long‐term adverse effects | Not reported | |||||
| Condition‐specific quality of life | Not reported | |||||
| *The basis for the assumed risk (e.g. the median control group risk across studies) is provided in footnotes. The corresponding risk (and its 95% confidence interval) is based on the assumed risk in the comparison group and the relative effect of the intervention (and its 95% CI). | ||||||
| GRADE Working Group grades of evidence. | ||||||
| aDowngraded two levels for risk of bias (evidence comes from a single trial that was judged to be unclear for allocation concealment and blinding) and two levels for imprecision (95% CI very wide). | ||||||
| Traditional suburethral sling operation versus open abdominal retropubic suspension | ||||||
| Patient or population: women with urinary incontinence | ||||||
| Outcomes | Illustrative comparative risks* (95% CI) | Relative effect | Number of participants | Quality of the evidence | Comments | |
| Assumed risk | Corresponding risk | |||||
| Open abdominal retropubic suspension | Sling | |||||
| Number of continent (dry) women (any definition) in the medium term (1 to 5 years) | 589 per 1000 | 711 per 1000 (638 to 774) | OR 1.70 (1.22 to 2.37) | 687 (4 RCTs) | ⊕⊕⊕⊝ | 120 more dry women, per 1000, with traditional sling (47 more to 186 more) |
| Repeat surgery for urinary incontinence‐stress urinary incontinence (symptoms only) | 119 per 1000 | 18 per 1000 | RR 0.15 (0.05 to 0.42) | 450 | ⊕⊕⊕⊕ | 101 fewer women having repeat continence surgery, per 1000, with traditional sling (113 fewer to 69 fewer) |
| Perioperative surgical complications | 95 per 1000 | 118 per 1000 | RR 1.24 | 792 | ⊕⊝⊝⊝ | 23 more women, per 1000, with traditional sling (16 fewer to 82 more) |
| Long‐term adverse effects | 92 per 1000 | 94 per 1000 | RR 1.02 (0.57 to 1.82) | 453 | ⊕⊕⊝⊝ | 2 more women, per 1000, with traditional sling (39 fewer to 75 more) |
| Condition‐specific quality of life | Mean IIQ score in the control group was 44.8 | Mean condition‐specific quality of life in the intervention groups was | 453 | ⊕⊝⊝⊝ | Another trial reported no evidence of a difference between colposuspension groups and sling groups in IIQ and UDI scores but reported no actual numbers | |
| *The basis for the assumed risk (e.g. the median control group risk across studies) is provided in footnotes. The corresponding risk (and its 95% confidence interval) is based on the assumed risk in the comparison group and the relative effect of the intervention (and its 95% CI). | ||||||
| GRADE Working Group grades of evidence. | ||||||
| aDowngraded one level due to serious risk of bias (unclear randomisation and allocation concealment in two of the smaller trials), but the trial carrying 90% of weight in the meta‐analysis was judged to have low risk of selection bias. bDowngraded one level for risk of bias (sequence generation was unclear in one‐fourth of trials and allocation concealment was unclear in three‐quarters of trials taking part in the meta‐analysis; participants were not blinded) and one level for imprecision (95% confidence interval was very wide). cDowngraded two levels for imprecision (95% confidence interval was very wide; 0.57 to 1.82). dDowngraded two levels for risk of bias (sequence generation and allocation concealment were judged to be "low risk"; blinding of participants was judged to be "high risk") and two levels for imprecision (95% confidence interval was very wide; ‐11.96 to 15.36). | ||||||
| Traditional suburethral sling operation versus laparoscopic colposuspension | ||||||
| Patient or population: women with urinary incontinence | ||||||
| Outcomes | Illustrative comparative risks* (95% CI) | Relative effect | Number of participants | Quality of the evidence | Comments | |
| Assumed risk | Corresponding risk | |||||
| Laparoscopic procedures | Sling | |||||
| Number of continent (dry) women (any definition) in the medium term (1 to 5 years) | Not reported | |||||
| Repeat surgery for urinary incontinence | Not reported | |||||
| Perioperative surgical complications | Not reported | |||||
| Voiding dysfunction | Not reported | |||||
| Long‐term adverse effects | Not reported | |||||
| Condition‐specific quality of life | Not reported | |||||
| *The basis for the assumed risk (e.g. the median control group risk across studies) is provided in footnotes. The corresponding risk (and its 95% confidence interval) is based on the assumed risk in the comparison group and the relative effect of the intervention (and its 95% CI). | ||||||
| GRADE Working Group grades of evidence. | ||||||
| Traditional suburethral sling operation versus a mid‐urethral sling or tape | ||||||
| Patient or population: women with urinary incontinence | ||||||
| Outcomes | Illustrative comparative risks* (95% CI) | Relative effect | Number of participants | Quality of the evidence | Comments | |
| Assumed risk | Corresponding risk | |||||
| Minimally invasive sling operation | Traditional sling | |||||
| Number of continent (dry) women (any definition) in the medium term (1 to 5 years) | 737 per 1000 | 652 per 1000 (552 to 741) | OR 0.67 (0.44 to 1.02) | 445 (6 RCTs) | ⊕⊕⊕⊝ | 85 fewer women, per 1000, with traditional sling (185 fewer to 4 more) |
| Repeat surgery for urinary incontinence ‐ urodynamic stress incontinence (only) | One trial reported the numbers of women having repeat continence surgery at 10‐year follow‐up: traditional sling: 0/67; mid‐urethral sling: 2/69 | 136 | ⊕⊕⊝⊝ | |||
| Perioperative surgical complications | 193 per 1000 | 336 per 1000 | RR 1.74 | 293 | ⊕⊕⊝⊝ | 143 more women, per 1000, with traditional sling (31 more to 309 more) |
| Long‐term adverse effects | 25 per 1000 | 62 per 1000 | RR 2.53 | 326 | ⊕⊝⊝⊝ | 38 more women, per 1000, with traditional sling (3 fewer to 157 more) |
| Condition‐specific quality of life | Mean IIQ‐7 score in the control group was 24.4 | Mean condition‐specific quality of life score in the intervention groups was | 63 | ⊕⊝⊝⊝ | Eight other trials reported some measure of QoL but the data were unsuitable for met‐analysis. Overall, there was no evidence of a difference between groups in QoL scores | |
| *The basis for the assumed risk (e.g. the median control group risk across studies) is provided in footnotes. The corresponding risk (and its 95% confidence interval) is based on the assumed risk in the comparison group and the relative effect of the intervention (and its 95% CI). | ||||||
| GRADE Working Group grades of evidence. | ||||||
| 1Downgraded one level due to serious risk of bias: 2/6 trials had high risk of selection bias. 2Downgraded two levels due to very serious imprecision: single study with small sample size. 3Downgraded two levels for risk of bias (sequence generation and allocation concealment were high or unclear risk in all four trials taking part in the meta‐analysis). 4Downgraded two levels for risk of bias (sequence generation and allocation concealment were high or unclear risk in two of three trials taking part in the meta‐analysis) and two levels for imprecision (95% confidence interval was very wide: 0.87 to 7.35). 5Downgraded two levels for risk of bias (sequence generation was judged to be high risk, and allocation concealment was judged to be low risk; outcome data were incomplete) and two levels for imprecision (95% confidence interval was very wide: ‐10.17 to 11.37). | ||||||
| Traditional suburethral sling operation versus a single‐incision sling (mini‐sling) | ||||||
| Patient or population: women with urinary incontinence | ||||||
| Outcomes | Illustrative comparative risks* (95% CI) | Relative effect | Number of participants | Quality of the evidence | Comments | |
| Assumed risk | Corresponding risk | |||||
| Number of continent (dry) women (any definition) in the medium term (1 to 5 years) | 886 per 1000 | 886 per 1000 (641 to 971) | OR 1.00 (0.23 to 4.36) | 70 | ⊕⊝⊝⊝ | 0 fewer women, per 1000, with traditional sling (245 fewer to 86 more) |
| Repeat surgery for urinary incontinence | not reported | |||||
| Perioperative surgical complications ‐ bladder perforation | 0 per 1000 | 0 per 1000 (0 to 0) | RR 3 (0.13 to 71.22) | 70 | ⊕⊝⊝⊝ | |
| Long‐term adverse effects | not reported | |||||
| Condition‐specific quality of life IIQ | Mean IIQ score in the control group was 42.7 | Mean condition‐specific quality of life score in the intervention groups was 50.2 higher (2.23 higher to 12.77 higher) | 70 | ⊕⊝⊝⊝ | Based on mean IIQ score, quality of life was worse in the traditional sling group compared with the mini‐sling group | |
| *The basis for the assumed risk (e.g. the median control group risk across studies) is provided in footnotes. The corresponding risk (and its 95% confidence interval) is based on the assumed risk in the comparison group and the relative effect of the intervention (and its 95% CI). | ||||||
| GRADE Working Group grades of evidence. | ||||||
| aDowngraded two levels due to very serious risk of bias: unclear randomisation and inadequate blinding. bDowngraded two levels due to very serious imprecision: single trial, small sample size, wide 95% confidence intervals. | ||||||
| One type of traditional sling operation versus another type of traditional sling operation | ||||||
| Patient or population: women with urinary incontinence | ||||||
| Outcomes | Illustrative comparative risks* (95% CI) | Relative effect | Number of participants | Quality of the evidence | Comments | |
| Assumed risk | Corresponding risk | |||||
| Another type of traditional sling | One type of traditional sling | |||||
| Number of continent (dry) women (any definition) in the medium term (1 to 5 years) | Not estimable | 749 | ⊕⊝⊝⊝ | Results not pooled (Analysis 11.2) | ||
| Repeat surgery for urinary incontinence at first year Fascial sling vs Pelvicol sling | 196 per 1000 | 8 per 1000 (0 to 119) | RR 0.04 (0.00 to 0.61) | 113 | ⊕⊕⊝⊝2 | 188 fewer women, per 1000, with fascial sling (0 fewer to 76 fewer) (Analysis 11.4 |
| Perioperative surgical complications | Not estimable | 239 | ⊕⊝⊝⊝ | Results not pooled (Analysis 11.14) | ||
| Long‐term adverse effects | Not estimable | 421 | ⊕⊝⊝⊝ | Results not pooled (Analysis 11.23) | ||
| Condition‐specific quality of life | Not estimable | 282 | ⊕⊝⊝⊝ | Results not pooled* (Analysis 11.25) | ||
| *The basis for the assumed risk (e.g. the median control group risk across studies) is provided in footnotes. The corresponding risk (and its 95% confidence interval) is based on the assumed risk in the comparison group and the relative effect of the intervention (and its 95% CI). | ||||||
| GRADE Working Group grades of evidence. | ||||||
| 1Downgraded two levels for imprecision (Analysis 11.2) and two levels for heterogeneity, as the trials used different materials for the traditional sling procedure. 2Downgraded two levels for imprecision (Analysis 11.4) 3Downgraded one level for risk of bias (sequence generation was judged to be at low risk of bias in two of three trials and unclear in the third trial; allocation concealment was unclear in two of three trials). Blinding (performance bias and detection bias) was judged to be unclear (two of three) or high risk (one of three). Downgraded two levels for heterogeneity, as the trials used three different materials for the traditional sling procedure, and one level for inconsistency, as 95% CIs did not overlap (Analysis 11.14). 4Downgraded two levels for heterogeneity, as the trials used four different materials for the traditional sling procedure, and one level for imprecision, as the 95% CIs were very wide (Analysis 11.23). 5Downgraded two levels for heterogeneity, as the trials used three different materials for the traditional sling procedure, and one level for inconsistency, as 95% CIs did not overlap (Analysis 11.25). * Data from two other trials were identified and are reported narratively in the text. These two trials did not report their data in a form suitable for meta‐analysis | ||||||
| Trial ID | Definition of outcome | Notes |
| WOMAN‐REPORTED | ||
| Overall success defined as no self‐reported symptoms of UI, no incontinence on 3‐day diary, negative stress test, no re‐treatment (combined outcome). Failure (self‐reported UI) at 5 years only (woman‐reported) | Also combined outcome before 5 years | |
| Cure defined as complete dryness with no usage of pads (woman‐reported) | ||
| Cure of incontinence defined as a quality of life (QoL) improvement of 90% and/or patient‐determined continent status as dry (woman‐reported) | Questionnaire‐based | |
| Dry (symptom‐free) patients (woman‐reported) | ||
| Assessment of cure not defined. Data abstracted from this trial therefore assumed to be woman‐reported | ||
| Cure stated as subjective (woman‐reported) at 24 months' follow‐up Objective (urodynamic diagnosis, pad test (clinician‐reported)) at 3 months | Also clinician‐reported outcome at 3 months | |
| Subjective cure consistent with complete dryness or a few drops of water with strong exercises (assumed to be woman‐reported) | Also separate clinician‐reported outcome | |
| Success rate measured by recurrence of stress leakage as reported in patient questionnaire (woman‐reported) | ||
| Subjective success: no or occasional (less than once a week) stress incontinence (woman‐reported) | Also separate clinician‐reported outcome | |
| Cure defined as subjective (history: woman‐reported) | Also separate clinician‐reported outcome | |
| Cure defined as of some degree of SUI at 1 year after surgery (woman‐reported) | ||
| Success rate (dry) (method unspecified: assumed woman‐reported) | ||
| Cure rate (method unspecified: assumed woman‐reported) | ||
| Stress urinary incontinence (method unspecified: assumed woman‐reported) | ||
| QUANTITATIVE | ||
| Cure = dry pads, improvement = 1 wet pad, failure ≥ 1 wet pad per day (quantitative) | Satisfaction separately measured by questionnaire | |
| Subjective cure assessed via comparison between pre‐operative and postoperative Incontinence Impact Questionnaire (IIQ), Urinary Distress Inventory (UDI) (quantitative) | Also separate clinician‐reported outcome | |
| Cure defined as no pad use (quantitative) | ||
| Subjective improvement only; subjective patient evaluations included QoL questionnaire, incontinence diary, pain and global outcome assessments (quantitative) | Also separate clinician‐reported outcome | |
| Objective cure defined as 1‐hour pad test ≤ 2 grams (quantitative) | Also separate clinician‐reported outcome | |
| Women declared objectively cured when they had a postoperative pad test < 8 grams (quantitative) | ||
| Objective assessment via 48‐hour frequency volume chart, 48‐hour pad test, and standardised stress test. Surgery was considered successful when there was no postoperative SUI (patient was dry (quantitative)) | Also separate clinician‐reported outcome | |
| CLINICIAN‐REPORTED | ||
| No leakage of urine during stress test and urodynamic testing (clinician‐reported) | ||
| Cure defined as complete freedom from SUI (clinician‐reported) | ||
| Urine loss during cough‐stress test defined as persistent stress incontinence (clinician‐assessed) | ||
| Objective cure by stress test, voiding dysfunction by urodynamic assessment if incontinence seen (clinician‐reported) | Also separate quantitative outcome | |
| Cure stated as objective (urodynamic diagnosis, pad test (clinician‐reported)) at 3 months | Also woman‐reported outcome at 24 months | |
| Objective cure defined as complete absence of leakage during cough‐stress test with 250 or 300 mL of water in the bladder (clinician‐reported) | Also separate woman‐reported outcome | |
| Objective success: no leakage due to SUI on repeat urodynamic study (clinician‐reported) | Also separate woman‐reported outcome | |
| Objective outcome assessment: urine loss via a provocative pad test (clinician‐reported) | Also separate quantitative outcome (improvement only) | |
| Cure defined as objective (urodynamic: clinician‐reported) | Also separate woman‐reported outcome | |
| Objective cure defined as negative cough‐induced stress test with full bladder (≥ 250 mL filled) in lithotomy and standing positions (clinician‐reported) | Also separate quantitative outcome | |
| Objective assessment via 48‐hour frequency volume chart, 48‐hour pad test, and standardised stress test. Surgery considered successful when stress test was negative (clinician‐reported) and postoperative cystocoele was < grade 2 | Also separate quantitative outcome | |
| COMBINED WOMAN‐ AND CLINICIAN‐REPORTED | ||
| Overall success defined as no self‐reported symptoms of UI, no incontinence on 3‐day diary, negative stress test, no re‐treatment (combined outcome). Failure (self‐reported UI) at 5 years only (woman‐reported) | Also woman‐reported outcome at 5 years | |
| Cure of SUI defined as significant dryness as perceived by the patient, no more use of pads, negative stress test, and acceptable voiding stream (combined primary outcome) | However, no data after first week, so not useable | |
| Cure defined as absence of subjective complaints of leakage and absence of urinary leakage on stress test (combined outcome) | ||
| Cure defined as dry, symptom‐free without objective urine loss during stress with bladder filled to 300 mL or positive urethral‐closure pressure during stress provocation (combined outcome) | ||
| Continence defined as no urinary leakage on a 3‐day voiding diary, no self‐reported stress incontinence symptoms, and no stress incontinence surgical treatment (combined outcome) | ||
| Cure defined as complete freedom from SUI (subjective and objective demonstrations) (combined outcome) | ||
| Patients evaluated by SEAPI score (subjective and objective) after urodynamic examination before and after treatment (combined outcome) | ||
| Cure defined as reported absence of SUI with no urinary loss during effort manoeuvres (combined outcome) | ||
| Cure defined as no leakage reported by the patient or noticed at examination (combined outcome) | ||
| Cure defined as complete dryness with no usage of pad and negative cough‐stress test (combined outcome) | ||
| Trials that did not report cure rates.
| ||
| Comparison 3. Traditional suburethral sling operation versus drugs | |
| Osman 2003 included 75 women with mixed urinary incontinence treated with surgery (either Burch colposuspension (n = 24) or rectus fascia sling (n = 26)) or oxybutynin (an anticholinergic drug treatment for urinary incontinence, overactive bladder, and detrusor overactivity ‐ not for stress incontinence; n = 25) (Osman 2003). The type of surgery was selected according to Valsalva leak point pressure (VLPP) ‐ those with VLPP < 90 cm of water had rectus fascia sling, and those with VLPP > 90 cm of water had Burch colposuspension) Results for the surgically managed group were similar to those of the subgroup having slings. Due to small sample sizes, data were too few to be reliable; we therefore compared only data from oxybutynin versus sling patients provided in tables Primary outcomes Number of continent (dry) women Data suggest that, within the first year, women were significantly more likely to be continent after undergoing surgery with slings than after treatment with oxybutynin (20/24; 83% vs 0/21; OR 195.89, 95% CI 9.91 to 3871.03; n = 45; Analysis 3.1) Number of women who have repeat continence surgery Not reported Secondary outcomes Fewer women had persistent urgency urinary incontinence after traditional sling surgery (3/24; 13% vs 9/21; 43% with oxybutynin; RR 0.29, 95% CI 0.09 to 0.94; n = 45; Analysis 3.2) | |
| Comparison 4. Traditional suburethral sling operation vs injectables | |
| Maher 2005 compared slings (21) vs injectable Macroplastique (22) in 45 women. Due to the small size of the trial, the data were too few to be reliable Primary outcomes Number of continent (dry) women Short‐term: data from 1 small trial were too few to reliably identify evidence of a difference between traditional sling and injectables in the number of continent women within the first year (OR 2.79, 95% CI 0.48 to 16.33; n = 43; Maher 2005; Analysis 4.1) Medium‐term: Maher 2005 found no evidence of a difference between groups in the number of continent women after the first year (13/13; 100% continent with a traditional sling vs 10/14, 71% with the injectable; OR 11.57, 95% CI 0.56 to 239.74; n = 27; very low‐quality evidence; Analysis 4.2;summary of findings Table 4) Number of women who have repeat continence surgery We found no evidence of a difference between groups in the numbers of women having repeat surgery for urinary incontinence (1 after traditional sling vs 2 after injectable: RR 0.52, 95% CI 0.05 to 5.36; n = 43; very low‐quality evidence; Maher 2005; Analysis 4.3;summary of findings Table 4) Secondary outcomes Number of women cured at 1 year or later (women's observations) The trial was too small to reliably identify evidence of a difference between groups in the number of women cured after the first year (OR 11.57, 95% CI 0.56 to 239.74; n = 27; Analysis 4.4) Number of women improved Not reported Number of women satisfied Data from Maher 2005 were too few to identify a difference between groups in satisfaction rates at 6 months (P = 0.41) or at 5 years (RR 2.42, 95% CI 0.98 to 5.98; n = 27; Analysis 4.5) Quantification of symptoms Not reported Clinician's observations Data suggest there were more women with incontinence (clinician‐observed) within the first year with injectables compared with the traditional sling: 4/21 vs 20/22 (RR 0.21, 95% 0.09 to 0.21; n = 43; Maher 2005; Analysis 4.6) Surgical outcome measures Injectables were quicker to perform, involved shorter hospital stay and time to catheter removal, and led to quicker return to normal activity than after traditional sling surgery, but the data were not suitable for meta‐analysis (Maher 2005) Further treatment Not reported Adverse events Perioperative surgical complications Not reported Bladder perforation Not reported Urinary tract infection Maher 2005 reported no evidence of a difference between traditional slings and injectables in the numbers of women with urinary tract infection (RR 1.57, 95% CI 0.29 to 8.49; very low‐quality evidence; Analysis 4.7;summary of findings Table 4) Urinary urgency symptoms, urgency urinary incontinence Not reported Detrusor overactivity (urodynamic overactivity) Maher 2005 reported no evidence of a difference between traditional slings and injectables in the numbers of women with de novo detrusor overactivity (RR 3.14, 95% CI 0.13 to 72.96; Analysis 4.8) Voiding dysfunction (with or without urodynamic confirmation) Maher 2005 reported no evidence of a difference between traditional slings and injectables in the numbers of women with voiding dysfunction (RR 4.19, 95% CI 0.51 to 34.50; Analysis 4.9) Long‐term adverse effects Not reported Quality of life Maher 2005 reported a significant reduction in Incontinence Impact Questionnaire (IIQ) scores compared with baseline (P < 0.01) in both groups, although he provided no data | |
| Comparison 6. Traditional suburethral sling operation vs bladder neck needle suspension (abdominal and vaginal) | |
| Only 1 trial compared porcine dermis sling vs Stamey needle suspension (Hilton 1989). This was a small trial with only 10 women in each arm. The women were unsuitable for abdominal colposuspension (the study author's preferred procedure) because they had vaginal narrowing secondary to previous interventions or atrophic vaginitis. Thus they constitute a population of women with SUI who are not typical of the majority. All women had urodynamic stress incontinence. Groups were comparable for age, parity, previous interventions, and hormonal status. Follow‐up was reported at 3 months and 24 months. Due to the small size of the trial, the data were too few to be reliable Primary outcomes Number of continent (dry) women Short‐term: within the first year after surgery, 1 small trial reported 9/10 and 8/10 continent women in the traditional sling and needle suspension groups, respectively (OR 2.25, 95% CI 0.17 to 29.77; n = 20; Hilton 1989; Analysis 6.1) Medium‐term: very low‐quality evidence from 1 trial comparing slings vs bladder neck needle suspension suggested no evidence of a difference between groups in the likelihood of being continent at 2 years after surgery (OR 3.86, 95% CI 0.33 to 45.57; n = 20; Hilton 1989; Analysis 6.2;summary of findings Table 6) Long‐term: not reported Number of women who have repeat continence surgery Not reported Secondary outcomes Women's observations Number of women cured at 1 year or later (women's observations) Evidence from 1 small trial comparing slings vs bladder neck needle suspension suggests no difference between groups in cure rates at 2 years after surgery (OR 3.86, 95% CI 0.33 to 45.57; n = 20; Hilton 1989) Quantification of symptoms Pad test at 12 months and 24 months stated but not reported (Hilton 1989) Clinician's observations Not reported Surgical outcome measures Duration of operation Not reported Length of hospital stay Sling group needed an indwelling catheter for longer and more adjuvant therapy, resulting in a longer stay in hospital than those with bladder neck needle suspension (MD 13 days longer, 95% CI 5 to 21; n = 20; Hilton 1989; Analysis 6.4) Time to return to normal activity level Not reported Blood loss Not reported Further treatment Not reported Adverse events Perioperative surgical complications Nine of the 10 women who had sling operations had complications, compared with 2/10 who had needle suspension. These included pyrexia, blood loss, wound infection, and pulmonary embolus (RR 4.50, 95% CI 1.28 to 15.81; n = 20; very low‐quality evidence; Hilton 1989; Analysis 6.5;summary of findings Table 6) Bladder perforation Not reported Urinary tract infection Not reported Urinary urgency symptoms, urgency urinary incontinence At 3 months: sling: 5/10, needle suspension: 3/10 (Hilton 1989; Analysis 6.6) Detrusor overactivity (urodynamic overactivity) At 3 months: sling: 2/10, needle suspension: 1/10 (Hilton 1989; Analysis 6.7) Voiding dysfunction (with or without urodynamic confirmation) At 3 months: sling: 4/10, needle suspension: 2/10 (Hilton 1989; Analysis 6.8) Long‐term adverse effects Not reported Quality of life Not reported | |
| Comparison 10. Traditional suburethral sling operation vs a single‐incision sling (mini‐sling) | |
| One small trial compared a rectus fascia pubovaginal traditional sling vs a single‐incision sling (mini‐sling; Ophira) and included women with urodynamically diagnosed stress urinary incontinence (USI) (Sharifiaghdas 2015) Due to the small size of the trial, the data were too few to be reliable Primary outcomes Number of continent (dry) women Short‐term: not reported Medium‐term: exactly the same proportion of women were continent at 1 year after surgery (traditional sling: 31/35; mini‐sling: 31/35; very low‐quality evidence; Sharifiaghdas 2015; Analysis 10.1;summary of findings Table 10) Long‐term: not reported Number of women who have repeat continence surgery Not reported Secondary outcomes Women's observations Cure For self‐report of cure at 1 year after surgery, exactly the same proportion of women were cured (traditional sling: 31/35; mini‐sling: 31/35; Sharifiaghdas 2015; Analysis 10.2) Number of women improved Not reported Number of women satisfied 10/35 women in the traditional sling group and 7/35 in the mini‐sling group reported that they were satisfied with their treatment at 1 year (RR 0.89, 95% CI 0.68 to 1.17; n = 70; Sharifiaghdas 2015; Analysis 10.3) Quantification of symptoms Not reported Clinician's observations The clinician's report of observed stress incontinence concurred with that reported by women ‐ 4 in each group (RR 1.00, 95% CI 0.27 to 3.69; n = 70; Sharifiaghdas 2015) Surgical outcome measures Not reported Further treatment Not reported Adverse effects Perioperative complications Not reported Bladder perforation One woman (of 35) had a bladder perforation in the traditional sling group compared with none (of 35) in the mini‐sling group (very low‐quality evidence; Sharifiaghdas 2008; Analysis 10.5;summary of findings Table 10) Urinary tract infection Not reported Urinary urgency symptoms, urgency urinary incontinence More women in the traditional sling group reported urinary urgency incontinence (5/35) compared with the mini‐sling group (1/35) (RR 5.00, 95% CI 0.62 to 40.64; n = 70; Sharifiaghdas 2015; Analysis 10.6) Detrusor overactivity (urodynamic overactivity) Not reported Voiding dysfunction (with or without urodynamic confirmation) Not reported Long‐term adverse effects Dyspareunia: 3/35 and 4/35 in traditional sling and mini‐sling groups, respectively, reported pain with intercourse (RR 0.75, 95% CI 0.18 to 3.11; n = 70; Sharifiaghdas 2008; Analysis 10.7) Tape or mesh exposure: 1 woman in the traditional sling group and 2 in the mini‐sling group were found to have tape or mesh exposure (RR 0.50, 95% CI 0.05 to 5.27; n = 70; Sharifiaghdas 2008; Analysis 10.8) Quality of life Based on mean IIQ score, quality of life was lower in the traditional sling group compared with the mini‐sling group (MD 7.50, 95% CI 2.23 to 12.77; very low‐quality evidence; Analysis 10.9;summary of findings Table 10) | |
| USI: urodynamically diagnosed stress urinary incontinence VLPP: Valsalva leak point pressure | |
| Outcome or subgroup title | No. of studies | No. of participants | Statistical method | Effect size |
| 1 Number of continent women within 1 year (any definition) Show forest plot | 1 | Odds Ratio (M‐H, Fixed, 95% CI) | Totals not selected | |
| 1.1 urodynamic stress incontinence (only) | 0 | Odds Ratio (M‐H, Fixed, 95% CI) | 0.0 [0.0, 0.0] | |
| 1.2 stress urinary incontinence (symptoms only) | 0 | Odds Ratio (M‐H, Fixed, 95% CI) | 0.0 [0.0, 0.0] | |
| 1.3 mixed incontinence | 1 | Odds Ratio (M‐H, Fixed, 95% CI) | 0.0 [0.0, 0.0] | |
| 2 Urge urinary symptoms, urgency urinary incontinence Show forest plot | 1 | Risk Ratio (M‐H, Fixed, 95% CI) | Totals not selected | |
| 2.1 urodynamic stress incontinence (only) | 0 | Risk Ratio (M‐H, Fixed, 95% CI) | 0.0 [0.0, 0.0] | |
| 2.2 stress urinary incontinence (symptoms only) | 0 | Risk Ratio (M‐H, Fixed, 95% CI) | 0.0 [0.0, 0.0] | |
| 2.3 mixed incontinence | 1 | Risk Ratio (M‐H, Fixed, 95% CI) | 0.0 [0.0, 0.0] | |
| Outcome or subgroup title | No. of studies | No. of participants | Statistical method | Effect size |
| 1 Number of continent women within 1 year (any definition) Show forest plot | 1 | Odds Ratio (M‐H, Fixed, 95% CI) | Totals not selected | |
| 1.1 urodynamic stress incontinence (only) | 1 | Odds Ratio (M‐H, Fixed, 95% CI) | 0.0 [0.0, 0.0] | |
| 1.2 stress urinary incontinence (symptoms only) | 0 | Odds Ratio (M‐H, Fixed, 95% CI) | 0.0 [0.0, 0.0] | |
| 1.3 mixed urinary incontinence | 0 | Odds Ratio (M‐H, Fixed, 95% CI) | 0.0 [0.0, 0.0] | |
| 2 Number of continent women at 1 to 5 years (any definition) Show forest plot | 1 | Odds Ratio (M‐H, Fixed, 95% CI) | Totals not selected | |
| 2.1 urodynamic stress incontinence (only) | 1 | Odds Ratio (M‐H, Fixed, 95% CI) | 0.0 [0.0, 0.0] | |
| 2.2 stress urinary incontinence (symptoms only) | 0 | Odds Ratio (M‐H, Fixed, 95% CI) | 0.0 [0.0, 0.0] | |
| 2.3 mixed urinary incontinence | 0 | Odds Ratio (M‐H, Fixed, 95% CI) | 0.0 [0.0, 0.0] | |
| 3 Repeat surgery for urinary incontinence Show forest plot | 1 | Risk Ratio (M‐H, Fixed, 95% CI) | Totals not selected | |
| 3.1 urodynamic stress incontinence (only) | 1 | Risk Ratio (M‐H, Fixed, 95% CI) | 0.0 [0.0, 0.0] | |
| 3.2 stress urinary incontinence (symptoms only) | 0 | Risk Ratio (M‐H, Fixed, 95% CI) | 0.0 [0.0, 0.0] | |
| 3.3 mixed urinary incontinence | 0 | Risk Ratio (M‐H, Fixed, 95% CI) | 0.0 [0.0, 0.0] | |
| 4 Number of women cured after first year (women's observations) Show forest plot | 1 | Odds Ratio (M‐H, Fixed, 95% CI) | Totals not selected | |
| 4.1 urodynamic stress incontinence (only) | 1 | Odds Ratio (M‐H, Fixed, 95% CI) | 0.0 [0.0, 0.0] | |
| 4.2 stress urinary incontinence (symptoms only) | 0 | Odds Ratio (M‐H, Fixed, 95% CI) | 0.0 [0.0, 0.0] | |
| 4.3 mixed urinary incontinence | 0 | Odds Ratio (M‐H, Fixed, 95% CI) | 0.0 [0.0, 0.0] | |
| 5 Number of women satisfied (women's observations) Show forest plot | 1 | Risk Ratio (M‐H, Fixed, 95% CI) | Totals not selected | |
| 5.1 urodynamic stress incontinence (only) | 1 | Risk Ratio (M‐H, Fixed, 95% CI) | 0.0 [0.0, 0.0] | |
| 5.2 stress urinary incontinence (symptoms only) | 0 | Risk Ratio (M‐H, Fixed, 95% CI) | 0.0 [0.0, 0.0] | |
| 5.3 mixed incontinence | 0 | Risk Ratio (M‐H, Fixed, 95% CI) | 0.0 [0.0, 0.0] | |
| 6 Number of women with urinary incontinence within first year (clinician's observations) Show forest plot | 1 | Risk Ratio (M‐H, Fixed, 95% CI) | Totals not selected | |
| 6.1 urodynamic stress incontinence (only) | 1 | Risk Ratio (M‐H, Fixed, 95% CI) | 0.0 [0.0, 0.0] | |
| 6.2 stress urinary incontinence (symptoms only) | 0 | Risk Ratio (M‐H, Fixed, 95% CI) | 0.0 [0.0, 0.0] | |
| 6.3 mixed urinary incontinence | 0 | Risk Ratio (M‐H, Fixed, 95% CI) | 0.0 [0.0, 0.0] | |
| 7 Urinary tract infection Show forest plot | 1 | Risk Ratio (M‐H, Fixed, 95% CI) | Totals not selected | |
| 7.1 urodynamic stress incontinence (only) | 1 | Risk Ratio (M‐H, Fixed, 95% CI) | 0.0 [0.0, 0.0] | |
| 7.2 stress urinary incontinence (symptoms only) | 0 | Risk Ratio (M‐H, Fixed, 95% CI) | 0.0 [0.0, 0.0] | |
| 7.3 mixed urinary incontinence | 0 | Risk Ratio (M‐H, Fixed, 95% CI) | 0.0 [0.0, 0.0] | |
| 8 De novo detrusor overactivity (urodynamic diagnosis) Show forest plot | 1 | Risk Ratio (M‐H, Fixed, 95% CI) | Totals not selected | |
| 8.1 urodynamic stress incontinence (only) | 1 | Risk Ratio (M‐H, Fixed, 95% CI) | 0.0 [0.0, 0.0] | |
| 8.2 stress urinary incontinence (symptoms only) | 0 | Risk Ratio (M‐H, Fixed, 95% CI) | 0.0 [0.0, 0.0] | |
| 8.3 mixed urinary incontinence | 0 | Risk Ratio (M‐H, Fixed, 95% CI) | 0.0 [0.0, 0.0] | |
| 9 Voiding dysfunction Show forest plot | 1 | Risk Ratio (M‐H, Fixed, 95% CI) | Totals not selected | |
| 9.1 urodynamic stress incontinence (only) | 1 | Risk Ratio (M‐H, Fixed, 95% CI) | 0.0 [0.0, 0.0] | |
| 9.2 stress urinary incontinence (symptoms only) | 0 | Risk Ratio (M‐H, Fixed, 95% CI) | 0.0 [0.0, 0.0] | |
| 9.3 mixed urinary incontinence | 0 | Risk Ratio (M‐H, Fixed, 95% CI) | 0.0 [0.0, 0.0] | |
| Outcome or subgroup title | No. of studies | No. of participants | Statistical method | Effect size |
| 1 Number of continent women within 1 year (any definition) Show forest plot | 1 | Odds Ratio (M‐H, Fixed, 95% CI) | Totals not selected | |
| 1.1 urodynamic stress incontinence (only) | 1 | Odds Ratio (M‐H, Fixed, 95% CI) | 0.0 [0.0, 0.0] | |
| 1.2 stress urinary incontinence (symptoms only) | 0 | Odds Ratio (M‐H, Fixed, 95% CI) | 0.0 [0.0, 0.0] | |
| 1.3 mixed incontinence | 0 | Odds Ratio (M‐H, Fixed, 95% CI) | 0.0 [0.0, 0.0] | |
| 2 Number of continent women at 1 to 5 years (any definition) Show forest plot | 1 | Odds Ratio (M‐H, Fixed, 95% CI) | Totals not selected | |
| 2.1 urodynamic stress incontinence (only) | 1 | Odds Ratio (M‐H, Fixed, 95% CI) | 0.0 [0.0, 0.0] | |
| 2.2 stress urinary incontinence (symptoms only) | 0 | Odds Ratio (M‐H, Fixed, 95% CI) | 0.0 [0.0, 0.0] | |
| 2.3 mixed incontinence | 0 | Odds Ratio (M‐H, Fixed, 95% CI) | 0.0 [0.0, 0.0] | |
| 3 CURE: number of women cured after first year (women's observations) Show forest plot | 1 | Odds Ratio (M‐H, Fixed, 95% CI) | Totals not selected | |
| 3.1 urodynamic stress incontinence (only) | 1 | Odds Ratio (M‐H, Fixed, 95% CI) | 0.0 [0.0, 0.0] | |
| 3.2 stress urinary incontinence (symptoms only) | 0 | Odds Ratio (M‐H, Fixed, 95% CI) | 0.0 [0.0, 0.0] | |
| 3.3 mixed incontinence | 0 | Odds Ratio (M‐H, Fixed, 95% CI) | 0.0 [0.0, 0.0] | |
| 4 Length of hospital stay (hours) Show forest plot | 1 | Mean Difference (IV, Fixed, 95% CI) | Totals not selected | |
| 4.1 urodynamic stress incontinence (only) | 1 | Mean Difference (IV, Fixed, 95% CI) | 0.0 [0.0, 0.0] | |
| 4.2 stress urinary incontinence (symptoms only) | 0 | Mean Difference (IV, Fixed, 95% CI) | 0.0 [0.0, 0.0] | |
| 4.3 mixed incontinence | 0 | Mean Difference (IV, Fixed, 95% CI) | 0.0 [0.0, 0.0] | |
| 5 Perioperative surgical complications Show forest plot | 1 | Risk Ratio (M‐H, Fixed, 95% CI) | Totals not selected | |
| 5.1 urodynamic stress incontinence (only) | 1 | Risk Ratio (M‐H, Fixed, 95% CI) | 0.0 [0.0, 0.0] | |
| 5.2 stress urinary incontinence (symptoms only) | 0 | Risk Ratio (M‐H, Fixed, 95% CI) | 0.0 [0.0, 0.0] | |
| 5.3 mixed incontinence | 0 | Risk Ratio (M‐H, Fixed, 95% CI) | 0.0 [0.0, 0.0] | |
| 6 Urinary urgency symptoms, urgency urinary incontinence Show forest plot | 1 | Risk Ratio (M‐H, Fixed, 95% CI) | Totals not selected | |
| 6.1 urodynamic stress incontinence (only) | 1 | Risk Ratio (M‐H, Fixed, 95% CI) | 0.0 [0.0, 0.0] | |
| 6.2 stress urinary incontinence (symptoms only) | 0 | Risk Ratio (M‐H, Fixed, 95% CI) | 0.0 [0.0, 0.0] | |
| 6.3 mixed incontinence | 0 | Risk Ratio (M‐H, Fixed, 95% CI) | 0.0 [0.0, 0.0] | |
| 7 Detrusor overactivity (urodynamic diagnosis) Show forest plot | 1 | Risk Ratio (M‐H, Fixed, 95% CI) | Totals not selected | |
| 7.1 urodynamic stress incontinence (only) | 1 | Risk Ratio (M‐H, Fixed, 95% CI) | 0.0 [0.0, 0.0] | |
| 7.2 stress urinary incontinence (symptoms only) | 0 | Risk Ratio (M‐H, Fixed, 95% CI) | 0.0 [0.0, 0.0] | |
| 7.3 mixed incontinence | 0 | Risk Ratio (M‐H, Fixed, 95% CI) | 0.0 [0.0, 0.0] | |
| 8 Voiding dysfunction after 3 months Show forest plot | 1 | Risk Ratio (M‐H, Fixed, 95% CI) | Totals not selected | |
| 8.1 urodynamic stress incontinence (only) | 1 | Risk Ratio (M‐H, Fixed, 95% CI) | 0.0 [0.0, 0.0] | |
| 8.2 stress urinary incontinence (symptoms only) | 0 | Risk Ratio (M‐H, Fixed, 95% CI) | 0.0 [0.0, 0.0] | |
| 8.3 mixed incontinence | 0 | Risk Ratio (M‐H, Fixed, 95% CI) | 0.0 [0.0, 0.0] | |
| Outcome or subgroup title | No. of studies | No. of participants | Statistical method | Effect size |
| 1 Number of continent women within 1 year (any definition) Show forest plot | 4 | 147 | Odds Ratio (M‐H, Fixed, 95% CI) | 2.70 [0.69, 10.55] |
| 1.1 urodynamic stress incontinence (only) | 4 | 147 | Odds Ratio (M‐H, Fixed, 95% CI) | 2.70 [0.69, 10.55] |
| 1.2 stress urinary incontinence (symptoms only) | 0 | 0 | Odds Ratio (M‐H, Fixed, 95% CI) | 0.0 [0.0, 0.0] |
| 1.3 mixed incontinence | 0 | 0 | Odds Ratio (M‐H, Fixed, 95% CI) | 0.0 [0.0, 0.0] |
| 2 Number of continent women at 1 to 5 years (any definition) Show forest plot | 4 | 687 | Odds Ratio (M‐H, Fixed, 95% CI) | 1.70 [1.22, 2.37] |
| 2.1 urodynamic stress incontinence (only) | 3 | 167 | Odds Ratio (M‐H, Fixed, 95% CI) | 1.84 [0.65, 5.24] |
| 2.2 stress urinary incontinence (symptoms only) | 1 | 520 | Odds Ratio (M‐H, Fixed, 95% CI) | 1.69 [1.19, 2.39] |
| 2.3 mixed incontinence | 0 | 0 | Odds Ratio (M‐H, Fixed, 95% CI) | 0.0 [0.0, 0.0] |
| 3 Number of continent women after 5 years (any definition) Show forest plot | 2 | 481 | Odds Ratio (M‐H, Fixed, 95% CI) | 1.55 [1.06, 2.27] |
| 3.1 urodynamic stress incontinence (only) | 1 | 28 | Odds Ratio (M‐H, Fixed, 95% CI) | 0.39 [0.03, 4.92] |
| 3.2 stress urinary incontinence (symptoms only) | 1 | 453 | Odds Ratio (M‐H, Fixed, 95% CI) | 1.61 [1.09, 2.37] |
| 3.3 mixed incontinence | 0 | 0 | Odds Ratio (M‐H, Fixed, 95% CI) | 0.0 [0.0, 0.0] |
| 4 Repeat surgery for urinary incontinence Show forest plot | 1 | Risk Ratio (M‐H, Fixed, 95% CI) | Totals not selected | |
| 4.1 urodynamic stress incontinence (only) | 0 | Risk Ratio (M‐H, Fixed, 95% CI) | 0.0 [0.0, 0.0] | |
| 4.2 stress urinary incontinence (symptoms only) | 1 | Risk Ratio (M‐H, Fixed, 95% CI) | 0.0 [0.0, 0.0] | |
| 4.3 mixed incontinence | 0 | Risk Ratio (M‐H, Fixed, 95% CI) | 0.0 [0.0, 0.0] | |
| 5 Number of women cured after first year (women's observations) Show forest plot | 3 | 515 | Odds Ratio (M‐H, Fixed, 95% CI) | 1.56 [1.07, 2.28] |
| 5.1 urodynamic stress incontinence (only) | 2 | 62 | Odds Ratio (M‐H, Fixed, 95% CI) | 0.93 [0.18, 4.89] |
| 5.2 stress urinary incontinence (symptoms only) | 1 | 453 | Odds Ratio (M‐H, Fixed, 95% CI) | 1.61 [1.09, 2.37] |
| 5.3 mixed incontinence | 0 | 0 | Odds Ratio (M‐H, Fixed, 95% CI) | 0.0 [0.0, 0.0] |
| 6 Number of women satisfied (women's observations) Show forest plot | 1 | Risk Ratio (M‐H, Fixed, 95% CI) | Totals not selected | |
| 6.1 urodynamic stress incontinence (only) | 0 | Risk Ratio (M‐H, Fixed, 95% CI) | 0.0 [0.0, 0.0] | |
| 6.2 stress urinary incontinence (symptoms only) | 1 | Risk Ratio (M‐H, Fixed, 95% CI) | 0.0 [0.0, 0.0] | |
| 6.3 mixed incontinence | 0 | Risk Ratio (M‐H, Fixed, 95% CI) | 0.0 [0.0, 0.0] | |
| 7 Number of women with urinary incontinence within first year (clinician's observations) | 0 | 0 | Risk Ratio (M‐H, Fixed, 95% CI) | 0.0 [0.0, 0.0] |
| 7.1 urodynamic stress incontinence (only) | 0 | 0 | Risk Ratio (M‐H, Fixed, 95% CI) | 0.0 [0.0, 0.0] |
| 7.2 stress urinary incontinence (symptoms only) | 0 | 0 | Risk Ratio (M‐H, Fixed, 95% CI) | 0.0 [0.0, 0.0] |
| 7.3 mixed incontinence | 0 | 0 | Risk Ratio (M‐H, Fixed, 95% CI) | 0.0 [0.0, 0.0] |
| 8 Number of women with urinary incontinence at 1 to 5 years (clinician's observations) Show forest plot | 3 | 626 | Risk Ratio (M‐H, Fixed, 95% CI) | 0.88 [0.59, 1.31] |
| 8.1 urodynamic stress incontinence (only) | 2 | 106 | Risk Ratio (M‐H, Fixed, 95% CI) | 0.54 [0.16, 1.86] |
| 8.2 stress urinary incontinence (symptoms only) | 1 | 520 | Risk Ratio (M‐H, Fixed, 95% CI) | 0.94 [0.62, 1.42] |
| 8.3 mixed incontinence | 0 | 0 | Risk Ratio (M‐H, Fixed, 95% CI) | 0.0 [0.0, 0.0] |
| 9 Number of women with urinary incontinence after 5 years (clinician's observations) Show forest plot | 2 | 461 | Risk Ratio (M‐H, Fixed, 95% CI) | 0.90 [0.80, 1.01] |
| 9.1 urodynamic stress incontinence (only) | 1 | 28 | Risk Ratio (M‐H, Fixed, 95% CI) | 0.23 [0.01, 4.37] |
| 9.2 stress urinary incontinence (symptoms only) | 1 | 433 | Risk Ratio (M‐H, Fixed, 95% CI) | 0.91 [0.81, 1.02] |
| 9.3 mixed incontinence | 0 | 0 | Risk Ratio (M‐H, Fixed, 95% CI) | 0.0 [0.0, 0.0] |
| 10 Duration of operation (minutes) Show forest plot | 1 | Mean Difference (IV, Fixed, 95% CI) | Totals not selected | |
| 10.1 urodynamic stress incontinence (only) | 1 | Mean Difference (IV, Fixed, 95% CI) | 0.0 [0.0, 0.0] | |
| 10.2 stress urinary incontinence (symptoms only) | 0 | Mean Difference (IV, Fixed, 95% CI) | 0.0 [0.0, 0.0] | |
| 10.3 mixed incontinence | 0 | Mean Difference (IV, Fixed, 95% CI) | 0.0 [0.0, 0.0] | |
| 11 Length of hospital stay (days) Show forest plot | 3 | 137 | Mean Difference (IV, Fixed, 95% CI) | 2.03 [1.47, 2.59] |
| 11.1 urodynamic stress incontinence (only) | 3 | 137 | Mean Difference (IV, Fixed, 95% CI) | 2.03 [1.47, 2.59] |
| 11.2 stress urinary incontinence (symptoms only) | 0 | 0 | Mean Difference (IV, Fixed, 95% CI) | 0.0 [0.0, 0.0] |
| 11.3 mixed incontinence | 0 | 0 | Mean Difference (IV, Fixed, 95% CI) | 0.0 [0.0, 0.0] |
| 12 Time to catheter removal (days) Show forest plot | 2 | 108 | Mean Difference (IV, Fixed, 95% CI) | 8.01 [6.84, 9.18] |
| 12.1 urodynamic stress incontinence (only) | 2 | 108 | Mean Difference (IV, Fixed, 95% CI) | 8.01 [6.84, 9.18] |
| 12.2 stress urinary incontinence (symptoms only) | 0 | 0 | Mean Difference (IV, Fixed, 95% CI) | 0.0 [0.0, 0.0] |
| 12.3 mixed incontinence | 0 | 0 | Mean Difference (IV, Fixed, 95% CI) | 0.0 [0.0, 0.0] |
| 13 Time to return to normal activity level | 0 | 0 | Mean Difference (IV, Fixed, 95% CI) | 0.0 [0.0, 0.0] |
| 13.1 urodynamic stress incontinence (only) | 0 | 0 | Mean Difference (IV, Fixed, 95% CI) | 0.0 [0.0, 0.0] |
| 13.2 stress urinary incontinence (symptoms only) | 0 | 0 | Mean Difference (IV, Fixed, 95% CI) | 0.0 [0.0, 0.0] |
| 13.3 mixed incontinence | 0 | 0 | Mean Difference (IV, Fixed, 95% CI) | 0.0 [0.0, 0.0] |
| 14 Number of women requiring treatment for pelvic organ prolapse Show forest plot | 3 | 559 | Risk Ratio (M‐H, Fixed, 95% CI) | 0.20 [0.05, 0.77] |
| 14.1 urodynamic stress incontinence (only) | 2 | 106 | Risk Ratio (M‐H, Fixed, 95% CI) | 0.2 [0.04, 1.11] |
| 14.2 stress urinary incontinence (symptoms only) | 1 | 453 | Risk Ratio (M‐H, Fixed, 95% CI) | 0.20 [0.02, 1.74] |
| 14.3 mixed incontinence | 0 | 0 | Risk Ratio (M‐H, Fixed, 95% CI) | 0.0 [0.0, 0.0] |
| 15 Perioperative surgical complications Show forest plot | 4 | 792 | Risk Ratio (M‐H, Fixed, 95% CI) | 1.24 [0.83, 1.86] |
| 15.1 urodynamic stress incontinence (only) | 3 | 137 | Risk Ratio (M‐H, Fixed, 95% CI) | 0.85 [0.28, 2.52] |
| 15.2 stress urinary incontinence (symptoms only) | 1 | 655 | Risk Ratio (M‐H, Fixed, 95% CI) | 1.32 [0.86, 2.04] |
| 15.3 mixed incontinence | 0 | 0 | Risk Ratio (M‐H, Fixed, 95% CI) | 0.0 [0.0, 0.0] |
| 16 Bladder perforation Show forest plot | 1 | Risk Ratio (M‐H, Fixed, 95% CI) | Totals not selected | |
| 16.1 urodynamic stress incontinence (only) | 0 | Risk Ratio (M‐H, Fixed, 95% CI) | 0.0 [0.0, 0.0] | |
| 16.2 stress urinary incontinence (symptoms only) | 1 | Risk Ratio (M‐H, Fixed, 95% CI) | 0.0 [0.0, 0.0] | |
| 16.3 mixed incontinence | 0 | Risk Ratio (M‐H, Fixed, 95% CI) | 0.0 [0.0, 0.0] | |
| 17 Urinary tract infection Show forest plot | 1 | Risk Ratio (M‐H, Fixed, 95% CI) | Totals not selected | |
| 17.1 urodynamic stress incontinence (only) | 0 | Risk Ratio (M‐H, Fixed, 95% CI) | 0.0 [0.0, 0.0] | |
| 17.2 stress urinary incontinence (symptoms only) | 1 | Risk Ratio (M‐H, Fixed, 95% CI) | 0.0 [0.0, 0.0] | |
| 17.3 mixed incontinence | 0 | Risk Ratio (M‐H, Fixed, 95% CI) | 0.0 [0.0, 0.0] | |
| 18 Number of women with recurrent UTIs at > 5 years Show forest plot | 1 | Risk Ratio (M‐H, Fixed, 95% CI) | Totals not selected | |
| 18.1 urodynamic stress incontinence (only) | 0 | Risk Ratio (M‐H, Fixed, 95% CI) | 0.0 [0.0, 0.0] | |
| 18.2 stress urinary incontinence (symptoms only) | 1 | Risk Ratio (M‐H, Fixed, 95% CI) | 0.0 [0.0, 0.0] | |
| 18.3 mixed incontinence | 0 | Risk Ratio (M‐H, Fixed, 95% CI) | 0.0 [0.0, 0.0] | |
| 19 Urinary urgency symptoms, urgency urinary incontinence Show forest plot | 2 | 525 | Risk Ratio (M‐H, Fixed, 95% CI) | 1.10 [0.74, 1.64] |
| 19.1 urodynamic stress incontinence (only) | 1 | 72 | Risk Ratio (M‐H, Fixed, 95% CI) | 2.0 [0.54, 7.39] |
| 19.2 stress urinary incontinence (symptoms only) | 1 | 453 | Risk Ratio (M‐H, Fixed, 95% CI) | 1.02 [0.67, 1.56] |
| 19.3 mixed incontinence | 0 | 0 | Risk Ratio (M‐H, Fixed, 95% CI) | 0.0 [0.0, 0.0] |
| 20 Detrusor overactivity (urodynamic diagnosis) Show forest plot | 4 | 203 | Risk Ratio (M‐H, Fixed, 95% CI) | 1.42 [0.52, 3.87] |
| 20.1 urodynamic stress incontinence (only) | 4 | 203 | Risk Ratio (M‐H, Fixed, 95% CI) | 1.42 [0.52, 3.87] |
| 20.2 stress urinary incontinence (symptoms only) | 0 | 0 | Risk Ratio (M‐H, Fixed, 95% CI) | 0.0 [0.0, 0.0] |
| 20.3 mixed incontinence | 0 | 0 | Risk Ratio (M‐H, Fixed, 95% CI) | 0.0 [0.0, 0.0] |
| 21 Voiding dysfunction after 3 months Show forest plot | 5 | 853 | Risk Ratio (M‐H, Fixed, 95% CI) | 6.08 [3.10, 11.95] |
| 21.1 urodynamic stress incontinence (only) | 4 | 198 | Risk Ratio (M‐H, Fixed, 95% CI) | 4.48 [1.16, 17.36] |
| 21.2 stress urinary incontinence (symptoms only) | 1 | 655 | Risk Ratio (M‐H, Fixed, 95% CI) | 6.63 [3.04, 14.47] |
| 21.3 mixed incontinence | 0 | 0 | Risk Ratio (M‐H, Fixed, 95% CI) | 0.0 [0.0, 0.0] |
| 22 Long‐term voiding dysfunction > 5 years Show forest plot | 1 | Risk Ratio (M‐H, Fixed, 95% CI) | Totals not selected | |
| 22.1 urodynamic stress incontinence (only) | 0 | Risk Ratio (M‐H, Fixed, 95% CI) | 0.0 [0.0, 0.0] | |
| 22.2 stress urinary incontinence (symptoms only) | 1 | Risk Ratio (M‐H, Fixed, 95% CI) | 0.0 [0.0, 0.0] | |
| 22.3 mixed incontinence | 0 | Risk Ratio (M‐H, Fixed, 95% CI) | 0.0 [0.0, 0.0] | |
| 23 Condition‐specific measures to assess quality of life Show forest plot | 1 | Mean Difference (IV, Fixed, 95% CI) | Totals not selected | |
| 23.1 Urinary Distress Index (UDI) | 1 | Mean Difference (IV, Fixed, 95% CI) | 0.0 [0.0, 0.0] | |
| 23.2 Incontinence Impact Questionnaire (IIQ) | 1 | Mean Difference (IV, Fixed, 95% CI) | 0.0 [0.0, 0.0] | |
| Outcome or subgroup title | No. of studies | No. of participants | Statistical method | Effect size |
| 1 Number of continent women within 1 year (any definition) Show forest plot | 11 | 841 | Odds Ratio (M‐H, Fixed, 95% CI) | 0.94 [0.67, 1.32] |
| 1.1 urodynamic stress incontinence (only) | 5 | 427 | Odds Ratio (M‐H, Fixed, 95% CI) | 0.97 [0.60, 1.56] |
| 1.2 stress urinary incontinence (symptoms only) | 1 | 53 | Odds Ratio (M‐H, Fixed, 95% CI) | 0.88 [0.12, 6.79] |
| 1.3 mixed urinary incontinence | 5 | 361 | Odds Ratio (M‐H, Fixed, 95% CI) | 0.91 [0.55, 1.51] |
| 2 Number of continent women at 1 to 5 years (any definition) Show forest plot | 6 | 458 | Odds Ratio (M‐H, Fixed, 95% CI) | 0.67 [0.44, 1.02] |
| 2.1 urodynamic stress incontinence (only) | 4 | 364 | Odds Ratio (M‐H, Fixed, 95% CI) | 0.77 [0.47, 1.25] |
| 2.2 stress urinary incontinence (symptoms only) | 0 | 0 | Odds Ratio (M‐H, Fixed, 95% CI) | 0.0 [0.0, 0.0] |
| 2.3 mixed urinary incontinence | 2 | 94 | Odds Ratio (M‐H, Fixed, 95% CI) | 0.42 [0.17, 1.04] |
| 3 Number of continent women after 5 years (any definition) Show forest plot | 1 | Odds Ratio (M‐H, Fixed, 95% CI) | Totals not selected | |
| 3.1 urodynamic stress incontinence (only) | 1 | Odds Ratio (M‐H, Fixed, 95% CI) | 0.0 [0.0, 0.0] | |
| 3.2 stress urinary incontinence (symptoms only) | 0 | Odds Ratio (M‐H, Fixed, 95% CI) | 0.0 [0.0, 0.0] | |
| 3.3 mixed urinary incontinence | 0 | Odds Ratio (M‐H, Fixed, 95% CI) | 0.0 [0.0, 0.0] | |
| 4 Repeat surgery for urinary incontinence Show forest plot | 1 | Risk Ratio (M‐H, Fixed, 95% CI) | Totals not selected | |
| 4.1 urodynamic stress incontinence (only) | 1 | Risk Ratio (M‐H, Fixed, 95% CI) | 0.0 [0.0, 0.0] | |
| 4.2 stress urinary incontinence (symptoms only) | 1 | Risk Ratio (M‐H, Fixed, 95% CI) | 0.0 [0.0, 0.0] | |
| 4.3 mixed incontinence | 0 | Risk Ratio (M‐H, Fixed, 95% CI) | 0.0 [0.0, 0.0] | |
| 5 Number of women cured after first year (women's observations) Show forest plot | 4 | 337 | Odds Ratio (M‐H, Fixed, 95% CI) | 1.06 [0.65, 1.72] |
| 5.1 urodynamic stress incontinence (only) | 3 | 293 | Odds Ratio (M‐H, Fixed, 95% CI) | 1.21 [0.72, 2.03] |
| 5.2 stress urinary incontinence (symptoms only) | 0 | 0 | Odds Ratio (M‐H, Fixed, 95% CI) | 0.0 [0.0, 0.0] |
| 5.3 mixed urinary incontinence | 1 | 44 | Odds Ratio (M‐H, Fixed, 95% CI) | 0.42 [0.10, 1.72] |
| 6 Number of women improved or cured within 1 year (women's observations) Show forest plot | 3 | 425 | Odds Ratio (M‐H, Fixed, 95% CI) | 1.33 [0.74, 2.39] |
| 6.1 urodynamic stress incontinence (only) | 2 | 286 | Odds Ratio (M‐H, Fixed, 95% CI) | 1.06 [0.43, 2.64] |
| 6.2 stress urinary incontinence (symptoms only) | 0 | 0 | Odds Ratio (M‐H, Fixed, 95% CI) | 0.0 [0.0, 0.0] |
| 6.3 mixed urinary incontinence | 1 | 139 | Odds Ratio (M‐H, Fixed, 95% CI) | 1.56 [0.72, 3.39] |
| 7 Number of women improved or cured at 1 to 5 years (women's observations) Show forest plot | 2 | 264 | Odds Ratio (M‐H, Fixed, 95% CI) | 0.76 [0.31, 1.87] |
| 7.1 urodynamic stress incontinence (only) | 2 | 264 | Odds Ratio (M‐H, Fixed, 95% CI) | 0.76 [0.31, 1.87] |
| 7.2 stress urinary incontinence (symptoms only) | 0 | 0 | Odds Ratio (M‐H, Fixed, 95% CI) | 0.0 [0.0, 0.0] |
| 7.3 mixed urinary incontinence | 0 | 0 | Odds Ratio (M‐H, Fixed, 95% CI) | 0.0 [0.0, 0.0] |
| 8 Number of women improved or cured after 5 years (women's observations) Show forest plot | 1 | Odds Ratio (M‐H, Fixed, 95% CI) | Totals not selected | |
| 8.1 urodynamic stress incontinence (only) | 1 | Odds Ratio (M‐H, Fixed, 95% CI) | 0.0 [0.0, 0.0] | |
| 8.2 stress urinary incontinence (symptoms only) | 0 | Odds Ratio (M‐H, Fixed, 95% CI) | 0.0 [0.0, 0.0] | |
| 8.3 mixed urinary incontinence | 0 | Odds Ratio (M‐H, Fixed, 95% CI) | 0.0 [0.0, 0.0] | |
| 9 Number of women satisfied (women's observations) Show forest plot | 2 | Risk Ratio (M‐H, Fixed, 95% CI) | Subtotals only | |
| 9.1 urodynamic stress incontinence (only) | 2 | 163 | Risk Ratio (M‐H, Fixed, 95% CI) | 1.09 [0.89, 1.33] |
| 9.2 stress urinary incontinence (symptoms only) | 0 | 0 | Risk Ratio (M‐H, Fixed, 95% CI) | 0.0 [0.0, 0.0] |
| 9.3 mixed urinary incontinence | 0 | 0 | Risk Ratio (M‐H, Fixed, 95% CI) | 0.0 [0.0, 0.0] |
| 10 Pad test of quantified leakage (mean weight of urine lost) Show forest plot | 1 | Mean Difference (IV, Fixed, 95% CI) | Totals not selected | |
| 10.1 urodynamic stress incontinence (only) | 1 | Mean Difference (IV, Fixed, 95% CI) | 0.0 [0.0, 0.0] | |
| 10.2 stress urinary incontinence (symptoms only) | 0 | Mean Difference (IV, Fixed, 95% CI) | 0.0 [0.0, 0.0] | |
| 10.3 mixed urinary incontinence | 0 | Mean Difference (IV, Fixed, 95% CI) | 0.0 [0.0, 0.0] | |
| 11 Number of women with urinary incontinence within first year (clinician's observations) Show forest plot | 2 | 105 | Risk Ratio (M‐H, Fixed, 95% CI) | 1.29 [0.45, 3.71] |
| 11.1 urodynamic stress incontinence (only) | 0 | 0 | Risk Ratio (M‐H, Fixed, 95% CI) | 0.0 [0.0, 0.0] |
| 11.2 stress urinary incontinence (symptoms only) | 0 | 0 | Risk Ratio (M‐H, Fixed, 95% CI) | 0.0 [0.0, 0.0] |
| 11.3 mixed urinary incontinence | 2 | 105 | Risk Ratio (M‐H, Fixed, 95% CI) | 1.29 [0.45, 3.71] |
| 12 Number of women with urinary incontinence at 1 to 5 years (any definition) (clinician's observations) Show forest plot | 1 | Risk Ratio (M‐H, Fixed, 95% CI) | Totals not selected | |
| 12.1 urodynamic stress incontinence (only) | 0 | Risk Ratio (M‐H, Fixed, 95% CI) | 0.0 [0.0, 0.0] | |
| 12.2 stress urinary incontinence (symptoms only) | 0 | Risk Ratio (M‐H, Fixed, 95% CI) | 0.0 [0.0, 0.0] | |
| 12.3 mixed urinary incontinence | 1 | Risk Ratio (M‐H, Fixed, 95% CI) | 0.0 [0.0, 0.0] | |
| 13 Duration of operation (minutes) Show forest plot | 7 | 355 | Mean Difference (IV, Fixed, 95% CI) | 57.08 [54.67, 59.49] |
| 13.1 urodynamic stress incontinence (only) | 2 | 61 | Mean Difference (IV, Fixed, 95% CI) | 46.91 [42.31, 51.52] |
| 13.2 stress urinary incontinence (symptoms only) | 1 | 53 | Mean Difference (IV, Fixed, 95% CI) | 20.0 [7.08, 32.92] |
| 13.3 mixed urinary incontinence | 4 | 241 | Mean Difference (IV, Fixed, 95% CI) | 62.96 [60.07, 65.86] |
| 14 Length of hospital stay (days) Show forest plot | 4 | 194 | Mean Difference (IV, Fixed, 95% CI) | 0.74 [0.55, 0.93] |
| 14.1 urodynamic stress incontinence (only) | 1 | 20 | Mean Difference (IV, Fixed, 95% CI) | 0.65 [0.39, 0.91] |
| 14.2 stress urinary incontinence (symptoms only) | 0 | 0 | Mean Difference (IV, Fixed, 95% CI) | 0.0 [0.0, 0.0] |
| 14.3 mixed urinary incontinence | 3 | 174 | Mean Difference (IV, Fixed, 95% CI) | 0.83 [0.56, 1.10] |
| 15 Time to catheter removal (days) Show forest plot | 2 | 113 | Mean Difference (IV, Fixed, 95% CI) | 0.11 [‐0.07, 0.30] |
| 15.1 urodynamic stress incontinence (only) | 0 | 0 | Mean Difference (IV, Fixed, 95% CI) | 0.0 [0.0, 0.0] |
| 15.2 stress urinary incontinence (symptoms only) | 1 | 53 | Mean Difference (IV, Fixed, 95% CI) | 2.3 [0.01, 4.59] |
| 15.3 mixed urinary incontinence | 1 | 60 | Mean Difference (IV, Fixed, 95% CI) | 0.10 [‐0.09, 0.29] |
| 16 Perioperative surgical complications Show forest plot | 4 | 293 | Risk Ratio (M‐H, Fixed, 95% CI) | 1.74 [1.16, 2.60] |
| 16.1 urodynamic stress incontinence (only) | 2 | 183 | Risk Ratio (M‐H, Fixed, 95% CI) | 1.73 [1.01, 2.96] |
| 16.2 stress urinary incontinence (symptoms only) | 0 | 0 | Risk Ratio (M‐H, Fixed, 95% CI) | 0.0 [0.0, 0.0] |
| 16.3 mixed urinary incontinence | 2 | 110 | Risk Ratio (M‐H, Fixed, 95% CI) | 1.74 [0.94, 3.21] |
| 17 Bladder perforations Show forest plot | 10 | 844 | Risk Ratio (M‐H, Fixed, 95% CI) | 0.59 [0.34, 1.01] |
| 17.1 urodynamic stress incontinence (only) | 3 | 334 | Risk Ratio (M‐H, Fixed, 95% CI) | 0.74 [0.19, 2.86] |
| 17.2 stress urinary incontinence (symptoms only) | 1 | 53 | Risk Ratio (M‐H, Fixed, 95% CI) | 0.56 [0.05, 5.81] |
| 17.3 mixed urinary incontinence | 6 | 457 | Risk Ratio (M‐H, Fixed, 95% CI) | 0.56 [0.30, 1.03] |
| 18 Urethral injury Show forest plot | 1 | Risk Ratio (M‐H, Fixed, 95% CI) | Totals not selected | |
| 18.1 urodynamic stress incontinence (only) | 0 | Risk Ratio (M‐H, Fixed, 95% CI) | 0.0 [0.0, 0.0] | |
| 18.2 stress urinary incontinence (symptoms only) | 0 | Risk Ratio (M‐H, Fixed, 95% CI) | 0.0 [0.0, 0.0] | |
| 18.3 mixed urinary incontinence | 1 | Risk Ratio (M‐H, Fixed, 95% CI) | 0.0 [0.0, 0.0] | |
| 19 Vaginal bleeding Show forest plot | 1 | Risk Ratio (M‐H, Fixed, 95% CI) | Totals not selected | |
| 19.1 urodynamic stress incontinence (only) | 0 | Risk Ratio (M‐H, Fixed, 95% CI) | 0.0 [0.0, 0.0] | |
| 19.2 stress urinary incontinence (symptoms only) | 0 | Risk Ratio (M‐H, Fixed, 95% CI) | 0.0 [0.0, 0.0] | |
| 19.3 mixed urinary incontinence | 1 | Risk Ratio (M‐H, Fixed, 95% CI) | 0.0 [0.0, 0.0] | |
| 20 Urinary tract infection Show forest plot | 1 | Risk Ratio (M‐H, Fixed, 95% CI) | Totals not selected | |
| 20.1 urodynamic stress incontinence (only) | 0 | Risk Ratio (M‐H, Fixed, 95% CI) | 0.0 [0.0, 0.0] | |
| 20.2 stress urinary incontinence (symptoms only) | 0 | Risk Ratio (M‐H, Fixed, 95% CI) | 0.0 [0.0, 0.0] | |
| 20.3 mixed urinary incontinence | 1 | Risk Ratio (M‐H, Fixed, 95% CI) | 0.0 [0.0, 0.0] | |
| 21 Voiding dysfunction Show forest plot | 8 | 629 | Risk Ratio (M‐H, Fixed, 95% CI) | 1.34 [0.85, 2.12] |
| 21.1 urodynamic stress incontinence (only) | 3 | 325 | Risk Ratio (M‐H, Fixed, 95% CI) | 1.22 [0.60, 2.46] |
| 21.2 stress urinary incontinence (symptoms only) | 1 | 53 | Risk Ratio (M‐H, Fixed, 95% CI) | 2.61 [0.76, 9.03] |
| 21.3 mixed urinary incontinence | 4 | 251 | Risk Ratio (M‐H, Fixed, 95% CI) | 1.18 [0.58, 2.40] |
| 22 Urinary urgency symptoms, urgency urinary incontinence Show forest plot | 4 | 295 | Risk Ratio (M‐H, Fixed, 95% CI) | 1.50 [0.58, 3.88] |
| 22.1 urodynamic stress incontinence (only) | 1 | 124 | Risk Ratio (M‐H, Fixed, 95% CI) | 0.34 [0.01, 8.29] |
| 22.2 stress urinary incontinence (symptoms only) | 0 | 0 | Risk Ratio (M‐H, Fixed, 95% CI) | 0.0 [0.0, 0.0] |
| 22.3 mixed urinary incontinence | 3 | 171 | Risk Ratio (M‐H, Fixed, 95% CI) | 1.81 [0.65, 5.06] |
| 23 De novo detrusor overactivity (urodynamic diagnosis) Show forest plot | 4 | 325 | Risk Ratio (M‐H, Fixed, 95% CI) | 2.61 [1.17, 5.84] |
| 23.1 urodynamic stress incontinence (only) | 1 | 59 | Risk Ratio (M‐H, Fixed, 95% CI) | 0.0 [0.0, 0.0] |
| 23.2 stress urinary incontinence (symptoms only) | 1 | 47 | Risk Ratio (M‐H, Fixed, 95% CI) | 3.13 [0.13, 73.01] |
| 23.3 mixed urinary incontinence | 2 | 219 | Risk Ratio (M‐H, Fixed, 95% CI) | 2.57 [1.12, 5.92] |
| 24 Long‐term adverse effects (release of sling required) Show forest plot | 3 | 326 | Risk Ratio (M‐H, Fixed, 95% CI) | 2.53 [0.87, 7.35] |
| 24.1 urodynamic stress incontinence (only) | 2 | 266 | Risk Ratio (M‐H, Fixed, 95% CI) | 1.68 [0.50, 5.66] |
| 24.2 stress urinary incontinence (symptoms only) | 0 | 0 | Risk Ratio (M‐H, Fixed, 95% CI) | 0.0 [0.0, 0.0] |
| 24.3 mixed urinary incontinence | 1 | 60 | Risk Ratio (M‐H, Fixed, 95% CI) | 9.6 [0.54, 170.84] |
| 25 Long‐term adverse effects (wound pain at 6 months) Show forest plot | 3 | 257 | Risk Ratio (M‐H, Fixed, 95% CI) | 6.40 [1.94, 21.12] |
| 25.1 urodynamic stress incontinence (only) | 1 | 124 | Risk Ratio (M‐H, Fixed, 95% CI) | 5.16 [0.25, 105.36] |
| 25.2 stress urinary incontinence (symptoms only) | 1 | 53 | Risk Ratio (M‐H, Fixed, 95% CI) | 3.92 [0.90, 17.15] |
| 25.3 mixed urinary incontinence | 1 | 80 | Risk Ratio (M‐H, Fixed, 95% CI) | 17.0 [1.01, 284.96] |
| 26 Long‐term adverse effects (vaginal mesh or graft exposure) Show forest plot | 5 | 348 | Risk Ratio (M‐H, Fixed, 95% CI) | 0.28 [0.05, 1.65] |
| 26.1 urodynamic stress incontinence (only) | 2 | 165 | Risk Ratio (M‐H, Fixed, 95% CI) | 0.35 [0.04, 3.24] |
| 26.2 stress urinary incontinence (symptoms only) | 1 | 53 | Risk Ratio (M‐H, Fixed, 95% CI) | 0.0 [0.0, 0.0] |
| 26.3 mixed urinary incontinence | 2 | 130 | Risk Ratio (M‐H, Fixed, 95% CI) | 0.2 [0.01, 3.97] |
| 27 Condition‐specific measures to assess quality of life: UDI‐6 Show forest plot | 1 | 63 | Mean Difference (IV, Fixed, 95% CI) | 7.30 [‐2.00, 16.60] |
| 27.1 urodynamic stress incontinence (only) | 0 | 0 | Mean Difference (IV, Fixed, 95% CI) | 0.0 [0.0, 0.0] |
| 27.2 stress urinary incontinence (symptoms only) | 1 | 63 | Mean Difference (IV, Fixed, 95% CI) | 7.30 [‐2.00, 16.60] |
| 27.3 mixed urinary incontinence | 0 | 0 | Mean Difference (IV, Fixed, 95% CI) | 0.0 [0.0, 0.0] |
| 28 Condition‐specific measures to assess quality of life: IIQ‐7 Show forest plot | 1 | 63 | Mean Difference (IV, Fixed, 95% CI) | 0.60 [‐10.17, 11.37] |
| 28.1 urodynamic stress incontinence (only) | 0 | 0 | Mean Difference (IV, Fixed, 95% CI) | 0.0 [0.0, 0.0] |
| 28.2 stress urinary incontinence (symptoms only) | 1 | 63 | Mean Difference (IV, Fixed, 95% CI) | 0.60 [‐10.17, 11.37] |
| 28.3 mixed urinary incontinence | 0 | 0 | Mean Difference (IV, Fixed, 95% CI) | 0.0 [0.0, 0.0] |
| Outcome or subgroup title | No. of studies | No. of participants | Statistical method | Effect size |
| 1 Number of continent women at 1 to 5 years (any definition) Show forest plot | 1 | Odds Ratio (M‐H, Fixed, 95% CI) | Totals not selected | |
| 1.1 urodynamic stress incontinence (only) | 1 | Odds Ratio (M‐H, Fixed, 95% CI) | 0.0 [0.0, 0.0] | |
| 1.2 stress urinary incontinence (symptoms only) | 0 | Odds Ratio (M‐H, Fixed, 95% CI) | 0.0 [0.0, 0.0] | |
| 1.3 mixed incontinence | 0 | Odds Ratio (M‐H, Fixed, 95% CI) | 0.0 [0.0, 0.0] | |
| 2 Number of women cured after first year (women's observations) Show forest plot | 1 | Odds Ratio (M‐H, Fixed, 95% CI) | Totals not selected | |
| 2.1 urodynamic stress incontinence (only) | 1 | Odds Ratio (M‐H, Fixed, 95% CI) | 0.0 [0.0, 0.0] | |
| 2.2 stress urinary incontinence (symptoms only) | 0 | Odds Ratio (M‐H, Fixed, 95% CI) | 0.0 [0.0, 0.0] | |
| 2.3 mixed incontinence | 0 | Odds Ratio (M‐H, Fixed, 95% CI) | 0.0 [0.0, 0.0] | |
| 3 Number of women satisfied (women's observations) Show forest plot | 1 | Risk Ratio (M‐H, Fixed, 95% CI) | Totals not selected | |
| 3.1 urodynamic stress incontinence (only) | 1 | Risk Ratio (M‐H, Fixed, 95% CI) | 0.0 [0.0, 0.0] | |
| 3.2 stress urinary incontinence (symptoms only) | 0 | Risk Ratio (M‐H, Fixed, 95% CI) | 0.0 [0.0, 0.0] | |
| 3.3 mixed incontinence | 0 | Risk Ratio (M‐H, Fixed, 95% CI) | 0.0 [0.0, 0.0] | |
| 4 Number of women with urinary incontinence (clinician's observations) within first year Show forest plot | 1 | Risk Ratio (M‐H, Fixed, 95% CI) | Totals not selected | |
| 4.1 urodynamic stress incontinence (only) | 1 | Risk Ratio (M‐H, Fixed, 95% CI) | 0.0 [0.0, 0.0] | |
| 4.2 stress urinary incontinence (symptoms only) | 0 | Risk Ratio (M‐H, Fixed, 95% CI) | 0.0 [0.0, 0.0] | |
| 4.3 mixed incontinence | 0 | Risk Ratio (M‐H, Fixed, 95% CI) | 0.0 [0.0, 0.0] | |
| 5 Bladder perforation Show forest plot | 1 | Risk Ratio (M‐H, Fixed, 95% CI) | Totals not selected | |
| 5.1 urodynamic stress incontinence (only) | 1 | Risk Ratio (M‐H, Fixed, 95% CI) | 0.0 [0.0, 0.0] | |
| 5.2 stress urinary incontinence (symptoms only) | 0 | Risk Ratio (M‐H, Fixed, 95% CI) | 0.0 [0.0, 0.0] | |
| 5.3 mixed incontinence | 0 | Risk Ratio (M‐H, Fixed, 95% CI) | 0.0 [0.0, 0.0] | |
| 6 Urinary urgency symptoms, urgency urinary incontinence Show forest plot | 1 | Risk Ratio (M‐H, Fixed, 95% CI) | Totals not selected | |
| 6.1 urodynamic stress incontinence (only) | 1 | Risk Ratio (M‐H, Fixed, 95% CI) | 0.0 [0.0, 0.0] | |
| 6.2 stress urinary incontinence (symptoms only) | 0 | Risk Ratio (M‐H, Fixed, 95% CI) | 0.0 [0.0, 0.0] | |
| 6.3 mixed incontinence | 0 | Risk Ratio (M‐H, Fixed, 95% CI) | 0.0 [0.0, 0.0] | |
| 7 Pain with intercourse (dyspareunia) Show forest plot | 1 | Risk Ratio (M‐H, Fixed, 95% CI) | Totals not selected | |
| 7.1 urodynamic stress incontinence (only) | 1 | Risk Ratio (M‐H, Fixed, 95% CI) | 0.0 [0.0, 0.0] | |
| 7.2 stress urinary incontinence (symptoms only) | 0 | Risk Ratio (M‐H, Fixed, 95% CI) | 0.0 [0.0, 0.0] | |
| 7.3 mixed incontinence | 0 | Risk Ratio (M‐H, Fixed, 95% CI) | 0.0 [0.0, 0.0] | |
| 8 Long‐term adverse effects (vaginal mesh or graft exposure) Show forest plot | 1 | Risk Ratio (M‐H, Fixed, 95% CI) | Totals not selected | |
| 8.1 urodynamic stress incontinence (only) | 1 | Risk Ratio (M‐H, Fixed, 95% CI) | 0.0 [0.0, 0.0] | |
| 8.2 stress urinary incontinence (symptoms only) | 0 | Risk Ratio (M‐H, Fixed, 95% CI) | 0.0 [0.0, 0.0] | |
| 8.3 mixed incontinence | 0 | Risk Ratio (M‐H, Fixed, 95% CI) | 0.0 [0.0, 0.0] | |
| 9 Condition‐specific measures to assess quality of life: IIQ score Show forest plot | 1 | Mean Difference (IV, Fixed, 95% CI) | Totals not selected | |
| 9.1 urodynamic stress incontinence (only) | 1 | Mean Difference (IV, Fixed, 95% CI) | 0.0 [0.0, 0.0] | |
| 9.2 stress urinary incontinence (symptoms only) | 0 | Mean Difference (IV, Fixed, 95% CI) | 0.0 [0.0, 0.0] | |
| 9.3 mixed urinary incontinence | 0 | Mean Difference (IV, Fixed, 95% CI) | 0.0 [0.0, 0.0] | |
| Outcome or subgroup title | No. of studies | No. of participants | Statistical method | Effect size |
| 1 Number of continent women within 1 year (any definition) Show forest plot | 5 | Odds Ratio (M‐H, Fixed, 95% CI) | Totals not selected | |
| 1.1 fascial sling vs Pelvicol sling | 1 | Odds Ratio (M‐H, Fixed, 95% CI) | 0.0 [0.0, 0.0] | |
| 1.2 standard sling vs short sling | 1 | Odds Ratio (M‐H, Fixed, 95% CI) | 0.0 [0.0, 0.0] | |
| 1.3 autologous fascial sling vs Fortaperm sling | 1 | Odds Ratio (M‐H, Fixed, 95% CI) | 0.0 [0.0, 0.0] | |
| 1.4 Vypro vs Ultrapro | 1 | Odds Ratio (M‐H, Fixed, 95% CI) | 0.0 [0.0, 0.0] | |
| 1.5 Vypro vs Prolene light | 1 | Odds Ratio (M‐H, Fixed, 95% CI) | 0.0 [0.0, 0.0] | |
| 1.6 Ultrapro vs Prolene light | 1 | Odds Ratio (M‐H, Fixed, 95% CI) | 0.0 [0.0, 0.0] | |
| 1.7 fascial sling vs vaginal wall sling | 1 | Odds Ratio (M‐H, Fixed, 95% CI) | 0.0 [0.0, 0.0] | |
| 2 Number of continent women at 1 to 5 years (any definition) Show forest plot | 7 | Odds Ratio (M‐H, Fixed, 95% CI) | Totals not selected | |
| 2.1 fascial sling vs Pelvicol sling | 1 | Odds Ratio (M‐H, Fixed, 95% CI) | 0.0 [0.0, 0.0] | |
| 2.2 standard sling vs short sling | 1 | Odds Ratio (M‐H, Fixed, 95% CI) | 0.0 [0.0, 0.0] | |
| 2.3 autologous dermal graft patch vs cadaveric fascia lata | 1 | Odds Ratio (M‐H, Fixed, 95% CI) | 0.0 [0.0, 0.0] | |
| 2.4 rectus fascia sling vs Goretex sling | 1 | Odds Ratio (M‐H, Fixed, 95% CI) | 0.0 [0.0, 0.0] | |
| 2.5 Vypro vs Ultrapro | 1 | Odds Ratio (M‐H, Fixed, 95% CI) | 0.0 [0.0, 0.0] | |
| 2.6 Vypro vs Prolene light | 1 | Odds Ratio (M‐H, Fixed, 95% CI) | 0.0 [0.0, 0.0] | |
| 2.7 Ultrapro vs Prolene light | 1 | Odds Ratio (M‐H, Fixed, 95% CI) | 0.0 [0.0, 0.0] | |
| 2.8 anterior vaginal wall sling vs biosynthetic mesh sling | 1 | Odds Ratio (M‐H, Fixed, 95% CI) | 0.0 [0.0, 0.0] | |
| 2.9 anterior rectus sheath sling vs Prolene strip | 1 | Odds Ratio (M‐H, Fixed, 95% CI) | 0.0 [0.0, 0.0] | |
| 2.10 anterior rectus sheath sling vs anterior vaginal wall patch | 1 | Odds Ratio (M‐H, Fixed, 95% CI) | 0.0 [0.0, 0.0] | |
| 2.11 Prolene strip vs anterior vaginal wall patch | 1 | Odds Ratio (M‐H, Fixed, 95% CI) | 0.0 [0.0, 0.0] | |
| 3 Number of continent women after 5 years (any definition) Show forest plot | 1 | Odds Ratio (M‐H, Fixed, 95% CI) | Totals not selected | |
| 3.1 standard sling vs short sling | 1 | Odds Ratio (M‐H, Fixed, 95% CI) | 0.0 [0.0, 0.0] | |
| 4 Repeat surgery for urinary incontinence Show forest plot | 1 | Risk Ratio (M‐H, Fixed, 95% CI) | Totals not selected | |
| 4.1 fascial sling vs Pelvicol sling | 1 | Risk Ratio (M‐H, Fixed, 95% CI) | 0.0 [0.0, 0.0] | |
| 5 Number of women cured after first year (women's observations) Show forest plot | 3 | Odds Ratio (M‐H, Fixed, 95% CI) | Totals not selected | |
| 5.1 fascial sling vs Pelvicol sling | 1 | Odds Ratio (M‐H, Fixed, 95% CI) | 0.0 [0.0, 0.0] | |
| 5.2 standard sling vs short sling | 1 | Odds Ratio (M‐H, Fixed, 95% CI) | 0.0 [0.0, 0.0] | |
| 5.3 autologous dermal graft patch vs cadaveric fascia lata | 1 | Odds Ratio (M‐H, Fixed, 95% CI) | 0.0 [0.0, 0.0] | |
| 6 Number of women improved or cured within first year (women's observations) Show forest plot | 3 | Odds Ratio (M‐H, Fixed, 95% CI) | Totals not selected | |
| 6.1 fascial sling vs Pelvicol sling | 1 | Odds Ratio (M‐H, Fixed, 95% CI) | 0.0 [0.0, 0.0] | |
| 6.2 autologous fascial sling vs Fortaperm sling | 1 | Odds Ratio (M‐H, Fixed, 95% CI) | 0.0 [0.0, 0.0] | |
| 6.3 rectus fascia sling vs Goretex sling | 1 | Odds Ratio (M‐H, Fixed, 95% CI) | 0.0 [0.0, 0.0] | |
| 7 Number of women improved or cured at 1 to 5 years (women's observations) Show forest plot | 4 | Risk Ratio (M‐H, Fixed, 95% CI) | Totals not selected | |
| 7.1 fascial sling vs Pelvicol sling | 1 | Risk Ratio (M‐H, Fixed, 95% CI) | 0.0 [0.0, 0.0] | |
| 7.2 autologous dermal graft patch vs cadaveric fascia lata | 1 | Risk Ratio (M‐H, Fixed, 95% CI) | 0.0 [0.0, 0.0] | |
| 7.3 rectus fascia sling vs Goretex sling | 1 | Risk Ratio (M‐H, Fixed, 95% CI) | 0.0 [0.0, 0.0] | |
| 7.4 anterior rectus sheath sling vs Prolene strip | 1 | Risk Ratio (M‐H, Fixed, 95% CI) | 0.0 [0.0, 0.0] | |
| 7.5 anterior rectus sheath sling vs anterior vaginal wall patch | 1 | Risk Ratio (M‐H, Fixed, 95% CI) | 0.0 [0.0, 0.0] | |
| 7.6 Prolene strip vs anterior vaginal wall patch | 1 | Risk Ratio (M‐H, Fixed, 95% CI) | 0.0 [0.0, 0.0] | |
| 8 Number of women satisfied (women's observations) Show forest plot | 3 | Risk Ratio (M‐H, Fixed, 95% CI) | Totals not selected | |
| 8.1 fascial sling vs Pelvicol sling | 1 | Risk Ratio (M‐H, Fixed, 95% CI) | 0.0 [0.0, 0.0] | |
| 8.2 Vypro vs Ultrapro | 1 | Risk Ratio (M‐H, Fixed, 95% CI) | 0.0 [0.0, 0.0] | |
| 8.3 Vypro vs Prolene light | 1 | Risk Ratio (M‐H, Fixed, 95% CI) | 0.0 [0.0, 0.0] | |
| 8.4 Ultrapro vs Prolene light | 1 | Risk Ratio (M‐H, Fixed, 95% CI) | 0.0 [0.0, 0.0] | |
| 8.5 anterior vaginal wall sling vs biosynthetic mesh sling | 1 | Risk Ratio (M‐H, Fixed, 95% CI) | 0.0 [0.0, 0.0] | |
| 9 Pad test of quantified leakage (mean weight of urine lost) within 1 year Show forest plot | 2 | Mean Difference (IV, Fixed, 95% CI) | Totals not selected | |
| 9.1 standard sling vs short sling | 1 | Mean Difference (IV, Fixed, 95% CI) | 0.0 [0.0, 0.0] | |
| 9.2 Vypro vs Ultrapro | 1 | Mean Difference (IV, Fixed, 95% CI) | 0.0 [0.0, 0.0] | |
| 9.3 Vypro vs Prolene light | 1 | Mean Difference (IV, Fixed, 95% CI) | 0.0 [0.0, 0.0] | |
| 9.4 Ultrapro vs Prolene light | 1 | Mean Difference (IV, Fixed, 95% CI) | 0.0 [0.0, 0.0] | |
| 10 Pad test of quantified leakage (mean weight of urine lost) at 1 to 5 years Show forest plot | 1 | Mean Difference (IV, Fixed, 95% CI) | Totals not selected | |
| 10.1 Vypro vs Ultrapro | 1 | Mean Difference (IV, Fixed, 95% CI) | 0.0 [0.0, 0.0] | |
| 10.2 Vypro vs Prolene light | 1 | Mean Difference (IV, Fixed, 95% CI) | 0.0 [0.0, 0.0] | |
| 10.3 Ultrapro vs Prolene light | 1 | Mean Difference (IV, Fixed, 95% CI) | 0.0 [0.0, 0.0] | |
| 11 Duration of operation (minutes) Show forest plot | 2 | Mean Difference (IV, Fixed, 95% CI) | Totals not selected | |
| 11.1 standard sling vs short sling | 1 | Mean Difference (IV, Fixed, 95% CI) | 0.0 [0.0, 0.0] | |
| 11.2 anterior rectus sheath sling vs Prolene strip | 1 | Mean Difference (IV, Fixed, 95% CI) | 0.0 [0.0, 0.0] | |
| 11.3 anterior rectus sheath sling vs anterior vaginal wall patch | 1 | Mean Difference (IV, Fixed, 95% CI) | 0.0 [0.0, 0.0] | |
| 11.4 Prolene strip vs anterior vaginal wall patch | 1 | Mean Difference (IV, Fixed, 95% CI) | 0.0 [0.0, 0.0] | |
| 12 Blood loss (mL) Show forest plot | 1 | Mean Difference (IV, Fixed, 95% CI) | Totals not selected | |
| 12.1 anterior rectus sheath sling vs Prolene strip | 1 | Mean Difference (IV, Fixed, 95% CI) | 0.0 [0.0, 0.0] | |
| 12.2 anterior rectus sheath sling vs anterior vaginal wall patch | 1 | Mean Difference (IV, Fixed, 95% CI) | 0.0 [0.0, 0.0] | |
| 12.3 Prolene strip vs anterior vaginal wall patch | 1 | Mean Difference (IV, Fixed, 95% CI) | 0.0 [0.0, 0.0] | |
| 13 Length of hospital stay (days) Show forest plot | 1 | Mean Difference (IV, Fixed, 95% CI) | Totals not selected | |
| 13.1 anterior rectus sheath sling vs Prolene strip | 1 | Mean Difference (IV, Fixed, 95% CI) | 0.0 [0.0, 0.0] | |
| 13.2 anterior rectus sheath sling vs anterior vaginal wall patch | 1 | Mean Difference (IV, Fixed, 95% CI) | 0.0 [0.0, 0.0] | |
| 13.3 Prolene strip vs anterior vaginal wall patch | 1 | Mean Difference (IV, Fixed, 95% CI) | 0.0 [0.0, 0.0] | |
| 14 Perioperative surgical complications Show forest plot | 3 | Risk Ratio (M‐H, Fixed, 95% CI) | Totals not selected | |
| 14.1 standard sling vs short sling | 1 | Risk Ratio (M‐H, Fixed, 95% CI) | 0.0 [0.0, 0.0] | |
| 14.2 rectus fascia sling vs Goretex sling | 1 | Risk Ratio (M‐H, Fixed, 95% CI) | 0.0 [0.0, 0.0] | |
| 14.3 fascial sling vs vaginal wall sling | 1 | Risk Ratio (M‐H, Fixed, 95% CI) | 0.0 [0.0, 0.0] | |
| 15 Bladder perforation Show forest plot | 3 | Risk Ratio (M‐H, Fixed, 95% CI) | Totals not selected | |
| 15.1 standard sling vs short sling | 1 | Risk Ratio (M‐H, Fixed, 95% CI) | 0.0 [0.0, 0.0] | |
| 15.2 fascial sling vs Pelvicol sling | 1 | Risk Ratio (M‐H, Fixed, 95% CI) | 0.0 [0.0, 0.0] | |
| 15.3 anterior rectus sheath sling vs Prolene strip | 1 | Risk Ratio (M‐H, Fixed, 95% CI) | 0.0 [0.0, 0.0] | |
| 15.4 anterior rectus sheath sling vs anterior vaginal wall patch | 1 | Risk Ratio (M‐H, Fixed, 95% CI) | 0.0 [0.0, 0.0] | |
| 15.5 Prolene strip vs anterior vaginal wall patch | 1 | Risk Ratio (M‐H, Fixed, 95% CI) | 0.0 [0.0, 0.0] | |
| 16 Urinary tract infection Show forest plot | 2 | Risk Ratio (M‐H, Fixed, 95% CI) | Totals not selected | |
| 16.1 standard sling vs short sling | 1 | Risk Ratio (M‐H, Fixed, 95% CI) | 0.0 [0.0, 0.0] | |
| 16.2 anterior vaginal wall sling vs biosynthetic mesh sling | 1 | Risk Ratio (M‐H, Fixed, 95% CI) | 0.0 [0.0, 0.0] | |
| 17 Vaginal bleeding Show forest plot | 1 | Risk Ratio (M‐H, Fixed, 95% CI) | Totals not selected | |
| 17.1 anterior vaginal wall sling vs biosynthetic mesh sling | 1 | Risk Ratio (M‐H, Fixed, 95% CI) | 0.0 [0.0, 0.0] | |
| 18 Long‐term adverse effects (wound pain) Show forest plot | 1 | Risk Ratio (M‐H, Fixed, 95% CI) | Totals not selected | |
| 18.1 fascial sling vs Pelvicol sling | 1 | Risk Ratio (M‐H, Fixed, 95% CI) | 0.0 [0.0, 0.0] | |
| 19 Voiding dysfunction Show forest plot | 6 | Risk Ratio (M‐H, Fixed, 95% CI) | Totals not selected | |
| 19.1 fascial sling vs Pelvicol sling | 1 | Risk Ratio (M‐H, Fixed, 95% CI) | 0.0 [0.0, 0.0] | |
| 19.2 standard sling vs short sling | 1 | Risk Ratio (M‐H, Fixed, 95% CI) | 0.0 [0.0, 0.0] | |
| 19.3 Vypro vs Ultrapro | 1 | Risk Ratio (M‐H, Fixed, 95% CI) | 0.0 [0.0, 0.0] | |
| 19.4 Vypro vs Prolene light | 1 | Risk Ratio (M‐H, Fixed, 95% CI) | 0.0 [0.0, 0.0] | |
| 19.5 Ultrapro vs Prolene light | 1 | Risk Ratio (M‐H, Fixed, 95% CI) | 0.0 [0.0, 0.0] | |
| 19.6 anterior vaginal wall sling vs biosynthetic mesh sling | 1 | Risk Ratio (M‐H, Fixed, 95% CI) | 0.0 [0.0, 0.0] | |
| 19.7 anterior rectus sheath sling vs Prolene strip | 1 | Risk Ratio (M‐H, Fixed, 95% CI) | 0.0 [0.0, 0.0] | |
| 19.8 anterior rectus sheath sling vs anterior vaginal wall patch | 1 | Risk Ratio (M‐H, Fixed, 95% CI) | 0.0 [0.0, 0.0] | |
| 19.9 Prolene strip vs anterior vaginal wall patch | 1 | Risk Ratio (M‐H, Fixed, 95% CI) | 0.0 [0.0, 0.0] | |
| 19.10 fascial sling vs vaginal wall sling | 1 | Risk Ratio (M‐H, Fixed, 95% CI) | 0.0 [0.0, 0.0] | |
| 20 Urinary urgency symptoms, urgency urinary incontinence Show forest plot | 3 | Risk Ratio (M‐H, Fixed, 95% CI) | Totals not selected | |
| 20.1 standard sling vs short sling | 1 | Risk Ratio (M‐H, Fixed, 95% CI) | 0.0 [0.0, 0.0] | |
| 20.2 Vypro vs Ultrapro | 1 | Risk Ratio (M‐H, Fixed, 95% CI) | 0.0 [0.0, 0.0] | |
| 20.3 Vypro vs Prolene light | 1 | Risk Ratio (M‐H, Fixed, 95% CI) | 0.0 [0.0, 0.0] | |
| 20.4 Ultrapro vs Prolene light | 1 | Risk Ratio (M‐H, Fixed, 95% CI) | 0.0 [0.0, 0.0] | |
| 20.5 rectus fascia sling vs Goretex sling | 1 | Risk Ratio (M‐H, Fixed, 95% CI) | 0.0 [0.0, 0.0] | |
| 21 Detrusor overactivity (urodynamic overactivity) Show forest plot | 1 | Risk Ratio (M‐H, Fixed, 95% CI) | Totals not selected | |
| 21.1 autologous dermal graft patch vs cadaveric fascia lata | 1 | Risk Ratio (M‐H, Fixed, 95% CI) | 0.0 [0.0, 0.0] | |
| 22 Long‐term adverse effects (release of sling required) Show forest plot | 1 | Risk Ratio (M‐H, Fixed, 95% CI) | Totals not selected | |
| 22.1 fascial sling vs Pelvicol sling | 1 | Risk Ratio (M‐H, Fixed, 95% CI) | 0.0 [0.0, 0.0] | |
| 23 Long‐term adverse effects (vaginal mesh or graft exposure) Show forest plot | 3 | Risk Ratio (M‐H, Fixed, 95% CI) | Totals not selected | |
| 23.1 fascial sling vs Pelvicol sling | 1 | Risk Ratio (M‐H, Fixed, 95% CI) | 0.0 [0.0, 0.0] | |
| 23.2 Vypro vs Ultrapro | 1 | Risk Ratio (M‐H, Fixed, 95% CI) | 0.0 [0.0, 0.0] | |
| 23.3 Vypro vs Prolene light | 1 | Risk Ratio (M‐H, Fixed, 95% CI) | 0.0 [0.0, 0.0] | |
| 23.4 Ultrapro vs Prolene light | 1 | Risk Ratio (M‐H, Fixed, 95% CI) | 0.0 [0.0, 0.0] | |
| 23.5 anterior vaginal wall sling vs biosynthetic mesh sling | 1 | Risk Ratio (M‐H, Fixed, 95% CI) | 0.0 [0.0, 0.0] | |
| 24 Condition‐specific measures to assess quality of life (ICI‐Q short form UI score at 1 year) Show forest plot | 1 | Mean Difference (IV, Fixed, 95% CI) | Totals not selected | |
| 24.1 Vypro vs Ultrapro | 1 | Mean Difference (IV, Fixed, 95% CI) | 0.0 [0.0, 0.0] | |
| 24.2 Vypro vs Prolene light | 1 | Mean Difference (IV, Fixed, 95% CI) | 0.0 [0.0, 0.0] | |
| 24.3 Ultrapro vs Prolene light | 1 | Mean Difference (IV, Fixed, 95% CI) | 0.0 [0.0, 0.0] | |
| 25 Condition‐specific measures to assess quality of life (ICI‐Q short form UI score at 1 to 5 years) Show forest plot | 1 | Mean Difference (IV, Fixed, 95% CI) | Totals not selected | |
| 25.1 Vypro vs Ultrapro | 1 | Mean Difference (IV, Fixed, 95% CI) | 0.0 [0.0, 0.0] | |
| 25.2 Vypro vs Prolene light | 1 | Mean Difference (IV, Fixed, 95% CI) | 0.0 [0.0, 0.0] | |
| 25.3 Ultrapro vs Prolene light | 1 | Mean Difference (IV, Fixed, 95% CI) | 0.0 [0.0, 0.0] | |
| Outcome or subgroup title | No. of studies | No. of participants | Statistical method | Effect size |
| 1 Number of women with urinary incontinence (worse, unchanged, or improved) within first year (women's observations) Show forest plot | 1 | Risk Ratio (M‐H, Fixed, 95% CI) | Totals not selected | |
| 1.1 urodynamic stress incontinence (only) | 0 | Risk Ratio (M‐H, Fixed, 95% CI) | 0.0 [0.0, 0.0] | |
| 1.2 stress urinary incontinence (symptoms only) | 0 | Risk Ratio (M‐H, Fixed, 95% CI) | 0.0 [0.0, 0.0] | |
| 1.3 mixed incontinence | 1 | Risk Ratio (M‐H, Fixed, 95% CI) | 0.0 [0.0, 0.0] | |
| 2 Urge urinary symptoms, urgency urinary incontinence Show forest plot | 1 | Risk Ratio (M‐H, Fixed, 95% CI) | Totals not selected | |
| 2.1 urodynamic stress incontinence (only) | 0 | Risk Ratio (M‐H, Fixed, 95% CI) | 0.0 [0.0, 0.0] | |
| 2.2 stress urinary incontinence (symptoms only) | 0 | Risk Ratio (M‐H, Fixed, 95% CI) | 0.0 [0.0, 0.0] | |
| 2.3 mixed incontinence | 1 | Risk Ratio (M‐H, Fixed, 95% CI) | 0.0 [0.0, 0.0] | |
| Outcome or subgroup title | No. of studies | No. of participants | Statistical method | Effect size |
| 1 Number of women with urinary incontinence (worse, unchanged, or improved) within first year (women's observations) Show forest plot | 1 | Risk Ratio (M‐H, Fixed, 95% CI) | Totals not selected | |
| 1.1 urodynamic stress incontinence (only) | 1 | Risk Ratio (M‐H, Fixed, 95% CI) | 0.0 [0.0, 0.0] | |
| 1.2 stress urinary incontinence (symptoms only) | 0 | Risk Ratio (M‐H, Fixed, 95% CI) | 0.0 [0.0, 0.0] | |
| 1.3 mixed urinary incontinence | 0 | Risk Ratio (M‐H, Fixed, 95% CI) | 0.0 [0.0, 0.0] | |
| 2 Number of women with urinary incontinence (worse, unchanged, or improved) after first year (women's observations) Show forest plot | 1 | Risk Ratio (M‐H, Fixed, 95% CI) | Totals not selected | |
| 2.1 urodynamic stress incontinence (only) | 1 | Risk Ratio (M‐H, Fixed, 95% CI) | 0.0 [0.0, 0.0] | |
| 2.2 stress urinary incontinence (symptoms only) | 0 | Risk Ratio (M‐H, Fixed, 95% CI) | 0.0 [0.0, 0.0] | |
| 2.3 mixed urinary incontinence | 0 | Risk Ratio (M‐H, Fixed, 95% CI) | 0.0 [0.0, 0.0] | |
| 3 Number of women with urinary incontinence (clinician's observations) within first year Show forest plot | 1 | Risk Ratio (M‐H, Fixed, 95% CI) | Totals not selected | |
| 3.1 urodynamic stress incontinence (only) | 1 | Risk Ratio (M‐H, Fixed, 95% CI) | 0.0 [0.0, 0.0] | |
| 3.2 stress urinary incontinence (symptoms only) | 0 | Risk Ratio (M‐H, Fixed, 95% CI) | 0.0 [0.0, 0.0] | |
| 3.3 mixed urinary incontinence | 0 | Risk Ratio (M‐H, Fixed, 95% CI) | 0.0 [0.0, 0.0] | |
| 4 CURE: number of women cured after first year (women's observations) Show forest plot | 1 | Odds Ratio (M‐H, Fixed, 95% CI) | Totals not selected | |
| 4.1 urodynamic stress incontinence (only) | 1 | Odds Ratio (M‐H, Fixed, 95% CI) | 0.0 [0.0, 0.0] | |
| 4.2 stress urinary incontinence (symptoms only) | 0 | Odds Ratio (M‐H, Fixed, 95% CI) | 0.0 [0.0, 0.0] | |
| 4.3 mixed urinary incontinence | 0 | Odds Ratio (M‐H, Fixed, 95% CI) | 0.0 [0.0, 0.0] | |
| 5 Voiding dysfunction Show forest plot | 1 | Risk Ratio (M‐H, Fixed, 95% CI) | Totals not selected | |
| 5.1 urodynamic stress incontinence (only) | 1 | Risk Ratio (M‐H, Fixed, 95% CI) | 0.0 [0.0, 0.0] | |
| 5.2 stress urinary incontinence (symptoms only) | 0 | Risk Ratio (M‐H, Fixed, 95% CI) | 0.0 [0.0, 0.0] | |
| 5.3 mixed urinary incontinence | 0 | Risk Ratio (M‐H, Fixed, 95% CI) | 0.0 [0.0, 0.0] | |
| 6 De novo detrusor overactivity (urodynamic diagnosis) Show forest plot | 1 | Risk Ratio (M‐H, Fixed, 95% CI) | Totals not selected | |
| 6.1 urodynamic stress incontinence (only) | 1 | Risk Ratio (M‐H, Fixed, 95% CI) | 0.0 [0.0, 0.0] | |
| 6.2 stress urinary incontinence (symptoms only) | 0 | Risk Ratio (M‐H, Fixed, 95% CI) | 0.0 [0.0, 0.0] | |
| 6.3 mixed urinary incontinence | 0 | Risk Ratio (M‐H, Fixed, 95% CI) | 0.0 [0.0, 0.0] | |
| 7 Urinary tract infection Show forest plot | 1 | Risk Ratio (M‐H, Fixed, 95% CI) | Totals not selected | |
| 7.1 urodynamic stress incontinence (only) | 1 | Risk Ratio (M‐H, Fixed, 95% CI) | 0.0 [0.0, 0.0] | |
| 7.2 stress urinary incontinence (symptoms only) | 0 | Risk Ratio (M‐H, Fixed, 95% CI) | 0.0 [0.0, 0.0] | |
| 7.3 mixed urinary incontinence | 0 | Risk Ratio (M‐H, Fixed, 95% CI) | 0.0 [0.0, 0.0] | |
| 8 Repeat surgery for urinary incontinence Show forest plot | 1 | Risk Ratio (M‐H, Fixed, 95% CI) | Totals not selected | |
| 8.1 urodynamic stress incontinence (only) | 1 | Risk Ratio (M‐H, Fixed, 95% CI) | 0.0 [0.0, 0.0] | |
| 8.2 stress urinary incontinence (symptoms only) | 0 | Risk Ratio (M‐H, Fixed, 95% CI) | 0.0 [0.0, 0.0] | |
| 8.3 mixed urinary incontinence | 0 | Risk Ratio (M‐H, Fixed, 95% CI) | 0.0 [0.0, 0.0] | |
| Outcome or subgroup title | No. of studies | No. of participants | Statistical method | Effect size |
| 1 Number with incontinence (worse, unchanged, or improved) within first year (women's observations) Show forest plot | 1 | Risk Ratio (M‐H, Fixed, 95% CI) | Totals not selected | |
| 1.1 urodynamic stress incontinence (only) | 1 | Risk Ratio (M‐H, Fixed, 95% CI) | 0.0 [0.0, 0.0] | |
| 1.2 stress urinary incontinence (symptoms only) | 0 | Risk Ratio (M‐H, Fixed, 95% CI) | 0.0 [0.0, 0.0] | |
| 1.3 mixed incontinence | 0 | Risk Ratio (M‐H, Fixed, 95% CI) | 0.0 [0.0, 0.0] | |
| 2 Number with incontinence (worse, unchanged, or improved) after first year (women's observations) Show forest plot | 1 | Risk Ratio (M‐H, Fixed, 95% CI) | Totals not selected | |
| 2.1 urodynamic stress incontinence (only) | 1 | Risk Ratio (M‐H, Fixed, 95% CI) | 0.0 [0.0, 0.0] | |
| 2.2 stress urinary incontinence (symptoms only) | 0 | Risk Ratio (M‐H, Fixed, 95% CI) | 0.0 [0.0, 0.0] | |
| 2.3 mixed incontinence | 0 | Risk Ratio (M‐H, Fixed, 95% CI) | 0.0 [0.0, 0.0] | |
| 3 CURE: number of women cured after first year (women's observations) Show forest plot | 1 | Odds Ratio (M‐H, Fixed, 95% CI) | Totals not selected | |
| 3.1 urodynamic stress incontinence (only) | 1 | Odds Ratio (M‐H, Fixed, 95% CI) | 0.0 [0.0, 0.0] | |
| 3.2 stress urinary incontinence (symptoms only) | 0 | Odds Ratio (M‐H, Fixed, 95% CI) | 0.0 [0.0, 0.0] | |
| 3.3 mixed incontinence | 0 | Odds Ratio (M‐H, Fixed, 95% CI) | 0.0 [0.0, 0.0] | |
| 4 Length of hospital stay (hours) Show forest plot | 1 | Mean Difference (IV, Fixed, 95% CI) | Totals not selected | |
| 4.1 urodynamic stress incontinence (only) | 1 | Mean Difference (IV, Fixed, 95% CI) | 0.0 [0.0, 0.0] | |
| 4.2 stress urinary incontinence (symptoms only) | 0 | Mean Difference (IV, Fixed, 95% CI) | 0.0 [0.0, 0.0] | |
| 4.3 mixed incontinence | 0 | Mean Difference (IV, Fixed, 95% CI) | 0.0 [0.0, 0.0] | |
| 5 Perioperative surgical complications Show forest plot | 1 | Risk Ratio (M‐H, Fixed, 95% CI) | Totals not selected | |
| 5.1 urodynamic stress incontinence (only) | 1 | Risk Ratio (M‐H, Fixed, 95% CI) | 0.0 [0.0, 0.0] | |
| 5.2 stress urinary incontinence (symptoms only) | 0 | Risk Ratio (M‐H, Fixed, 95% CI) | 0.0 [0.0, 0.0] | |
| 5.3 mixed incontinence | 0 | Risk Ratio (M‐H, Fixed, 95% CI) | 0.0 [0.0, 0.0] | |
| 6 Urge urinary symptoms, urgency urinary incontinence Show forest plot | 1 | Risk Ratio (M‐H, Fixed, 95% CI) | Totals not selected | |
| 6.1 urodynamic stress incontinence (only) | 1 | Risk Ratio (M‐H, Fixed, 95% CI) | 0.0 [0.0, 0.0] | |
| 6.2 stress urinary incontinence (symptoms only) | 0 | Risk Ratio (M‐H, Fixed, 95% CI) | 0.0 [0.0, 0.0] | |
| 6.3 mixed incontinence | 0 | Risk Ratio (M‐H, Fixed, 95% CI) | 0.0 [0.0, 0.0] | |
| 7 Voiding dysfunction after 3 months Show forest plot | 1 | Risk Ratio (M‐H, Fixed, 95% CI) | Totals not selected | |
| 7.1 urodynamic stress incontinence (only) | 1 | Risk Ratio (M‐H, Fixed, 95% CI) | 0.0 [0.0, 0.0] | |
| 7.2 stress urinary incontinence (symptoms only) | 0 | Risk Ratio (M‐H, Fixed, 95% CI) | 0.0 [0.0, 0.0] | |
| 7.3 mixed incontinence | 0 | Risk Ratio (M‐H, Fixed, 95% CI) | 0.0 [0.0, 0.0] | |
| 8 Detrusor overactivity (urodynamic diagnosis) Show forest plot | 1 | Risk Ratio (M‐H, Fixed, 95% CI) | Totals not selected | |
| 8.1 urodynamic stress incontinence (only) | 1 | Risk Ratio (M‐H, Fixed, 95% CI) | 0.0 [0.0, 0.0] | |
| 8.2 stress urinary incontinence (symptoms only) | 0 | Risk Ratio (M‐H, Fixed, 95% CI) | 0.0 [0.0, 0.0] | |
| 8.3 mixed incontinence | 0 | Risk Ratio (M‐H, Fixed, 95% CI) | 0.0 [0.0, 0.0] | |
| Outcome or subgroup title | No. of studies | No. of participants | Statistical method | Effect size |
| 1 Number of women with urinary incontinence (worse, unchanged, or improved) within first year (women's observations) Show forest plot | 4 | 147 | Risk Ratio (M‐H, Fixed, 95% CI) | 0.40 [0.11, 1.41] |
| 1.1 urodynamic stress incontinence (only) | 4 | 147 | Risk Ratio (M‐H, Fixed, 95% CI) | 0.40 [0.11, 1.41] |
| 1.2 stress urinary incontinence (symptoms only) | 0 | 0 | Risk Ratio (M‐H, Fixed, 95% CI) | 0.0 [0.0, 0.0] |
| 1.3 mixed incontinence | 0 | 0 | Risk Ratio (M‐H, Fixed, 95% CI) | 0.0 [0.0, 0.0] |
| 2 Number not improved (worse or unchanged) within first year (women's observations) | 0 | 0 | Risk Ratio (M‐H, Fixed, 95% CI) | 0.0 [0.0, 0.0] |
| 2.1 urodynamic stress incontinence (only) | 0 | 0 | Risk Ratio (M‐H, Fixed, 95% CI) | 0.0 [0.0, 0.0] |
| 2.2 stress urinary incontinence (symptoms only) | 0 | 0 | Risk Ratio (M‐H, Fixed, 95% CI) | 0.0 [0.0, 0.0] |
| 2.3 mixed incontinence | 0 | 0 | Risk Ratio (M‐H, Fixed, 95% CI) | 0.0 [0.0, 0.0] |
| 3 Number of women with urinary incontinence (worse, unchanged, or improved) at 1 to 5 years (women's observations) Show forest plot | 4 | 687 | Risk Ratio (M‐H, Fixed, 95% CI) | 0.73 [0.61, 0.89] |
| 3.1 urodynamic stress incontinence (only) | 3 | 167 | Risk Ratio (M‐H, Fixed, 95% CI) | 0.58 [0.22, 1.49] |
| 3.2 stress urinary incontinence (symptoms only) | 1 | 520 | Risk Ratio (M‐H, Fixed, 95% CI) | 0.75 [0.62, 0.91] |
| 3.3 mixed incontinence | 0 | 0 | Risk Ratio (M‐H, Fixed, 95% CI) | 0.0 [0.0, 0.0] |
| 4 Number not improved (worse or unchanged) at 1 to 5 years (women's observations) | 0 | 0 | Risk Ratio (M‐H, Fixed, 95% CI) | 0.0 [0.0, 0.0] |
| 4.1 urodynamic stress incontinence (only) | 0 | 0 | Risk Ratio (M‐H, Fixed, 95% CI) | 0.0 [0.0, 0.0] |
| 4.2 stress urinary incontinence (symptoms only) | 0 | 0 | Risk Ratio (M‐H, Fixed, 95% CI) | 0.0 [0.0, 0.0] |
| 4.3 mixed incontinence | 0 | 0 | Risk Ratio (M‐H, Fixed, 95% CI) | 0.0 [0.0, 0.0] |
| 5 Number of women with urinary incontinence (worse, unchanged, or improved) at > 5 years (women's observations) Show forest plot | 2 | 481 | Risk Ratio (M‐H, Fixed, 95% CI) | 0.85 [0.74, 0.98] |
| 5.1 urodynamic stress incontinence (only) | 1 | 28 | Risk Ratio (M‐H, Fixed, 95% CI) | 2.31 [0.24, 22.62] |
| 5.2 stress urinary incontinence (symptoms only) | 1 | 453 | Risk Ratio (M‐H, Fixed, 95% CI) | 0.84 [0.73, 0.97] |
| 5.3 mixed incontinence | 0 | 0 | Risk Ratio (M‐H, Fixed, 95% CI) | 0.0 [0.0, 0.0] |
| 6 CURE: number of women cured at > 1 year (women's observations) Show forest plot | 3 | 515 | Odds Ratio (M‐H, Fixed, 95% CI) | 1.56 [1.07, 2.28] |
| 6.1 urodynamic stress incontinence (only) | 2 | 62 | Odds Ratio (M‐H, Fixed, 95% CI) | 0.93 [0.18, 4.89] |
| 6.2 stress urinary incontinence (symptoms only) | 1 | 453 | Odds Ratio (M‐H, Fixed, 95% CI) | 1.61 [1.09, 2.37] |
| 6.3 mixed incontinence | 0 | 0 | Odds Ratio (M‐H, Fixed, 95% CI) | 0.0 [0.0, 0.0] |
| 7 Number of women not satisfied at > 5 years Show forest plot | 1 | Risk Ratio (M‐H, Fixed, 95% CI) | Totals not selected | |
| 7.1 urodynamic stress incontinence (only) | 0 | Risk Ratio (M‐H, Fixed, 95% CI) | 0.0 [0.0, 0.0] | |
| 7.2 stress urinary incontinence (symptoms only) | 1 | Risk Ratio (M‐H, Fixed, 95% CI) | 0.0 [0.0, 0.0] | |
| 7.3 mixed incontinence | 0 | Risk Ratio (M‐H, Fixed, 95% CI) | 0.0 [0.0, 0.0] | |
| 8 Incontinent episodes over 24 hours | 0 | 0 | Mean Difference (IV, Fixed, 95% CI) | 0.0 [0.0, 0.0] |
| 8.1 urodynamic stress incontinence (only) | 0 | 0 | Mean Difference (IV, Fixed, 95% CI) | 0.0 [0.0, 0.0] |
| 8.2 stress urinary incontinence (symptoms only) | 0 | 0 | Mean Difference (IV, Fixed, 95% CI) | 0.0 [0.0, 0.0] |
| 8.3 mixed incontinence | 0 | 0 | Mean Difference (IV, Fixed, 95% CI) | 0.0 [0.0, 0.0] |
| 9 Number of women with urinary incontinence (clinician's observations) within first year | 0 | 0 | Risk Ratio (M‐H, Fixed, 95% CI) | 0.0 [0.0, 0.0] |
| 9.1 urodynamic stress incontinence (only) | 0 | 0 | Risk Ratio (M‐H, Fixed, 95% CI) | 0.0 [0.0, 0.0] |
| 9.2 stress urinary incontinence (symptoms only) | 0 | 0 | Risk Ratio (M‐H, Fixed, 95% CI) | 0.0 [0.0, 0.0] |
| 9.3 mixed incontinence | 0 | 0 | Risk Ratio (M‐H, Fixed, 95% CI) | 0.0 [0.0, 0.0] |
| 10 Number of women with urinary incontinence (clinician's observations) at 1 to 5 years Show forest plot | 2 | 592 | Risk Ratio (M‐H, Fixed, 95% CI) | 0.90 [0.60, 1.34] |
| 10.1 urodynamic stress incontinence (only) | 1 | 72 | Risk Ratio (M‐H, Fixed, 95% CI) | 0.6 [0.15, 2.33] |
| 10.2 stress urinary incontinence (symptoms only) | 1 | 520 | Risk Ratio (M‐H, Fixed, 95% CI) | 0.94 [0.62, 1.42] |
| 10.3 mixed incontinence | 0 | 0 | Risk Ratio (M‐H, Fixed, 95% CI) | 0.0 [0.0, 0.0] |
| 11 Number of women with urinary incontinence (clinician's observations) at > 5 years Show forest plot | 2 | 461 | Risk Ratio (M‐H, Fixed, 95% CI) | 0.90 [0.80, 1.01] |
| 11.1 urodynamic stress incontinence (only) | 1 | 28 | Risk Ratio (M‐H, Fixed, 95% CI) | 0.23 [0.01, 4.37] |
| 11.2 stress urinary incontinence (symptoms only) | 1 | 433 | Risk Ratio (M‐H, Fixed, 95% CI) | 0.91 [0.81, 1.02] |
| 11.3 mixed incontinence | 0 | 0 | Risk Ratio (M‐H, Fixed, 95% CI) | 0.0 [0.0, 0.0] |
| 12 Duration of operation (minutes) Show forest plot | 1 | Mean Difference (IV, Fixed, 95% CI) | Totals not selected | |
| 12.1 urodynamic stress incontinence (only) | 1 | Mean Difference (IV, Fixed, 95% CI) | 0.0 [0.0, 0.0] | |
| 12.2 stress urinary incontinence (symptoms only) | 0 | Mean Difference (IV, Fixed, 95% CI) | 0.0 [0.0, 0.0] | |
| 12.3 mixed incontinence | 0 | Mean Difference (IV, Fixed, 95% CI) | 0.0 [0.0, 0.0] | |
| 13 Time to catheter removal (days) Show forest plot | 2 | 108 | Mean Difference (IV, Fixed, 95% CI) | 8.01 [6.84, 9.18] |
| 13.1 urodynamic stress incontinence (only) | 2 | 108 | Mean Difference (IV, Fixed, 95% CI) | 8.01 [6.84, 9.18] |
| 13.2 stress urinary incontinence (symptoms only) | 0 | 0 | Mean Difference (IV, Fixed, 95% CI) | 0.0 [0.0, 0.0] |
| 13.3 mixed incontinence | 0 | 0 | Mean Difference (IV, Fixed, 95% CI) | 0.0 [0.0, 0.0] |
| 14 Length of hospital stay (days) Show forest plot | 3 | Mean Difference (IV, Fixed, 95% CI) | Totals not selected | |
| 14.1 urodynamic stress incontinence (only) | 3 | Mean Difference (IV, Fixed, 95% CI) | 0.0 [0.0, 0.0] | |
| 14.2 stress urinary incontinence (symptoms only) | 0 | Mean Difference (IV, Fixed, 95% CI) | 0.0 [0.0, 0.0] | |
| 14.3 mixed incontinence | 0 | Mean Difference (IV, Fixed, 95% CI) | 0.0 [0.0, 0.0] | |
| 15 Time to return to normal activity level | 0 | 0 | Mean Difference (IV, Fixed, 95% CI) | 0.0 [0.0, 0.0] |
| 15.1 urodynamic stress incontinence (only) | 0 | 0 | Mean Difference (IV, Fixed, 95% CI) | 0.0 [0.0, 0.0] |
| 15.2 stress urinary incontinence (symptoms only) | 0 | 0 | Mean Difference (IV, Fixed, 95% CI) | 0.0 [0.0, 0.0] |
| 15.3 mixed incontinence | 0 | 0 | Mean Difference (IV, Fixed, 95% CI) | 0.0 [0.0, 0.0] |
| 16 Perioperative surgical complications Show forest plot | 4 | 792 | Risk Ratio (M‐H, Fixed, 95% CI) | 1.24 [0.83, 1.86] |
| 16.1 urodynamic stress incontinence (only) | 3 | 137 | Risk Ratio (M‐H, Fixed, 95% CI) | 0.85 [0.28, 2.52] |
| 16.2 stress urinary incontinence (symptoms only) | 1 | 655 | Risk Ratio (M‐H, Fixed, 95% CI) | 1.32 [0.86, 2.04] |
| 16.3 mixed incontinence | 0 | 0 | Risk Ratio (M‐H, Fixed, 95% CI) | 0.0 [0.0, 0.0] |
| 17 Bladder perforation Show forest plot | 1 | Risk Ratio (M‐H, Fixed, 95% CI) | Totals not selected | |
| 17.1 urodynamic stress incontinence (only) | 0 | Risk Ratio (M‐H, Fixed, 95% CI) | 0.0 [0.0, 0.0] | |
| 17.2 stress urinary incontinence (symptoms only) | 1 | Risk Ratio (M‐H, Fixed, 95% CI) | 0.0 [0.0, 0.0] | |
| 17.3 mixed incontinence | 0 | Risk Ratio (M‐H, Fixed, 95% CI) | 0.0 [0.0, 0.0] | |
| 18 Urinary tract infection Show forest plot | 1 | Risk Ratio (M‐H, Fixed, 95% CI) | Totals not selected | |
| 18.1 urodynamic stress incontinence (only) | 0 | Risk Ratio (M‐H, Fixed, 95% CI) | 0.0 [0.0, 0.0] | |
| 18.2 stress urinary incontinence (symptoms only) | 1 | Risk Ratio (M‐H, Fixed, 95% CI) | 0.0 [0.0, 0.0] | |
| 18.3 mixed incontinence | 0 | Risk Ratio (M‐H, Fixed, 95% CI) | 0.0 [0.0, 0.0] | |
| 19 Number of women with recurrent UTIs at > 5 years Show forest plot | 1 | Risk Ratio (M‐H, Fixed, 95% CI) | Totals not selected | |
| 19.1 urodynamic stress incontinence (only) | 0 | Risk Ratio (M‐H, Fixed, 95% CI) | 0.0 [0.0, 0.0] | |
| 19.2 stress urinary incontinence (symptoms only) | 1 | Risk Ratio (M‐H, Fixed, 95% CI) | 0.0 [0.0, 0.0] | |
| 19.3 mixed incontinence | 0 | Risk Ratio (M‐H, Fixed, 95% CI) | 0.0 [0.0, 0.0] | |
| 20 Urge urinary symptoms, urgency urinary incontinence Show forest plot | 2 | 525 | Risk Ratio (M‐H, Fixed, 95% CI) | 1.10 [0.74, 1.64] |
| 20.1 urodynamic stress incontinence (only) | 1 | 72 | Risk Ratio (M‐H, Fixed, 95% CI) | 2.0 [0.54, 7.39] |
| 20.2 stress urinary incontinence (symptoms only) | 1 | 453 | Risk Ratio (M‐H, Fixed, 95% CI) | 1.02 [0.67, 1.56] |
| 20.3 mixed incontinence | 0 | 0 | Risk Ratio (M‐H, Fixed, 95% CI) | 0.0 [0.0, 0.0] |
| 21 Detrusor overactivity (urodynamic diagnosis) Show forest plot | 4 | 203 | Risk Ratio (M‐H, Fixed, 95% CI) | 1.42 [0.52, 3.87] |
| 21.1 urodynamic stress incontinence (only) | 4 | 203 | Risk Ratio (M‐H, Fixed, 95% CI) | 1.42 [0.52, 3.87] |
| 21.2 stress urinary incontinence (symptoms only) | 0 | 0 | Risk Ratio (M‐H, Fixed, 95% CI) | 0.0 [0.0, 0.0] |
| 21.3 mixed incontinence | 0 | 0 | Risk Ratio (M‐H, Fixed, 95% CI) | 0.0 [0.0, 0.0] |
| 22 Voiding dysfunction after 3 months Show forest plot | 5 | 853 | Risk Ratio (M‐H, Fixed, 95% CI) | 6.08 [3.10, 11.95] |
| 22.1 urodynamic stress incontinence (only) | 4 | 198 | Risk Ratio (M‐H, Fixed, 95% CI) | 4.48 [1.16, 17.36] |
| 22.2 stress urinary incontinence (symptoms only) | 1 | 655 | Risk Ratio (M‐H, Fixed, 95% CI) | 6.63 [3.04, 14.47] |
| 22.3 mixed incontinence | 0 | 0 | Risk Ratio (M‐H, Fixed, 95% CI) | 0.0 [0.0, 0.0] |
| 23 Long‐term voiding dysfunction > 5 years Show forest plot | 1 | Risk Ratio (M‐H, Fixed, 95% CI) | Totals not selected | |
| 23.1 urodynamic stress incontinence (only) | 0 | Risk Ratio (M‐H, Fixed, 95% CI) | 0.0 [0.0, 0.0] | |
| 23.2 stress urinary incontinence (symptoms only) | 1 | Risk Ratio (M‐H, Fixed, 95% CI) | 0.0 [0.0, 0.0] | |
| 23.3 mixed incontinence | 0 | Risk Ratio (M‐H, Fixed, 95% CI) | 0.0 [0.0, 0.0] | |
| 24 Number of women requiring treatment for pelvic organ prolapse Show forest plot | 3 | 559 | Risk Ratio (M‐H, Fixed, 95% CI) | 0.20 [0.05, 0.77] |
| 24.1 urodynamic stress incontinence (only) | 2 | 106 | Risk Ratio (M‐H, Fixed, 95% CI) | 0.2 [0.04, 1.11] |
| 24.2 stress urinary incontinence (symptoms only) | 1 | 453 | Risk Ratio (M‐H, Fixed, 95% CI) | 0.20 [0.02, 1.74] |
| 24.3 mixed incontinence | 0 | 0 | Risk Ratio (M‐H, Fixed, 95% CI) | 0.0 [0.0, 0.0] |
| 25 Repeat surgery for urinary incontinence Show forest plot | 1 | Risk Ratio (M‐H, Fixed, 95% CI) | Totals not selected | |
| 25.1 urodynamic stress incontinence (only) | 0 | Risk Ratio (M‐H, Fixed, 95% CI) | 0.0 [0.0, 0.0] | |
| 25.2 stress urinary incontinence (symptoms only) | 1 | Risk Ratio (M‐H, Fixed, 95% CI) | 0.0 [0.0, 0.0] | |
| 25.3 mixed incontinence | 0 | Risk Ratio (M‐H, Fixed, 95% CI) | 0.0 [0.0, 0.0] | |
| 26 Condition‐specific measures to assess quality of life Show forest plot | 1 | Mean Difference (IV, Fixed, 95% CI) | Totals not selected | |
| 26.1 Urinary Distress Index (UDI) | 1 | Mean Difference (IV, Fixed, 95% CI) | 0.0 [0.0, 0.0] | |
| 26.2 Incontinence Impact Questionnaire (IIQ) | 1 | Mean Difference (IV, Fixed, 95% CI) | 0.0 [0.0, 0.0] | |
| Outcome or subgroup title | No. of studies | No. of participants | Statistical method | Effect size |
| 1 Number of women with urinary incontinence (worse, unchanged, or improved) within first year (women's observations) Show forest plot | 11 | 841 | Risk Ratio (M‐H, Fixed, 95% CI) | 1.04 [0.85, 1.28] |
| 1.1 urodynamic stress incontinence (only) | 5 | 427 | Risk Ratio (M‐H, Fixed, 95% CI) | 1.02 [0.77, 1.36] |
| 1.2 stress urinary incontinence (symptoms only) | 1 | 53 | Risk Ratio (M‐H, Fixed, 95% CI) | 1.12 [0.17, 7.37] |
| 1.3 mixed urinary incontinence | 5 | 361 | Risk Ratio (M‐H, Fixed, 95% CI) | 1.06 [0.78, 1.42] |
| 2 Number not improved (worse or unchanged) within first year (women's observations) Show forest plot | 3 | 425 | Risk Ratio (M‐H, Fixed, 95% CI) | 0.79 [0.49, 1.29] |
| 2.1 urodynamic stress incontinence (only) | 2 | 286 | Risk Ratio (M‐H, Fixed, 95% CI) | 0.95 [0.40, 2.21] |
| 2.2 stress urinary incontinence (symptoms only) | 0 | 0 | Risk Ratio (M‐H, Fixed, 95% CI) | 0.0 [0.0, 0.0] |
| 2.3 mixed urinary incontinence | 1 | 139 | Risk Ratio (M‐H, Fixed, 95% CI) | 0.72 [0.40, 1.29] |
| 3 Number of women with urinary incontinence (worse, unchanged, or improved) at 1 to 5 years (women's observations) Show forest plot | 6 | 458 | Risk Ratio (M‐H, Fixed, 95% CI) | 1.29 [0.98, 1.68] |
| 3.1 urodynamic stress incontinence (only) | 4 | 364 | Risk Ratio (M‐H, Fixed, 95% CI) | 1.18 [0.87, 1.59] |
| 3.2 stress urinary incontinence (symptoms only) | 0 | 0 | Risk Ratio (M‐H, Fixed, 95% CI) | 0.0 [0.0, 0.0] |
| 3.3 mixed urinary incontinence | 2 | 94 | Risk Ratio (M‐H, Fixed, 95% CI) | 1.79 [0.96, 3.31] |
| 4 Number not improved (worse or unchanged) after first year (women's observations) Show forest plot | 2 | 264 | Risk Ratio (M‐H, Fixed, 95% CI) | 1.28 [0.56, 2.94] |
| 4.1 urodynamic stress incontinence (only) | 2 | 264 | Risk Ratio (M‐H, Fixed, 95% CI) | 1.28 [0.56, 2.94] |
| 4.2 stress urinary incontinence (symptoms only) | 0 | 0 | Risk Ratio (M‐H, Fixed, 95% CI) | 0.0 [0.0, 0.0] |
| 4.3 mixed urinary incontinence | 0 | 0 | Risk Ratio (M‐H, Fixed, 95% CI) | 0.0 [0.0, 0.0] |
| 5 Number of women with urinary incontinence after 5 years (women's observations) Show forest plot | 1 | Risk Ratio (M‐H, Fixed, 95% CI) | Totals not selected | |
| 5.1 urodynamic stress incontinence (only) | 1 | Risk Ratio (M‐H, Fixed, 95% CI) | 0.0 [0.0, 0.0] | |
| 5.2 stress urinary incontinence (symptoms only) | 0 | Risk Ratio (M‐H, Fixed, 95% CI) | 0.0 [0.0, 0.0] | |
| 5.3 mixed urinary incontinence | 0 | Risk Ratio (M‐H, Fixed, 95% CI) | 0.0 [0.0, 0.0] | |
| 6 Number with incontinence not improved after 5 years (women's observations) Show forest plot | 1 | Risk Ratio (M‐H, Fixed, 95% CI) | Totals not selected | |
| 6.1 urodynamic stress incontinence (only) | 1 | Risk Ratio (M‐H, Fixed, 95% CI) | 0.0 [0.0, 0.0] | |
| 6.2 stress urinary incontinence (symptoms only) | 0 | Risk Ratio (M‐H, Fixed, 95% CI) | 0.0 [0.0, 0.0] | |
| 6.3 mixed urinary incontinence | 0 | Risk Ratio (M‐H, Fixed, 95% CI) | 0.0 [0.0, 0.0] | |
| 7 CURE: number of women cured at > 1 year (women's observations) Show forest plot | 4 | 337 | Odds Ratio (M‐H, Fixed, 95% CI) | 1.06 [0.65, 1.72] |
| 7.1 urodynamic stress incontinence (only) | 3 | 293 | Odds Ratio (M‐H, Fixed, 95% CI) | 1.21 [0.72, 2.03] |
| 7.2 stress urinary incontinence (symptoms only) | 0 | 0 | Odds Ratio (M‐H, Fixed, 95% CI) | 0.0 [0.0, 0.0] |
| 7.3 mixed urinary incontinence | 1 | 44 | Odds Ratio (M‐H, Fixed, 95% CI) | 0.42 [0.10, 1.72] |
| 8 Repeat surgery for urinary incontinence Show forest plot | 1 | Risk Ratio (M‐H, Fixed, 95% CI) | Totals not selected | |
| 8.1 urodynamic stress incontinence (only) | 1 | Risk Ratio (M‐H, Fixed, 95% CI) | 0.0 [0.0, 0.0] | |
| 8.2 stress urinary incontinence (symptoms only) | 0 | Risk Ratio (M‐H, Fixed, 95% CI) | 0.0 [0.0, 0.0] | |
| 8.3 mixed incontinence | 0 | Risk Ratio (M‐H, Fixed, 95% CI) | 0.0 [0.0, 0.0] | |
| 9 Number of women not satisfied Show forest plot | 2 | Risk Ratio (M‐H, Fixed, 95% CI) | Subtotals only | |
| 9.1 urodynamic stress incontinence (only) | 2 | 163 | Risk Ratio (M‐H, Fixed, 95% CI) | 0.82 [0.51, 1.32] |
| 9.2 stress urinary incontinence (symptoms only) | 0 | 0 | Risk Ratio (M‐H, Fixed, 95% CI) | 0.0 [0.0, 0.0] |
| 9.3 mixed urinary incontinence | 0 | 0 | Risk Ratio (M‐H, Fixed, 95% CI) | 0.0 [0.0, 0.0] |
| 10 Pad test of quantified leakage (mean weight of urine loss) Show forest plot | 1 | Mean Difference (IV, Fixed, 95% CI) | Totals not selected | |
| 10.1 urodynamic stress incontinence (only) | 1 | Mean Difference (IV, Fixed, 95% CI) | 0.0 [0.0, 0.0] | |
| 10.2 stress urinary incontinence (symptoms only) | 0 | Mean Difference (IV, Fixed, 95% CI) | 0.0 [0.0, 0.0] | |
| 10.3 mixed urinary incontinence | 0 | Mean Difference (IV, Fixed, 95% CI) | 0.0 [0.0, 0.0] | |
| 11 Number of women with urinary incontinence (clinician's observations) within first year Show forest plot | 2 | 105 | Risk Ratio (M‐H, Fixed, 95% CI) | 1.29 [0.45, 3.71] |
| 11.1 urodynamic stress incontinence (only) | 0 | 0 | Risk Ratio (M‐H, Fixed, 95% CI) | 0.0 [0.0, 0.0] |
| 11.2 stress urinary incontinence (symptoms only) | 0 | 0 | Risk Ratio (M‐H, Fixed, 95% CI) | 0.0 [0.0, 0.0] |
| 11.3 mixed urinary incontinence | 2 | 105 | Risk Ratio (M‐H, Fixed, 95% CI) | 1.29 [0.45, 3.71] |
| 12 Number of women with urinary incontinence (clinician's observations) after first year Show forest plot | 1 | Risk Ratio (M‐H, Fixed, 95% CI) | Totals not selected | |
| 12.1 urodynamic stress incontinence (only) | 0 | Risk Ratio (M‐H, Fixed, 95% CI) | 0.0 [0.0, 0.0] | |
| 12.2 stress urinary incontinence (symptoms only) | 0 | Risk Ratio (M‐H, Fixed, 95% CI) | 0.0 [0.0, 0.0] | |
| 12.3 mixed urinary incontinence | 1 | Risk Ratio (M‐H, Fixed, 95% CI) | 0.0 [0.0, 0.0] | |
| 13 Duration of operation (minutes) Show forest plot | 7 | 355 | Mean Difference (IV, Fixed, 95% CI) | 57.08 [54.67, 59.49] |
| 13.1 urodynamic stress incontinence (only) | 2 | 61 | Mean Difference (IV, Fixed, 95% CI) | 46.91 [42.31, 51.52] |
| 13.2 stress urinary incontinence (symptoms only) | 1 | 53 | Mean Difference (IV, Fixed, 95% CI) | 20.0 [7.08, 32.92] |
| 13.3 mixed urinary incontinence | 4 | 241 | Mean Difference (IV, Fixed, 95% CI) | 62.96 [60.07, 65.86] |
| 14 Length of hospital stay (days) Show forest plot | 4 | 194 | Mean Difference (IV, Fixed, 95% CI) | 0.74 [0.55, 0.93] |
| 14.1 urodynamic stress incontinence (only) | 1 | 20 | Mean Difference (IV, Fixed, 95% CI) | 0.65 [0.39, 0.91] |
| 14.2 stress urinary incontinence (symptoms only) | 0 | 0 | Mean Difference (IV, Fixed, 95% CI) | 0.0 [0.0, 0.0] |
| 14.3 mixed urinary incontinence | 3 | 174 | Mean Difference (IV, Fixed, 95% CI) | 0.83 [0.56, 1.10] |
| 15 Time to catheter removal (days) Show forest plot | 2 | 113 | Mean Difference (IV, Fixed, 95% CI) | 0.11 [‐0.07, 0.30] |
| 15.1 urodynamic stress incontinence (only) | 0 | 0 | Mean Difference (IV, Fixed, 95% CI) | 0.0 [0.0, 0.0] |
| 15.2 stress urinary incontinence (symptoms only) | 1 | 53 | Mean Difference (IV, Fixed, 95% CI) | 2.3 [0.01, 4.59] |
| 15.3 mixed urinary incontinence | 1 | 60 | Mean Difference (IV, Fixed, 95% CI) | 0.10 [‐0.09, 0.29] |
| 16 Perioperative surgical complications Show forest plot | 4 | 293 | Risk Ratio (M‐H, Fixed, 95% CI) | 1.74 [1.16, 2.60] |
| 16.1 urodynamic stress incontinence (only) | 2 | 183 | Risk Ratio (M‐H, Fixed, 95% CI) | 1.73 [1.01, 2.96] |
| 16.2 stress urinary incontinence (symptoms only) | 0 | 0 | Risk Ratio (M‐H, Fixed, 95% CI) | 0.0 [0.0, 0.0] |
| 16.3 mixed urinary incontinence | 2 | 110 | Risk Ratio (M‐H, Fixed, 95% CI) | 1.74 [0.94, 3.21] |
| 17 Bladder perforations Show forest plot | 10 | 844 | Risk Ratio (M‐H, Fixed, 95% CI) | 0.59 [0.34, 1.01] |
| 17.1 urodynamic stress incontinence (only) | 3 | 334 | Risk Ratio (M‐H, Fixed, 95% CI) | 0.74 [0.19, 2.86] |
| 17.2 stress urinary incontinence (symptoms only) | 1 | 53 | Risk Ratio (M‐H, Fixed, 95% CI) | 0.56 [0.05, 5.81] |
| 17.3 mixed urinary incontinence | 6 | 457 | Risk Ratio (M‐H, Fixed, 95% CI) | 0.56 [0.30, 1.03] |
| 18 Urethral injury Show forest plot | 1 | Risk Ratio (M‐H, Fixed, 95% CI) | Totals not selected | |
| 18.1 urodynamic stress incontinence (only) | 0 | Risk Ratio (M‐H, Fixed, 95% CI) | 0.0 [0.0, 0.0] | |
| 18.2 stress urinary incontinence (symptoms only) | 0 | Risk Ratio (M‐H, Fixed, 95% CI) | 0.0 [0.0, 0.0] | |
| 18.3 mixed urinary incontinence | 1 | Risk Ratio (M‐H, Fixed, 95% CI) | 0.0 [0.0, 0.0] | |
| 19 Vaginal bleeding Show forest plot | 1 | Risk Ratio (M‐H, Fixed, 95% CI) | Totals not selected | |
| 19.1 urodynamic stress incontinence (only) | 0 | Risk Ratio (M‐H, Fixed, 95% CI) | 0.0 [0.0, 0.0] | |
| 19.2 stress urinary incontinence (symptoms only) | 0 | Risk Ratio (M‐H, Fixed, 95% CI) | 0.0 [0.0, 0.0] | |
| 19.3 mixed urinary incontinence | 1 | Risk Ratio (M‐H, Fixed, 95% CI) | 0.0 [0.0, 0.0] | |
| 20 Urinary tract infection Show forest plot | 1 | Risk Ratio (M‐H, Fixed, 95% CI) | Totals not selected | |
| 20.1 urodynamic stress incontinence (only) | 0 | Risk Ratio (M‐H, Fixed, 95% CI) | 0.0 [0.0, 0.0] | |
| 20.2 stress urinary incontinence (symptoms only) | 0 | Risk Ratio (M‐H, Fixed, 95% CI) | 0.0 [0.0, 0.0] | |
| 20.3 mixed urinary incontinence | 1 | Risk Ratio (M‐H, Fixed, 95% CI) | 0.0 [0.0, 0.0] | |
| 21 Voiding dysfunction Show forest plot | 8 | 629 | Risk Ratio (M‐H, Fixed, 95% CI) | 1.34 [0.85, 2.12] |
| 21.1 urodynamic stress incontinence (only) | 3 | 325 | Risk Ratio (M‐H, Fixed, 95% CI) | 1.22 [0.60, 2.46] |
| 21.2 stress urinary incontinence (symptoms only) | 1 | 53 | Risk Ratio (M‐H, Fixed, 95% CI) | 2.61 [0.76, 9.03] |
| 21.3 mixed urinary incontinence | 4 | 251 | Risk Ratio (M‐H, Fixed, 95% CI) | 1.18 [0.58, 2.40] |
| 22 De novo detrusor urgency or urge symptoms Show forest plot | 5 | 348 | Risk Ratio (M‐H, Fixed, 95% CI) | 1.62 [0.66, 3.99] |
| 22.1 urodynamic stress incontinence (only) | 1 | 124 | Risk Ratio (M‐H, Fixed, 95% CI) | 0.34 [0.01, 8.29] |
| 22.2 stress urinary incontinence (symptoms only) | 1 | 53 | Risk Ratio (M‐H, Fixed, 95% CI) | 3.35 [0.14, 78.60] |
| 22.3 mixed urinary incontinence | 3 | 171 | Risk Ratio (M‐H, Fixed, 95% CI) | 1.81 [0.65, 5.06] |
| 23 De novo detrusor overactivity (urodynamic diagnosis) Show forest plot | 4 | 325 | Risk Ratio (M‐H, Fixed, 95% CI) | 2.61 [1.17, 5.84] |
| 23.1 urodynamic stress incontinence (only) | 1 | 59 | Risk Ratio (M‐H, Fixed, 95% CI) | 0.0 [0.0, 0.0] |
| 23.2 stress urinary incontinence (symptoms only) | 1 | 47 | Risk Ratio (M‐H, Fixed, 95% CI) | 3.13 [0.13, 73.01] |
| 23.3 mixed urinary incontinence | 2 | 219 | Risk Ratio (M‐H, Fixed, 95% CI) | 2.57 [1.12, 5.92] |
| 24 Long‐term adverse effects (release of sling required) Show forest plot | 3 | 326 | Risk Ratio (M‐H, Fixed, 95% CI) | 2.53 [0.87, 7.35] |
| 24.1 urodynamic stress incontinence (only) | 2 | 266 | Risk Ratio (M‐H, Fixed, 95% CI) | 1.68 [0.50, 5.66] |
| 24.2 stress urinary incontinence (symptoms only) | 0 | 0 | Risk Ratio (M‐H, Fixed, 95% CI) | 0.0 [0.0, 0.0] |
| 24.3 mixed urinary incontinence | 1 | 60 | Risk Ratio (M‐H, Fixed, 95% CI) | 9.6 [0.54, 170.84] |
| 25 Long‐term adverse effects (wound pain at 6 months) Show forest plot | 3 | 257 | Risk Ratio (M‐H, Fixed, 95% CI) | 6.40 [1.94, 21.12] |
| 25.1 urodynamic stress incontinence (only) | 1 | 124 | Risk Ratio (M‐H, Fixed, 95% CI) | 5.16 [0.25, 105.36] |
| 25.2 stress urinary incontinence (symptoms only) | 1 | 53 | Risk Ratio (M‐H, Fixed, 95% CI) | 3.92 [0.90, 17.15] |
| 25.3 mixed urinary incontinence | 1 | 80 | Risk Ratio (M‐H, Fixed, 95% CI) | 17.0 [1.01, 284.96] |
| 26 Long‐term adverse effects (vaginal mesh or graft exposure) Show forest plot | 5 | 348 | Risk Ratio (M‐H, Fixed, 95% CI) | 0.28 [0.05, 1.65] |
| 26.1 urodynamic stress incontinence (only) | 2 | 165 | Risk Ratio (M‐H, Fixed, 95% CI) | 0.35 [0.04, 3.24] |
| 26.2 stress urinary incontinence (symptoms only) | 1 | 53 | Risk Ratio (M‐H, Fixed, 95% CI) | 0.0 [0.0, 0.0] |
| 26.3 mixed urinary incontinence | 2 | 130 | Risk Ratio (M‐H, Fixed, 95% CI) | 0.2 [0.01, 3.97] |
| 27 Condition‐specific measures to assess quality of life: UDI‐6 Show forest plot | 1 | 63 | Mean Difference (IV, Fixed, 95% CI) | 7.30 [‐2.00, 16.60] |
| 27.1 urodynamic stress incontinence (only) | 0 | 0 | Mean Difference (IV, Fixed, 95% CI) | 0.0 [0.0, 0.0] |
| 27.2 stress urinary incontinence (symptoms only) | 1 | 63 | Mean Difference (IV, Fixed, 95% CI) | 7.30 [‐2.00, 16.60] |
| 27.3 mixed urinary incontinence | 0 | 0 | Mean Difference (IV, Fixed, 95% CI) | 0.0 [0.0, 0.0] |
| 28 Condition‐specific measures to assess quality of life: IIQ‐7 Show forest plot | 1 | 63 | Mean Difference (IV, Fixed, 95% CI) | 0.60 [‐10.17, 11.37] |
| 28.1 urodynamic stress incontinence (only) | 0 | 0 | Mean Difference (IV, Fixed, 95% CI) | 0.0 [0.0, 0.0] |
| 28.2 stress urinary incontinence (symptoms only) | 1 | 63 | Mean Difference (IV, Fixed, 95% CI) | 0.60 [‐10.17, 11.37] |
| 28.3 mixed urinary incontinence | 0 | 0 | Mean Difference (IV, Fixed, 95% CI) | 0.0 [0.0, 0.0] |
| Outcome or subgroup title | No. of studies | No. of participants | Statistical method | Effect size |
| 1 Number of women with urinary incontinence in the medium term (1 to 5 years) Show forest plot | 1 | Risk Ratio (M‐H, Fixed, 95% CI) | Totals not selected | |
| 1.1 urodynamic stress incontinence (only) | 1 | Risk Ratio (M‐H, Fixed, 95% CI) | 0.0 [0.0, 0.0] | |
| 1.2 stress urinary incontinence (symptoms only) | 0 | Risk Ratio (M‐H, Fixed, 95% CI) | 0.0 [0.0, 0.0] | |
| 1.3 mixed incontinence | 0 | Risk Ratio (M‐H, Fixed, 95% CI) | 0.0 [0.0, 0.0] | |
| 2 Number of women not satisfied within first year Show forest plot | 1 | Risk Ratio (M‐H, Fixed, 95% CI) | Totals not selected | |
| 2.1 urodynamic stress incontinence (only) | 1 | Risk Ratio (M‐H, Fixed, 95% CI) | 0.0 [0.0, 0.0] | |
| 2.2 stress urinary incontinence (symptoms only) | 0 | Risk Ratio (M‐H, Fixed, 95% CI) | 0.0 [0.0, 0.0] | |
| 2.3 mixed incontinence | 0 | Risk Ratio (M‐H, Fixed, 95% CI) | 0.0 [0.0, 0.0] | |
| 3 Number of women with urinary incontinence (clinician's observations) within first year Show forest plot | 1 | Risk Ratio (M‐H, Fixed, 95% CI) | Totals not selected | |
| 3.1 urodynamic stress incontinence (only) | 1 | Risk Ratio (M‐H, Fixed, 95% CI) | 0.0 [0.0, 0.0] | |
| 3.2 stress urinary incontinence (symptoms only) | 0 | Risk Ratio (M‐H, Fixed, 95% CI) | 0.0 [0.0, 0.0] | |
| 3.3 mixed incontinence | 0 | Risk Ratio (M‐H, Fixed, 95% CI) | 0.0 [0.0, 0.0] | |
| 4 CURE: number of women cured at > 1 year (women's observations) Show forest plot | 1 | Odds Ratio (M‐H, Fixed, 95% CI) | Totals not selected | |
| 4.1 urodynamic stress incontinence (only) | 1 | Odds Ratio (M‐H, Fixed, 95% CI) | 0.0 [0.0, 0.0] | |
| 4.2 stress urinary incontinence (symptoms only) | 0 | Odds Ratio (M‐H, Fixed, 95% CI) | 0.0 [0.0, 0.0] | |
| 4.3 mixed incontinence | 0 | Odds Ratio (M‐H, Fixed, 95% CI) | 0.0 [0.0, 0.0] | |
| 5 Bladder perforation Show forest plot | 1 | Risk Ratio (M‐H, Fixed, 95% CI) | Totals not selected | |
| 5.1 urodynamic stress incontinence (only) | 1 | Risk Ratio (M‐H, Fixed, 95% CI) | 0.0 [0.0, 0.0] | |
| 5.2 stress urinary incontinence (symptoms only) | 0 | Risk Ratio (M‐H, Fixed, 95% CI) | 0.0 [0.0, 0.0] | |
| 5.3 mixed incontinence | 0 | Risk Ratio (M‐H, Fixed, 95% CI) | 0.0 [0.0, 0.0] | |
| 6 Urge urinary symptoms, urgency urinary incontinence Show forest plot | 1 | Risk Ratio (M‐H, Fixed, 95% CI) | Totals not selected | |
| 6.1 urodynamic stress incontinence (only) | 1 | Risk Ratio (M‐H, Fixed, 95% CI) | 0.0 [0.0, 0.0] | |
| 6.2 stress urinary incontinence (symptoms only) | 0 | Risk Ratio (M‐H, Fixed, 95% CI) | 0.0 [0.0, 0.0] | |
| 6.3 mixed incontinence | 0 | Risk Ratio (M‐H, Fixed, 95% CI) | 0.0 [0.0, 0.0] | |
| 7 Pain with intercourse (dyspareunia) Show forest plot | 1 | Risk Ratio (M‐H, Fixed, 95% CI) | Totals not selected | |
| 7.1 urodynamic stress incontinence (only) | 1 | Risk Ratio (M‐H, Fixed, 95% CI) | 0.0 [0.0, 0.0] | |
| 7.2 stress urinary incontinence (symptoms only) | 0 | Risk Ratio (M‐H, Fixed, 95% CI) | 0.0 [0.0, 0.0] | |
| 7.3 mixed incontinence | 0 | Risk Ratio (M‐H, Fixed, 95% CI) | 0.0 [0.0, 0.0] | |
| 8 Long‐term adverse effects (vaginal mesh or graft exposure) Show forest plot | 1 | Risk Ratio (M‐H, Fixed, 95% CI) | Totals not selected | |
| 8.1 urodynamic stress incontinence (only) | 1 | Risk Ratio (M‐H, Fixed, 95% CI) | 0.0 [0.0, 0.0] | |
| 8.2 stress urinary incontinence (symptoms only) | 0 | Risk Ratio (M‐H, Fixed, 95% CI) | 0.0 [0.0, 0.0] | |
| 8.3 mixed incontinence | 0 | Risk Ratio (M‐H, Fixed, 95% CI) | 0.0 [0.0, 0.0] | |
| 9 Condition‐specific measures to assess quality of life: IIQ score Show forest plot | 1 | Mean Difference (IV, Fixed, 95% CI) | Totals not selected | |
| 9.1 urodynamic stress incontinence (only) | 1 | Mean Difference (IV, Fixed, 95% CI) | 0.0 [0.0, 0.0] | |
| 9.2 stress urinary incontinence (symptoms only) | 0 | Mean Difference (IV, Fixed, 95% CI) | 0.0 [0.0, 0.0] | |
| 9.3 mixed urinary incontinence | 0 | Mean Difference (IV, Fixed, 95% CI) | 0.0 [0.0, 0.0] | |
| Outcome or subgroup title | No. of studies | No. of participants | Statistical method | Effect size |
| 1 Number of women with urinary incontinence (worse, unchanged, or improved) within first year (women's observations) Show forest plot | 5 | Risk Ratio (M‐H, Fixed, 95% CI) | Totals not selected | |
| 1.1 fascial sling vs Pelvicol sling | 1 | Risk Ratio (M‐H, Fixed, 95% CI) | 0.0 [0.0, 0.0] | |
| 1.2 standard sling vs short sling | 1 | Risk Ratio (M‐H, Fixed, 95% CI) | 0.0 [0.0, 0.0] | |
| 1.3 autologous fascial sling vs Fortaperm sling | 1 | Risk Ratio (M‐H, Fixed, 95% CI) | 0.0 [0.0, 0.0] | |
| 1.4 Vypro vs Ultrapro | 1 | Risk Ratio (M‐H, Fixed, 95% CI) | 0.0 [0.0, 0.0] | |
| 1.5 Vypro vs Prolene light | 1 | Risk Ratio (M‐H, Fixed, 95% CI) | 0.0 [0.0, 0.0] | |
| 1.6 Ultrapro vs Prolene light | 1 | Risk Ratio (M‐H, Fixed, 95% CI) | 0.0 [0.0, 0.0] | |
| 1.7 fascial sling vs vaginal wall sling | 1 | Risk Ratio (M‐H, Fixed, 95% CI) | 0.0 [0.0, 0.0] | |
| 2 Number not improved (worse or unchanged) within first year (women's observations) Show forest plot | 3 | Risk Ratio (M‐H, Fixed, 95% CI) | Totals not selected | |
| 2.1 fascial sling vs Pelvicol sling | 1 | Risk Ratio (M‐H, Fixed, 95% CI) | 0.0 [0.0, 0.0] | |
| 2.2 autologous fascial sling vs Fortaperm sling | 1 | Risk Ratio (M‐H, Fixed, 95% CI) | 0.0 [0.0, 0.0] | |
| 2.3 rectus fascia sling vs Goretex sling | 1 | Risk Ratio (M‐H, Fixed, 95% CI) | 0.0 [0.0, 0.0] | |
| 3 Number of women with urinary incontinence (worse, unchanged, or improved) at 1 to 5 years (women's observations) Show forest plot | 7 | Risk Ratio (M‐H, Fixed, 95% CI) | Totals not selected | |
| 3.1 fascial sling vs Pelvicol sling | 1 | Risk Ratio (M‐H, Fixed, 95% CI) | 0.0 [0.0, 0.0] | |
| 3.2 standard sling vs short sling | 1 | Risk Ratio (M‐H, Fixed, 95% CI) | 0.0 [0.0, 0.0] | |
| 3.3 autologous dermal graft patch vs cadaveric fascia lata | 1 | Risk Ratio (M‐H, Fixed, 95% CI) | 0.0 [0.0, 0.0] | |
| 3.4 rectus fascia sling vs Goretex sling | 1 | Risk Ratio (M‐H, Fixed, 95% CI) | 0.0 [0.0, 0.0] | |
| 3.5 Vypro vs Ultrapro | 1 | Risk Ratio (M‐H, Fixed, 95% CI) | 0.0 [0.0, 0.0] | |
| 3.6 Vypro vs Prolene light | 1 | Risk Ratio (M‐H, Fixed, 95% CI) | 0.0 [0.0, 0.0] | |
| 3.7 Ultrapro vs Prolene light | 1 | Risk Ratio (M‐H, Fixed, 95% CI) | 0.0 [0.0, 0.0] | |
| 3.8 anterior vaginal wall sling vs biosynthetic mesh sling | 1 | Risk Ratio (M‐H, Fixed, 95% CI) | 0.0 [0.0, 0.0] | |
| 3.9 anterior rectus sheath sling vs Prolene strip | 1 | Risk Ratio (M‐H, Fixed, 95% CI) | 0.0 [0.0, 0.0] | |
| 3.10 anterior rectus sheath sling vs anterior vaginal wall patch | 1 | Risk Ratio (M‐H, Fixed, 95% CI) | 0.0 [0.0, 0.0] | |
| 3.11 Prolene strip vs anterior vaginal wall patch | 1 | Risk Ratio (M‐H, Fixed, 95% CI) | 0.0 [0.0, 0.0] | |
| 4 Number not improved (worse or unchanged) after first year (women's observations) Show forest plot | 4 | Risk Ratio (M‐H, Fixed, 95% CI) | Totals not selected | |
| 4.1 fascial sling vs Pelvicol sling | 1 | Risk Ratio (M‐H, Fixed, 95% CI) | 0.0 [0.0, 0.0] | |
| 4.2 autologous dermal graft patch vs cadaveric fascia lata | 1 | Risk Ratio (M‐H, Fixed, 95% CI) | 0.0 [0.0, 0.0] | |
| 4.3 rectus fascia sling vs Goretex sling | 1 | Risk Ratio (M‐H, Fixed, 95% CI) | 0.0 [0.0, 0.0] | |
| 4.4 anterior rectus sheath sling vs Prolene strip | 1 | Risk Ratio (M‐H, Fixed, 95% CI) | 0.0 [0.0, 0.0] | |
| 4.5 anterior rectus sheath sling vs anterior vaginal wall patch | 1 | Risk Ratio (M‐H, Fixed, 95% CI) | 0.0 [0.0, 0.0] | |
| 4.6 Prolene strip vs anterior vaginal wall patch | 1 | Risk Ratio (M‐H, Fixed, 95% CI) | 0.0 [0.0, 0.0] | |
| 5 Number of women with urinary incontinence (worse, unchanged, or improved) after 5 years (women's observations) Show forest plot | 1 | Risk Ratio (M‐H, Fixed, 95% CI) | Totals not selected | |
| 5.1 standard sling vs short sling | 1 | Risk Ratio (M‐H, Fixed, 95% CI) | 0.0 [0.0, 0.0] | |
| 6 CURE: number of women with urinary incontinence > 1 year (women's observations) Show forest plot | 3 | Odds Ratio (M‐H, Fixed, 95% CI) | Totals not selected | |
| 6.1 fascial sling vs Pelvicol sling | 1 | Odds Ratio (M‐H, Fixed, 95% CI) | 0.0 [0.0, 0.0] | |
| 6.2 standard sling vs short sling | 1 | Odds Ratio (M‐H, Fixed, 95% CI) | 0.0 [0.0, 0.0] | |
| 6.3 autologous dermal graft patch vs cadaveric fascia lata | 1 | Odds Ratio (M‐H, Fixed, 95% CI) | 0.0 [0.0, 0.0] | |
| 7 Number of women not satisfied Show forest plot | 3 | Risk Ratio (M‐H, Fixed, 95% CI) | Totals not selected | |
| 7.1 fascial sling vs Pelvicol sling | 1 | Risk Ratio (M‐H, Fixed, 95% CI) | 0.0 [0.0, 0.0] | |
| 7.2 Vypro vs Ultrapro | 1 | Risk Ratio (M‐H, Fixed, 95% CI) | 0.0 [0.0, 0.0] | |
| 7.3 Vypro vs Prolene light | 1 | Risk Ratio (M‐H, Fixed, 95% CI) | 0.0 [0.0, 0.0] | |
| 7.4 Ultrapro vs Prolene light | 1 | Risk Ratio (M‐H, Fixed, 95% CI) | 0.0 [0.0, 0.0] | |
| 7.5 anterior vaginal wall sling vs biosynthetic mesh sling | 1 | Risk Ratio (M‐H, Fixed, 95% CI) | 0.0 [0.0, 0.0] | |
| 8 Pad test of quantified leakage (mean weight of urine loss) at 1 year Show forest plot | 2 | Mean Difference (IV, Fixed, 95% CI) | Totals not selected | |
| 8.1 standard sling vs short sling | 1 | Mean Difference (IV, Fixed, 95% CI) | 0.0 [0.0, 0.0] | |
| 8.2 Vypro vs Ultrapro | 1 | Mean Difference (IV, Fixed, 95% CI) | 0.0 [0.0, 0.0] | |
| 8.3 Vypro vs Prolene light | 1 | Mean Difference (IV, Fixed, 95% CI) | 0.0 [0.0, 0.0] | |
| 8.4 Ultrapro vs Prolene light | 1 | Mean Difference (IV, Fixed, 95% CI) | 0.0 [0.0, 0.0] | |
| 9 Pad test of quantified leakage (mean weight of urine loss) at 1 to 5 years Show forest plot | 1 | Mean Difference (IV, Fixed, 95% CI) | Totals not selected | |
| 9.1 Vypro vs Ultrapro | 1 | Mean Difference (IV, Fixed, 95% CI) | 0.0 [0.0, 0.0] | |
| 9.2 Vypro vs Prolene light | 1 | Mean Difference (IV, Fixed, 95% CI) | 0.0 [0.0, 0.0] | |
| 9.3 Ultrapro vs Prolene light | 1 | Mean Difference (IV, Fixed, 95% CI) | 0.0 [0.0, 0.0] | |
| 10 Duration of operation (minutes) Show forest plot | 2 | Mean Difference (IV, Fixed, 95% CI) | Totals not selected | |
| 10.1 standard sling vs short sling | 1 | Mean Difference (IV, Fixed, 95% CI) | 0.0 [0.0, 0.0] | |
| 10.2 anterior rectus sheath sling vs Prolene strip | 1 | Mean Difference (IV, Fixed, 95% CI) | 0.0 [0.0, 0.0] | |
| 10.3 anterior rectus sheath sling vs anterior vaginal wall patch | 1 | Mean Difference (IV, Fixed, 95% CI) | 0.0 [0.0, 0.0] | |
| 10.4 Prolene strip vs anterior vaginal wall patch | 1 | Mean Difference (IV, Fixed, 95% CI) | 0.0 [0.0, 0.0] | |
| 11 Blood loss (mL) Show forest plot | 1 | Mean Difference (IV, Fixed, 95% CI) | Totals not selected | |
| 11.1 anterior rectus sheath sling vs Prolene strip | 1 | Mean Difference (IV, Fixed, 95% CI) | 0.0 [0.0, 0.0] | |
| 11.2 anterior rectus sheath sling vs anterior vaginal wall patch | 1 | Mean Difference (IV, Fixed, 95% CI) | 0.0 [0.0, 0.0] | |
| 11.3 Prolene strip vs anterior vaginal wall patch | 1 | Mean Difference (IV, Fixed, 95% CI) | 0.0 [0.0, 0.0] | |
| 12 Length of hospital stay (days) Show forest plot | 1 | Mean Difference (IV, Fixed, 95% CI) | Totals not selected | |
| 12.1 anterior rectus sheath sling vs Prolene strip | 1 | Mean Difference (IV, Fixed, 95% CI) | 0.0 [0.0, 0.0] | |
| 12.2 anterior rectus sheath sling vs anterior vaginal wall patch | 1 | Mean Difference (IV, Fixed, 95% CI) | 0.0 [0.0, 0.0] | |
| 12.3 Prolene strip vs anterior vaginal wall patch | 1 | Mean Difference (IV, Fixed, 95% CI) | 0.0 [0.0, 0.0] | |
| 13 Perioperative surgical complications Show forest plot | 3 | Risk Ratio (M‐H, Fixed, 95% CI) | Totals not selected | |
| 13.1 standard sling vs short sling | 1 | Risk Ratio (M‐H, Fixed, 95% CI) | 0.0 [0.0, 0.0] | |
| 13.2 rectus fascia sling vs Goretex sling | 1 | Risk Ratio (M‐H, Fixed, 95% CI) | 0.0 [0.0, 0.0] | |
| 13.3 fascial sling vs vaginal wall sling | 1 | Risk Ratio (M‐H, Fixed, 95% CI) | 0.0 [0.0, 0.0] | |
| 14 Bladder perforation Show forest plot | 3 | Risk Ratio (M‐H, Fixed, 95% CI) | Totals not selected | |
| 14.1 standard sling vs short sling | 1 | Risk Ratio (M‐H, Fixed, 95% CI) | 0.0 [0.0, 0.0] | |
| 14.2 fascial sling vs Pelvicol sling | 1 | Risk Ratio (M‐H, Fixed, 95% CI) | 0.0 [0.0, 0.0] | |
| 14.3 anterior rectus sheath sling vs Prolene strip | 1 | Risk Ratio (M‐H, Fixed, 95% CI) | 0.0 [0.0, 0.0] | |
| 14.4 anterior rectus sheath sling vs anterior vaginal wall patch | 1 | Risk Ratio (M‐H, Fixed, 95% CI) | 0.0 [0.0, 0.0] | |
| 14.5 Prolene strip vs anterior vaginal wall patch | 1 | Risk Ratio (M‐H, Fixed, 95% CI) | 0.0 [0.0, 0.0] | |
| 15 Urinary tract infection Show forest plot | 2 | Risk Ratio (M‐H, Fixed, 95% CI) | Totals not selected | |
| 15.1 standard sling vs short sling | 1 | Risk Ratio (M‐H, Fixed, 95% CI) | 0.0 [0.0, 0.0] | |
| 15.2 anterior vaginal wall sling vs biosynthetic mesh sling | 1 | Risk Ratio (M‐H, Fixed, 95% CI) | 0.0 [0.0, 0.0] | |
| 16 Vaginal bleeding Show forest plot | 1 | Risk Ratio (M‐H, Fixed, 95% CI) | Totals not selected | |
| 16.1 anterior vaginal wall sling vs biosynthetic mesh sling | 1 | Risk Ratio (M‐H, Fixed, 95% CI) | 0.0 [0.0, 0.0] | |
| 17 Long‐term adverse effects (wound pain) Show forest plot | 1 | Risk Ratio (M‐H, Fixed, 95% CI) | Totals not selected | |
| 17.1 fascial sling vs Pelvicol sling | 1 | Risk Ratio (M‐H, Fixed, 95% CI) | 0.0 [0.0, 0.0] | |
| 18 Voiding dysfunction Show forest plot | 6 | Risk Ratio (M‐H, Fixed, 95% CI) | Totals not selected | |
| 18.1 fascial sling vs Pelvicol sling | 1 | Risk Ratio (M‐H, Fixed, 95% CI) | 0.0 [0.0, 0.0] | |
| 18.2 standard sling vs short sling | 1 | Risk Ratio (M‐H, Fixed, 95% CI) | 0.0 [0.0, 0.0] | |
| 18.3 Vypro vs Ultrapro | 1 | Risk Ratio (M‐H, Fixed, 95% CI) | 0.0 [0.0, 0.0] | |
| 18.4 Vypro vs Prolene light | 1 | Risk Ratio (M‐H, Fixed, 95% CI) | 0.0 [0.0, 0.0] | |
| 18.5 Ultrapro vs Prolene light | 1 | Risk Ratio (M‐H, Fixed, 95% CI) | 0.0 [0.0, 0.0] | |
| 18.6 anterior vaginal wall sling vs biosynthetic mesh sling | 1 | Risk Ratio (M‐H, Fixed, 95% CI) | 0.0 [0.0, 0.0] | |
| 18.7 anterior rectus sheath sling vs Prolene strip | 1 | Risk Ratio (M‐H, Fixed, 95% CI) | 0.0 [0.0, 0.0] | |
| 18.8 anterior rectus sheath sling vs anterior vaginal wall patch | 1 | Risk Ratio (M‐H, Fixed, 95% CI) | 0.0 [0.0, 0.0] | |
| 18.9 Prolene strip vs anterior vaginal wall patch | 1 | Risk Ratio (M‐H, Fixed, 95% CI) | 0.0 [0.0, 0.0] | |
| 18.10 fascial sling vs vaginal wall sling | 1 | Risk Ratio (M‐H, Fixed, 95% CI) | 0.0 [0.0, 0.0] | |
| 19 Long‐term adverse effects (release of sling required) Show forest plot | 1 | Risk Ratio (M‐H, Fixed, 95% CI) | Totals not selected | |
| 19.1 fascial sling vs Pelvicol sling | 1 | Risk Ratio (M‐H, Fixed, 95% CI) | 0.0 [0.0, 0.0] | |
| 20 De novo detrusor urgency or urge symptoms or detrusor overactivity Show forest plot | 4 | Risk Ratio (M‐H, Fixed, 95% CI) | Totals not selected | |
| 20.1 standard sling vs short sling | 1 | Risk Ratio (M‐H, Fixed, 95% CI) | 0.0 [0.0, 0.0] | |
| 20.2 Vypro vs Ultrapro | 1 | Risk Ratio (M‐H, Fixed, 95% CI) | 0.0 [0.0, 0.0] | |
| 20.3 Vypro vs Prolene light | 1 | Risk Ratio (M‐H, Fixed, 95% CI) | 0.0 [0.0, 0.0] | |
| 20.4 Ultrapro vs Prolene light | 1 | Risk Ratio (M‐H, Fixed, 95% CI) | 0.0 [0.0, 0.0] | |
| 20.5 autologous dermal graft patch vs cadaveric fascia lata | 1 | Risk Ratio (M‐H, Fixed, 95% CI) | 0.0 [0.0, 0.0] | |
| 20.6 rectus fascia sling vs Goretex sling | 1 | Risk Ratio (M‐H, Fixed, 95% CI) | 0.0 [0.0, 0.0] | |
| 21 Repeat surgery for urinary incontinence at first year Show forest plot | 1 | Risk Ratio (M‐H, Fixed, 95% CI) | Totals not selected | |
| 21.1 Fascial sling vs Pelvicol sling | 1 | Risk Ratio (M‐H, Fixed, 95% CI) | 0.0 [0.0, 0.0] | |
| 22 Long‐term adverse effects (vaginal mesh or graft exposure) Show forest plot | 3 | Risk Ratio (M‐H, Fixed, 95% CI) | Totals not selected | |
| 22.1 fascial sling vs Pelvicol sling | 1 | Risk Ratio (M‐H, Fixed, 95% CI) | 0.0 [0.0, 0.0] | |
| 22.2 Vypro vs Ultrapro | 1 | Risk Ratio (M‐H, Fixed, 95% CI) | 0.0 [0.0, 0.0] | |
| 22.3 Vypro vs Prolene light | 1 | Risk Ratio (M‐H, Fixed, 95% CI) | 0.0 [0.0, 0.0] | |
| 22.4 Ultrapro vs Prolene light | 1 | Risk Ratio (M‐H, Fixed, 95% CI) | 0.0 [0.0, 0.0] | |
| 22.5 anterior vaginal wall sling vs biosynthetic mesh sling | 1 | Risk Ratio (M‐H, Fixed, 95% CI) | 0.0 [0.0, 0.0] | |
| 23 Condition‐specific measures to assess quality of life (ICI‐Q short form UI score at 1 year) Show forest plot | 1 | Mean Difference (IV, Fixed, 95% CI) | Totals not selected | |
| 23.1 Vypro vs Ultrapro | 1 | Mean Difference (IV, Fixed, 95% CI) | 0.0 [0.0, 0.0] | |
| 23.2 Vypro vs Prolene light | 1 | Mean Difference (IV, Fixed, 95% CI) | 0.0 [0.0, 0.0] | |
| 23.3 Ultrapro vs Prolene light | 1 | Mean Difference (IV, Fixed, 95% CI) | 0.0 [0.0, 0.0] | |
| 24 Condition‐specific measures to assess quality of life (ICI‐Q short form UI score at 1 to 5 years) Show forest plot | 1 | Mean Difference (IV, Fixed, 95% CI) | Totals not selected | |
| 24.1 Vypro vs Ultrapro | 1 | Mean Difference (IV, Fixed, 95% CI) | 0.0 [0.0, 0.0] | |
| 24.2 Vypro vs Prolene light | 1 | Mean Difference (IV, Fixed, 95% CI) | 0.0 [0.0, 0.0] | |
| 24.3 Ultrapro vs Prolene light | 1 | Mean Difference (IV, Fixed, 95% CI) | 0.0 [0.0, 0.0] | |