Operaciones con cabestrillos suburetrales tradicionales para la incontinencia urinaria en mujeres
Referencias
Referencias de los estudios incluidos en esta revisión
Referencias de los estudios excluidos de esta revisión
Referencias de los estudios en espera de evaluación
Referencias de los estudios en curso
Referencias adicionales
Referencias de otras versiones publicadas de esta revisión
Characteristics of studies
Characteristics of included studies [ordered by study ID]
| Methods | Design: RCT | |
| Participants | 56 consecutive women with SUI. Patients followed up for 5 years; 48/56 completed evaluation | |
| Interventions | A: TVT B: rectus sheath sling | |
| Outcomes | Cure defined as no leakage of urine during stress test and urodynamic testing (clinician‐reported) A: 88.5% B: 84.6% Denominators for individual groups not provided | |
| Notes | Abstract only; no useable data | |
| Risk of bias | ||
| Bias | Authors' judgement | Support for judgement |
| Random sequence generation (selection bias) | Unclear risk | No information |
| Allocation concealment (selection bias) | Unclear risk | No information |
| Blinding (performance bias and detection bias) | Unclear risk | No information |
| Incomplete outcome data (attrition bias) | Unclear risk | No information |
| Methods | Design: RCT Setting: hospital in Iraq | |
| Participants | N = 80 Women with main complaint of SUI (mixed group); BMI < 30 kg/m² Exclusion: mild UI (defined as 0 to 1 pad per day; a few drops of urine leaked on stress); cystocoele (anterior prolapse) > grade 1; active vaginal infection or UTI; neurogenic voiding dysfunction; significant postvoid residual urine volume (PVR); other bladder or urethral pathology or fistula Recruitment: December 4 to July 12 Follow‐up: 1 week; 1, 3, 6, and 12 months; yearly thereafter | |
| Interventions | A (40): autologous rectus fascia sling B (40): transobturator mid‐urethral sling (TOT), synthetic polypropylene tape Cystoscopy at time of surgery to exclude other pathology before surgery and to check for injury after insertion of sling or tape | |
| Outcomes | Cure of SUI defined as significant dryness as perceived by the patient, no more use of pads, negative stress test, and acceptable voiding stream (combined primary outcome) Cure at 1 week: A: 39/40; B: 38/40 No further data provided for cure at later follow‐up, but trialists state, "there were no significant changes in the continence achieved throughout the follow‐up period" Operation time (mean minutes (SD) N): A: 80 (11.11) 40, B: 20 (4.44) 40 Hospital stay (mean days (SD) N): A: 2.8 (1.33) 40, B: 1.2 (0.44) 40 Adverse effects: Intraoperative visceral injury (bladder perforation): A: 0/40, B: 0/40 Vaginal or urethral erosion: A: 0/40, B: 0/40 De novo detrusor overactivity: A: 2/40, B: 2/40 Other adverse effects: Abdominal wound problems, pain, ooze, haematoma, infection: A: 8, B: 0 Foot drop: A: 1, B: 0 Groin and upper thigh pain: A: 0, B: 5 Voiding difficulty: A: 0, B: 1 Vaginal bleeding: A: 0, B: 1 Late PVR (postvoid residual): A: 3, B: 2 Total other adverse effects: A: 12/40, B: 9/40 All complications described as "marginal, treated conservatively and comparable with other studies" Further treatment required for urinary urgency with anti‐muscarinic drugs: A: 3/40, B: 3/40 | |
| Notes | ||
| Risk of bias | ||
| Bias | Authors' judgement | Support for judgement |
| Random sequence generation (selection bias) | Low risk | Randomised using random numbers table but with no details on method of generation |
| Allocation concealment (selection bias) | Unclear risk | "were assigned randomly" – too little detail for assessment |
| Blinding (performance bias and detection bias) | Unclear risk | No information |
| Incomplete outcome data (attrition bias) | Unclear risk | No information but full follow‐up of all 80 women assumed |
| Methods | Design: RCT by electronic treatment assignment; 2 arms; unblinded. Setting: multi‐centre; tertiary referral centres; USA SISTER trial | |
| Participants | N = 655 Symptom‐based diagnosis of SUI, confirmed by standard stress test. A few women had DO at baseline as well (A: 16/243, B: 25/239) (MUI), but we have classified the trial as in women with predominant SUI Inclusion: documented pure or predominant symptom of SUI for ≥ 3 months, positive standardised urinary stress test Exclusion: age < 21 years, non‐ambulatory status, pregnancy, current cancer chemotherapy or radiotherapy, systemic disease affecting bladder function, urethral diverticulum, prior augmentation cystoplasty or artificial urethral sphincter, recent pelvic surgery Groups similar in age, ethnic group, marital status, BMI, vaginal deliveries, hormone treatment, smoking, mixed UI, POP, UDS, concomitant surgery | |
| Interventions | A (326): sling B (329): Burch Burch as modified by Tanagho Sling procedure using autologous rectus fascia at level of the bladder neck and proximal urethra Interventions standardised across centres | |
| Outcomes | Number with overall success, number with SUI‐specific success, pad test, number of incontinence episodes in a 3‐day voiding diary, POP, adverse events, voiding dysfunction (use of a catheter), postoperative UUI Overall success defined as no self‐reported symptoms of UI, no incontinence on 3‐day diary, negative stress test, no re‐treatment SUI‐specific success defined as no symptoms, negative stress test, and no re‐treatment for SUI (combined outcome) All outcomes reported at 2 years' follow‐up Failure (composite symptoms, self‐report of UI or on diary, or surgical re‐treatment) at 24 months: A: 101/265, B: 130/255 (used as surrogate for subjective UI) Failure (pad test, objective) at 24 months: A: 37/265, B: 38/255 Complications at 24 months: Number of women with any complications: A: 206/326, B: 156/329 Number of women with serious adverse events: A: 42/326, B: 32/329 Number of women with bleeding: A: 8/326, B: 5/329 Number of women with any voiding dysfunction: A: 46/326, B: 7/329 Number of women with voiding dysfunction requiring surgical revision: A: 20/326, B: 0/329 Postoperative cystitis (UTI): A: 247/326, B: 166/329 Bladder perforation: A: 2/326, B: 10/329 5‐year outcomes (Brubaker 2012): Enrolled 482 women: A: 243, B: 239 5‐year FU completed by A: 183, B: 174, but data from more women reported for different outcomes Failure (self‐reported UI) at 5 years: A: 130/224, B: 158/229 (woman‐reported) Composite failure rate (self‐report of UI or on diary, or surgical re‐treatment): A: 153/221, B: 161/212 Surgical re‐treatment for UI: A: 4/223, B: 27/227 Prolapse treatment: A: 1/224, B: 5/229 Not satisfied: A: 31/182, B: 46/170 UDI score (mean (SD) N): A: 40.2 (45.8) 224, B: 50.2 (50.9) 229 IIQ score (mean (SD) N): A: 44.8 (79.6) 224, B: 43.1 (68.2) 229 Adverse events (number): A: 37/224, B: 38/229 Adverse events (number of women): A: 22/224, B: 23/229 Number of women with UTI (included in AE above): A: 21/224, B: 21/229 Urgency urinary incontinence (new or persistent): A: 36/224, B: 36/229 Voiding dysfunction: A: 7/224, B: 1/229 | |
| Notes | Full text with several other reports in full text and abstract form 5‐year data published in 2012 For some outcomes, denominator assumed to be those who supplied subjective information about continence status | |
| Risk of bias | ||
| Bias | Authors' judgement | Support for judgement |
| Random sequence generation (selection bias) | Low risk | Use of permuted block randomisation schedule with stratification according to clinical site |
| Allocation concealment (selection bias) | Low risk | Randomisation was performed in the operating room after anaesthesia induction |
| Blinding (performance bias and detection bias) | High risk | Patients were aware of study group assignments postoperatively. Independent data and safety monitoring board oversaw progress, interim results, and safety of the study |
| Incomplete outcome data (attrition bias) | Low risk | 135 women were lost to follow‐up at 2 years: 61 from the sling group and 74 from Burch failed to attend clinic. At 5 years, 243 and 239 women were followed up To allow for attrition and missed visits, 655 women had been recruited following power calculation |
| Methods | Design: RCT of autologous fascial sling with TVT; single‐blind Follow‐up assessment carried out at 1, 6, 12, and 36 months | |
| Participants | Women with involuntary detrusor contractions or pre‐existing bladder outlet obstruction (BOO) during urodynamic study were excluded (USI) | |
| Interventions | A (21): autologous fascial sling B (20): TVT | |
| Outcomes | Cure rates (defined as complete dryness with no usage of pads (woman‐reported)), operative room time, postoperative analgesia, complications, time of hospital stay, postoperative catheterisation, time to return to normal activities. 60‐minute pad test was used and QoL was evaluated with a validated Portuguese version of King's Health Questionnaire Incontinent at 6 months: A: 9/21, B: 6/20 Incontinent at 12 months: A: 9/21, B: 7/20 Mean operative time (minutes): A: 70, B: 33 Mean dosage of analgesia (milligrams): A: 142, B: 85 Bladder injuries: A: 1, B: 2 Mean hospital stay (hours): A: 24, B: 24 Mean postoperative catheterisation (hours): A: 24, B: 24 Time to return to normal activity (days): A: 30, B: 30 36‐month outcomes: 1 patient died in each group: A: 1/21, B: 1/20 Satisfaction rates at 36 months: dissatisfied: A: 4/20, B: 8/19 QoL on King’s Health Questionnaire at 36 months : Domain of KHQ (median) General health score: A: 50, B: 50 Incontinence impact score: A: 33.34, B: 0 Role limitation score: A: 0, B: 0 Physical limitation score: A: 0, B: 0 Social limitation score: A: 5.56, B: 0 Personal relationship score: A: 0, B: 0 Emotions score: A: 0, B: 0 Sleep score: A: 25, B: 0 Severity perception of UI: A: 16.67, B: 26.57 De novo urgency at 36 months: A: 8/20, B: 8/19 | |
| Notes | Abstract and poster, 36‐month outcome paper | |
| Risk of bias | ||
| Bias | Authors' judgement | Support for judgement |
| Random sequence generation (selection bias) | Low risk | Randomisation followed a blind raffle where procedures (TVT and sling) were written on small pieces of paper, which were folded and placed into a closed box |
| Allocation concealment (selection bias) | Low risk | The box was opened just before surgery, when the medical team found out which procedure would be performed |
| Blinding (performance bias and detection bias) | Unclear risk | "Single‐blinded" mentioned in abstract, but no description given |
| Incomplete outcome data (attrition bias) | Low risk | All outcome data assessed; no women lost to follow‐up |
| Methods | Design: RCT; randomisation method unclear. Patient demographics were well reported. Procedures were standardised Follow‐up at 2 to 6 months, 12 months, and 24 months (median 12 months) | |
| Participants | 142 women with urodynamically proven SUI were recruited. Women with detrusor instability were excluded. Groups were comparable | |
| Interventions | A (74): Pelvicol B (68): TVT | |
| Outcomes | Outcome measures: cure of incontinence was defined as quality of life (QoL) improvement of 90% and/or patient‐determined continent status as dry (woman‐reported) (subjective, questionnaire‐based; pad used ‐ not weighed), levels of morbidity and impact on quality of life, and symptom severity Failure at 12 months (incontinence): A: 8/74, B: 10/68 Not improved at 12 months: A: 6/74, B: 4/68 Failure at 36 months (incontinence): A: 12/68, B: 7/60 Not improved at 36 months: A: 5/68, B: 4/60 Complications: any complications: A: 17/74, B: 13/68; any voiding dysfunction: A: 8/74, B: 6/68; retention up to 6 weeks A: 6/74, B: 1/68; release of sling required A: 5/74, B: 2/68; bladder perforations: A: 0/74, B: 0/68 | |
| Notes | Surgery was offered only after conservative therapy had proved unsuccessful | |
| Risk of bias | ||
| Bias | Authors' judgement | Support for judgement |
| Random sequence generation (selection bias) | Unclear risk | Not mentioned |
| Allocation concealment (selection bias) | Unclear risk | Not mentioned |
| Blinding (performance bias and detection bias) | Unclear risk | Not mentioned |
| Incomplete outcome data (attrition bias) | Low risk | No patients lost to follow‐up at 12 months. All outcome data assessed. At 36 months, in the Pelvicol arm, 2 patients died and 4 were lost to follow‐up; in the TVT arm, 1 died and 7 were lost to follow‐up. Statistical analysis failed to detect significant differences |
| Methods | Design: RCT. Method not described; 3 arms; blinding not mentioned Setting: Ob&Gyne; South Korea Unclear if intention‐to‐treat Follow‐up at 1 year with assessments at 3, 6, and 9 months | |
| Participants | Urodynamics confirmed; no mixed incontinence Groups comparable as to age, parity, BMI, menopausal status, MUCP, VLPP, functional urethral length, and peak flow rates at baseline Inclusion: USI grades 1 and 2 Exclusion: grade III incontinence, detrusor overactivity, UTI, ISD, POP > grade II | |
| Interventions | A (28): sling Sling procedure used a pubovaginal sling with autologous rectus muscle fascia | |
| Outcomes | Number cured (3, 6, 12 months); complication rate (number with idiopathic detrusor overactivity, hesitancy, urinary retention) Cure defined as absence of subjective complaints of leakage and absence of urinary leakage on stress test Not cured (6 months): A: 2/28, B: 3/33, C: 2/31 Not cured (12 months): A: 2/28, B: 4/33, C: 4/31 De novo detrusor overactivity: A: 0/28, B: 3/33, C: 0/31 Voiding dysfunction: A: 2/28, B: 1/33, C: 4/31 | |
| Notes | TVT technique according to Ulmsten All procedures performed by 1 surgeon | |
| Risk of bias | ||
| Bias | Authors' judgement | Support for judgement |
| Random sequence generation (selection bias) | Unclear risk | Not mentioned |
| Allocation concealment (selection bias) | Unclear risk | Not mentioned. |
| Blinding (performance bias and detection bias) | Unclear risk | Not mentioned |
| Incomplete outcome data (attrition bias) | Low risk | No missing outcome data |
| Methods | Design: RCT Follow‐up at 6 months and 30 months; all women available at follow‐up Women allocated to 1 of 2 interventions by a computer‐generated random numbers table at a 2:1 ratio | |
| Participants | 48 consecutive women. Inclusion and exclusion criteria not clearly stated, but some patients with mixed incontinence | |
| Interventions | A (32): rectus fascia sling B (16): Goretex sling operation | |
| Outcomes | Cure defined as complete freedom from SUI (clinician‐assessed) or improved (persistence or recurrence of SUI, but at lesser intensity) Failure rates at 6 months: A: 6/32, B: 2/16 Failure rates at 30 months: A:11/32, B: 2/16 Complications: B: 2 cases of erosion of sling and 3 other cases of recurrent UTI | |
| Notes | Pre‐operative characteristics reported but no comparisons between groups made; statistical analysis reported for urodynamic parameters before and after operation. No other statistical comparison between groups reported. Some patients with mixed incontinence, but results not stratified by group or by type of incontinence | |
| Risk of bias | ||
| Bias | Authors' judgement | Support for judgement |
| Random sequence generation (selection bias) | Low risk | Computer‐randomised numbers, assigning 2 successive numbers to the fascial group and the following number to the Goretex group |
| Allocation concealment (selection bias) | Unclear risk | Not mentioned |
| Blinding (performance bias and detection bias) | Unclear risk | Not mentioned |
| Incomplete outcome data (attrition bias) | Low risk | No missing outcome data |
| Methods | Design: RCT. Details of randomisation not given; 2 arms Follow‐up: 12 months | |
| Participants | 139 women randomised. Baseline comparisons made: number of patients, mean age (years), mean daily pad usage, mean parturition, mean BMI, mixed urinary incontinence. No statistical differences Inclusion criteria: stress urinary incontinence due to urethral hypermobility Exclusion criteria: patients with ISD, uterine prolapsed, rectocoele, enterocoele, grade III or IV cystocoele Concomitant urgency urinary incontinence was present in some women; mixed urinary incontinence was present in 49 patients (73%) in the fascia lata sling group and in 44 patients (61%) in the intravaginal slingplasty group | |
| Interventions | A (67): cadaveric fascia lata B (72): intravaginal slingplasty | |
| Outcomes | Objective cure rate was evaluated by the pad test, and patient satisfaction rate was assessed by a subjective questionnaire. Cure and improvement were defined as a totally dry patient and 1 pad/d, respectively. Usage of more than 1 pad/d was accepted as surgical failure. The sum of cure and improvement rates was conceded as a total success rate Other outcomes measured were mean operating time, bladder perforation, urinary retention, erosion, sling revision, haematoma, persistent urgency urinary incontinence, defective vaginal wall, de novo detrusor overactivity Total success: A: 79.0%, B: 70.8% Satisfaction at 12 months: A: 82.0%, B: 87.5% Incontinence at 12 months: A: 32/67, B: 38/72 Not improved at 12 months: A: 14/67, B: 21/72 Daily mean pad usage (SD): A: 4.1 (3.5), B: 2.9 (1.7) Operative time: A: 50 minutes, B: 25 minutes Adverse events: de novo detrusor overactivity: A: 15/67, B: 5/72; bladder perforation: A: 3/67, B: 8/72; urinary retention: A: 8/67, B: 8/72; vaginal erosion: A: 0/67, B: 0/72; sling revision: A: 2/67, B: 0/72 | |
| Notes | Pre‐operative evaluation of all patients included urogynaecological history, previous pelvic surgery, voiding diary, parturition, and daily pad usage Abstract indicated that QoL was significantly improved in the study; full article showed that measurement was carried out by patient satisfaction questionnaire. No comment was made on validity or reliability of this questionnaire | |
| Risk of bias | ||
| Bias | Authors' judgement | Support for judgement |
| Random sequence generation (selection bias) | Unclear risk | Not mentioned |
| Allocation concealment (selection bias) | Unclear risk | Not mentioned |
| Blinding (performance bias and detection bias) | Unclear risk | Not mentioned |
| Incomplete outcome data (attrition bias) | Low risk | No missing outcome data |
| Methods | Design: quasi‐RCT. Patients randomised in alternate fashion to mesh or vaginal wall group Mean follow‐up: 22 months (12 to 27 months) | |
| Participants | 40 women with stress or mixed urinary incontinence and vaginal prolapse underwent implantation of transvaginal sling and vaginal reconstruction from 1997 to 1998 Pre‐operative investigations included urodynamic studies, cystoscopy, cough‐stress test, cotton swab test, and detailed pelvic examination with patients supine and standing Groups were not significantly different with respect to mean age, parity, weight, and pre‐operative pad use, although the biosynthetic mesh group was younger and heavier. Of the entire cohort, 65% of mesh and 86% of vaginal graft groups had undergone previous vaginal operations (P > 0.05) Concomitant prolapse: A: 14/20 (70%), B: 18/20 (90%) | |
| Interventions | A (20): antimicrobial MycroMesh (1‐mm polytetrafluoroethylene mesh patch impregnated with silver diacetate and chlorhexidine (biosynthetic mesh); average patch size 3.5 × 1.5 cm B (20): autologous vaginal wall sling using a free patch of vaginal skin (biological graft) soaked in antibiotic until ready for use Single transverse suprapubic abdominal incision and polytetrafluoroethylene sutures attached to mesh or graft edges and secured abdominally by tying down across midline anterior to the rectus fascia Concomitant surgery: None: A: 6/20, B: 2/20 Cystocoele repair: A: 6/20, B: 8/20 Cystocoele and rectocoele repair: A: 3/20, B: 6/20 Cystocoele and rectocoele repair + enterocoele or sacrospinous fixation: A: 3/20, B: 2/20 Hysterectomy: A: 2/20, B: 2/20 | |
| Outcomes | Routine follow‐up with cough‐stress test, cotton swab test, and voiding trial was performed on postoperative day 7 Urine loss during cough‐stress test was defined as persistent (objective) stress incontinence: clinician‐reported Additional follow‐up was done at 1, 3, and every 6 months. At each follow‐up visit, cough‐stress test and cotton swab test were performed at speculum examination to detect recurrent stress incontinence and vaginal wall prolapse Stress incontinence was considered cured if objective loss of urine was not demonstrated and patients did not report involuntary loss of urine during physical activity (combined outcome) Mean time to suprapubic tube removal, days (range): A: 9 (1 to 21); B: 10 (1 to 35) Mean postvoid residual volume, millilitres (range): A: 13 (0 to 60); B: 14 (0 to 50) Mean time to resumption of normal activity in weeks (range): both groups 3.5 weeks (2 to 4 weeks) Postoperative early complications: Blocked suprapubic tube: A: 3/20; B: 0/20 Abdominal wound infection: A: 4/20, B: 2/20 Urinary tract infection: A: 1/20, B: 0/20 Bleeding (intraoperative blood transfusion): A: 0/20, B: 1/20 Vaginitis: A: 1/20, B: 1/20 Transient de novo urgency incontinence resolved after 3 months: A: 1/8, B: 1/7 Late complications: Urethral erosion: A: 0/20, B: 0/20 Voiding dysfunction (‘urethral obstruction’): A: 0/20, B: 0/20 Resolution of pre‐operative urgency incontinence: A: 8/12, B: 7/13 Recurrent stress incontinence: A: 1/20, B: 6/20 Postoperative satisfaction: Dissatisfied (same or worse symptoms): A: 0/20, B: 4/20 (due to recurrent stress incontinence and recurrent prolapse (cystocoele)) | |
| Notes | ||
| Risk of bias | ||
| Bias | Authors' judgement | Support for judgement |
| Random sequence generation (selection bias) | High risk | Randomised in alternate fashion |
| Allocation concealment (selection bias) | High risk | Randomised in alternate fashion |
| Blinding (performance bias and detection bias) | High risk | Women in the mesh arm (A) signed a consent form stating that they were receiving a biosynthetic material |
| Incomplete outcome data (attrition bias) | Low risk | No dropouts reported |
| Methods | Design: RCT. No details of allocation method given Follow‐up at 12 months. Not all women available for follow‐up | |
| Participants | 46 women recruited, 23 in each arm of the study. 34 women available for follow‐up; reasons for loss to follow‐up not reported. Inclusion and exclusion criteria well defined | |
| Interventions | A (23): rectus fascia sling B (23): Burch colposuspension | |
| Outcomes | Cure defined as dry, symptom‐free (subjective based on history and objective on ultrasonography to assess bladder neck mobility) Failure rate (‘surgical’ – assume objective clinician‐reported at 1 year): A: 0/17, B: 1/17 Dry (symptom‐free patients at 1 year; assume woman‐reported): A: 16/17, B: 15/17 Operating time (mean minutes (SD) N): A: 60.66 (8.63) 15, B: 54.64 (9.29) 14 (women having concomitant hysterectomy excluded) Length of hospital stay (mean days (SD) N): A: 5.93 (1.38) 15, B: 5.42 (1.28) 14 (women having concomitant hysterectomy excluded) UTI: A: 1/15, B: 2/14 Late complications (1‐year follow‐up): A: 1 detrusor instability, 3 suprapubic pain, 1 dyspareunia B: 1 detrusor instability, 2 dyspareunia, 2 genital prolapse (1 cystocoele, 1 enterocoele) | |
| Notes | Ultrasonography for measurement of bladder neck mobility was tested in both groups pre‐operatively and postoperatively, showing significant improvement but no significant differences between groups | |
| Risk of bias | ||
| Bias | Authors' judgement | Support for judgement |
| Random sequence generation (selection bias) | Unclear risk | Not mentioned |
| Allocation concealment (selection bias) | Unclear risk | Not mentioned |
| Blinding (performance bias and detection bias) | Unclear risk | Not mentioned |
| Incomplete outcome data (attrition bias) | High risk | 12 women missing and lost to follow‐up; reason not reported. No mention of whether loss had impact on final analysis |
| Methods | Design: RCT. Women allocated to 1 of 2 interventions by open random numbers chart Follow‐up at 32 to 48 months; all women available for follow‐up | |
| Participants | 72 women recruited, 36 in each arm of the study Inclusion criteria: all patients with GSI (urodynamic and sonographic diagnosis) had a vaginal hysterectomy and at least 1 previous anterior repair; 57 were postmenopausal without hormone replacement therapy Exclusion criteria: urinary tract infection, unstable bladder, voiding difficulty and severe cystocoele and/or rectocoele. Groups were comparable for age, weight, parity, menopausal status, previous surgery, and time of follow‐up | |
| Interventions | A (36) group II: lyophilised dura mater sling operation B (36) group I: modified Burch colposuspension (2 pairs of sutures instead of 3) | |
| Outcomes | Cure defined as dry, symptom‐free without objective urine loss during stress with bladder filled to 300 mL or positive urethral closure pressure during stress provocation Failure rate at follow‐up at 32 to 48 months: A: 3/36, B: 5/36 Urodynamic results reported before and at follow‐up: reported longer hospital stay and suprapubic catheter permanence for A. Equal frequency pyrexia and bladder laceration Late complications: Enterocoele or rectocoele: A: 1/36, B: 5/36 Voiding difficulty A: 5/36, B: 1/36; both differences statistically significant Other problems not statistically significant: urgency urinary incontinence (A: 6/36, B: 3/36) Four patients reported in control because of residual urine for B. Equally good results on sonographic investigation at follow‐up | |
| Notes | ||
| Risk of bias | ||
| Bias | Authors' judgement | Support for judgement |
| Random sequence generation (selection bias) | Low risk | Random number chart: even numbers underwent colposuspension; odd numbers underwent sling procedure |
| Allocation concealment (selection bias) | Unclear risk | Not mentioned |
| Blinding (performance bias and detection bias) | Unclear risk | Not mentioned |
| Incomplete outcome data (attrition bias) | Low risk | No missing outcome data |
| Methods | Design: RCT. Details not given Follow‐up at 6 months | |
| Participants | 22 women with intrinsic sphincter deficiency, 11 in each arm | |
| Interventions | A (11): suburethral sling B (11): Burch retropubic urethropexy | |
| Outcomes | Subjective cure assessed using comparison between pre‐operative and postoperative Incontinence Impact Questionnaire (IIQ), Urinary Distress Inventory (UDI) (measured) Objective cure by stress test; voiding dysfunction by urodynamic assessment if incontinence seen (clinician‐assessed) Success rate reported as follows: A: 100% (11/11), B: 77.8% (7/9), P = 1 Mean postoperative IIQ and UDI scores not significantly different | |
| Notes | Abstract only Two patients in the Burch group were found to have recurrent UVJ hypermobility or displacement and were not included in the final analysis A high proportion of excluded women were found to have end‐stage urethral neuropathy | |
| Risk of bias | ||
| Bias | Authors' judgement | Support for judgement |
| Random sequence generation (selection bias) | Unclear risk | Not mentioned |
| Allocation concealment (selection bias) | Unclear risk | Not mentioned |
| Blinding (performance bias and detection bias) | Unclear risk | Not mentioned |
| Incomplete outcome data (attrition bias) | High risk | Two patients in the Burch group were found to have recurrent UVJ hypermobility, were considered surgical failures, and were excluded from final analysis. Insufficient information to judge whether appropriately addressed |
| Methods | Design: RCT (3 arms). Computer‐generated randomisation schedule used for each centre and for each individual surgeon. Remote telephone randomisation undertaken by independent CRU; type of sling faxed on the morning of the operation. Patients were not told which sling they had, although they could not be blinded to Pfannenstiel incision; research nurses collecting data were not told what procedure the women had undergone Setting: 4 centres Follow‐up at 6 months and 1 year; 85% available for follow‐up at 1 year | |
| Participants | 201 women randomised (mean age 52 years) to Pelvicol‐50, TVT‐72, autologous sling‐79 Inclusion criteria: women requiring primary surgical treatment for urodynamic USI following failed conservative treatment Exclusion criteria: previous surgery for SUI, neurological disease, pelvic organ prolapse > stage 2, detrusor overactivity, or bladder hypocompliance on urodynamic assessment | |
| Interventions | A (79): autologous fascial sling from rectus (sling‐on‐a‐string) B (50): Pelvicol (randomisation to this arm halted half way through the trial) 12 × 2 cm Pelvicol graft C (72): TVT (Gynecare) Dropout at 12 months: A: 12; B: 4; C: 3; no explanation for differential dropout from group A | |
| Outcomes | Success and improvement rates described but method of assessment not defined Other outcome measures included operative details, complications, dry/improved rates, quality of life assessment, catheterisation, and re‐operation rates Theatre time, minutes, mean (range): A: 54 (25 to 140); B: 36 (17 to 70); C: 35 (14 to 120) Length postop stay, days, median (range): A: 4 (1 to 22), B: 4 (1 to 12), C: 2 (1 to 10) Incontinent at 6 months: A: 38/73, B: 25/45, C: 35/71 Incontinent at 12 months: A: 35/67, B: 36/46, C: 31/69 Not improved at 6 months: A: 4/73, B: 12/45, C: 6/71 Not improved at 12 months: A: 7/67, B: 18/46, C: 5/69 Re‐operation rate: A: 0/67, B: 9/46, C: 0/69 Self‐catheterisation at 12 months: A: 0/67, B: 0/46, C: 0/69 Adverse effects: Bladder injury: A: 2/79, B: 1/50, C: 4/72 Urethrolysis (release of tape): A: 1/67, B: 0/46, C: 1/69 10‐year follow‐up: 162 women available at 10 years (A: 61, B: 38, C: 63) Incontinence at 10 years: A: 30/61, B: 32/38, C: 43/63 Not improved at 10 years: A: 15/61, B: 16/38, C: 17/63 Satisfaction: A: 43/61, B: 20/38, C: 44/63 Recommend to a friend: A: 46/61, B: 25/38, C: 53/63 Reoperation rate for SUI at 10 years: A: 0/61, B: 5/38, C: 2/63 Other gynaecological surgery: A 7/61, B 4/38, C 5/63 De novo urgency: A: 0/61, B: 0/38, C: 1/63 Self‐catheterisation: A: 4/61, B: 0/38, C: 3/63 Sling release: A: 2/61, B: 1/38, C: 2/63 (long‐term voiding dysfunction at 10 years: A: 6/61, B: 1/38, C: 5/63) Tape/graft exposure: A: 0/61, B: 0/38, C: 1/63 Scar pain: A: 2/61, B: 0/38, C: 0/63 | |
| Notes | High re‐operation rates (1 in 5) in Pelvicol group (group B), so arm closed. Study closed at 6 years before target number reached. Interim analysis after first 50 patients in each group Although there was no mention of how success rate was assessed in the abstract, on contacting a listed author, we were informed that figures were patient‐reported Interim analysis showed that women randomised to Pelvicol (group B) had significantly poorer outcomes; therefore this arm was dropped and the trial was continued as a 2‐arm RCT Study closed after 6 years due to failure to recruit target numbers and high re‐operation rate | |
| Risk of bias | ||
| Bias | Authors' judgement | Support for judgement |
| Random sequence generation (selection bias) | Low risk | Computer‐generated randomisation schedule used for each centre and for each individual surgeon |
| Allocation concealment (selection bias) | Low risk | Remote telephone randomisation undertaken by the independent CRU; type of sling faxed on the morning of the operation |
| Blinding (performance bias and detection bias) | Low risk | Patients were not told which sling they had, although they could not be blinded to Pfannenstiel incision; research nurses collecting data were not told what procedure the women had undergone |
| Incomplete outcome data (attrition bias) | Low risk | No differential dropout (although group B was stopped early due to poor outcomes) |
| Methods | Design: RCT; randomised prospective study | |
| Participants | 482 women with urinary incontinence Inclusion and exclusion criteria not defined | |
| Interventions | A: fascial sling B: Burch urethropexy | |
| Outcomes | Continence rates: defined as no urinary leakage in a 3‐day voiding diary, no self‐reported stress incontinence symptoms, and no stress incontinence surgical treatment (combined outcome) Continence rates: 3 years: A: 30.8%, B: 24.1% Satisfaction rates: 5 years: A: 83%, B: 73% Adverse event rates (follow‐up period not specified): A: 9%, B: 10% Number of women with adverse events: A: 22; B: 23 | |
| Notes | Abstract only; no useable data | |
| Risk of bias | ||
| Bias | Authors' judgement | Support for judgement |
| Random sequence generation (selection bias) | Unclear risk | No information available |
| Allocation concealment (selection bias) | Unclear risk | No information available |
| Blinding (performance bias and detection bias) | Unclear risk | No information available |
| Incomplete outcome data (attrition bias) | Unclear risk | No information available |
| Methods | Design: RCT. Details not given Follow‐up at 4 to 6 months | |
| Participants | 30 women randomised, 15 in each arm of the study, all with genuine stress incontinence. All age groups of patients given but menopausal status not reported Exclusion criteria: cystocoele, uterine prolapse, urgency urinary incontinence, neurogenic bladder, urinary tract infection | |
| Interventions | A (15): Teflon sling (Zoedler urethroplasty) B (15): MMK urethrocystopexy | |
| Outcomes | Cure defined as complete freedom from SUI (subjective and objective demonstrations) (combined outcome). All patients in both groups cured. Complications not reported. Main differences observed in stress closing pressure of urethra, which became positive after surgery in both groups | |
| Notes | Groups stated similar, but no comparisons made at baseline. Short follow‐up | |
| Risk of bias | ||
| Bias | Authors' judgement | Support for judgement |
| Random sequence generation (selection bias) | Unclear risk | Not mentioned |
| Allocation concealment (selection bias) | Unclear risk | Not mentioned |
| Blinding (performance bias and detection bias) | Unclear risk | Not mentioned |
| Incomplete outcome data (attrition bias) | Low risk | No missing outcome data |
| Methods | Design: RCT. Women allocated to 1 of 2 interventions by random tables Follow‐up at 2, 3, 12, and 24 months. All women available at follow‐up | |
| Participants | 20 women recruited, 10 in each arm of the study Inclusion criteria: GSI (urodynamic diagnosis), vaginal narrowing, postsurgical scar, unsuitable for colposuspension Groups comparable for age, parity, and number of previous surgical incontinence procedures. Menopausal status not reported Exclusion criteria: not stated | |
| Interventions | A (10): porcine dermis sling operation B (10): Stamey bladder neck (needle) suspension | |
| Outcomes | Cure stated as objective (urodynamic diagnosis, pad test (clinician‐reported)) at 3 months' and as subjective (woman‐reported) at 24 months' follow‐up Failure rates at 3 months: A: 1/10, B: 2/10 Failure rates at 24 months: A: 1/10, B: 3/10 Differences not statistically significant at 3 and 24 months Postoperative complications: A: 9/10, B: 2/10 (operative blood loss, pyrexia, infective complications, suprapubic catheter permanence) Hospital stay: A: 20 (12.9), B: 7 (0.3) Late complications not reported Voiding problems at 3 months: A: 4/10, B:2/10 Detrusor instability: A: 2/10, B: 1/10 Urgency urinary incontinence: A: 5/10, B: 3/10 Peak flow significantly reduced for A, although higher than 15 mL/s | |
| Notes | Pad test at 12 and 24 months stated but not reported | |
| Risk of bias | ||
| Bias | Authors' judgement | Support for judgement |
| Random sequence generation (selection bias) | Low risk | Random numbers chart |
| Allocation concealment (selection bias) | Unclear risk | Not mentioned |
| Blinding (performance bias and detection bias) | Unclear risk | Not mentioned |
| Incomplete outcome data (attrition bias) | Low risk | No missing outcome data |
| Methods | Design: quasi‐RCT. Randomisation by date of birth method; 2 arms. Odd days assigned to TVT arm, even days to PVS Follow‐up: 3, 12, and 24 months | |
| Participants | 63 women who complained of SUI were recruited: 3 eventually declined to undergo surgery; therefore a total of 60 women (29 PVS, 31 TVT) with urodynamic stress or mixed incontinence were included Diagnosis was made by a cough‐stress test, a 60‐minute pad‐weighing test, and urodynamic studies | |
| Interventions | A (29): PVS B (31): TVT | |
| Outcomes | Primary outcome measure was cure of SUI. Subjective cure was consistent with complete dryness or a few drops of water with strong exercises (assumed to be woman‐reported) Objective cure was defined as complete absence of leakage during cough‐stress test with 250 or 300 mL of water in the bladder (clinician‐reported) Other outcome measures (6‐parameter analysis) were operation time, numbers of analgesics required in a perioperative period, changes in haematocrit, length of a Foley catheter, and length of stay Not cured at 24 months (subjective): A: 7/21, B: 4/23 Not cured at 24 months (objective): A: 11/21, B: 7/23 Operative time, mean minutes (SD) N: A: 87.1 (13.3) 21, B: 43.9 (17.3) 23 Length of hospital stay, mean (SD): A: 9.2 (0.9), B: 9.2 (0.6) days Time to catheter removal, mean (SD): A: 1.4 (0.5), B: 1.3 (0.1) days Complications: All complications: A: 11/29, B: 9/31 Bladder perforation: A: 7/29, B: 7/31 Urethral injury: A: 0/29, B: 1/31 Subcutaneous haematoma: A: 0/29, B: 1/31 Voiding dysfunction: A: 4/29, B: 0/31 Release of sling surgery: A: 4/29, B: 0/31 De novo detrusor urgency: A: 3/29, B: 2/31 | |
| Notes | Follow‐up at 24 months. Women who underwent concomitant surgery (5 PVS, 8 TVT) and/or had revision surgery were excluded from the 6‐parameter analysis because extra interventions made comparison difficult. Subjects for assessment were reduced to 23 women in the TVT group and 21 in the PVS group Data updated from new publication | |
| Risk of bias | ||
| Bias | Authors' judgement | Support for judgement |
| Random sequence generation (selection bias) | High risk | Date of birth method |
| Allocation concealment (selection bias) | High risk | Date of birth |
| Blinding (performance bias and detection bias) | Unclear risk | No mention |
| Incomplete outcome data (attrition bias) | Low risk | Similar loss across groups at follow‐up: 72% remained in sling arm and 74% in Burch arm |
| Methods | Design: RCT. Women allocated to each arm by a central telephone randomisation system. Not blinded ‐ operation obvious to all medical and nursing personnel Setting: 3 hospitals Follow‐up at 3, 6, and 12 months | |
| Participants | 165 women randomly assigned to 2 groups. Baseline demographics and symptoms were similar: age, height, weight, symptom years, previous surgery, number and type of concurrent problems between groups Inclusion criteria: patients older than 18 years; urodynamically proven SUI Exclusion criteria: evidence of neurological disease; urodynamic evidence of detrusor instability and hypocompliance | |
| Interventions | A (81): standard sling insertion (long) B (84): sling on a string (short) | |
| Outcomes | Primary outcome was to compare QoL scores in both groups over time. Success rate was measured by recurrence of stress leakage as reported on patient questionnaire (woman‐reported) Secondary outcomes were measured by patient quality of life, clinical indicators (such as immediate postoperative complications, time to first void, pad tests), administrative indicators, pain scores, and patient satisfaction Patient satisfaction at 12 months: A: 57/73, B: 62/82 Stress leakage at 12 months: A: 14/72, B: 16/72 Stress leakage at 3 years: A: 35/75, B: 30/70 Stress leakage at 6 years: A: 42/73, B: 34/69 De novo urgency: A: 6/81, B: 2/84 Pad test volumes (mL): A: 7.71, B: 4.61, P = 0.56 Mean operative time, minutes (range): A: 62 (38 to 135), B: 54 (25 to 140), P = 0.001 (P used to calculate SD: 15.33 in each group) Mean blood loss (mL): A: 274 (50 to 800), B: 230 (50 to 700), P = 0.07 Length of stay (days): A: 6.48, B: 6.73 Voiding dysfunction 12 months: A: 19/81, B: 17/84 Re‐admission within 3 months: A: 19/79, B: 9/83 Surgery to release sling: A: 1/81, B: 4/84 Further continence surgery: A: 2/56, B: 5/69 Pain at 3 months: A: 52/78, B: 42/82 Adverse effects: Perioperative surgical complications: A: 34/81, B: 31/84 Bladder perforation: A: 2/81, B: 3/84 UTI: A: 10/81, B: 6/84 | |
| Notes | Detailed outcome measures at 3, 6, and 12 months were provided. Both groups showed improvement in quality of life with no significant statistical differences between allocated operations 46 patients had previously undergone 1 or more forms of incontinence surgery Data were updated from new publication | |
| Risk of bias | ||
| Bias | Authors' judgement | Support for judgement |
| Random sequence generation (selection bias) | Low risk | Computer‐generated randomisation schedule |
| Allocation concealment (selection bias) | Low risk | Remote telephone randomisation |
| Blinding (performance bias and detection bias) | High risk | Not blinded; operation performed obvious to all medical and nursing personnel involved in the assessment |
| Incomplete outcome data (attrition bias) | Low risk | Ouctome data analysed according to randomised group, per protocol, and best possible. Twenty‐one women lost to follow‐up by 12 months, 23 lost by 3 years. Similar losses from each arm unlikely to affect the final analysis. Actual numbers with outcomes reported |
| Methods | Design: RCT of pubovaginal sling vs Macroplastique Intention‐to‐treat analysis performed Follow‐up: 6 months, 1 year | |
| Participants | 45 women randomised. 1 from each arm lost to follow‐up by 1 year Inclusion criteria: women with USI and ISD diagnosed by MUCP ≤ 20 cm H₂O who failed to respond to conservative treatment Exclusion criteria: required prolapse surgery, had undergone a sling procedure, were unsuitable for general anaesthesia Baseline comparison included age (years), BMI (kg/m²), menopause status, parity, previous surgery (abdominal hysterectomy, vaginal hysterectomy/repair, retropubic continence surgery, needle suspension) | |
| Interventions | A (22): pubovaginal sling B (23): transurethral Macroplastique | |
| Outcomes | Subjective success: no or occasional (less than once a week) stress incontinence (woman‐reported) Objective success: no leakage due to SUI on repeat urodynamic study (clinician‐reported) Other outcome measures included voiding dysfunction, patient satisfaction, operating time, blood loss, inpatient days, duration of catheterisation, time to resume normal activities Incontinent within 1 year: A: 2/21, B: 5/22, P = 0.41 Incontinent after 1 year: A: 0/13, B: 4/14, P = 0.1 Incontinent within 1 year (objective): A: 4/21, B: 20/22, P ≤ 0.0001 Patient satisfaction (self‐reported at 6 months): A: 7/21, B: 13/22, P = 0.41 Patient satisfaction (self‐reported at 5 years): A: 9/13, B: 4/14, P = 0.057 Operative time, minutes (range): A: 60 (25 to 105), B: 22 (10 to 41), P ≤ 0.0001 Length of hospital stay, days (range): A: 4 (3 to 81), B: 1 (1 to 2), P ≤ 0.0001 Time to normal activity, weeks (range): A: 4 (0 to 42), B: 28 (0 to 35), P ≤ 0.0001 Time to catheter removal, days (range): A: 5 (2 to 42), B: 1 (0 to 7), P ≤ 0.0001 Further continence surgery: A: 1/21, B: 2/22 Complications: UTI: A: 3/21, B: 2/22 De novo detrusor overactivity: A: 1/21, B: 0/22 Voiding dysfunction: A: 4/21, B: 1/22 | |
| Notes | Tertiary referral centres Macroplastique (uroplasty, Minneapolis, Minnesota, USA) is a vulcanised silicone microimplant (polydiamethylsiloxane) suspended in a povidone gel designed to provide urethral bulking for treatment of SUI | |
| Risk of bias | ||
| Bias | Authors' judgement | Support for judgement |
| Random sequence generation (selection bias) | Unclear risk | Computer randomisation software; no description given |
| Allocation concealment (selection bias) | Unclear risk | Not mentioned |
| Blinding (performance bias and detection bias) | Unclear risk | Not mentioned |
| Incomplete outcome data (attrition bias) | Low risk | Ouctome data analysed according to randomised group. One woman in each group failed to return or complete any review. Actual numbers with outcomes reported |
| Methods | Design: RCT: randomised prospective study | |
| Participants | 144 women Inclusion criteria: incontinence, clinical and/or urodynamic diagnosis of SUI, positive stress test Exclusion criteria: urodynamic MUI, detrusor overactivity, > 200 mL postvoid residual urine, contraindication to anaesthesia, pelvic organ prolapse, pregnancy, neurogenic bladder, bladder outlet obstruction, urinary fistula, active UTI, vaginal infection Some women had failed previous continence surgery, hysterectomy; some were post menopause | |
| Interventions | A (48): broad‐based double‐forced sling using Vypro mesh (semi‐absorbable multi‐filament) B (48): broad‐based double‐forced sling using Ultrapro mesh (synthetic combined mesh, non‐absorbable with absorbable coating, monofilament) C (48): broad‐based double‐forced sling with Prolene light mesh (non‐absorbable, monofilament) Meshes fixed with 2 polypropylene sutures to fascia of the rectus muscle | |
| Outcomes | Cure defined as no pad use (measured): 6 months: A: 40/46, B: 44/48, C: 41/47 12 months: A: 41/46, B: 45/48, C: 41/47 48 months: A: 39/46, B: 44/48, C: 40/47 Incontinence rate: A: 6/46 ICIQ‐SF score (higher is worse), mean (SD) N: At 6 months: A: 3.1 (0.9) 46, B: 2.1 (0.8) 48, C: 2.7 (0.8) 47 At 12 months: A: 2 (0.7) 46, B: 1.2 (0.6) 48, C: 1.7 (0.4) 47 At 48 months: A: 2.1 (0.5) 46, B: 0.8 (0.5) 48, C: 1.5 (0.3) 47 24‐hour pad test (grams), mean (SD) N: 12 months: A: 2.1 (1.4) 46, B: 2 (1.1) 48, C: 2.4 (3.8) 47 48 months: A: 2.3 (1.1) 46, B: 1.3 (0.8) 48, C: 2.4 (1.1) 47 Number of pads used mean (SD) N: At 12 months: A: 0.62 (0.4) 46, B: 0.33 (0.2) 48, C: 0.94 (0.6) 47 At 48 months: A: 0.65 (0.3) 46, B: 0.2 (0.15) 48, C: 0.83 (0.54) 47 Voiding or storage symptoms: A: 9/46; B: 4/48; C: 7/47 Dissatisfaction rate: A: 9/46; B: 7/48; C: 9/47 Complications at 48 months: Vaginal erosion: A: 2/46, B: 1/48, C: 2/47 Urethral erosion: A: 1/46, B: 0/48, C: 1/47 Suture granuloma: A: 3/46, B: 1/48, C: 3/47 Urine retention: A: 2/46, B: 2/48, C: 2/47 De novo urgency: A: 5/46, B: 2/48, C: 4/47 | |
| Notes | ||
| Risk of bias | ||
| Bias | Authors' judgement | Support for judgement |
| Random sequence generation (selection bias) | Low risk | ‘randomly allocated into three groups by centralised computerised system (1:1:1)’ |
| Allocation concealment (selection bias) | Low risk | ‘randomly allocated into three groups by centralised computerised system (1:1:1)’ |
| Blinding (performance bias and detection bias) | Unclear risk | No information |
| Incomplete outcome data (attrition bias) | Low risk | No differential dropout; dropout rate is low |
| Methods | Design: RCT (block randomisation technique). Selection criteria well reported Follow‐up reported at 6 months | |
| Participants | 75 women with mixed incontinence symptoms and a negative cystometrogram for motor detrusor overactivity. All had proven stress urinary incontinence. No details on demographic data were reported 21 patients (anticholinergic) and 24 (sling) were available for follow‐up | |
| Interventions | A (50): surgery (Ai (24) Burch colposuspension, Aii (26) rectus fascia sling) B (25): anticholinergic treatment | |
| Outcomes | Patients were evaluated by SEAPI score (subjective and objective) and underwent urodynamic examination before and after treatment (combined outcome) Cure for urge symptoms: Aii: 88%, B: 57% Cure for SUI: Aii: 83%, B: 0 | |
| Notes | Study was designed to investigate anticholinergic therapy in comparison with surgery. Patients allocated to surgery had a sling procedure if Valsalva leak point pressure was < 90 cm H₂O. We extracted only data on sling in comparison with anticholinergics | |
| Risk of bias | ||
| Bias | Authors' judgement | Support for judgement |
| Random sequence generation (selection bias) | Low risk | Block randomisation |
| Allocation concealment (selection bias) | Unclear risk | Not mentioned |
| Blinding (performance bias and detection bias) | Unclear risk | Not mentioned |
| Incomplete outcome data (attrition bias) | Low risk | Of 75 women randomised, 68 evaluated after 6 months. Four in anticholinergic arm and 3 in surgical arm lost. Insufficient information to determine whether appropriately addressed or not |
| Methods | Design: RCT. Abstract. Randomisation 2:1. Two arms Follow‐up: 1 year | |
| Participants | 34 women randomised. No mention of baseline comparison Inclusion criteria: women 30 to 77 years old with SUI due to hypermobility or ISD underwent surgical correction | |
| Interventions | A (10): autologous fascia B (24): Fortaperm | |
| Outcomes | Subjective patient evaluations included QoL questionnaire, incontinence diary, pain, and global outcome assessments (measured) Objective outcome assessment was urine loss with a provocative pad test (clinician‐reported) Biopsies were taken at 1 year from FP implant sites adjacent to urethra for histology Objective incontinence within first year: A: 1/10, B: 5/24 Not improved within first year (subjective): A: 0/10, B: 2/24 | |
| Notes | Fortaperm is absorbable biomaterial composed of laminated sheets of purified porcine collagen matrix | |
| Risk of bias | ||
| Bias | Authors' judgement | Support for judgement |
| Random sequence generation (selection bias) | Unclear risk | Not mentioned |
| Allocation concealment (selection bias) | Unclear risk | Not mentioned |
| Blinding (performance bias and detection bias) | Unclear risk | Not mentioned |
| Incomplete outcome data (attrition bias) | Low risk | No missing outcome data |
| Methods | Design: RCT by random numbers table Follow‐up at 3 months and at 72.6 months (mean) | |
| Participants | 36 women with genuine stress incontinence and maximum urethral closure pressure ≤ 20 cm H₂O. Groups comparable in terms of age, parity, and urodynamic variables, except for detrusor instability (> Burch vs sling) and residual volume (> Burch vs sling) | |
| Interventions | A (17): PTFE sling operation B (19): modified (overcorrection) Burch colposuspension | |
| Outcomes | Cure defined as objective (urodynamic: clinician‐reported separately) and subjective (history: woman‐reported) Number of continent women (short‐term): A: 17/17, B: 17/19 Objective cure (long‐term): A: 100%, 13/13, B: 86%, 13/15 Subjective cure (long‐term): A: 84%, 11/13, B: 93%, 14/15 There were no statistically significant differences in outcome measures | |
| Notes | First publication (2000) reported short‐term follow‐up and was considered the primary reference. Last publication (2003) reported long‐term results | |
| Risk of bias | ||
| Bias | Authors' judgement | Support for judgement |
| Random sequence generation (selection bias) | Low risk | Random numbers table |
| Allocation concealment (selection bias) | Unclear risk | Not mentioned |
| Blinding (performance bias and detection bias) | Unclear risk | Not mentioned |
| Incomplete outcome data (attrition bias) | Low risk | Similar losses in both groups at long‐term assessment |
| Methods | Design: RCT of tension‐free vaginal tape with autologous rectus fascia sling. Randomisation by sealed opaque envelopes Follow‐up: 1, 3, 6, and 12 months | |
| Participants | 100 women randomised into 2 groups. However, only 61 followed up to 1 year. 16 lost due to distance and expense of travel ‐ 12 were age‐related and 11 occurred because of dissatisfaction with surgical result (6 sling, 5 TVT) Inclusion criteria: history of USI, 1‐hour pad test (> 2 grams of leakage), objective positive cough (effort or exertion), induced stress test, normal cystourethroscopy and urodynamic confirmation of SI, urethral hypermobility, competent bladder neck Exclusion criteria: history of more than 3 episodes of UTI in past 2 years, other gynaecological problems such as high‐grade uterine prolapse, high‐grade rectocoele and enterocoele, cystocoele ≥ grade 2, abnormal filling phase of urodynamic study, low flow rates (< 15 mL/s), residual urine of more than 100 mL, trabeculated bladder mucosa on cystourethroscopy, history of major pelvic trauma, fracture that might negatively affect urethral function Women with mixed incontinence symptoms were included provided urodynamics showed normal capacity, normal compliance, and stable bladder The 2 groups had similar characteristics with respect to age, parity, hysterectomy, previous incontinence surgery, sensory urgency incontinence, pre‐operative IIQ score | |
| Interventions | A (52): pubovaginal sling B (48): TVT | |
| Outcomes | Objective cure defined as negative cough‐induced stress test with full bladder (at least 250 mL filled) in the lithotomy and standing positions (clinician‐reported) and a 1‐hour pad test ≤ 2 grams (measured) Subjective cure defined by mean IIQ score in each group Also assessed were type of anaesthesia, operative time, estimated blood loss, bladder penetration, and satisfaction with procedure Incontinent within 1 year (stress test): A: 6/36, B: 3/25, P = 0.9 Incontinent within 1 year (1‐hour pad test): A: 10/36, B: 6/25, P = 0.83 Patient satisfaction at 12 months: A: 20/36, B: 15/25 Operative time (minutes): A: 80 (50 to 180), B: 45 (30 to 70), P = 0.01 Length of hospital stay (days): A: 5 (3 to 7), B: 2 (1 to 5), P = 0.001 Time to catheter removal, days (range): A: 4.6 (3 to 6), B: 1.3 (1 to 5), P = 0.001 Complications: De novo urgency symptoms: A: 8/36, B: 1/25 Voiding dysfunction: A: 11/36, B: 5/25 Bladder perforation: A: 2/36, B: 6/25, P = 0.05 Bleeding (> 250 mL): A: 1/36, B: 1/25, P = 1.00 Suprapubic incisional hernia after 8 months: A: 1/36, B: 1/25 | |
| Notes | Procedures were performed by single surgeon All patients were pre‐operatively evaluated by physical examination, plain abdominal X‐ray, urinary tract ultrasound, cystourethroscopy, and urodynamic study Physical examination assessed degree of prolapse and basal lab tests (FBC, renal and liver function tests, serum electrolytes, urine analysis, culture) Assumption was made that t‐test was used for operative time, catheterisation, and hospital stay 10‐year follow‐up was published (Sharifiaghdas 2017), but data were not added to the review | |
| Risk of bias | ||
| Bias | Authors' judgement | Support for judgement |
| Random sequence generation (selection bias) | Unclear risk | Not mentioned. |
| Allocation concealment (selection bias) | Unclear risk | Sealed opaque envelopes; no mention of numbering |
| Blinding (performance bias and detection bias) | Unclear risk | Not mentioned |
| Incomplete outcome data (attrition bias) | Low risk | All outcomes assessed in randomised groups. 39 patients lost to follow‐up. Similar losses in each group |
| Methods | Design: RCT Setting: Shahid Labbafinejad Medical Centre, Iran Follow‐up: mean 13.8 months (SD 4.4), range 12 to 20 Follow‐up at hospital visits at 1 week; 1, 3, 6, and 12 months after surgery | |
| Participants | 72 women with main complaint of SUI unresponsive to conservative treatment, urethral hypermobility, positive cough‐stress test; urodynamics in all women and DO excluded ‐ therefore classes and USI Exclusion criteria: persistent UTI, active UTI at surgery, urogynaecological malignancy, cystocoele (prolapse) ≥ grade 3, neurogenic bladder, abnormal filling or voiding, detrusor overactivity, low flow rate, residual urine > 100 mL, abnormal cystourethroscopy findings | |
| Interventions | A (35): autologous rectus fascia pubovaginal sling B (35): mini‐sling (Ophira) | |
| Outcomes | Cure defined as woman report of some degree of SUI at 1 year after surgery Cure: A: 31/35, B: 31/35 Number of women satisfied: A: 25/35, B: 28/35 Number of women with UI: A: 4/35, B: 4/35 Objective UI (positive cough‐stress test): A: 4/35, B: 4/35 IIQ score, mean (SD) N: A: 50.2 (11.1) 35, B: 42.7 (11.4) 35 Adverse effects: Surgery for tape exposure: A: 0/35, B: 2/35 Adverse effects (dyspareunia, bladder perforation, urethral erosion, vaginal erosion/wound haematoma and/or infection: A: 21.6%, B: 2.9% (all treated conservatively with antibiotics, local care, or dressings) Haematoma and/or infection: A: 8/35, B: 1/35 Dyspareunia: A: 3/35, B: 4/35 Bladder perforation: A: 1/35, B: 0/35 Vaginal erosion: A: 1/35, B: 2/35 Urgency incontinence: A: 5/35, B: 1/35 Obstructive voiding symptoms: A: 6/35, B: 1/35 (1 woman required urethral dilatation, but group is unknown) UTI: A: 0, B: 0 | |
| Notes | Groups were comparable at baseline, although sling group was younger | |
| Risk of bias | ||
| Bias | Authors' judgement | Support for judgement |
| Random sequence generation (selection bias) | Unclear risk | Randomly assigned by envelope sealed cards |
| Allocation concealment (selection bias) | Low risk | Randomly assigned by envelope sealed cards |
| Blinding (performance bias and detection bias) | Unclear risk | No information |
| Incomplete outcome data (attrition bias) | Low risk | No loss to follow‐up reported |
| Methods | Design: RCT stated. Details not given in abstract of the trial Follow‐up after first year reported | |
| Participants | 57 women with various types of SUI. Patient characteristics not reported | |
| Interventions | A (33): autologous dermal graft patch B (24): cadaveric fascia lata | |
| Outcomes | Outcome measures reported were success rate (dry/improved) (method unspecified: assumed woman‐reported), de novo detrusor instability Success rate (dry or improved): A: 30/33 (91.6%), B: 22/24 (93.2%) Dry: A: 25/33, B: 19/24 Improved (only): A: 5/33, B: 3/27 De novo detrusor instability: A: 4/33, B: 5/20 Voiding delay in first 30 days: A: 0/33, B: 1/24 | |
| Notes | ||
| Risk of bias | ||
| Bias | Authors' judgement | Support for judgement |
| Random sequence generation (selection bias) | Unclear risk | Insufficient information |
| Allocation concealment (selection bias) | Unclear risk | Not mentioned |
| Blinding (performance bias and detection bias) | Unclear risk | Not mentioned |
| Incomplete outcome data (attrition bias) | Low risk | No missing outcome data (based on abstract) |
| Methods | Design: RCT of SAFYRE TOT with autologous pubovaginal sling. Randomisation method unclear Follow‐up: 6 months | |
| Participants | 20 women (average age 52.5 ± 11.8 years) with both USI and SUI but without detrusor overactivity The 2 groups had similar characteristics with respect to age, parity, BMI, menopausal status, presence of pelvic floor defects, and mean Valsalva leak point pressure in pre‐operative UDS | |
| Interventions | A (10): pubovaginal sling B (10): SAFYRE TOT | |
| Outcomes | Cure rates and intraoperative and postoperative morbidity. Women were declared objectively cured when they had a postoperative pad test ≤ 8 grams All patients were pre‐operatively evaluated by history, physical examination, quality of life questionnaire (King's Health Questionnaire), 24‐hour pad weight test, 2‐day voiding diary, and multi‐channel urodynamic study that included uroflowmetry, postvoid residual volume measured by urethral catheter, and cystometrogram. Objective quantification of the severity of incontinence was done by mean stress leaking point pressure in the urodynamic study. Pre‐operative measurements included type of anaesthesia, duration of surgery, intraoperative complications, occurrence of combined procedures, and hospital stay At 6‐month follow‐up, aforementioned measurements were carried out excluding UDS Postoperative pad test, mean (SD): A: 8.4 (16.44), B: 39.4 (39.53) grams, P = 0.01 Operative time, mean (SD): A: 69.5 (23.7), B: 21.1 (3.8) minutes, P < 0.001 Length of hospital stay, mean (SD): A: 44.4 (5.8), B: 28.8 (8.4) hours, P < 0.001 | |
| Notes | SAFYRE consists of a monofilament polypropylene mesh between 2 silicone columns made of multiple cone‐shaped soft tissue anchors. The 2 columns are fixed to the obturator muscle. Pubovaginal sling uses rectus fascia | |
| Risk of bias | ||
| Bias | Authors' judgement | Support for judgement |
| Random sequence generation (selection bias) | Unclear risk | Not mentioned |
| Allocation concealment (selection bias) | Unclear risk | Not mentioned |
| Blinding (performance bias and detection bias) | Unclear risk | Not mentioned |
| Incomplete outcome data (attrition bias) | Low risk | No missing outcome data |
| Methods | Design: RCT of TVT compared with autologous fascia lata pubovaginal sling Setting: single centre | |
| Participants | 67 women with SUI were randomised. Basline comparisons of age, menopausal status, parity, SUI, mixed incontinence, and intrinsic sphincter dysfunction were made Inclusion criteria: type II to IV SUI, mixed SUI, intrinsic sphincter dysfunction, failed previous operations Mixed incontinence was included in this study | |
| Interventions | A (19): autologous fascia lata pubovaginal sling B (48): TVT | |
| Outcomes | Cure rates and operative morbidity Damage to bladder, urinary retention, difficulty voiding Incontinent at 3 months: A: 1/19, B: 3/48 Not improved at 3 months A: 0/19, B: 0/48 Operative time (SD): A: 125 (13), B: 27 (5) minutes Mean length of hospital stay: A: 7.2, B: 1.8 days Mean time to catheter removal: A: 5.3, B: 1 days Complications: Voiding dysfunction: A: 3/19, B: 3/48 Urinary retention: A: 2/19, B: 0/48 Bladder injury: A: 0/19, B: 2/48 Detrusor overactivity: A: 1/19, B: 3/48 | |
| Notes | Follow‐up on average was between 20 and 37 months. Cure rates were assessed at 3 months Full text was translated from Chinese | |
| Risk of bias | ||
| Bias | Authors' judgement | Support for judgement |
| Random sequence generation (selection bias) | Unclear risk | Not mentioned |
| Allocation concealment (selection bias) | Unclear risk | Divided into 2 groups randomly (no details given, but numbers in groups unequal) |
| Blinding (performance bias and detection bias) | Unclear risk | Not mentioned |
| Incomplete outcome data (attrition bias) | Low risk | No missing outcome data |
| Methods | Design: RCT Follow‐up at 12 months | |
| Participants | 41 women randomly distributed into 2 groups. Patients had similar baseline characteristics (age, BMI, parity, vaginal births, postmenopausal conditions, hormone replacement therapy, previous SUI surgery, genital prolapse, previous surgery/previous hysterectomy, disease duration) Inclusion criteria: USI, confirmed through medical history, physical exam, and urodynamic investigation | |
| Interventions | A (20): retropubic sling (aponeurotic sling) B (21): SAFYRE TOT (synthetic transobturator) | |
| Outcomes | Cure was defined as the reported absence of SUI and no urinary loss during effort manoeuvres (combined outcome) during 12‐month follow‐up re‐evaluation Failure at 12 months: A: 1/20, B: 2/21 Operative time, mean (SD): A: 59.7 (10.3), B: 12.8 (2.4) minutes Time to catheter removal: A: 2, B: 1 day Complications: All complications: A: 12/20, B: 3/21 UTI: A: 2/20 B: 0/21 Bladder perforation: A: 1/20, B: 0/21 Urinary retention: A: 2/21, B: 3/20 Vaginal mesh erosion (isolated): A: 0/20, B: 1/21 | |
| Notes | Physical exam specifically evaluated urinary loss through Valsalva maneuver and presence of other concurrent dystopia of pelvic floor (anterior, posterior, and apical), using POP‐Q classification VLPP standardised in this study at 200 mL of vesical repletion Urodynamic study performed on every patient included | |
| Risk of bias | ||
| Bias | Authors' judgement | Support for judgement |
| Random sequence generation (selection bias) | Unclear risk | Patients "randomly distributed". No details provided |
| Allocation concealment (selection bias) | Unclear risk | Not mentioned |
| Blinding (performance bias and detection bias) | Unclear risk | Not mentioned |
| Incomplete outcome data (attrition bias) | Low risk | No missing outcome data |
| Methods | Design: RCT. Details not given in abstract Follow‐up: 24 hours and 90 days | |
| Participants | 42 patients were randomised (porcine collagen 21, polypropylene tapes 21) Inclusion criteria: stress urinary incontinence | |
| Interventions | A (21): porcine collagen B (21): polypropylene tapes | |
| Outcomes | No outcome measure relevant to this review C‐reactive protein and white blood count measured previous day and at 24 hours after surgery Biopsy at 90 days post operation for local inflammatory markers (polymorphonuclear cells, mononuclear cells, giant cells, and neovascularisation) and collagen reaction (collagen amount, composition, and organisation) | |
| Notes | Trial assessing systemic and local inflammatory responses with different sling materials | |
| Risk of bias | ||
| Bias | Authors' judgement | Support for judgement |
| Random sequence generation (selection bias) | Unclear risk | No details provided |
| Allocation concealment (selection bias) | Unclear risk | "blindly randomised" ‐ no details provided |
| Blinding (performance bias and detection bias) | Unclear risk | Not mentioned |
| Incomplete outcome data (attrition bias) | Unclear risk | 2 patients with missing outcome data. No details provided on whether losses were similar in both groups or within a single arm of the trial |
| Methods | Design: prospective randomised study All operations were performed by the same surgical team | |
| Participants | 32 women with main complaint of SUI established by history, examination, and urodynamic evaluation Exclusion criteria: neurological disease, overactive bladder, other causes and forms of incontinence (overflow or pure urge), recurrent SUI (after anti‐incontinence procedure), any form of prolapse requiring surgery (only cases with grade 1 asymptomatic cysto‐urethrocoele included) | |
| Interventions | Transvaginal tension‐free mid‐urethral slings were used under the mid‐urethra via a retropubic route A (12): anterior rectus sheath sling harvested via 7‐cm Pfannenstiel incision and with 0 Prolene suture placed at each end to be pulled up B (12): 7 × 1.5‐cm tailored Prolene strip with 0 Prolene sutures placed at each end to be used as a sling C (8): rectangular anterior vaginal wall patch 5 × 1.5 cm harvested and placed under mid‐urethra with Prolene sutures in the same manner | |
| Outcomes | Cured defined as no leakage reported by patient or noticed at examination (at ˜ 18 months): A: 8/12, B: 9/12, C: 6/8 Improved defined as leakage occurring only with severe exertion unlike before surgery (at 3 months): A: 3/12, B: 2/12, C: 1/8 Failure: A: 1/12, B: 1/12, C: 1/8 Operative blood loss, mean (SD; range): A: 181.2 (33.1; 130 to 230), B: 149.2 (28.8; 100 to 200), C: 200.8 (28.1; 160 to 360) Duration minutes, mean (SD; range): A 52.1 (4.4; 45 to 60), B 35.7 (3.4; 30 to 40), C 42.2 (4.5; 35 to 50) Hospital stay (hours), mean (SD; range): A: 58 (12.3; 48 to 72), B: 33 (9; 24 to 48), C 36 (9.1; 24 to 48) Adverse outcome: bladder perforation: A: 0/12, B:1/12, C: 1/8 Urinary retention: managed by urethral dilators: A: 0/12, B: 1/12, C: 0/8 | |
| Notes | Mean follow‐up was 18, 18.5, and 18 months in Groups A, B, and C. 11 patients completed 36 months of follow‐up (A: 4, B: 4, C: 3) | |
| Risk of bias | ||
| Bias | Authors' judgement | Support for judgement |
| Random sequence generation (selection bias) | Unclear risk | No information |
| Allocation concealment (selection bias) | Unclear risk | No information |
| Blinding (performance bias and detection bias) | Unclear risk | Not mentioned |
| Incomplete outcome data (attrition bias) | Low risk | No differential dropout was reported at 18 months. Only 11/32 patients completed 36 months of follow‐up. No outcome data were provided at 36 months |
| Methods | Design: RCT. Method not clarified Only short‐term follow‐up reported | |
| Participants | 26 women with stress urinary incontinence | |
| Interventions | A (15): fascial sling B (11): vaginal wall sling | |
| Outcomes | Measures of outcomes included SEAPI‐QMN questionnaire, presence of SUI at postoperative period, urinary symptoms and hospital stay at 3 months (median follow‐up 7 months): SEAPI scores: decreased from 6.1 to 0.9 for B, from 6.3 to 0.8 for A Persistent SUI: A: 1/15, B: 0/11 Urgency incontinence: A: 2/15, B: 1/11 Serious postoperative complications: A: 0/15, B: 0/11 Permanent urinary retention (voiding disorder): A: 0/15, B: 0/11 | |
| Notes | All procedures performed by the same surgeon | |
| Risk of bias | ||
| Bias | Authors' judgement | Support for judgement |
| Random sequence generation (selection bias) | Unclear risk | Insufficient information |
| Allocation concealment (selection bias) | Unclear risk | Not mentioned |
| Blinding (performance bias and detection bias) | Unclear risk | Not mentioned |
| Incomplete outcome data (attrition bias) | Low risk | No missing outcome data |
| Methods | Design: RCT. Randomisation by closed envelope delivered to surgeon by a third party. Procedures performed by 1 surgeon Follow‐up: 6 months | |
| Participants | 63 women (mean age 47.8 years) with SUI were randomised; all had similar background characteristics (age, BMI, parity, grade of associated cystocoele) Inclusion criteria: age > 21 years, predominant symptom of SUI, willing to give informed consent, life expectancy > 1 year, normal upper urinary tract, normal manual dexterity Exclusion criteria: pelvic or vaginal surgery within 6 months, urgency urinary incontinence as predominant symptom, > grade 2 cystocoele, associated urethral pathology (e.g. diverticulum), associated bladder pathology (e.g. fistula, culture‐proven, active UTI) 12 lost to follow‐up; no information about which group | |
| Interventions | A (25): autologous fascial sling (harvested from rectus sheath) B (28): TVT Concomitant surgery: grade 2 or 3 cystocoele or rectocoele (27) Median follow‐up: 54 (± 21.9) (range 24 to 102 months) | |
| Outcomes | Cure defined as complete dryness with no usage of pad and negative cough‐stress test Not cured at 6 months: A: 2/25, B: 2/28 Operative time, mean (SD) N: A: 68 (23) 25, B: 48 (25) 28 minutes Time to catheter removal, mean (SD) N: A: 6.6 (5.3) 25, B: 4.3 (2.6) 28 days Complications: Bladder perforation: A: 1/25, B: 2/28 De novo detrusor overactivity at 6 months: A: 1/23, B: 0/24 Stitch sinus at 1 week: A: 0/25, B: 1/28 Vaginal erosion: A: 0/25, B: 0/28 Wound pain at 6 months: A: 7/25, B: 2/28 Voiding dysfunction: A: 7/25, B: 3/28 2‐year results: NB: denominators reported at 2 years were different from those reported at 6 months Quality of life/condition‐specific score: UDI‐6, mean (SD) N: A: 31.7 (16.9) 39; B: 24.4 (19.1) 24 (higher is worse) IIQ‐7, mean (SD) N: A: 24.4 (20.5) 39; B: 23.8 (21.6) 24 (higher is worse) Female sexual function Index (FSFI): no reference to score cited; SD not given Data on pain, satisfaction, lubrication, desire, arousal, and orgasm also provided but not used due to uncertainty about the instrument | |
| Notes | ||
| Risk of bias | ||
| Bias | Authors' judgement | Support for judgement |
| Random sequence generation (selection bias) | Unclear risk | Not mentioned |
| Allocation concealment (selection bias) | Low risk | Closed opaque envelopes held by a non‐involved third party who revealed the allocation after patient was anaesthetised just before start of surgery |
| Blinding (performance bias and detection bias) | Low risk | Outcomes collected by nurse blinded to treatment allocation |
| Incomplete outcome data (attrition bias) | High risk | Differential dropout at 2 years |
| Methods | Design: quasi‐randomised clinical trial Setting: Isfahan University of Medical Sciences, Iran Follow‐up: 3 days and 18 days; 1, 6, 12, and 18 months | |
| Participants | Inclusion criteria: 56 women with severe SUI or mixed urinary incontinence with predominant stress component and anterior vaginal wall prolapse (grade 1 to 3 prolapse based on half‐way classification system) Severity of SUI was diagnosed by ICIQ‐SF or a positive 1‐hour pad test (> 10 grams urine loss with a full bladder) Exclusion criteria: active urinary tract infection; urolithiasis; neurogenic bladder; urogenital malignancy; high‐grade rectocoele, enterocoele, or cystocoele; > POP stage 3 28 women (56%) had previous surgery: vaginal POP A: 12, B: 16; incontinence surgery A: 18, B: 21 Age, mean, years: A: 54.1, B: 55.9 | |
| Interventions | A (26): anterior colporrhaphy (Kelly placation) and sling placement with a strip of anterior vaginal wall tied over rectus fascia and placed tension‐free under the mid‐urethra B (30): TVT (craniocaudal, top‐to‐bottom, SPARC) with transvaginal tension‐free self‐fixing sling for mesh correction of anterior vaginal wall prolapse with a T‐sling mesh kit (Herniamesh Company Polypropylene, Italy). Monofilament non‐woven polypropylene with central portion of mesh absorbable ‐ used for both SUI and cystocoele repair | |
| Outcomes | Objective assessment via 48‐hour frequency volume chart, 48‐hour pad test, and standardised stress test Surgery was considered successful when there was no postoperative SUI (patient was dry and stress test was negative) and postoperative cystocoele was less than grade 2 Objective and subjective cure rates were evaluated between 3 and 18 days, and 1, 6, 12, and 18 months after surgery (data extracted from graphs) Cure at 18 months (from abstract): A: 54%, B: 72% Subjective cure (graph 1): 12 months: A: 14/25, B: 19/25 18 months: A: 13/25, B: 18/25 Objective cure (graph 1): 12 months: A: 13/25, B: 20/25 18 months: A: 13/25, B: 20/25 Mean duration of operation, minutes (SD): A: 42 (20), B: 56 (24) Mean duration of hospital stay, days (SD): A: 2.88 (0.94), B: 2.07 (0.92) Any complications (from abstract): A: 9/25, B: 3/25 Short‐term complications: Vaginal bleeding: A: 5/25, B: 3/25 Haematoma: A: 0/25, B: 2/25 Bladder injury: A: 1/25, B: 2/25 Long‐term complications (> 1 month): Cystitis: A: 3/25, B: 3/25 Vaginal erosion: A: 0/25, B: 2/25 De novo urgency: A: 0/25, B: 2/25 Recurrence of SUI: A: 8/25, B: 1/25 Chronic urinary retention: A: 0/25, B: 4/25 | |
| Notes | Denominators in the table are different from those in the text | |
| Risk of bias | ||
| Bias | Authors' judgement | Support for judgement |
| Random sequence generation (selection bias) | High risk | File number (assumed to be alternation by record number) |
| Allocation concealment (selection bias) | Unclear risk | Randomised into 2 groups |
| Blinding (performance bias and detection bias) | Unclear risk | No information |
| Incomplete outcome data (attrition bias) | Low risk | Only 1 patient reported as lost to follow‐up, but data reported for 25 in each group (actual loss of 4 and 5) |
BMI: body mass index.
ISD: intrinsic sphincter dysfunction.
MMK: Marshall‐Marchetti‐Krantz.
PVR: postvoid residual.
RCT: randomised controlled trial.
SUI: stress urinary incontinence.
UDS: urodynamics.
USI: urodynamic stress incontinence.
Characteristics of excluded studies [ordered by study ID]
| Study | Reason for exclusion |
| RCT. One mid‐urethral sling vs another | |
| Not an RCT: non‐randomised | |
| We are not sure about the population studied; it could be the same population as Barrington 2003 and Arunkalaivanan 2003 (included in the review). We have written to study authors to clarify this point | |
| We are not sure about the population studied; it could be the same population as Arunkalaivanan 2001 and Arunkalaivanan 2003 (included in the review). We have written to study authors to clarify this point | |
| Not an RCT: prospective longitudinal study | |
| Not an RCT: no comparator group | |
| All participants were randomised to undergo or not undergo pre‐operative urodynamic evaluation. They then had implantation of sub‐urethral Mycromesh sling. Therefore this study analyses the impact on effectiveness of a sling if the diagnosis of SUI is made with or without urodynamic evaluation | |
| All participants had a TVT operation and were randomised to division/no division of tape | |
| Participants were randomised to surgery or collagen injection, but those in the surgery arm were selected to sling by patient option. Three types of operations could be chosen in the surgery group: Burch, sling, or bladder neck suspension. Results were reported in terms of collagen vs surgery | |
| RCT; comparators not of interest One mid‐urethral sling vs another | |
| Not all participants had stress incontinence. Debodinance 2000 is a 10‐year follow‐up of the first published study. This is a comparative study between Bologna (a sling made of strips of vaginal wall) and Ingelman‐Sundberg procedures (anterior colporrhaphy with pubococcygeum muscle) | |
| Not clear how participants were allocated. Paper in French; needs translation | |
| RCT in women with low‐pressure urethra but of TVT vs TOT (TOT described as 'bladder neck sling') | |
| We are not sure about the population studied; it could be the same population as Giri 2006, which has been excluded as it was a non‐randomised study. We have made attempts to contact study authors | |
| Not an RCT; non‐randomised | |
| Prolapse surgery rather than incontinence surgery | |
| Study comparing transvaginal tape vs colposuspension | |
| Study comparing transvaginal tape vs colposuspension | |
| Not clear how patients were allocated; we have written to study authors | |
| Randomisation process and groups unclear ('randomised by age'). Excluded as attempts to contact study authors were unsuccessful and insufficient information was given in the abstract Interventions: vaginal hysterectomy, modified Pereyra procedure, anterior and posterior repair vs vaginal hysterectomy, sling procedure with Mersilene mesh, anterior and posterior repair | |
| Study comparing transvaginal tape procedures; will be included in a separate review on self‐fixing slings | |
| Comparison between rectus fascia and polypropylene mesh | |
| Not all patients had stress incontinence; all patients were treated for prolapse, but 1 group received concomitant transvaginal sling (processed fascia lata), 1 group received an alternate surgery for SUI, and the last group did not have SUI and received only treatment for prolapse | |
| Interventions were for clamping vs non‐clamping of catheters post anti‐incontinence surgery | |
| Study comparing transvaginal tape vs colposuspension | |
| Study comparing mid‐urethral sling procedures | |
| Surgery for prolapse rather than incontinence | |
| This study is comparing tape procedures | |
| Patients randomised to colposuspension or transvaginal tape. Reported outcome measures (collagen metabolism) not included in this review | |
| Not clear how patients were allocated. Request sent to study author October 2001 but no reply received | |
| RCT of injectables vs 3 types of surgery; not reported separately | |
| RCT of 3 different materials to carry out TOT; http://clinicaltrials.gov/show/NCT00744198 | |
| Unclear how patients were allocated. Bone anchoring used | |
| One mid‐urethral sling vs another | |
| Occult incontinence treated at the same time as prolapse repair performed | |
| Randomised to different types of anaesthetic | |
| Study comparing transvaginal tape vs colposuspension | |
| This study is comparing tape procedures |
RCT: randomised controlled trial.
SUI: stress urinary incontinence.
TOT: transobturator tape.
TVT: tension‐free vaginal tape.
Characteristics of studies awaiting assessment [ordered by study ID]
| Methods | Please see Abouhashem 2014 |
| Participants | Please see Abouhashem 2014 |
| Interventions | Please see Abouhashem 2014 |
| Outcomes | Please see Abouhashem 2014 |
| Notes | Please note: this appears to be exactly the same abstract as the only report (a conference abstract) of the already included Abouhashem 2014. This study report was identified by the search conducted 23 January 2019, which has not been fully incorporated into this review |
| Methods | |
| Participants | |
| Interventions | |
| Outcomes | |
| Notes | Ongoing trial. This study report was identified by the search conducted 23 January 2019, which has not been fully incorporated into this review |
| Methods | RCT. Single‐blind trial. 'Randomly (computer‐based) categorized into two groups' |
| Participants | 40 women aged 30 to 50 with proven pure type 3 SUI (USI) |
| Interventions | Acellular skin graft using tension‐free vaginal tape (TVT) vs placement of synthetic mesh |
| Outcomes | Mean number of postsurgical problems and improvement in SUI |
| Notes | Ongoing trial Start date: 08.12.2016 to 01.06.2018 Contact information: [email protected] This study report was identified by the search conducted 23 January 2019, which has not been fully incorporated into this review |
| Methods | |
| Participants | |
| Interventions | |
| Outcomes | |
| Notes | This is a report at 10 years of the already included Sharifiaghdas 2008 study. This study report was identified by the search conducted 23 January 2019, which has not been fully incorporated into this review |
RCT: randomised controlled trial.
SUI: stress urinary incontinence.
TVT: tension‐free vaginal tape.
USI: urodynamic stress incontinence.
Characteristics of ongoing studies [ordered by study ID]
| Trial name or title | A prospective randomised comparative trial of a tension‐free vaginal tape (TVT) and fascial sling procedure for 'secondary' genuine stress incontinence |
| Methods | |
| Participants | 146 planned recruitment |
| Interventions | TVT vs fascial sling |
| Outcomes | No information |
| Starting date | |
| Contact information | |
| Notes |
| Trial name or title | A multi‐center, randomized, controlled clinical trial of the safety and efficacy of Regen sling treatment for female patients with stress urinary incontinence |
| Methods | Multi‐centre, randomised, single‐blind, positive parallel controlled, non‐inferiority validation clinical trial: 'allocate random number to the patients in chronological order (random number allocation method: small to large' |
| Participants | Female patients with stress urinary incontinence |
| Interventions | Regen sling (high‐biocompatibility polyvinylidene fluoride (PVDF)) vs transobturator sling TVT‐O™ (Gynecare™, USA) |
| Outcomes | Anti‐urinary incontinence effect; sexual life situation; vaginal tape erosion; improvement in patients' symptoms |
| Starting date | December 2014 to December 2015 |
| Contact information | [email protected]; Professor Zhu Lan |
| Notes |
Data and analyses
| Outcome or subgroup title | No. of studies | No. of participants | Statistical method | Effect size |
| 1 Number of continent women within 1 year (any definition) Show forest plot | 1 | Odds Ratio (M‐H, Fixed, 95% CI) | Totals not selected | |
| Analysis 3.1  Comparison 3 Traditional suburethral sling operation versus drugs, Outcome 1 Number of continent women within 1 year (any definition). | ||||
| 1.1 urodynamic stress incontinence (only) | 0 | Odds Ratio (M‐H, Fixed, 95% CI) | 0.0 [0.0, 0.0] | |
| 1.2 stress urinary incontinence (symptoms only) | 0 | Odds Ratio (M‐H, Fixed, 95% CI) | 0.0 [0.0, 0.0] | |
| 1.3 mixed incontinence | 1 | Odds Ratio (M‐H, Fixed, 95% CI) | 0.0 [0.0, 0.0] | |
| 2 Urge urinary symptoms, urgency urinary incontinence Show forest plot | 1 | Risk Ratio (M‐H, Fixed, 95% CI) | Totals not selected | |
| Analysis 3.2  Comparison 3 Traditional suburethral sling operation versus drugs, Outcome 2 Urge urinary symptoms, urgency urinary incontinence. | ||||
| 2.1 urodynamic stress incontinence (only) | 0 | Risk Ratio (M‐H, Fixed, 95% CI) | 0.0 [0.0, 0.0] | |
| 2.2 stress urinary incontinence (symptoms only) | 0 | Risk Ratio (M‐H, Fixed, 95% CI) | 0.0 [0.0, 0.0] | |
| 2.3 mixed incontinence | 1 | Risk Ratio (M‐H, Fixed, 95% CI) | 0.0 [0.0, 0.0] | |
| Outcome or subgroup title | No. of studies | No. of participants | Statistical method | Effect size |
| 1 Number of continent women within 1 year (any definition) Show forest plot | 1 | Odds Ratio (M‐H, Fixed, 95% CI) | Totals not selected | |
| Analysis 4.1  Comparison 4 Traditional suburethral sling operation versus injectables, Outcome 1 Number of continent women within 1 year (any definition). | ||||
| 1.1 urodynamic stress incontinence (only) | 1 | Odds Ratio (M‐H, Fixed, 95% CI) | 0.0 [0.0, 0.0] | |
| 1.2 stress urinary incontinence (symptoms only) | 0 | Odds Ratio (M‐H, Fixed, 95% CI) | 0.0 [0.0, 0.0] | |
| 1.3 mixed urinary incontinence | 0 | Odds Ratio (M‐H, Fixed, 95% CI) | 0.0 [0.0, 0.0] | |
| 2 Number of continent women at 1 to 5 years (any definition) Show forest plot | 1 | Odds Ratio (M‐H, Fixed, 95% CI) | Totals not selected | |
| Analysis 4.2  Comparison 4 Traditional suburethral sling operation versus injectables, Outcome 2 Number of continent women at 1 to 5 years (any definition). | ||||
| 2.1 urodynamic stress incontinence (only) | 1 | Odds Ratio (M‐H, Fixed, 95% CI) | 0.0 [0.0, 0.0] | |
| 2.2 stress urinary incontinence (symptoms only) | 0 | Odds Ratio (M‐H, Fixed, 95% CI) | 0.0 [0.0, 0.0] | |
| 2.3 mixed urinary incontinence | 0 | Odds Ratio (M‐H, Fixed, 95% CI) | 0.0 [0.0, 0.0] | |
| 3 Repeat surgery for urinary incontinence Show forest plot | 1 | Risk Ratio (M‐H, Fixed, 95% CI) | Totals not selected | |
| Analysis 4.3  Comparison 4 Traditional suburethral sling operation versus injectables, Outcome 3 Repeat surgery for urinary incontinence. | ||||
| 3.1 urodynamic stress incontinence (only) | 1 | Risk Ratio (M‐H, Fixed, 95% CI) | 0.0 [0.0, 0.0] | |
| 3.2 stress urinary incontinence (symptoms only) | 0 | Risk Ratio (M‐H, Fixed, 95% CI) | 0.0 [0.0, 0.0] | |
| 3.3 mixed urinary incontinence | 0 | Risk Ratio (M‐H, Fixed, 95% CI) | 0.0 [0.0, 0.0] | |
| 4 Number of women cured after first year (women's observations) Show forest plot | 1 | Odds Ratio (M‐H, Fixed, 95% CI) | Totals not selected | |
| Analysis 4.4  Comparison 4 Traditional suburethral sling operation versus injectables, Outcome 4 Number of women cured after first year (women's observations). | ||||
| 4.1 urodynamic stress incontinence (only) | 1 | Odds Ratio (M‐H, Fixed, 95% CI) | 0.0 [0.0, 0.0] | |
| 4.2 stress urinary incontinence (symptoms only) | 0 | Odds Ratio (M‐H, Fixed, 95% CI) | 0.0 [0.0, 0.0] | |
| 4.3 mixed urinary incontinence | 0 | Odds Ratio (M‐H, Fixed, 95% CI) | 0.0 [0.0, 0.0] | |
| 5 Number of women satisfied (women's observations) Show forest plot | 1 | Risk Ratio (M‐H, Fixed, 95% CI) | Totals not selected | |
| Analysis 4.5  Comparison 4 Traditional suburethral sling operation versus injectables, Outcome 5 Number of women satisfied (women's observations). | ||||
| 5.1 urodynamic stress incontinence (only) | 1 | Risk Ratio (M‐H, Fixed, 95% CI) | 0.0 [0.0, 0.0] | |
| 5.2 stress urinary incontinence (symptoms only) | 0 | Risk Ratio (M‐H, Fixed, 95% CI) | 0.0 [0.0, 0.0] | |
| 5.3 mixed incontinence | 0 | Risk Ratio (M‐H, Fixed, 95% CI) | 0.0 [0.0, 0.0] | |
| 6 Number of women with urinary incontinence within first year (clinician's observations) Show forest plot | 1 | Risk Ratio (M‐H, Fixed, 95% CI) | Totals not selected | |
| Analysis 4.6  Comparison 4 Traditional suburethral sling operation versus injectables, Outcome 6 Number of women with urinary incontinence within first year (clinician's observations). | ||||
| 6.1 urodynamic stress incontinence (only) | 1 | Risk Ratio (M‐H, Fixed, 95% CI) | 0.0 [0.0, 0.0] | |
| 6.2 stress urinary incontinence (symptoms only) | 0 | Risk Ratio (M‐H, Fixed, 95% CI) | 0.0 [0.0, 0.0] | |
| 6.3 mixed urinary incontinence | 0 | Risk Ratio (M‐H, Fixed, 95% CI) | 0.0 [0.0, 0.0] | |
| 7 Urinary tract infection Show forest plot | 1 | Risk Ratio (M‐H, Fixed, 95% CI) | Totals not selected | |
| Analysis 4.7  Comparison 4 Traditional suburethral sling operation versus injectables, Outcome 7 Urinary tract infection. | ||||
| 7.1 urodynamic stress incontinence (only) | 1 | Risk Ratio (M‐H, Fixed, 95% CI) | 0.0 [0.0, 0.0] | |
| 7.2 stress urinary incontinence (symptoms only) | 0 | Risk Ratio (M‐H, Fixed, 95% CI) | 0.0 [0.0, 0.0] | |
| 7.3 mixed urinary incontinence | 0 | Risk Ratio (M‐H, Fixed, 95% CI) | 0.0 [0.0, 0.0] | |
| 8 De novo detrusor overactivity (urodynamic diagnosis) Show forest plot | 1 | Risk Ratio (M‐H, Fixed, 95% CI) | Totals not selected | |
| Analysis 4.8  Comparison 4 Traditional suburethral sling operation versus injectables, Outcome 8 De novo detrusor overactivity (urodynamic diagnosis). | ||||
| 8.1 urodynamic stress incontinence (only) | 1 | Risk Ratio (M‐H, Fixed, 95% CI) | 0.0 [0.0, 0.0] | |
| 8.2 stress urinary incontinence (symptoms only) | 0 | Risk Ratio (M‐H, Fixed, 95% CI) | 0.0 [0.0, 0.0] | |
| 8.3 mixed urinary incontinence | 0 | Risk Ratio (M‐H, Fixed, 95% CI) | 0.0 [0.0, 0.0] | |
| 9 Voiding dysfunction Show forest plot | 1 | Risk Ratio (M‐H, Fixed, 95% CI) | Totals not selected | |
| Analysis 4.9  Comparison 4 Traditional suburethral sling operation versus injectables, Outcome 9 Voiding dysfunction. | ||||
| 9.1 urodynamic stress incontinence (only) | 1 | Risk Ratio (M‐H, Fixed, 95% CI) | 0.0 [0.0, 0.0] | |
| 9.2 stress urinary incontinence (symptoms only) | 0 | Risk Ratio (M‐H, Fixed, 95% CI) | 0.0 [0.0, 0.0] | |
| 9.3 mixed urinary incontinence | 0 | Risk Ratio (M‐H, Fixed, 95% CI) | 0.0 [0.0, 0.0] | |
| Outcome or subgroup title | No. of studies | No. of participants | Statistical method | Effect size |
| 1 Number of continent women within 1 year (any definition) Show forest plot | 1 | Odds Ratio (M‐H, Fixed, 95% CI) | Totals not selected | |
| Analysis 6.1  Comparison 6 Traditional suburethral sling operation versus bladder neck needle suspension (abdominal and vaginal), Outcome 1 Number of continent women within 1 year (any definition). | ||||
| 1.1 urodynamic stress incontinence (only) | 1 | Odds Ratio (M‐H, Fixed, 95% CI) | 0.0 [0.0, 0.0] | |
| 1.2 stress urinary incontinence (symptoms only) | 0 | Odds Ratio (M‐H, Fixed, 95% CI) | 0.0 [0.0, 0.0] | |
| 1.3 mixed incontinence | 0 | Odds Ratio (M‐H, Fixed, 95% CI) | 0.0 [0.0, 0.0] | |
| 2 Number of continent women at 1 to 5 years (any definition) Show forest plot | 1 | Odds Ratio (M‐H, Fixed, 95% CI) | Totals not selected | |
| Analysis 6.2  Comparison 6 Traditional suburethral sling operation versus bladder neck needle suspension (abdominal and vaginal), Outcome 2 Number of continent women at 1 to 5 years (any definition). | ||||
| 2.1 urodynamic stress incontinence (only) | 1 | Odds Ratio (M‐H, Fixed, 95% CI) | 0.0 [0.0, 0.0] | |
| 2.2 stress urinary incontinence (symptoms only) | 0 | Odds Ratio (M‐H, Fixed, 95% CI) | 0.0 [0.0, 0.0] | |
| 2.3 mixed incontinence | 0 | Odds Ratio (M‐H, Fixed, 95% CI) | 0.0 [0.0, 0.0] | |
| 3 CURE: number of women cured after first year (women's observations) Show forest plot | 1 | Odds Ratio (M‐H, Fixed, 95% CI) | Totals not selected | |
| Analysis 6.3  Comparison 6 Traditional suburethral sling operation versus bladder neck needle suspension (abdominal and vaginal), Outcome 3 CURE: number of women cured after first year (women's observations). | ||||
| 3.1 urodynamic stress incontinence (only) | 1 | Odds Ratio (M‐H, Fixed, 95% CI) | 0.0 [0.0, 0.0] | |
| 3.2 stress urinary incontinence (symptoms only) | 0 | Odds Ratio (M‐H, Fixed, 95% CI) | 0.0 [0.0, 0.0] | |
| 3.3 mixed incontinence | 0 | Odds Ratio (M‐H, Fixed, 95% CI) | 0.0 [0.0, 0.0] | |
| 4 Length of hospital stay (hours) Show forest plot | 1 | Mean Difference (IV, Fixed, 95% CI) | Totals not selected | |
| Analysis 6.4  Comparison 6 Traditional suburethral sling operation versus bladder neck needle suspension (abdominal and vaginal), Outcome 4 Length of hospital stay (hours). | ||||
| 4.1 urodynamic stress incontinence (only) | 1 | Mean Difference (IV, Fixed, 95% CI) | 0.0 [0.0, 0.0] | |
| 4.2 stress urinary incontinence (symptoms only) | 0 | Mean Difference (IV, Fixed, 95% CI) | 0.0 [0.0, 0.0] | |
| 4.3 mixed incontinence | 0 | Mean Difference (IV, Fixed, 95% CI) | 0.0 [0.0, 0.0] | |
| 5 Perioperative surgical complications Show forest plot | 1 | Risk Ratio (M‐H, Fixed, 95% CI) | Totals not selected | |
| Analysis 6.5  Comparison 6 Traditional suburethral sling operation versus bladder neck needle suspension (abdominal and vaginal), Outcome 5 Perioperative surgical complications. | ||||
| 5.1 urodynamic stress incontinence (only) | 1 | Risk Ratio (M‐H, Fixed, 95% CI) | 0.0 [0.0, 0.0] | |
| 5.2 stress urinary incontinence (symptoms only) | 0 | Risk Ratio (M‐H, Fixed, 95% CI) | 0.0 [0.0, 0.0] | |
| 5.3 mixed incontinence | 0 | Risk Ratio (M‐H, Fixed, 95% CI) | 0.0 [0.0, 0.0] | |
| 6 Urinary urgency symptoms, urgency urinary incontinence Show forest plot | 1 | Risk Ratio (M‐H, Fixed, 95% CI) | Totals not selected | |
| Analysis 6.6  Comparison 6 Traditional suburethral sling operation versus bladder neck needle suspension (abdominal and vaginal), Outcome 6 Urinary urgency symptoms, urgency urinary incontinence. | ||||
| 6.1 urodynamic stress incontinence (only) | 1 | Risk Ratio (M‐H, Fixed, 95% CI) | 0.0 [0.0, 0.0] | |
| 6.2 stress urinary incontinence (symptoms only) | 0 | Risk Ratio (M‐H, Fixed, 95% CI) | 0.0 [0.0, 0.0] | |
| 6.3 mixed incontinence | 0 | Risk Ratio (M‐H, Fixed, 95% CI) | 0.0 [0.0, 0.0] | |
| 7 Detrusor overactivity (urodynamic diagnosis) Show forest plot | 1 | Risk Ratio (M‐H, Fixed, 95% CI) | Totals not selected | |
| Analysis 6.7  Comparison 6 Traditional suburethral sling operation versus bladder neck needle suspension (abdominal and vaginal), Outcome 7 Detrusor overactivity (urodynamic diagnosis). | ||||
| 7.1 urodynamic stress incontinence (only) | 1 | Risk Ratio (M‐H, Fixed, 95% CI) | 0.0 [0.0, 0.0] | |
| 7.2 stress urinary incontinence (symptoms only) | 0 | Risk Ratio (M‐H, Fixed, 95% CI) | 0.0 [0.0, 0.0] | |
| 7.3 mixed incontinence | 0 | Risk Ratio (M‐H, Fixed, 95% CI) | 0.0 [0.0, 0.0] | |
| 8 Voiding dysfunction after 3 months Show forest plot | 1 | Risk Ratio (M‐H, Fixed, 95% CI) | Totals not selected | |
| Analysis 6.8  Comparison 6 Traditional suburethral sling operation versus bladder neck needle suspension (abdominal and vaginal), Outcome 8 Voiding dysfunction after 3 months. | ||||
| 8.1 urodynamic stress incontinence (only) | 1 | Risk Ratio (M‐H, Fixed, 95% CI) | 0.0 [0.0, 0.0] | |
| 8.2 stress urinary incontinence (symptoms only) | 0 | Risk Ratio (M‐H, Fixed, 95% CI) | 0.0 [0.0, 0.0] | |
| 8.3 mixed incontinence | 0 | Risk Ratio (M‐H, Fixed, 95% CI) | 0.0 [0.0, 0.0] | |
| Outcome or subgroup title | No. of studies | No. of participants | Statistical method | Effect size |
| 1 Number of continent women within 1 year (any definition) Show forest plot | 4 | 147 | Odds Ratio (M‐H, Fixed, 95% CI) | 2.70 [0.69, 10.55] |
| Analysis 7.1  Comparison 7 Traditional suburethral sling operation versus open abdominal retropubic colposuspension, Outcome 1 Number of continent women within 1 year (any definition). | ||||
| 1.1 urodynamic stress incontinence (only) | 4 | 147 | Odds Ratio (M‐H, Fixed, 95% CI) | 2.70 [0.69, 10.55] |
| 1.2 stress urinary incontinence (symptoms only) | 0 | 0 | Odds Ratio (M‐H, Fixed, 95% CI) | 0.0 [0.0, 0.0] |
| 1.3 mixed incontinence | 0 | 0 | Odds Ratio (M‐H, Fixed, 95% CI) | 0.0 [0.0, 0.0] |
| 2 Number of continent women at 1 to 5 years (any definition) Show forest plot | 4 | 687 | Odds Ratio (M‐H, Fixed, 95% CI) | 1.70 [1.22, 2.37] |
| Analysis 7.2  Comparison 7 Traditional suburethral sling operation versus open abdominal retropubic colposuspension, Outcome 2 Number of continent women at 1 to 5 years (any definition). | ||||
| 2.1 urodynamic stress incontinence (only) | 3 | 167 | Odds Ratio (M‐H, Fixed, 95% CI) | 1.84 [0.65, 5.24] |
| 2.2 stress urinary incontinence (symptoms only) | 1 | 520 | Odds Ratio (M‐H, Fixed, 95% CI) | 1.69 [1.19, 2.39] |
| 2.3 mixed incontinence | 0 | 0 | Odds Ratio (M‐H, Fixed, 95% CI) | 0.0 [0.0, 0.0] |
| 3 Number of continent women after 5 years (any definition) Show forest plot | 2 | 481 | Odds Ratio (M‐H, Fixed, 95% CI) | 1.55 [1.06, 2.27] |
| Analysis 7.3  Comparison 7 Traditional suburethral sling operation versus open abdominal retropubic colposuspension, Outcome 3 Number of continent women after 5 years (any definition). | ||||
| 3.1 urodynamic stress incontinence (only) | 1 | 28 | Odds Ratio (M‐H, Fixed, 95% CI) | 0.39 [0.03, 4.92] |
| 3.2 stress urinary incontinence (symptoms only) | 1 | 453 | Odds Ratio (M‐H, Fixed, 95% CI) | 1.61 [1.09, 2.37] |
| 3.3 mixed incontinence | 0 | 0 | Odds Ratio (M‐H, Fixed, 95% CI) | 0.0 [0.0, 0.0] |
| 4 Repeat surgery for urinary incontinence Show forest plot | 1 | Risk Ratio (M‐H, Fixed, 95% CI) | Totals not selected | |
| Analysis 7.4  Comparison 7 Traditional suburethral sling operation versus open abdominal retropubic colposuspension, Outcome 4 Repeat surgery for urinary incontinence. | ||||
| 4.1 urodynamic stress incontinence (only) | 0 | Risk Ratio (M‐H, Fixed, 95% CI) | 0.0 [0.0, 0.0] | |
| 4.2 stress urinary incontinence (symptoms only) | 1 | Risk Ratio (M‐H, Fixed, 95% CI) | 0.0 [0.0, 0.0] | |
| 4.3 mixed incontinence | 0 | Risk Ratio (M‐H, Fixed, 95% CI) | 0.0 [0.0, 0.0] | |
| 5 Number of women cured after first year (women's observations) Show forest plot | 3 | 515 | Odds Ratio (M‐H, Fixed, 95% CI) | 1.56 [1.07, 2.28] |
| Analysis 7.5  Comparison 7 Traditional suburethral sling operation versus open abdominal retropubic colposuspension, Outcome 5 Number of women cured after first year (women's observations). | ||||
| 5.1 urodynamic stress incontinence (only) | 2 | 62 | Odds Ratio (M‐H, Fixed, 95% CI) | 0.93 [0.18, 4.89] |
| 5.2 stress urinary incontinence (symptoms only) | 1 | 453 | Odds Ratio (M‐H, Fixed, 95% CI) | 1.61 [1.09, 2.37] |
| 5.3 mixed incontinence | 0 | 0 | Odds Ratio (M‐H, Fixed, 95% CI) | 0.0 [0.0, 0.0] |
| 6 Number of women satisfied (women's observations) Show forest plot | 1 | Risk Ratio (M‐H, Fixed, 95% CI) | Totals not selected | |
| Analysis 7.6  Comparison 7 Traditional suburethral sling operation versus open abdominal retropubic colposuspension, Outcome 6 Number of women satisfied (women's observations). | ||||
| 6.1 urodynamic stress incontinence (only) | 0 | Risk Ratio (M‐H, Fixed, 95% CI) | 0.0 [0.0, 0.0] | |
| 6.2 stress urinary incontinence (symptoms only) | 1 | Risk Ratio (M‐H, Fixed, 95% CI) | 0.0 [0.0, 0.0] | |
| 6.3 mixed incontinence | 0 | Risk Ratio (M‐H, Fixed, 95% CI) | 0.0 [0.0, 0.0] | |
| 7 Number of women with urinary incontinence within first year (clinician's observations) | 0 | 0 | Risk Ratio (M‐H, Fixed, 95% CI) | 0.0 [0.0, 0.0] |
| 7.1 urodynamic stress incontinence (only) | 0 | 0 | Risk Ratio (M‐H, Fixed, 95% CI) | 0.0 [0.0, 0.0] |
| 7.2 stress urinary incontinence (symptoms only) | 0 | 0 | Risk Ratio (M‐H, Fixed, 95% CI) | 0.0 [0.0, 0.0] |
| 7.3 mixed incontinence | 0 | 0 | Risk Ratio (M‐H, Fixed, 95% CI) | 0.0 [0.0, 0.0] |
| 8 Number of women with urinary incontinence at 1 to 5 years (clinician's observations) Show forest plot | 3 | 626 | Risk Ratio (M‐H, Fixed, 95% CI) | 0.88 [0.59, 1.31] |
| Analysis 7.8  Comparison 7 Traditional suburethral sling operation versus open abdominal retropubic colposuspension, Outcome 8 Number of women with urinary incontinence at 1 to 5 years (clinician's observations). | ||||
| 8.1 urodynamic stress incontinence (only) | 2 | 106 | Risk Ratio (M‐H, Fixed, 95% CI) | 0.54 [0.16, 1.86] |
| 8.2 stress urinary incontinence (symptoms only) | 1 | 520 | Risk Ratio (M‐H, Fixed, 95% CI) | 0.94 [0.62, 1.42] |
| 8.3 mixed incontinence | 0 | 0 | Risk Ratio (M‐H, Fixed, 95% CI) | 0.0 [0.0, 0.0] |
| 9 Number of women with urinary incontinence after 5 years (clinician's observations) Show forest plot | 2 | 461 | Risk Ratio (M‐H, Fixed, 95% CI) | 0.90 [0.80, 1.01] |
| Analysis 7.9  Comparison 7 Traditional suburethral sling operation versus open abdominal retropubic colposuspension, Outcome 9 Number of women with urinary incontinence after 5 years (clinician's observations). | ||||
| 9.1 urodynamic stress incontinence (only) | 1 | 28 | Risk Ratio (M‐H, Fixed, 95% CI) | 0.23 [0.01, 4.37] |
| 9.2 stress urinary incontinence (symptoms only) | 1 | 433 | Risk Ratio (M‐H, Fixed, 95% CI) | 0.91 [0.81, 1.02] |
| 9.3 mixed incontinence | 0 | 0 | Risk Ratio (M‐H, Fixed, 95% CI) | 0.0 [0.0, 0.0] |
| 10 Duration of operation (minutes) Show forest plot | 1 | Mean Difference (IV, Fixed, 95% CI) | Totals not selected | |
| Analysis 7.10  Comparison 7 Traditional suburethral sling operation versus open abdominal retropubic colposuspension, Outcome 10 Duration of operation (minutes). | ||||
| 10.1 urodynamic stress incontinence (only) | 1 | Mean Difference (IV, Fixed, 95% CI) | 0.0 [0.0, 0.0] | |
| 10.2 stress urinary incontinence (symptoms only) | 0 | Mean Difference (IV, Fixed, 95% CI) | 0.0 [0.0, 0.0] | |
| 10.3 mixed incontinence | 0 | Mean Difference (IV, Fixed, 95% CI) | 0.0 [0.0, 0.0] | |
| 11 Length of hospital stay (days) Show forest plot | 3 | 137 | Mean Difference (IV, Fixed, 95% CI) | 2.03 [1.47, 2.59] |
| Analysis 7.11  Comparison 7 Traditional suburethral sling operation versus open abdominal retropubic colposuspension, Outcome 11 Length of hospital stay (days). | ||||
| 11.1 urodynamic stress incontinence (only) | 3 | 137 | Mean Difference (IV, Fixed, 95% CI) | 2.03 [1.47, 2.59] |
| 11.2 stress urinary incontinence (symptoms only) | 0 | 0 | Mean Difference (IV, Fixed, 95% CI) | 0.0 [0.0, 0.0] |
| 11.3 mixed incontinence | 0 | 0 | Mean Difference (IV, Fixed, 95% CI) | 0.0 [0.0, 0.0] |
| 12 Time to catheter removal (days) Show forest plot | 2 | 108 | Mean Difference (IV, Fixed, 95% CI) | 8.01 [6.84, 9.18] |
| Analysis 7.12  Comparison 7 Traditional suburethral sling operation versus open abdominal retropubic colposuspension, Outcome 12 Time to catheter removal (days). | ||||
| 12.1 urodynamic stress incontinence (only) | 2 | 108 | Mean Difference (IV, Fixed, 95% CI) | 8.01 [6.84, 9.18] |
| 12.2 stress urinary incontinence (symptoms only) | 0 | 0 | Mean Difference (IV, Fixed, 95% CI) | 0.0 [0.0, 0.0] |
| 12.3 mixed incontinence | 0 | 0 | Mean Difference (IV, Fixed, 95% CI) | 0.0 [0.0, 0.0] |
| 13 Time to return to normal activity level | 0 | 0 | Mean Difference (IV, Fixed, 95% CI) | 0.0 [0.0, 0.0] |
| 13.1 urodynamic stress incontinence (only) | 0 | 0 | Mean Difference (IV, Fixed, 95% CI) | 0.0 [0.0, 0.0] |
| 13.2 stress urinary incontinence (symptoms only) | 0 | 0 | Mean Difference (IV, Fixed, 95% CI) | 0.0 [0.0, 0.0] |
| 13.3 mixed incontinence | 0 | 0 | Mean Difference (IV, Fixed, 95% CI) | 0.0 [0.0, 0.0] |
| 14 Number of women requiring treatment for pelvic organ prolapse Show forest plot | 3 | 559 | Risk Ratio (M‐H, Fixed, 95% CI) | 0.20 [0.05, 0.77] |
| Analysis 7.14  Comparison 7 Traditional suburethral sling operation versus open abdominal retropubic colposuspension, Outcome 14 Number of women requiring treatment for pelvic organ prolapse. | ||||
| 14.1 urodynamic stress incontinence (only) | 2 | 106 | Risk Ratio (M‐H, Fixed, 95% CI) | 0.2 [0.04, 1.11] |
| 14.2 stress urinary incontinence (symptoms only) | 1 | 453 | Risk Ratio (M‐H, Fixed, 95% CI) | 0.20 [0.02, 1.74] |
| 14.3 mixed incontinence | 0 | 0 | Risk Ratio (M‐H, Fixed, 95% CI) | 0.0 [0.0, 0.0] |
| 15 Perioperative surgical complications Show forest plot | 4 | 792 | Risk Ratio (M‐H, Fixed, 95% CI) | 1.24 [0.83, 1.86] |
| Analysis 7.15  Comparison 7 Traditional suburethral sling operation versus open abdominal retropubic colposuspension, Outcome 15 Perioperative surgical complications. | ||||
| 15.1 urodynamic stress incontinence (only) | 3 | 137 | Risk Ratio (M‐H, Fixed, 95% CI) | 0.85 [0.28, 2.52] |
| 15.2 stress urinary incontinence (symptoms only) | 1 | 655 | Risk Ratio (M‐H, Fixed, 95% CI) | 1.32 [0.86, 2.04] |
| 15.3 mixed incontinence | 0 | 0 | Risk Ratio (M‐H, Fixed, 95% CI) | 0.0 [0.0, 0.0] |
| 16 Bladder perforation Show forest plot | 1 | Risk Ratio (M‐H, Fixed, 95% CI) | Totals not selected | |
| Analysis 7.16  Comparison 7 Traditional suburethral sling operation versus open abdominal retropubic colposuspension, Outcome 16 Bladder perforation. | ||||
| 16.1 urodynamic stress incontinence (only) | 0 | Risk Ratio (M‐H, Fixed, 95% CI) | 0.0 [0.0, 0.0] | |
| 16.2 stress urinary incontinence (symptoms only) | 1 | Risk Ratio (M‐H, Fixed, 95% CI) | 0.0 [0.0, 0.0] | |
| 16.3 mixed incontinence | 0 | Risk Ratio (M‐H, Fixed, 95% CI) | 0.0 [0.0, 0.0] | |
| 17 Urinary tract infection Show forest plot | 1 | Risk Ratio (M‐H, Fixed, 95% CI) | Totals not selected | |
| Analysis 7.17  Comparison 7 Traditional suburethral sling operation versus open abdominal retropubic colposuspension, Outcome 17 Urinary tract infection. | ||||
| 17.1 urodynamic stress incontinence (only) | 0 | Risk Ratio (M‐H, Fixed, 95% CI) | 0.0 [0.0, 0.0] | |
| 17.2 stress urinary incontinence (symptoms only) | 1 | Risk Ratio (M‐H, Fixed, 95% CI) | 0.0 [0.0, 0.0] | |
| 17.3 mixed incontinence | 0 | Risk Ratio (M‐H, Fixed, 95% CI) | 0.0 [0.0, 0.0] | |
| 18 Number of women with recurrent UTIs at > 5 years Show forest plot | 1 | Risk Ratio (M‐H, Fixed, 95% CI) | Totals not selected | |
| Analysis 7.18  Comparison 7 Traditional suburethral sling operation versus open abdominal retropubic colposuspension, Outcome 18 Number of women with recurrent UTIs at > 5 years. | ||||
| 18.1 urodynamic stress incontinence (only) | 0 | Risk Ratio (M‐H, Fixed, 95% CI) | 0.0 [0.0, 0.0] | |
| 18.2 stress urinary incontinence (symptoms only) | 1 | Risk Ratio (M‐H, Fixed, 95% CI) | 0.0 [0.0, 0.0] | |
| 18.3 mixed incontinence | 0 | Risk Ratio (M‐H, Fixed, 95% CI) | 0.0 [0.0, 0.0] | |
| 19 Urinary urgency symptoms, urgency urinary incontinence Show forest plot | 2 | 525 | Risk Ratio (M‐H, Fixed, 95% CI) | 1.10 [0.74, 1.64] |
| Analysis 7.19  Comparison 7 Traditional suburethral sling operation versus open abdominal retropubic colposuspension, Outcome 19 Urinary urgency symptoms, urgency urinary incontinence. | ||||
| 19.1 urodynamic stress incontinence (only) | 1 | 72 | Risk Ratio (M‐H, Fixed, 95% CI) | 2.0 [0.54, 7.39] |
| 19.2 stress urinary incontinence (symptoms only) | 1 | 453 | Risk Ratio (M‐H, Fixed, 95% CI) | 1.02 [0.67, 1.56] |
| 19.3 mixed incontinence | 0 | 0 | Risk Ratio (M‐H, Fixed, 95% CI) | 0.0 [0.0, 0.0] |
| 20 Detrusor overactivity (urodynamic diagnosis) Show forest plot | 4 | 203 | Risk Ratio (M‐H, Fixed, 95% CI) | 1.42 [0.52, 3.87] |
| Analysis 7.20  Comparison 7 Traditional suburethral sling operation versus open abdominal retropubic colposuspension, Outcome 20 Detrusor overactivity (urodynamic diagnosis). | ||||
| 20.1 urodynamic stress incontinence (only) | 4 | 203 | Risk Ratio (M‐H, Fixed, 95% CI) | 1.42 [0.52, 3.87] |
| 20.2 stress urinary incontinence (symptoms only) | 0 | 0 | Risk Ratio (M‐H, Fixed, 95% CI) | 0.0 [0.0, 0.0] |
| 20.3 mixed incontinence | 0 | 0 | Risk Ratio (M‐H, Fixed, 95% CI) | 0.0 [0.0, 0.0] |
| 21 Voiding dysfunction after 3 months Show forest plot | 5 | 853 | Risk Ratio (M‐H, Fixed, 95% CI) | 6.08 [3.10, 11.95] |
| Analysis 7.21  Comparison 7 Traditional suburethral sling operation versus open abdominal retropubic colposuspension, Outcome 21 Voiding dysfunction after 3 months. | ||||
| 21.1 urodynamic stress incontinence (only) | 4 | 198 | Risk Ratio (M‐H, Fixed, 95% CI) | 4.48 [1.16, 17.36] |
| 21.2 stress urinary incontinence (symptoms only) | 1 | 655 | Risk Ratio (M‐H, Fixed, 95% CI) | 6.63 [3.04, 14.47] |
| 21.3 mixed incontinence | 0 | 0 | Risk Ratio (M‐H, Fixed, 95% CI) | 0.0 [0.0, 0.0] |
| 22 Long‐term voiding dysfunction > 5 years Show forest plot | 1 | Risk Ratio (M‐H, Fixed, 95% CI) | Totals not selected | |
| Analysis 7.22  Comparison 7 Traditional suburethral sling operation versus open abdominal retropubic colposuspension, Outcome 22 Long‐term voiding dysfunction > 5 years. | ||||
| 22.1 urodynamic stress incontinence (only) | 0 | Risk Ratio (M‐H, Fixed, 95% CI) | 0.0 [0.0, 0.0] | |
| 22.2 stress urinary incontinence (symptoms only) | 1 | Risk Ratio (M‐H, Fixed, 95% CI) | 0.0 [0.0, 0.0] | |
| 22.3 mixed incontinence | 0 | Risk Ratio (M‐H, Fixed, 95% CI) | 0.0 [0.0, 0.0] | |
| 23 Condition‐specific measures to assess quality of life Show forest plot | 1 | Mean Difference (IV, Fixed, 95% CI) | Totals not selected | |
| Analysis 7.23  Comparison 7 Traditional suburethral sling operation versus open abdominal retropubic colposuspension, Outcome 23 Condition‐specific measures to assess quality of life. | ||||
| 23.1 Urinary Distress Index (UDI) | 1 | Mean Difference (IV, Fixed, 95% CI) | 0.0 [0.0, 0.0] | |
| 23.2 Incontinence Impact Questionnaire (IIQ) | 1 | Mean Difference (IV, Fixed, 95% CI) | 0.0 [0.0, 0.0] | |
| Outcome or subgroup title | No. of studies | No. of participants | Statistical method | Effect size |
| 1 Number of continent women within 1 year (any definition) Show forest plot | 11 | 841 | Odds Ratio (M‐H, Fixed, 95% CI) | 0.94 [0.67, 1.32] |
| Analysis 9.1  Comparison 9 Traditional suburethral sling operation versus mid‐urethral sling or tape, Outcome 1 Number of continent women within 1 year (any definition). | ||||
| 1.1 urodynamic stress incontinence (only) | 5 | 427 | Odds Ratio (M‐H, Fixed, 95% CI) | 0.97 [0.60, 1.56] |
| 1.2 stress urinary incontinence (symptoms only) | 1 | 53 | Odds Ratio (M‐H, Fixed, 95% CI) | 0.88 [0.12, 6.79] |
| 1.3 mixed urinary incontinence | 5 | 361 | Odds Ratio (M‐H, Fixed, 95% CI) | 0.91 [0.55, 1.51] |
| 2 Number of continent women at 1 to 5 years (any definition) Show forest plot | 6 | 458 | Odds Ratio (M‐H, Fixed, 95% CI) | 0.67 [0.44, 1.02] |
| Analysis 9.2  Comparison 9 Traditional suburethral sling operation versus mid‐urethral sling or tape, Outcome 2 Number of continent women at 1 to 5 years (any definition). | ||||
| 2.1 urodynamic stress incontinence (only) | 4 | 364 | Odds Ratio (M‐H, Fixed, 95% CI) | 0.77 [0.47, 1.25] |
| 2.2 stress urinary incontinence (symptoms only) | 0 | 0 | Odds Ratio (M‐H, Fixed, 95% CI) | 0.0 [0.0, 0.0] |
| 2.3 mixed urinary incontinence | 2 | 94 | Odds Ratio (M‐H, Fixed, 95% CI) | 0.42 [0.17, 1.04] |
| 3 Number of continent women after 5 years (any definition) Show forest plot | 1 | Odds Ratio (M‐H, Fixed, 95% CI) | Totals not selected | |
| Analysis 9.3  Comparison 9 Traditional suburethral sling operation versus mid‐urethral sling or tape, Outcome 3 Number of continent women after 5 years (any definition). | ||||
| 3.1 urodynamic stress incontinence (only) | 1 | Odds Ratio (M‐H, Fixed, 95% CI) | 0.0 [0.0, 0.0] | |
| 3.2 stress urinary incontinence (symptoms only) | 0 | Odds Ratio (M‐H, Fixed, 95% CI) | 0.0 [0.0, 0.0] | |
| 3.3 mixed urinary incontinence | 0 | Odds Ratio (M‐H, Fixed, 95% CI) | 0.0 [0.0, 0.0] | |
| 4 Repeat surgery for urinary incontinence Show forest plot | 1 | Risk Ratio (M‐H, Fixed, 95% CI) | Totals not selected | |
| Analysis 9.4  Comparison 9 Traditional suburethral sling operation versus mid‐urethral sling or tape, Outcome 4 Repeat surgery for urinary incontinence. | ||||
| 4.1 urodynamic stress incontinence (only) | 1 | Risk Ratio (M‐H, Fixed, 95% CI) | 0.0 [0.0, 0.0] | |
| 4.2 stress urinary incontinence (symptoms only) | 1 | Risk Ratio (M‐H, Fixed, 95% CI) | 0.0 [0.0, 0.0] | |
| 4.3 mixed incontinence | 0 | Risk Ratio (M‐H, Fixed, 95% CI) | 0.0 [0.0, 0.0] | |
| 5 Number of women cured after first year (women's observations) Show forest plot | 4 | 337 | Odds Ratio (M‐H, Fixed, 95% CI) | 1.06 [0.65, 1.72] |
| Analysis 9.5  Comparison 9 Traditional suburethral sling operation versus mid‐urethral sling or tape, Outcome 5 Number of women cured after first year (women's observations). | ||||
| 5.1 urodynamic stress incontinence (only) | 3 | 293 | Odds Ratio (M‐H, Fixed, 95% CI) | 1.21 [0.72, 2.03] |
| 5.2 stress urinary incontinence (symptoms only) | 0 | 0 | Odds Ratio (M‐H, Fixed, 95% CI) | 0.0 [0.0, 0.0] |
| 5.3 mixed urinary incontinence | 1 | 44 | Odds Ratio (M‐H, Fixed, 95% CI) | 0.42 [0.10, 1.72] |
| 6 Number of women improved or cured within 1 year (women's observations) Show forest plot | 3 | 425 | Odds Ratio (M‐H, Fixed, 95% CI) | 1.33 [0.74, 2.39] |
| Analysis 9.6  Comparison 9 Traditional suburethral sling operation versus mid‐urethral sling or tape, Outcome 6 Number of women improved or cured within 1 year (women's observations). | ||||
| 6.1 urodynamic stress incontinence (only) | 2 | 286 | Odds Ratio (M‐H, Fixed, 95% CI) | 1.06 [0.43, 2.64] |
| 6.2 stress urinary incontinence (symptoms only) | 0 | 0 | Odds Ratio (M‐H, Fixed, 95% CI) | 0.0 [0.0, 0.0] |
| 6.3 mixed urinary incontinence | 1 | 139 | Odds Ratio (M‐H, Fixed, 95% CI) | 1.56 [0.72, 3.39] |
| 7 Number of women improved or cured at 1 to 5 years (women's observations) Show forest plot | 2 | 264 | Odds Ratio (M‐H, Fixed, 95% CI) | 0.76 [0.31, 1.87] |
| Analysis 9.7  Comparison 9 Traditional suburethral sling operation versus mid‐urethral sling or tape, Outcome 7 Number of women improved or cured at 1 to 5 years (women's observations). | ||||
| 7.1 urodynamic stress incontinence (only) | 2 | 264 | Odds Ratio (M‐H, Fixed, 95% CI) | 0.76 [0.31, 1.87] |
| 7.2 stress urinary incontinence (symptoms only) | 0 | 0 | Odds Ratio (M‐H, Fixed, 95% CI) | 0.0 [0.0, 0.0] |
| 7.3 mixed urinary incontinence | 0 | 0 | Odds Ratio (M‐H, Fixed, 95% CI) | 0.0 [0.0, 0.0] |
| 8 Number of women improved or cured after 5 years (women's observations) Show forest plot | 1 | Odds Ratio (M‐H, Fixed, 95% CI) | Totals not selected | |
| Analysis 9.8  Comparison 9 Traditional suburethral sling operation versus mid‐urethral sling or tape, Outcome 8 Number of women improved or cured after 5 years (women's observations). | ||||
| 8.1 urodynamic stress incontinence (only) | 1 | Odds Ratio (M‐H, Fixed, 95% CI) | 0.0 [0.0, 0.0] | |
| 8.2 stress urinary incontinence (symptoms only) | 0 | Odds Ratio (M‐H, Fixed, 95% CI) | 0.0 [0.0, 0.0] | |
| 8.3 mixed urinary incontinence | 0 | Odds Ratio (M‐H, Fixed, 95% CI) | 0.0 [0.0, 0.0] | |
| 9 Number of women satisfied (women's observations) Show forest plot | 2 | Risk Ratio (M‐H, Fixed, 95% CI) | Subtotals only | |
| Analysis 9.9  Comparison 9 Traditional suburethral sling operation versus mid‐urethral sling or tape, Outcome 9 Number of women satisfied (women's observations). | ||||
| 9.1 urodynamic stress incontinence (only) | 2 | 163 | Risk Ratio (M‐H, Fixed, 95% CI) | 1.09 [0.89, 1.33] |
| 9.2 stress urinary incontinence (symptoms only) | 0 | 0 | Risk Ratio (M‐H, Fixed, 95% CI) | 0.0 [0.0, 0.0] |
| 9.3 mixed urinary incontinence | 0 | 0 | Risk Ratio (M‐H, Fixed, 95% CI) | 0.0 [0.0, 0.0] |
| 10 Pad test of quantified leakage (mean weight of urine lost) Show forest plot | 1 | Mean Difference (IV, Fixed, 95% CI) | Totals not selected | |
| Analysis 9.10  Comparison 9 Traditional suburethral sling operation versus mid‐urethral sling or tape, Outcome 10 Pad test of quantified leakage (mean weight of urine lost). | ||||
| 10.1 urodynamic stress incontinence (only) | 1 | Mean Difference (IV, Fixed, 95% CI) | 0.0 [0.0, 0.0] | |
| 10.2 stress urinary incontinence (symptoms only) | 0 | Mean Difference (IV, Fixed, 95% CI) | 0.0 [0.0, 0.0] | |
| 10.3 mixed urinary incontinence | 0 | Mean Difference (IV, Fixed, 95% CI) | 0.0 [0.0, 0.0] | |
| 11 Number of women with urinary incontinence within first year (clinician's observations) Show forest plot | 2 | 105 | Risk Ratio (M‐H, Fixed, 95% CI) | 1.29 [0.45, 3.71] |
| Analysis 9.11  Comparison 9 Traditional suburethral sling operation versus mid‐urethral sling or tape, Outcome 11 Number of women with urinary incontinence within first year (clinician's observations). | ||||
| 11.1 urodynamic stress incontinence (only) | 0 | 0 | Risk Ratio (M‐H, Fixed, 95% CI) | 0.0 [0.0, 0.0] |
| 11.2 stress urinary incontinence (symptoms only) | 0 | 0 | Risk Ratio (M‐H, Fixed, 95% CI) | 0.0 [0.0, 0.0] |
| 11.3 mixed urinary incontinence | 2 | 105 | Risk Ratio (M‐H, Fixed, 95% CI) | 1.29 [0.45, 3.71] |
| 12 Number of women with urinary incontinence at 1 to 5 years (any definition) (clinician's observations) Show forest plot | 1 | Risk Ratio (M‐H, Fixed, 95% CI) | Totals not selected | |
| Analysis 9.12  Comparison 9 Traditional suburethral sling operation versus mid‐urethral sling or tape, Outcome 12 Number of women with urinary incontinence at 1 to 5 years (any definition) (clinician's observations). | ||||
| 12.1 urodynamic stress incontinence (only) | 0 | Risk Ratio (M‐H, Fixed, 95% CI) | 0.0 [0.0, 0.0] | |
| 12.2 stress urinary incontinence (symptoms only) | 0 | Risk Ratio (M‐H, Fixed, 95% CI) | 0.0 [0.0, 0.0] | |
| 12.3 mixed urinary incontinence | 1 | Risk Ratio (M‐H, Fixed, 95% CI) | 0.0 [0.0, 0.0] | |
| 13 Duration of operation (minutes) Show forest plot | 7 | 355 | Mean Difference (IV, Fixed, 95% CI) | 57.08 [54.67, 59.49] |
| Analysis 9.13  Comparison 9 Traditional suburethral sling operation versus mid‐urethral sling or tape, Outcome 13 Duration of operation (minutes). | ||||
| 13.1 urodynamic stress incontinence (only) | 2 | 61 | Mean Difference (IV, Fixed, 95% CI) | 46.91 [42.31, 51.52] |
| 13.2 stress urinary incontinence (symptoms only) | 1 | 53 | Mean Difference (IV, Fixed, 95% CI) | 20.0 [7.08, 32.92] |
| 13.3 mixed urinary incontinence | 4 | 241 | Mean Difference (IV, Fixed, 95% CI) | 62.96 [60.07, 65.86] |
| 14 Length of hospital stay (days) Show forest plot | 4 | 194 | Mean Difference (IV, Fixed, 95% CI) | 0.74 [0.55, 0.93] |
| Analysis 9.14  Comparison 9 Traditional suburethral sling operation versus mid‐urethral sling or tape, Outcome 14 Length of hospital stay (days). | ||||
| 14.1 urodynamic stress incontinence (only) | 1 | 20 | Mean Difference (IV, Fixed, 95% CI) | 0.65 [0.39, 0.91] |
| 14.2 stress urinary incontinence (symptoms only) | 0 | 0 | Mean Difference (IV, Fixed, 95% CI) | 0.0 [0.0, 0.0] |
| 14.3 mixed urinary incontinence | 3 | 174 | Mean Difference (IV, Fixed, 95% CI) | 0.83 [0.56, 1.10] |
| 15 Time to catheter removal (days) Show forest plot | 2 | 113 | Mean Difference (IV, Fixed, 95% CI) | 0.11 [‐0.07, 0.30] |
| Analysis 9.15  Comparison 9 Traditional suburethral sling operation versus mid‐urethral sling or tape, Outcome 15 Time to catheter removal (days). | ||||
| 15.1 urodynamic stress incontinence (only) | 0 | 0 | Mean Difference (IV, Fixed, 95% CI) | 0.0 [0.0, 0.0] |
| 15.2 stress urinary incontinence (symptoms only) | 1 | 53 | Mean Difference (IV, Fixed, 95% CI) | 2.3 [0.01, 4.59] |
| 15.3 mixed urinary incontinence | 1 | 60 | Mean Difference (IV, Fixed, 95% CI) | 0.10 [‐0.09, 0.29] |
| 16 Perioperative surgical complications Show forest plot | 4 | 293 | Risk Ratio (M‐H, Fixed, 95% CI) | 1.74 [1.16, 2.60] |
| Analysis 9.16  Comparison 9 Traditional suburethral sling operation versus mid‐urethral sling or tape, Outcome 16 Perioperative surgical complications. | ||||
| 16.1 urodynamic stress incontinence (only) | 2 | 183 | Risk Ratio (M‐H, Fixed, 95% CI) | 1.73 [1.01, 2.96] |
| 16.2 stress urinary incontinence (symptoms only) | 0 | 0 | Risk Ratio (M‐H, Fixed, 95% CI) | 0.0 [0.0, 0.0] |
| 16.3 mixed urinary incontinence | 2 | 110 | Risk Ratio (M‐H, Fixed, 95% CI) | 1.74 [0.94, 3.21] |
| 17 Bladder perforations Show forest plot | 10 | 844 | Risk Ratio (M‐H, Fixed, 95% CI) | 0.59 [0.34, 1.01] |
| Analysis 9.17  Comparison 9 Traditional suburethral sling operation versus mid‐urethral sling or tape, Outcome 17 Bladder perforations. | ||||
| 17.1 urodynamic stress incontinence (only) | 3 | 334 | Risk Ratio (M‐H, Fixed, 95% CI) | 0.74 [0.19, 2.86] |
| 17.2 stress urinary incontinence (symptoms only) | 1 | 53 | Risk Ratio (M‐H, Fixed, 95% CI) | 0.56 [0.05, 5.81] |
| 17.3 mixed urinary incontinence | 6 | 457 | Risk Ratio (M‐H, Fixed, 95% CI) | 0.56 [0.30, 1.03] |
| 18 Urethral injury Show forest plot | 1 | Risk Ratio (M‐H, Fixed, 95% CI) | Totals not selected | |
| Analysis 9.18  Comparison 9 Traditional suburethral sling operation versus mid‐urethral sling or tape, Outcome 18 Urethral injury. | ||||
| 18.1 urodynamic stress incontinence (only) | 0 | Risk Ratio (M‐H, Fixed, 95% CI) | 0.0 [0.0, 0.0] | |
| 18.2 stress urinary incontinence (symptoms only) | 0 | Risk Ratio (M‐H, Fixed, 95% CI) | 0.0 [0.0, 0.0] | |
| 18.3 mixed urinary incontinence | 1 | Risk Ratio (M‐H, Fixed, 95% CI) | 0.0 [0.0, 0.0] | |
| 19 Vaginal bleeding Show forest plot | 1 | Risk Ratio (M‐H, Fixed, 95% CI) | Totals not selected | |
| Analysis 9.19  Comparison 9 Traditional suburethral sling operation versus mid‐urethral sling or tape, Outcome 19 Vaginal bleeding. | ||||
| 19.1 urodynamic stress incontinence (only) | 0 | Risk Ratio (M‐H, Fixed, 95% CI) | 0.0 [0.0, 0.0] | |
| 19.2 stress urinary incontinence (symptoms only) | 0 | Risk Ratio (M‐H, Fixed, 95% CI) | 0.0 [0.0, 0.0] | |
| 19.3 mixed urinary incontinence | 1 | Risk Ratio (M‐H, Fixed, 95% CI) | 0.0 [0.0, 0.0] | |
| 20 Urinary tract infection Show forest plot | 1 | Risk Ratio (M‐H, Fixed, 95% CI) | Totals not selected | |
| Analysis 9.20  Comparison 9 Traditional suburethral sling operation versus mid‐urethral sling or tape, Outcome 20 Urinary tract infection. | ||||
| 20.1 urodynamic stress incontinence (only) | 0 | Risk Ratio (M‐H, Fixed, 95% CI) | 0.0 [0.0, 0.0] | |
| 20.2 stress urinary incontinence (symptoms only) | 0 | Risk Ratio (M‐H, Fixed, 95% CI) | 0.0 [0.0, 0.0] | |
| 20.3 mixed urinary incontinence | 1 | Risk Ratio (M‐H, Fixed, 95% CI) | 0.0 [0.0, 0.0] | |
| 21 Voiding dysfunction Show forest plot | 8 | 629 | Risk Ratio (M‐H, Fixed, 95% CI) | 1.34 [0.85, 2.12] |
| Analysis 9.21  Comparison 9 Traditional suburethral sling operation versus mid‐urethral sling or tape, Outcome 21 Voiding dysfunction. | ||||
| 21.1 urodynamic stress incontinence (only) | 3 | 325 | Risk Ratio (M‐H, Fixed, 95% CI) | 1.22 [0.60, 2.46] |
| 21.2 stress urinary incontinence (symptoms only) | 1 | 53 | Risk Ratio (M‐H, Fixed, 95% CI) | 2.61 [0.76, 9.03] |
| 21.3 mixed urinary incontinence | 4 | 251 | Risk Ratio (M‐H, Fixed, 95% CI) | 1.18 [0.58, 2.40] |
| 22 Urinary urgency symptoms, urgency urinary incontinence Show forest plot | 4 | 295 | Risk Ratio (M‐H, Fixed, 95% CI) | 1.50 [0.58, 3.88] |
| Analysis 9.22  Comparison 9 Traditional suburethral sling operation versus mid‐urethral sling or tape, Outcome 22 Urinary urgency symptoms, urgency urinary incontinence. | ||||
| 22.1 urodynamic stress incontinence (only) | 1 | 124 | Risk Ratio (M‐H, Fixed, 95% CI) | 0.34 [0.01, 8.29] |
| 22.2 stress urinary incontinence (symptoms only) | 0 | 0 | Risk Ratio (M‐H, Fixed, 95% CI) | 0.0 [0.0, 0.0] |
| 22.3 mixed urinary incontinence | 3 | 171 | Risk Ratio (M‐H, Fixed, 95% CI) | 1.81 [0.65, 5.06] |
| 23 De novo detrusor overactivity (urodynamic diagnosis) Show forest plot | 4 | 325 | Risk Ratio (M‐H, Fixed, 95% CI) | 2.61 [1.17, 5.84] |
| Analysis 9.23  Comparison 9 Traditional suburethral sling operation versus mid‐urethral sling or tape, Outcome 23 De novo detrusor overactivity (urodynamic diagnosis). | ||||
| 23.1 urodynamic stress incontinence (only) | 1 | 59 | Risk Ratio (M‐H, Fixed, 95% CI) | 0.0 [0.0, 0.0] |
| 23.2 stress urinary incontinence (symptoms only) | 1 | 47 | Risk Ratio (M‐H, Fixed, 95% CI) | 3.13 [0.13, 73.01] |
| 23.3 mixed urinary incontinence | 2 | 219 | Risk Ratio (M‐H, Fixed, 95% CI) | 2.57 [1.12, 5.92] |
| 24 Long‐term adverse effects (release of sling required) Show forest plot | 3 | 326 | Risk Ratio (M‐H, Fixed, 95% CI) | 2.53 [0.87, 7.35] |
| Analysis 9.24  Comparison 9 Traditional suburethral sling operation versus mid‐urethral sling or tape, Outcome 24 Long‐term adverse effects (release of sling required). | ||||
| 24.1 urodynamic stress incontinence (only) | 2 | 266 | Risk Ratio (M‐H, Fixed, 95% CI) | 1.68 [0.50, 5.66] |
| 24.2 stress urinary incontinence (symptoms only) | 0 | 0 | Risk Ratio (M‐H, Fixed, 95% CI) | 0.0 [0.0, 0.0] |
| 24.3 mixed urinary incontinence | 1 | 60 | Risk Ratio (M‐H, Fixed, 95% CI) | 9.6 [0.54, 170.84] |
| 25 Long‐term adverse effects (wound pain at 6 months) Show forest plot | 3 | 257 | Risk Ratio (M‐H, Fixed, 95% CI) | 6.40 [1.94, 21.12] |
| Analysis 9.25  Comparison 9 Traditional suburethral sling operation versus mid‐urethral sling or tape, Outcome 25 Long‐term adverse effects (wound pain at 6 months). | ||||
| 25.1 urodynamic stress incontinence (only) | 1 | 124 | Risk Ratio (M‐H, Fixed, 95% CI) | 5.16 [0.25, 105.36] |
| 25.2 stress urinary incontinence (symptoms only) | 1 | 53 | Risk Ratio (M‐H, Fixed, 95% CI) | 3.92 [0.90, 17.15] |
| 25.3 mixed urinary incontinence | 1 | 80 | Risk Ratio (M‐H, Fixed, 95% CI) | 17.0 [1.01, 284.96] |
| 26 Long‐term adverse effects (vaginal mesh or graft exposure) Show forest plot | 5 | 348 | Risk Ratio (M‐H, Fixed, 95% CI) | 0.28 [0.05, 1.65] |
| Analysis 9.26  Comparison 9 Traditional suburethral sling operation versus mid‐urethral sling or tape, Outcome 26 Long‐term adverse effects (vaginal mesh or graft exposure). | ||||
| 26.1 urodynamic stress incontinence (only) | 2 | 165 | Risk Ratio (M‐H, Fixed, 95% CI) | 0.35 [0.04, 3.24] |
| 26.2 stress urinary incontinence (symptoms only) | 1 | 53 | Risk Ratio (M‐H, Fixed, 95% CI) | 0.0 [0.0, 0.0] |
| 26.3 mixed urinary incontinence | 2 | 130 | Risk Ratio (M‐H, Fixed, 95% CI) | 0.2 [0.01, 3.97] |
| 27 Condition‐specific measures to assess quality of life: UDI‐6 Show forest plot | 1 | 63 | Mean Difference (IV, Fixed, 95% CI) | 7.30 [‐2.00, 16.60] |
| Analysis 9.27  Comparison 9 Traditional suburethral sling operation versus mid‐urethral sling or tape, Outcome 27 Condition‐specific measures to assess quality of life: UDI‐6. | ||||
| 27.1 urodynamic stress incontinence (only) | 0 | 0 | Mean Difference (IV, Fixed, 95% CI) | 0.0 [0.0, 0.0] |
| 27.2 stress urinary incontinence (symptoms only) | 1 | 63 | Mean Difference (IV, Fixed, 95% CI) | 7.30 [‐2.00, 16.60] |
| 27.3 mixed urinary incontinence | 0 | 0 | Mean Difference (IV, Fixed, 95% CI) | 0.0 [0.0, 0.0] |
| 28 Condition‐specific measures to assess quality of life: IIQ‐7 Show forest plot | 1 | 63 | Mean Difference (IV, Fixed, 95% CI) | 0.60 [‐10.17, 11.37] |
| Analysis 9.28  Comparison 9 Traditional suburethral sling operation versus mid‐urethral sling or tape, Outcome 28 Condition‐specific measures to assess quality of life: IIQ‐7. | ||||
| 28.1 urodynamic stress incontinence (only) | 0 | 0 | Mean Difference (IV, Fixed, 95% CI) | 0.0 [0.0, 0.0] |
| 28.2 stress urinary incontinence (symptoms only) | 1 | 63 | Mean Difference (IV, Fixed, 95% CI) | 0.60 [‐10.17, 11.37] |
| 28.3 mixed urinary incontinence | 0 | 0 | Mean Difference (IV, Fixed, 95% CI) | 0.0 [0.0, 0.0] |
| Outcome or subgroup title | No. of studies | No. of participants | Statistical method | Effect size |
| 1 Number of continent women at 1 to 5 years (any definition) Show forest plot | 1 | Odds Ratio (M‐H, Fixed, 95% CI) | Totals not selected | |
| Analysis 10.1  Comparison 10 Traditional suburethral sling operation versus a single‐incision sling (mini‐sling), Outcome 1 Number of continent women at 1 to 5 years (any definition). | ||||
| 1.1 urodynamic stress incontinence (only) | 1 | Odds Ratio (M‐H, Fixed, 95% CI) | 0.0 [0.0, 0.0] | |
| 1.2 stress urinary incontinence (symptoms only) | 0 | Odds Ratio (M‐H, Fixed, 95% CI) | 0.0 [0.0, 0.0] | |
| 1.3 mixed incontinence | 0 | Odds Ratio (M‐H, Fixed, 95% CI) | 0.0 [0.0, 0.0] | |
| 2 Number of women cured after first year (women's observations) Show forest plot | 1 | Odds Ratio (M‐H, Fixed, 95% CI) | Totals not selected | |
| Analysis 10.2  Comparison 10 Traditional suburethral sling operation versus a single‐incision sling (mini‐sling), Outcome 2 Number of women cured after first year (women's observations). | ||||
| 2.1 urodynamic stress incontinence (only) | 1 | Odds Ratio (M‐H, Fixed, 95% CI) | 0.0 [0.0, 0.0] | |
| 2.2 stress urinary incontinence (symptoms only) | 0 | Odds Ratio (M‐H, Fixed, 95% CI) | 0.0 [0.0, 0.0] | |
| 2.3 mixed incontinence | 0 | Odds Ratio (M‐H, Fixed, 95% CI) | 0.0 [0.0, 0.0] | |
| 3 Number of women satisfied (women's observations) Show forest plot | 1 | Risk Ratio (M‐H, Fixed, 95% CI) | Totals not selected | |
| Analysis 10.3  Comparison 10 Traditional suburethral sling operation versus a single‐incision sling (mini‐sling), Outcome 3 Number of women satisfied (women's observations). | ||||
| 3.1 urodynamic stress incontinence (only) | 1 | Risk Ratio (M‐H, Fixed, 95% CI) | 0.0 [0.0, 0.0] | |
| 3.2 stress urinary incontinence (symptoms only) | 0 | Risk Ratio (M‐H, Fixed, 95% CI) | 0.0 [0.0, 0.0] | |
| 3.3 mixed incontinence | 0 | Risk Ratio (M‐H, Fixed, 95% CI) | 0.0 [0.0, 0.0] | |
| 4 Number of women with urinary incontinence (clinician's observations) within first year Show forest plot | 1 | Risk Ratio (M‐H, Fixed, 95% CI) | Totals not selected | |
| Analysis 10.4  Comparison 10 Traditional suburethral sling operation versus a single‐incision sling (mini‐sling), Outcome 4 Number of women with urinary incontinence (clinician's observations) within first year. | ||||
| 4.1 urodynamic stress incontinence (only) | 1 | Risk Ratio (M‐H, Fixed, 95% CI) | 0.0 [0.0, 0.0] | |
| 4.2 stress urinary incontinence (symptoms only) | 0 | Risk Ratio (M‐H, Fixed, 95% CI) | 0.0 [0.0, 0.0] | |
| 4.3 mixed incontinence | 0 | Risk Ratio (M‐H, Fixed, 95% CI) | 0.0 [0.0, 0.0] | |
| 5 Bladder perforation Show forest plot | 1 | Risk Ratio (M‐H, Fixed, 95% CI) | Totals not selected | |
| Analysis 10.5  Comparison 10 Traditional suburethral sling operation versus a single‐incision sling (mini‐sling), Outcome 5 Bladder perforation. | ||||
| 5.1 urodynamic stress incontinence (only) | 1 | Risk Ratio (M‐H, Fixed, 95% CI) | 0.0 [0.0, 0.0] | |
| 5.2 stress urinary incontinence (symptoms only) | 0 | Risk Ratio (M‐H, Fixed, 95% CI) | 0.0 [0.0, 0.0] | |
| 5.3 mixed incontinence | 0 | Risk Ratio (M‐H, Fixed, 95% CI) | 0.0 [0.0, 0.0] | |
| 6 Urinary urgency symptoms, urgency urinary incontinence Show forest plot | 1 | Risk Ratio (M‐H, Fixed, 95% CI) | Totals not selected | |
| Analysis 10.6  Comparison 10 Traditional suburethral sling operation versus a single‐incision sling (mini‐sling), Outcome 6 Urinary urgency symptoms, urgency urinary incontinence. | ||||
| 6.1 urodynamic stress incontinence (only) | 1 | Risk Ratio (M‐H, Fixed, 95% CI) | 0.0 [0.0, 0.0] | |
| 6.2 stress urinary incontinence (symptoms only) | 0 | Risk Ratio (M‐H, Fixed, 95% CI) | 0.0 [0.0, 0.0] | |
| 6.3 mixed incontinence | 0 | Risk Ratio (M‐H, Fixed, 95% CI) | 0.0 [0.0, 0.0] | |
| 7 Pain with intercourse (dyspareunia) Show forest plot | 1 | Risk Ratio (M‐H, Fixed, 95% CI) | Totals not selected | |
| Analysis 10.7  Comparison 10 Traditional suburethral sling operation versus a single‐incision sling (mini‐sling), Outcome 7 Pain with intercourse (dyspareunia). | ||||
| 7.1 urodynamic stress incontinence (only) | 1 | Risk Ratio (M‐H, Fixed, 95% CI) | 0.0 [0.0, 0.0] | |
| 7.2 stress urinary incontinence (symptoms only) | 0 | Risk Ratio (M‐H, Fixed, 95% CI) | 0.0 [0.0, 0.0] | |
| 7.3 mixed incontinence | 0 | Risk Ratio (M‐H, Fixed, 95% CI) | 0.0 [0.0, 0.0] | |
| 8 Long‐term adverse effects (vaginal mesh or graft exposure) Show forest plot | 1 | Risk Ratio (M‐H, Fixed, 95% CI) | Totals not selected | |
| Analysis 10.8  Comparison 10 Traditional suburethral sling operation versus a single‐incision sling (mini‐sling), Outcome 8 Long‐term adverse effects (vaginal mesh or graft exposure). | ||||
| 8.1 urodynamic stress incontinence (only) | 1 | Risk Ratio (M‐H, Fixed, 95% CI) | 0.0 [0.0, 0.0] | |
| 8.2 stress urinary incontinence (symptoms only) | 0 | Risk Ratio (M‐H, Fixed, 95% CI) | 0.0 [0.0, 0.0] | |
| 8.3 mixed incontinence | 0 | Risk Ratio (M‐H, Fixed, 95% CI) | 0.0 [0.0, 0.0] | |
| 9 Condition‐specific measures to assess quality of life: IIQ score Show forest plot | 1 | Mean Difference (IV, Fixed, 95% CI) | Totals not selected | |
| Analysis 10.9  Comparison 10 Traditional suburethral sling operation versus a single‐incision sling (mini‐sling), Outcome 9 Condition‐specific measures to assess quality of life: IIQ score. | ||||
| 9.1 urodynamic stress incontinence (only) | 1 | Mean Difference (IV, Fixed, 95% CI) | 0.0 [0.0, 0.0] | |
| 9.2 stress urinary incontinence (symptoms only) | 0 | Mean Difference (IV, Fixed, 95% CI) | 0.0 [0.0, 0.0] | |
| 9.3 mixed urinary incontinence | 0 | Mean Difference (IV, Fixed, 95% CI) | 0.0 [0.0, 0.0] | |
| Outcome or subgroup title | No. of studies | No. of participants | Statistical method | Effect size |
| 1 Number of continent women within 1 year (any definition) Show forest plot | 5 | Odds Ratio (M‐H, Fixed, 95% CI) | Totals not selected | |
| Analysis 11.1  Comparison 11 One type of traditional sling operation versus another type of traditional sling operation, Outcome 1 Number of continent women within 1 year (any definition). | ||||
| 1.1 fascial sling vs Pelvicol sling | 1 | Odds Ratio (M‐H, Fixed, 95% CI) | 0.0 [0.0, 0.0] | |
| 1.2 standard sling vs short sling | 1 | Odds Ratio (M‐H, Fixed, 95% CI) | 0.0 [0.0, 0.0] | |
| 1.3 autologous fascial sling vs Fortaperm sling | 1 | Odds Ratio (M‐H, Fixed, 95% CI) | 0.0 [0.0, 0.0] | |
| 1.4 Vypro vs Ultrapro | 1 | Odds Ratio (M‐H, Fixed, 95% CI) | 0.0 [0.0, 0.0] | |
| 1.5 Vypro vs Prolene light | 1 | Odds Ratio (M‐H, Fixed, 95% CI) | 0.0 [0.0, 0.0] | |
| 1.6 Ultrapro vs Prolene light | 1 | Odds Ratio (M‐H, Fixed, 95% CI) | 0.0 [0.0, 0.0] | |
| 1.7 fascial sling vs vaginal wall sling | 1 | Odds Ratio (M‐H, Fixed, 95% CI) | 0.0 [0.0, 0.0] | |
| 2 Number of continent women at 1 to 5 years (any definition) Show forest plot | 7 | Odds Ratio (M‐H, Fixed, 95% CI) | Totals not selected | |
| Analysis 11.2  Comparison 11 One type of traditional sling operation versus another type of traditional sling operation, Outcome 2 Number of continent women at 1 to 5 years (any definition). | ||||
| 2.1 fascial sling vs Pelvicol sling | 1 | Odds Ratio (M‐H, Fixed, 95% CI) | 0.0 [0.0, 0.0] | |
| 2.2 standard sling vs short sling | 1 | Odds Ratio (M‐H, Fixed, 95% CI) | 0.0 [0.0, 0.0] | |
| 2.3 autologous dermal graft patch vs cadaveric fascia lata | 1 | Odds Ratio (M‐H, Fixed, 95% CI) | 0.0 [0.0, 0.0] | |
| 2.4 rectus fascia sling vs Goretex sling | 1 | Odds Ratio (M‐H, Fixed, 95% CI) | 0.0 [0.0, 0.0] | |
| 2.5 Vypro vs Ultrapro | 1 | Odds Ratio (M‐H, Fixed, 95% CI) | 0.0 [0.0, 0.0] | |
| 2.6 Vypro vs Prolene light | 1 | Odds Ratio (M‐H, Fixed, 95% CI) | 0.0 [0.0, 0.0] | |
| 2.7 Ultrapro vs Prolene light | 1 | Odds Ratio (M‐H, Fixed, 95% CI) | 0.0 [0.0, 0.0] | |
| 2.8 anterior vaginal wall sling vs biosynthetic mesh sling | 1 | Odds Ratio (M‐H, Fixed, 95% CI) | 0.0 [0.0, 0.0] | |
| 2.9 anterior rectus sheath sling vs Prolene strip | 1 | Odds Ratio (M‐H, Fixed, 95% CI) | 0.0 [0.0, 0.0] | |
| 2.10 anterior rectus sheath sling vs anterior vaginal wall patch | 1 | Odds Ratio (M‐H, Fixed, 95% CI) | 0.0 [0.0, 0.0] | |
| 2.11 Prolene strip vs anterior vaginal wall patch | 1 | Odds Ratio (M‐H, Fixed, 95% CI) | 0.0 [0.0, 0.0] | |
| 3 Number of continent women after 5 years (any definition) Show forest plot | 1 | Odds Ratio (M‐H, Fixed, 95% CI) | Totals not selected | |
| Analysis 11.3  Comparison 11 One type of traditional sling operation versus another type of traditional sling operation, Outcome 3 Number of continent women after 5 years (any definition). | ||||
| 3.1 standard sling vs short sling | 1 | Odds Ratio (M‐H, Fixed, 95% CI) | 0.0 [0.0, 0.0] | |
| 4 Repeat surgery for urinary incontinence Show forest plot | 1 | Risk Ratio (M‐H, Fixed, 95% CI) | Totals not selected | |
| Analysis 11.4  Comparison 11 One type of traditional sling operation versus another type of traditional sling operation, Outcome 4 Repeat surgery for urinary incontinence. | ||||
| 4.1 fascial sling vs Pelvicol sling | 1 | Risk Ratio (M‐H, Fixed, 95% CI) | 0.0 [0.0, 0.0] | |
| 5 Number of women cured after first year (women's observations) Show forest plot | 3 | Odds Ratio (M‐H, Fixed, 95% CI) | Totals not selected | |
| Analysis 11.5  Comparison 11 One type of traditional sling operation versus another type of traditional sling operation, Outcome 5 Number of women cured after first year (women's observations). | ||||
| 5.1 fascial sling vs Pelvicol sling | 1 | Odds Ratio (M‐H, Fixed, 95% CI) | 0.0 [0.0, 0.0] | |
| 5.2 standard sling vs short sling | 1 | Odds Ratio (M‐H, Fixed, 95% CI) | 0.0 [0.0, 0.0] | |
| 5.3 autologous dermal graft patch vs cadaveric fascia lata | 1 | Odds Ratio (M‐H, Fixed, 95% CI) | 0.0 [0.0, 0.0] | |
| 6 Number of women improved or cured within first year (women's observations) Show forest plot | 3 | Odds Ratio (M‐H, Fixed, 95% CI) | Totals not selected | |
| Analysis 11.6  Comparison 11 One type of traditional sling operation versus another type of traditional sling operation, Outcome 6 Number of women improved or cured within first year (women's observations). | ||||
| 6.1 fascial sling vs Pelvicol sling | 1 | Odds Ratio (M‐H, Fixed, 95% CI) | 0.0 [0.0, 0.0] | |
| 6.2 autologous fascial sling vs Fortaperm sling | 1 | Odds Ratio (M‐H, Fixed, 95% CI) | 0.0 [0.0, 0.0] | |
| 6.3 rectus fascia sling vs Goretex sling | 1 | Odds Ratio (M‐H, Fixed, 95% CI) | 0.0 [0.0, 0.0] | |
| 7 Number of women improved or cured at 1 to 5 years (women's observations) Show forest plot | 4 | Risk Ratio (M‐H, Fixed, 95% CI) | Totals not selected | |
| Analysis 11.7  Comparison 11 One type of traditional sling operation versus another type of traditional sling operation, Outcome 7 Number of women improved or cured at 1 to 5 years (women's observations). | ||||
| 7.1 fascial sling vs Pelvicol sling | 1 | Risk Ratio (M‐H, Fixed, 95% CI) | 0.0 [0.0, 0.0] | |
| 7.2 autologous dermal graft patch vs cadaveric fascia lata | 1 | Risk Ratio (M‐H, Fixed, 95% CI) | 0.0 [0.0, 0.0] | |
| 7.3 rectus fascia sling vs Goretex sling | 1 | Risk Ratio (M‐H, Fixed, 95% CI) | 0.0 [0.0, 0.0] | |
| 7.4 anterior rectus sheath sling vs Prolene strip | 1 | Risk Ratio (M‐H, Fixed, 95% CI) | 0.0 [0.0, 0.0] | |
| 7.5 anterior rectus sheath sling vs anterior vaginal wall patch | 1 | Risk Ratio (M‐H, Fixed, 95% CI) | 0.0 [0.0, 0.0] | |
| 7.6 Prolene strip vs anterior vaginal wall patch | 1 | Risk Ratio (M‐H, Fixed, 95% CI) | 0.0 [0.0, 0.0] | |
| 8 Number of women satisfied (women's observations) Show forest plot | 3 | Risk Ratio (M‐H, Fixed, 95% CI) | Totals not selected | |
| Analysis 11.8  Comparison 11 One type of traditional sling operation versus another type of traditional sling operation, Outcome 8 Number of women satisfied (women's observations). | ||||
| 8.1 fascial sling vs Pelvicol sling | 1 | Risk Ratio (M‐H, Fixed, 95% CI) | 0.0 [0.0, 0.0] | |
| 8.2 Vypro vs Ultrapro | 1 | Risk Ratio (M‐H, Fixed, 95% CI) | 0.0 [0.0, 0.0] | |
| 8.3 Vypro vs Prolene light | 1 | Risk Ratio (M‐H, Fixed, 95% CI) | 0.0 [0.0, 0.0] | |
| 8.4 Ultrapro vs Prolene light | 1 | Risk Ratio (M‐H, Fixed, 95% CI) | 0.0 [0.0, 0.0] | |
| 8.5 anterior vaginal wall sling vs biosynthetic mesh sling | 1 | Risk Ratio (M‐H, Fixed, 95% CI) | 0.0 [0.0, 0.0] | |
| 9 Pad test of quantified leakage (mean weight of urine lost) within 1 year Show forest plot | 2 | Mean Difference (IV, Fixed, 95% CI) | Totals not selected | |
| Analysis 11.9  Comparison 11 One type of traditional sling operation versus another type of traditional sling operation, Outcome 9 Pad test of quantified leakage (mean weight of urine lost) within 1 year. | ||||
| 9.1 standard sling vs short sling | 1 | Mean Difference (IV, Fixed, 95% CI) | 0.0 [0.0, 0.0] | |
| 9.2 Vypro vs Ultrapro | 1 | Mean Difference (IV, Fixed, 95% CI) | 0.0 [0.0, 0.0] | |
| 9.3 Vypro vs Prolene light | 1 | Mean Difference (IV, Fixed, 95% CI) | 0.0 [0.0, 0.0] | |
| 9.4 Ultrapro vs Prolene light | 1 | Mean Difference (IV, Fixed, 95% CI) | 0.0 [0.0, 0.0] | |
| 10 Pad test of quantified leakage (mean weight of urine lost) at 1 to 5 years Show forest plot | 1 | Mean Difference (IV, Fixed, 95% CI) | Totals not selected | |
| Analysis 11.10  Comparison 11 One type of traditional sling operation versus another type of traditional sling operation, Outcome 10 Pad test of quantified leakage (mean weight of urine lost) at 1 to 5 years. | ||||
| 10.1 Vypro vs Ultrapro | 1 | Mean Difference (IV, Fixed, 95% CI) | 0.0 [0.0, 0.0] | |
| 10.2 Vypro vs Prolene light | 1 | Mean Difference (IV, Fixed, 95% CI) | 0.0 [0.0, 0.0] | |
| 10.3 Ultrapro vs Prolene light | 1 | Mean Difference (IV, Fixed, 95% CI) | 0.0 [0.0, 0.0] | |
| 11 Duration of operation (minutes) Show forest plot | 2 | Mean Difference (IV, Fixed, 95% CI) | Totals not selected | |
| Analysis 11.11  Comparison 11 One type of traditional sling operation versus another type of traditional sling operation, Outcome 11 Duration of operation (minutes). | ||||
| 11.1 standard sling vs short sling | 1 | Mean Difference (IV, Fixed, 95% CI) | 0.0 [0.0, 0.0] | |
| 11.2 anterior rectus sheath sling vs Prolene strip | 1 | Mean Difference (IV, Fixed, 95% CI) | 0.0 [0.0, 0.0] | |
| 11.3 anterior rectus sheath sling vs anterior vaginal wall patch | 1 | Mean Difference (IV, Fixed, 95% CI) | 0.0 [0.0, 0.0] | |
| 11.4 Prolene strip vs anterior vaginal wall patch | 1 | Mean Difference (IV, Fixed, 95% CI) | 0.0 [0.0, 0.0] | |
| 12 Blood loss (mL) Show forest plot | 1 | Mean Difference (IV, Fixed, 95% CI) | Totals not selected | |
| Analysis 11.12  Comparison 11 One type of traditional sling operation versus another type of traditional sling operation, Outcome 12 Blood loss (mL). | ||||
| 12.1 anterior rectus sheath sling vs Prolene strip | 1 | Mean Difference (IV, Fixed, 95% CI) | 0.0 [0.0, 0.0] | |
| 12.2 anterior rectus sheath sling vs anterior vaginal wall patch | 1 | Mean Difference (IV, Fixed, 95% CI) | 0.0 [0.0, 0.0] | |
| 12.3 Prolene strip vs anterior vaginal wall patch | 1 | Mean Difference (IV, Fixed, 95% CI) | 0.0 [0.0, 0.0] | |
| 13 Length of hospital stay (days) Show forest plot | 1 | Mean Difference (IV, Fixed, 95% CI) | Totals not selected | |
| Analysis 11.13  Comparison 11 One type of traditional sling operation versus another type of traditional sling operation, Outcome 13 Length of hospital stay (days). | ||||
| 13.1 anterior rectus sheath sling vs Prolene strip | 1 | Mean Difference (IV, Fixed, 95% CI) | 0.0 [0.0, 0.0] | |
| 13.2 anterior rectus sheath sling vs anterior vaginal wall patch | 1 | Mean Difference (IV, Fixed, 95% CI) | 0.0 [0.0, 0.0] | |
| 13.3 Prolene strip vs anterior vaginal wall patch | 1 | Mean Difference (IV, Fixed, 95% CI) | 0.0 [0.0, 0.0] | |
| 14 Perioperative surgical complications Show forest plot | 3 | Risk Ratio (M‐H, Fixed, 95% CI) | Totals not selected | |
| Analysis 11.14  Comparison 11 One type of traditional sling operation versus another type of traditional sling operation, Outcome 14 Perioperative surgical complications. | ||||
| 14.1 standard sling vs short sling | 1 | Risk Ratio (M‐H, Fixed, 95% CI) | 0.0 [0.0, 0.0] | |
| 14.2 rectus fascia sling vs Goretex sling | 1 | Risk Ratio (M‐H, Fixed, 95% CI) | 0.0 [0.0, 0.0] | |
| 14.3 fascial sling vs vaginal wall sling | 1 | Risk Ratio (M‐H, Fixed, 95% CI) | 0.0 [0.0, 0.0] | |
| 15 Bladder perforation Show forest plot | 3 | Risk Ratio (M‐H, Fixed, 95% CI) | Totals not selected | |
| Analysis 11.15  Comparison 11 One type of traditional sling operation versus another type of traditional sling operation, Outcome 15 Bladder perforation. | ||||
| 15.1 standard sling vs short sling | 1 | Risk Ratio (M‐H, Fixed, 95% CI) | 0.0 [0.0, 0.0] | |
| 15.2 fascial sling vs Pelvicol sling | 1 | Risk Ratio (M‐H, Fixed, 95% CI) | 0.0 [0.0, 0.0] | |
| 15.3 anterior rectus sheath sling vs Prolene strip | 1 | Risk Ratio (M‐H, Fixed, 95% CI) | 0.0 [0.0, 0.0] | |
| 15.4 anterior rectus sheath sling vs anterior vaginal wall patch | 1 | Risk Ratio (M‐H, Fixed, 95% CI) | 0.0 [0.0, 0.0] | |
| 15.5 Prolene strip vs anterior vaginal wall patch | 1 | Risk Ratio (M‐H, Fixed, 95% CI) | 0.0 [0.0, 0.0] | |
| 16 Urinary tract infection Show forest plot | 2 | Risk Ratio (M‐H, Fixed, 95% CI) | Totals not selected | |
| Analysis 11.16  Comparison 11 One type of traditional sling operation versus another type of traditional sling operation, Outcome 16 Urinary tract infection. | ||||
| 16.1 standard sling vs short sling | 1 | Risk Ratio (M‐H, Fixed, 95% CI) | 0.0 [0.0, 0.0] | |
| 16.2 anterior vaginal wall sling vs biosynthetic mesh sling | 1 | Risk Ratio (M‐H, Fixed, 95% CI) | 0.0 [0.0, 0.0] | |
| 17 Vaginal bleeding Show forest plot | 1 | Risk Ratio (M‐H, Fixed, 95% CI) | Totals not selected | |
| Analysis 11.17  Comparison 11 One type of traditional sling operation versus another type of traditional sling operation, Outcome 17 Vaginal bleeding. | ||||
| 17.1 anterior vaginal wall sling vs biosynthetic mesh sling | 1 | Risk Ratio (M‐H, Fixed, 95% CI) | 0.0 [0.0, 0.0] | |
| 18 Long‐term adverse effects (wound pain) Show forest plot | 1 | Risk Ratio (M‐H, Fixed, 95% CI) | Totals not selected | |
| Analysis 11.18  Comparison 11 One type of traditional sling operation versus another type of traditional sling operation, Outcome 18 Long‐term adverse effects (wound pain). | ||||
| 18.1 fascial sling vs Pelvicol sling | 1 | Risk Ratio (M‐H, Fixed, 95% CI) | 0.0 [0.0, 0.0] | |
| 19 Voiding dysfunction Show forest plot | 6 | Risk Ratio (M‐H, Fixed, 95% CI) | Totals not selected | |
| Analysis 11.19  Comparison 11 One type of traditional sling operation versus another type of traditional sling operation, Outcome 19 Voiding dysfunction. | ||||
| 19.1 fascial sling vs Pelvicol sling | 1 | Risk Ratio (M‐H, Fixed, 95% CI) | 0.0 [0.0, 0.0] | |
| 19.2 standard sling vs short sling | 1 | Risk Ratio (M‐H, Fixed, 95% CI) | 0.0 [0.0, 0.0] | |
| 19.3 Vypro vs Ultrapro | 1 | Risk Ratio (M‐H, Fixed, 95% CI) | 0.0 [0.0, 0.0] | |
| 19.4 Vypro vs Prolene light | 1 | Risk Ratio (M‐H, Fixed, 95% CI) | 0.0 [0.0, 0.0] | |
| 19.5 Ultrapro vs Prolene light | 1 | Risk Ratio (M‐H, Fixed, 95% CI) | 0.0 [0.0, 0.0] | |
| 19.6 anterior vaginal wall sling vs biosynthetic mesh sling | 1 | Risk Ratio (M‐H, Fixed, 95% CI) | 0.0 [0.0, 0.0] | |
| 19.7 anterior rectus sheath sling vs Prolene strip | 1 | Risk Ratio (M‐H, Fixed, 95% CI) | 0.0 [0.0, 0.0] | |
| 19.8 anterior rectus sheath sling vs anterior vaginal wall patch | 1 | Risk Ratio (M‐H, Fixed, 95% CI) | 0.0 [0.0, 0.0] | |
| 19.9 Prolene strip vs anterior vaginal wall patch | 1 | Risk Ratio (M‐H, Fixed, 95% CI) | 0.0 [0.0, 0.0] | |
| 19.10 fascial sling vs vaginal wall sling | 1 | Risk Ratio (M‐H, Fixed, 95% CI) | 0.0 [0.0, 0.0] | |
| 20 Urinary urgency symptoms, urgency urinary incontinence Show forest plot | 3 | Risk Ratio (M‐H, Fixed, 95% CI) | Totals not selected | |
| Analysis 11.20  Comparison 11 One type of traditional sling operation versus another type of traditional sling operation, Outcome 20 Urinary urgency symptoms, urgency urinary incontinence. | ||||
| 20.1 standard sling vs short sling | 1 | Risk Ratio (M‐H, Fixed, 95% CI) | 0.0 [0.0, 0.0] | |
| 20.2 Vypro vs Ultrapro | 1 | Risk Ratio (M‐H, Fixed, 95% CI) | 0.0 [0.0, 0.0] | |
| 20.3 Vypro vs Prolene light | 1 | Risk Ratio (M‐H, Fixed, 95% CI) | 0.0 [0.0, 0.0] | |
| 20.4 Ultrapro vs Prolene light | 1 | Risk Ratio (M‐H, Fixed, 95% CI) | 0.0 [0.0, 0.0] | |
| 20.5 rectus fascia sling vs Goretex sling | 1 | Risk Ratio (M‐H, Fixed, 95% CI) | 0.0 [0.0, 0.0] | |
| 21 Detrusor overactivity (urodynamic overactivity) Show forest plot | 1 | Risk Ratio (M‐H, Fixed, 95% CI) | Totals not selected | |
| Analysis 11.21  Comparison 11 One type of traditional sling operation versus another type of traditional sling operation, Outcome 21 Detrusor overactivity (urodynamic overactivity). | ||||
| 21.1 autologous dermal graft patch vs cadaveric fascia lata | 1 | Risk Ratio (M‐H, Fixed, 95% CI) | 0.0 [0.0, 0.0] | |
| 22 Long‐term adverse effects (release of sling required) Show forest plot | 1 | Risk Ratio (M‐H, Fixed, 95% CI) | Totals not selected | |
| Analysis 11.22  Comparison 11 One type of traditional sling operation versus another type of traditional sling operation, Outcome 22 Long‐term adverse effects (release of sling required). | ||||
| 22.1 fascial sling vs Pelvicol sling | 1 | Risk Ratio (M‐H, Fixed, 95% CI) | 0.0 [0.0, 0.0] | |
| 23 Long‐term adverse effects (vaginal mesh or graft exposure) Show forest plot | 3 | Risk Ratio (M‐H, Fixed, 95% CI) | Totals not selected | |
| Analysis 11.23  Comparison 11 One type of traditional sling operation versus another type of traditional sling operation, Outcome 23 Long‐term adverse effects (vaginal mesh or graft exposure). | ||||
| 23.1 fascial sling vs Pelvicol sling | 1 | Risk Ratio (M‐H, Fixed, 95% CI) | 0.0 [0.0, 0.0] | |
| 23.2 Vypro vs Ultrapro | 1 | Risk Ratio (M‐H, Fixed, 95% CI) | 0.0 [0.0, 0.0] | |
| 23.3 Vypro vs Prolene light | 1 | Risk Ratio (M‐H, Fixed, 95% CI) | 0.0 [0.0, 0.0] | |
| 23.4 Ultrapro vs Prolene light | 1 | Risk Ratio (M‐H, Fixed, 95% CI) | 0.0 [0.0, 0.0] | |
| 23.5 anterior vaginal wall sling vs biosynthetic mesh sling | 1 | Risk Ratio (M‐H, Fixed, 95% CI) | 0.0 [0.0, 0.0] | |
| 24 Condition‐specific measures to assess quality of life (ICI‐Q short form UI score at 1 year) Show forest plot | 1 | Mean Difference (IV, Fixed, 95% CI) | Totals not selected | |
| Analysis 11.24  Comparison 11 One type of traditional sling operation versus another type of traditional sling operation, Outcome 24 Condition‐specific measures to assess quality of life (ICI‐Q short form UI score at 1 year). | ||||
| 24.1 Vypro vs Ultrapro | 1 | Mean Difference (IV, Fixed, 95% CI) | 0.0 [0.0, 0.0] | |
| 24.2 Vypro vs Prolene light | 1 | Mean Difference (IV, Fixed, 95% CI) | 0.0 [0.0, 0.0] | |
| 24.3 Ultrapro vs Prolene light | 1 | Mean Difference (IV, Fixed, 95% CI) | 0.0 [0.0, 0.0] | |
| 25 Condition‐specific measures to assess quality of life (ICI‐Q short form UI score at 1 to 5 years) Show forest plot | 1 | Mean Difference (IV, Fixed, 95% CI) | Totals not selected | |
| Analysis 11.25  Comparison 11 One type of traditional sling operation versus another type of traditional sling operation, Outcome 25 Condition‐specific measures to assess quality of life (ICI‐Q short form UI score at 1 to 5 years). | ||||
| 25.1 Vypro vs Ultrapro | 1 | Mean Difference (IV, Fixed, 95% CI) | 0.0 [0.0, 0.0] | |
| 25.2 Vypro vs Prolene light | 1 | Mean Difference (IV, Fixed, 95% CI) | 0.0 [0.0, 0.0] | |
| 25.3 Ultrapro vs Prolene light | 1 | Mean Difference (IV, Fixed, 95% CI) | 0.0 [0.0, 0.0] | |
| Outcome or subgroup title | No. of studies | No. of participants | Statistical method | Effect size |
| 1 Number of women with urinary incontinence (worse, unchanged, or improved) within first year (women's observations) Show forest plot | 1 | Risk Ratio (M‐H, Fixed, 95% CI) | Totals not selected | |
| Analysis 12.1  Comparison 12 Traditional suburethral sling operation versus drugs, Outcome 1 Number of women with urinary incontinence (worse, unchanged, or improved) within first year (women's observations). | ||||
| 1.1 urodynamic stress incontinence (only) | 0 | Risk Ratio (M‐H, Fixed, 95% CI) | 0.0 [0.0, 0.0] | |
| 1.2 stress urinary incontinence (symptoms only) | 0 | Risk Ratio (M‐H, Fixed, 95% CI) | 0.0 [0.0, 0.0] | |
| 1.3 mixed incontinence | 1 | Risk Ratio (M‐H, Fixed, 95% CI) | 0.0 [0.0, 0.0] | |
| 2 Urge urinary symptoms, urgency urinary incontinence Show forest plot | 1 | Risk Ratio (M‐H, Fixed, 95% CI) | Totals not selected | |
| Analysis 12.2  Comparison 12 Traditional suburethral sling operation versus drugs, Outcome 2 Urge urinary symptoms, urgency urinary incontinence. | ||||
| 2.1 urodynamic stress incontinence (only) | 0 | Risk Ratio (M‐H, Fixed, 95% CI) | 0.0 [0.0, 0.0] | |
| 2.2 stress urinary incontinence (symptoms only) | 0 | Risk Ratio (M‐H, Fixed, 95% CI) | 0.0 [0.0, 0.0] | |
| 2.3 mixed incontinence | 1 | Risk Ratio (M‐H, Fixed, 95% CI) | 0.0 [0.0, 0.0] | |
| Outcome or subgroup title | No. of studies | No. of participants | Statistical method | Effect size |
| 1 Number of women with urinary incontinence (worse, unchanged, or improved) within first year (women's observations) Show forest plot | 1 | Risk Ratio (M‐H, Fixed, 95% CI) | Totals not selected | |
| Analysis 13.1  Comparison 13 Traditional suburethral sling operation versus injectables, Outcome 1 Number of women with urinary incontinence (worse, unchanged, or improved) within first year (women's observations). | ||||
| 1.1 urodynamic stress incontinence (only) | 1 | Risk Ratio (M‐H, Fixed, 95% CI) | 0.0 [0.0, 0.0] | |
| 1.2 stress urinary incontinence (symptoms only) | 0 | Risk Ratio (M‐H, Fixed, 95% CI) | 0.0 [0.0, 0.0] | |
| 1.3 mixed urinary incontinence | 0 | Risk Ratio (M‐H, Fixed, 95% CI) | 0.0 [0.0, 0.0] | |
| 2 Number of women with urinary incontinence (worse, unchanged, or improved) after first year (women's observations) Show forest plot | 1 | Risk Ratio (M‐H, Fixed, 95% CI) | Totals not selected | |
| Analysis 13.2  Comparison 13 Traditional suburethral sling operation versus injectables, Outcome 2 Number of women with urinary incontinence (worse, unchanged, or improved) after first year (women's observations). | ||||
| 2.1 urodynamic stress incontinence (only) | 1 | Risk Ratio (M‐H, Fixed, 95% CI) | 0.0 [0.0, 0.0] | |
| 2.2 stress urinary incontinence (symptoms only) | 0 | Risk Ratio (M‐H, Fixed, 95% CI) | 0.0 [0.0, 0.0] | |
| 2.3 mixed urinary incontinence | 0 | Risk Ratio (M‐H, Fixed, 95% CI) | 0.0 [0.0, 0.0] | |
| 3 Number of women with urinary incontinence (clinician's observations) within first year Show forest plot | 1 | Risk Ratio (M‐H, Fixed, 95% CI) | Totals not selected | |
| Analysis 13.3  Comparison 13 Traditional suburethral sling operation versus injectables, Outcome 3 Number of women with urinary incontinence (clinician's observations) within first year. | ||||
| 3.1 urodynamic stress incontinence (only) | 1 | Risk Ratio (M‐H, Fixed, 95% CI) | 0.0 [0.0, 0.0] | |
| 3.2 stress urinary incontinence (symptoms only) | 0 | Risk Ratio (M‐H, Fixed, 95% CI) | 0.0 [0.0, 0.0] | |
| 3.3 mixed urinary incontinence | 0 | Risk Ratio (M‐H, Fixed, 95% CI) | 0.0 [0.0, 0.0] | |
| 4 CURE: number of women cured after first year (women's observations) Show forest plot | 1 | Odds Ratio (M‐H, Fixed, 95% CI) | Totals not selected | |
| Analysis 13.4  Comparison 13 Traditional suburethral sling operation versus injectables, Outcome 4 CURE: number of women cured after first year (women's observations). | ||||
| 4.1 urodynamic stress incontinence (only) | 1 | Odds Ratio (M‐H, Fixed, 95% CI) | 0.0 [0.0, 0.0] | |
| 4.2 stress urinary incontinence (symptoms only) | 0 | Odds Ratio (M‐H, Fixed, 95% CI) | 0.0 [0.0, 0.0] | |
| 4.3 mixed urinary incontinence | 0 | Odds Ratio (M‐H, Fixed, 95% CI) | 0.0 [0.0, 0.0] | |
| 5 Voiding dysfunction Show forest plot | 1 | Risk Ratio (M‐H, Fixed, 95% CI) | Totals not selected | |
| Analysis 13.5  Comparison 13 Traditional suburethral sling operation versus injectables, Outcome 5 Voiding dysfunction. | ||||
| 5.1 urodynamic stress incontinence (only) | 1 | Risk Ratio (M‐H, Fixed, 95% CI) | 0.0 [0.0, 0.0] | |
| 5.2 stress urinary incontinence (symptoms only) | 0 | Risk Ratio (M‐H, Fixed, 95% CI) | 0.0 [0.0, 0.0] | |
| 5.3 mixed urinary incontinence | 0 | Risk Ratio (M‐H, Fixed, 95% CI) | 0.0 [0.0, 0.0] | |
| 6 De novo detrusor overactivity (urodynamic diagnosis) Show forest plot | 1 | Risk Ratio (M‐H, Fixed, 95% CI) | Totals not selected | |
| Analysis 13.6  Comparison 13 Traditional suburethral sling operation versus injectables, Outcome 6 De novo detrusor overactivity (urodynamic diagnosis). | ||||
| 6.1 urodynamic stress incontinence (only) | 1 | Risk Ratio (M‐H, Fixed, 95% CI) | 0.0 [0.0, 0.0] | |
| 6.2 stress urinary incontinence (symptoms only) | 0 | Risk Ratio (M‐H, Fixed, 95% CI) | 0.0 [0.0, 0.0] | |
| 6.3 mixed urinary incontinence | 0 | Risk Ratio (M‐H, Fixed, 95% CI) | 0.0 [0.0, 0.0] | |
| 7 Urinary tract infection Show forest plot | 1 | Risk Ratio (M‐H, Fixed, 95% CI) | Totals not selected | |
| Analysis 13.7  Comparison 13 Traditional suburethral sling operation versus injectables, Outcome 7 Urinary tract infection. | ||||
| 7.1 urodynamic stress incontinence (only) | 1 | Risk Ratio (M‐H, Fixed, 95% CI) | 0.0 [0.0, 0.0] | |
| 7.2 stress urinary incontinence (symptoms only) | 0 | Risk Ratio (M‐H, Fixed, 95% CI) | 0.0 [0.0, 0.0] | |
| 7.3 mixed urinary incontinence | 0 | Risk Ratio (M‐H, Fixed, 95% CI) | 0.0 [0.0, 0.0] | |
| 8 Repeat surgery for urinary incontinence Show forest plot | 1 | Risk Ratio (M‐H, Fixed, 95% CI) | Totals not selected | |
| Analysis 13.8  Comparison 13 Traditional suburethral sling operation versus injectables, Outcome 8 Repeat surgery for urinary incontinence. | ||||
| 8.1 urodynamic stress incontinence (only) | 1 | Risk Ratio (M‐H, Fixed, 95% CI) | 0.0 [0.0, 0.0] | |
| 8.2 stress urinary incontinence (symptoms only) | 0 | Risk Ratio (M‐H, Fixed, 95% CI) | 0.0 [0.0, 0.0] | |
| 8.3 mixed urinary incontinence | 0 | Risk Ratio (M‐H, Fixed, 95% CI) | 0.0 [0.0, 0.0] | |
| Outcome or subgroup title | No. of studies | No. of participants | Statistical method | Effect size |
| 1 Number with incontinence (worse, unchanged, or improved) within first year (women's observations) Show forest plot | 1 | Risk Ratio (M‐H, Fixed, 95% CI) | Totals not selected | |
| Analysis 14.1  Comparison 14 Traditional suburethral sling operation versus bladder neck needle suspension (abdominal and vaginal), Outcome 1 Number with incontinence (worse, unchanged, or improved) within first year (women's observations). | ||||
| 1.1 urodynamic stress incontinence (only) | 1 | Risk Ratio (M‐H, Fixed, 95% CI) | 0.0 [0.0, 0.0] | |
| 1.2 stress urinary incontinence (symptoms only) | 0 | Risk Ratio (M‐H, Fixed, 95% CI) | 0.0 [0.0, 0.0] | |
| 1.3 mixed incontinence | 0 | Risk Ratio (M‐H, Fixed, 95% CI) | 0.0 [0.0, 0.0] | |
| 2 Number with incontinence (worse, unchanged, or improved) after first year (women's observations) Show forest plot | 1 | Risk Ratio (M‐H, Fixed, 95% CI) | Totals not selected | |
| Analysis 14.2  Comparison 14 Traditional suburethral sling operation versus bladder neck needle suspension (abdominal and vaginal), Outcome 2 Number with incontinence (worse, unchanged, or improved) after first year (women's observations). | ||||
| 2.1 urodynamic stress incontinence (only) | 1 | Risk Ratio (M‐H, Fixed, 95% CI) | 0.0 [0.0, 0.0] | |
| 2.2 stress urinary incontinence (symptoms only) | 0 | Risk Ratio (M‐H, Fixed, 95% CI) | 0.0 [0.0, 0.0] | |
| 2.3 mixed incontinence | 0 | Risk Ratio (M‐H, Fixed, 95% CI) | 0.0 [0.0, 0.0] | |
| 3 CURE: number of women cured after first year (women's observations) Show forest plot | 1 | Odds Ratio (M‐H, Fixed, 95% CI) | Totals not selected | |
| Analysis 14.3  Comparison 14 Traditional suburethral sling operation versus bladder neck needle suspension (abdominal and vaginal), Outcome 3 CURE: number of women cured after first year (women's observations). | ||||
| 3.1 urodynamic stress incontinence (only) | 1 | Odds Ratio (M‐H, Fixed, 95% CI) | 0.0 [0.0, 0.0] | |
| 3.2 stress urinary incontinence (symptoms only) | 0 | Odds Ratio (M‐H, Fixed, 95% CI) | 0.0 [0.0, 0.0] | |
| 3.3 mixed incontinence | 0 | Odds Ratio (M‐H, Fixed, 95% CI) | 0.0 [0.0, 0.0] | |
| 4 Length of hospital stay (hours) Show forest plot | 1 | Mean Difference (IV, Fixed, 95% CI) | Totals not selected | |
| Analysis 14.4  Comparison 14 Traditional suburethral sling operation versus bladder neck needle suspension (abdominal and vaginal), Outcome 4 Length of hospital stay (hours). | ||||
| 4.1 urodynamic stress incontinence (only) | 1 | Mean Difference (IV, Fixed, 95% CI) | 0.0 [0.0, 0.0] | |
| 4.2 stress urinary incontinence (symptoms only) | 0 | Mean Difference (IV, Fixed, 95% CI) | 0.0 [0.0, 0.0] | |
| 4.3 mixed incontinence | 0 | Mean Difference (IV, Fixed, 95% CI) | 0.0 [0.0, 0.0] | |
| 5 Perioperative surgical complications Show forest plot | 1 | Risk Ratio (M‐H, Fixed, 95% CI) | Totals not selected | |
| Analysis 14.5  Comparison 14 Traditional suburethral sling operation versus bladder neck needle suspension (abdominal and vaginal), Outcome 5 Perioperative surgical complications. | ||||
| 5.1 urodynamic stress incontinence (only) | 1 | Risk Ratio (M‐H, Fixed, 95% CI) | 0.0 [0.0, 0.0] | |
| 5.2 stress urinary incontinence (symptoms only) | 0 | Risk Ratio (M‐H, Fixed, 95% CI) | 0.0 [0.0, 0.0] | |
| 5.3 mixed incontinence | 0 | Risk Ratio (M‐H, Fixed, 95% CI) | 0.0 [0.0, 0.0] | |
| 6 Urge urinary symptoms, urgency urinary incontinence Show forest plot | 1 | Risk Ratio (M‐H, Fixed, 95% CI) | Totals not selected | |
| Analysis 14.6  Comparison 14 Traditional suburethral sling operation versus bladder neck needle suspension (abdominal and vaginal), Outcome 6 Urge urinary symptoms, urgency urinary incontinence. | ||||
| 6.1 urodynamic stress incontinence (only) | 1 | Risk Ratio (M‐H, Fixed, 95% CI) | 0.0 [0.0, 0.0] | |
| 6.2 stress urinary incontinence (symptoms only) | 0 | Risk Ratio (M‐H, Fixed, 95% CI) | 0.0 [0.0, 0.0] | |
| 6.3 mixed incontinence | 0 | Risk Ratio (M‐H, Fixed, 95% CI) | 0.0 [0.0, 0.0] | |
| 7 Voiding dysfunction after 3 months Show forest plot | 1 | Risk Ratio (M‐H, Fixed, 95% CI) | Totals not selected | |
| Analysis 14.7  Comparison 14 Traditional suburethral sling operation versus bladder neck needle suspension (abdominal and vaginal), Outcome 7 Voiding dysfunction after 3 months. | ||||
| 7.1 urodynamic stress incontinence (only) | 1 | Risk Ratio (M‐H, Fixed, 95% CI) | 0.0 [0.0, 0.0] | |
| 7.2 stress urinary incontinence (symptoms only) | 0 | Risk Ratio (M‐H, Fixed, 95% CI) | 0.0 [0.0, 0.0] | |
| 7.3 mixed incontinence | 0 | Risk Ratio (M‐H, Fixed, 95% CI) | 0.0 [0.0, 0.0] | |
| 8 Detrusor overactivity (urodynamic diagnosis) Show forest plot | 1 | Risk Ratio (M‐H, Fixed, 95% CI) | Totals not selected | |
| Analysis 14.8  Comparison 14 Traditional suburethral sling operation versus bladder neck needle suspension (abdominal and vaginal), Outcome 8 Detrusor overactivity (urodynamic diagnosis). | ||||
| 8.1 urodynamic stress incontinence (only) | 1 | Risk Ratio (M‐H, Fixed, 95% CI) | 0.0 [0.0, 0.0] | |
| 8.2 stress urinary incontinence (symptoms only) | 0 | Risk Ratio (M‐H, Fixed, 95% CI) | 0.0 [0.0, 0.0] | |
| 8.3 mixed incontinence | 0 | Risk Ratio (M‐H, Fixed, 95% CI) | 0.0 [0.0, 0.0] | |
| Outcome or subgroup title | No. of studies | No. of participants | Statistical method | Effect size |
| 1 Number of women with urinary incontinence (worse, unchanged, or improved) within first year (women's observations) Show forest plot | 4 | 147 | Risk Ratio (M‐H, Fixed, 95% CI) | 0.40 [0.11, 1.41] |
| Analysis 15.1  Comparison 15 Traditional suburethral sling operation versus open abdominal retropubic colposuspension, Outcome 1 Number of women with urinary incontinence (worse, unchanged, or improved) within first year (women's observations). | ||||
| 1.1 urodynamic stress incontinence (only) | 4 | 147 | Risk Ratio (M‐H, Fixed, 95% CI) | 0.40 [0.11, 1.41] |
| 1.2 stress urinary incontinence (symptoms only) | 0 | 0 | Risk Ratio (M‐H, Fixed, 95% CI) | 0.0 [0.0, 0.0] |
| 1.3 mixed incontinence | 0 | 0 | Risk Ratio (M‐H, Fixed, 95% CI) | 0.0 [0.0, 0.0] |
| 2 Number not improved (worse or unchanged) within first year (women's observations) | 0 | 0 | Risk Ratio (M‐H, Fixed, 95% CI) | 0.0 [0.0, 0.0] |
| 2.1 urodynamic stress incontinence (only) | 0 | 0 | Risk Ratio (M‐H, Fixed, 95% CI) | 0.0 [0.0, 0.0] |
| 2.2 stress urinary incontinence (symptoms only) | 0 | 0 | Risk Ratio (M‐H, Fixed, 95% CI) | 0.0 [0.0, 0.0] |
| 2.3 mixed incontinence | 0 | 0 | Risk Ratio (M‐H, Fixed, 95% CI) | 0.0 [0.0, 0.0] |
| 3 Number of women with urinary incontinence (worse, unchanged, or improved) at 1 to 5 years (women's observations) Show forest plot | 4 | 687 | Risk Ratio (M‐H, Fixed, 95% CI) | 0.73 [0.61, 0.89] |
| Analysis 15.3  Comparison 15 Traditional suburethral sling operation versus open abdominal retropubic colposuspension, Outcome 3 Number of women with urinary incontinence (worse, unchanged, or improved) at 1 to 5 years (women's observations). | ||||
| 3.1 urodynamic stress incontinence (only) | 3 | 167 | Risk Ratio (M‐H, Fixed, 95% CI) | 0.58 [0.22, 1.49] |
| 3.2 stress urinary incontinence (symptoms only) | 1 | 520 | Risk Ratio (M‐H, Fixed, 95% CI) | 0.75 [0.62, 0.91] |
| 3.3 mixed incontinence | 0 | 0 | Risk Ratio (M‐H, Fixed, 95% CI) | 0.0 [0.0, 0.0] |
| 4 Number not improved (worse or unchanged) at 1 to 5 years (women's observations) | 0 | 0 | Risk Ratio (M‐H, Fixed, 95% CI) | 0.0 [0.0, 0.0] |
| 4.1 urodynamic stress incontinence (only) | 0 | 0 | Risk Ratio (M‐H, Fixed, 95% CI) | 0.0 [0.0, 0.0] |
| 4.2 stress urinary incontinence (symptoms only) | 0 | 0 | Risk Ratio (M‐H, Fixed, 95% CI) | 0.0 [0.0, 0.0] |
| 4.3 mixed incontinence | 0 | 0 | Risk Ratio (M‐H, Fixed, 95% CI) | 0.0 [0.0, 0.0] |
| 5 Number of women with urinary incontinence (worse, unchanged, or improved) at > 5 years (women's observations) Show forest plot | 2 | 481 | Risk Ratio (M‐H, Fixed, 95% CI) | 0.85 [0.74, 0.98] |
| Analysis 15.5  Comparison 15 Traditional suburethral sling operation versus open abdominal retropubic colposuspension, Outcome 5 Number of women with urinary incontinence (worse, unchanged, or improved) at > 5 years (women's observations). | ||||
| 5.1 urodynamic stress incontinence (only) | 1 | 28 | Risk Ratio (M‐H, Fixed, 95% CI) | 2.31 [0.24, 22.62] |
| 5.2 stress urinary incontinence (symptoms only) | 1 | 453 | Risk Ratio (M‐H, Fixed, 95% CI) | 0.84 [0.73, 0.97] |
| 5.3 mixed incontinence | 0 | 0 | Risk Ratio (M‐H, Fixed, 95% CI) | 0.0 [0.0, 0.0] |
| 6 CURE: number of women cured at > 1 year (women's observations) Show forest plot | 3 | 515 | Odds Ratio (M‐H, Fixed, 95% CI) | 1.56 [1.07, 2.28] |
| Analysis 15.6  Comparison 15 Traditional suburethral sling operation versus open abdominal retropubic colposuspension, Outcome 6 CURE: number of women cured at > 1 year (women's observations). | ||||
| 6.1 urodynamic stress incontinence (only) | 2 | 62 | Odds Ratio (M‐H, Fixed, 95% CI) | 0.93 [0.18, 4.89] |
| 6.2 stress urinary incontinence (symptoms only) | 1 | 453 | Odds Ratio (M‐H, Fixed, 95% CI) | 1.61 [1.09, 2.37] |
| 6.3 mixed incontinence | 0 | 0 | Odds Ratio (M‐H, Fixed, 95% CI) | 0.0 [0.0, 0.0] |
| 7 Number of women not satisfied at > 5 years Show forest plot | 1 | Risk Ratio (M‐H, Fixed, 95% CI) | Totals not selected | |
| Analysis 15.7  Comparison 15 Traditional suburethral sling operation versus open abdominal retropubic colposuspension, Outcome 7 Number of women not satisfied at > 5 years. | ||||
| 7.1 urodynamic stress incontinence (only) | 0 | Risk Ratio (M‐H, Fixed, 95% CI) | 0.0 [0.0, 0.0] | |
| 7.2 stress urinary incontinence (symptoms only) | 1 | Risk Ratio (M‐H, Fixed, 95% CI) | 0.0 [0.0, 0.0] | |
| 7.3 mixed incontinence | 0 | Risk Ratio (M‐H, Fixed, 95% CI) | 0.0 [0.0, 0.0] | |
| 8 Incontinent episodes over 24 hours | 0 | 0 | Mean Difference (IV, Fixed, 95% CI) | 0.0 [0.0, 0.0] |
| 8.1 urodynamic stress incontinence (only) | 0 | 0 | Mean Difference (IV, Fixed, 95% CI) | 0.0 [0.0, 0.0] |
| 8.2 stress urinary incontinence (symptoms only) | 0 | 0 | Mean Difference (IV, Fixed, 95% CI) | 0.0 [0.0, 0.0] |
| 8.3 mixed incontinence | 0 | 0 | Mean Difference (IV, Fixed, 95% CI) | 0.0 [0.0, 0.0] |
| 9 Number of women with urinary incontinence (clinician's observations) within first year | 0 | 0 | Risk Ratio (M‐H, Fixed, 95% CI) | 0.0 [0.0, 0.0] |
| 9.1 urodynamic stress incontinence (only) | 0 | 0 | Risk Ratio (M‐H, Fixed, 95% CI) | 0.0 [0.0, 0.0] |
| 9.2 stress urinary incontinence (symptoms only) | 0 | 0 | Risk Ratio (M‐H, Fixed, 95% CI) | 0.0 [0.0, 0.0] |
| 9.3 mixed incontinence | 0 | 0 | Risk Ratio (M‐H, Fixed, 95% CI) | 0.0 [0.0, 0.0] |
| 10 Number of women with urinary incontinence (clinician's observations) at 1 to 5 years Show forest plot | 2 | 592 | Risk Ratio (M‐H, Fixed, 95% CI) | 0.90 [0.60, 1.34] |
| Analysis 15.10  Comparison 15 Traditional suburethral sling operation versus open abdominal retropubic colposuspension, Outcome 10 Number of women with urinary incontinence (clinician's observations) at 1 to 5 years. | ||||
| 10.1 urodynamic stress incontinence (only) | 1 | 72 | Risk Ratio (M‐H, Fixed, 95% CI) | 0.6 [0.15, 2.33] |
| 10.2 stress urinary incontinence (symptoms only) | 1 | 520 | Risk Ratio (M‐H, Fixed, 95% CI) | 0.94 [0.62, 1.42] |
| 10.3 mixed incontinence | 0 | 0 | Risk Ratio (M‐H, Fixed, 95% CI) | 0.0 [0.0, 0.0] |
| 11 Number of women with urinary incontinence (clinician's observations) at > 5 years Show forest plot | 2 | 461 | Risk Ratio (M‐H, Fixed, 95% CI) | 0.90 [0.80, 1.01] |
| Analysis 15.11  Comparison 15 Traditional suburethral sling operation versus open abdominal retropubic colposuspension, Outcome 11 Number of women with urinary incontinence (clinician's observations) at > 5 years. | ||||
| 11.1 urodynamic stress incontinence (only) | 1 | 28 | Risk Ratio (M‐H, Fixed, 95% CI) | 0.23 [0.01, 4.37] |
| 11.2 stress urinary incontinence (symptoms only) | 1 | 433 | Risk Ratio (M‐H, Fixed, 95% CI) | 0.91 [0.81, 1.02] |
| 11.3 mixed incontinence | 0 | 0 | Risk Ratio (M‐H, Fixed, 95% CI) | 0.0 [0.0, 0.0] |
| 12 Duration of operation (minutes) Show forest plot | 1 | Mean Difference (IV, Fixed, 95% CI) | Totals not selected | |
| Analysis 15.12  Comparison 15 Traditional suburethral sling operation versus open abdominal retropubic colposuspension, Outcome 12 Duration of operation (minutes). | ||||
| 12.1 urodynamic stress incontinence (only) | 1 | Mean Difference (IV, Fixed, 95% CI) | 0.0 [0.0, 0.0] | |
| 12.2 stress urinary incontinence (symptoms only) | 0 | Mean Difference (IV, Fixed, 95% CI) | 0.0 [0.0, 0.0] | |
| 12.3 mixed incontinence | 0 | Mean Difference (IV, Fixed, 95% CI) | 0.0 [0.0, 0.0] | |
| 13 Time to catheter removal (days) Show forest plot | 2 | 108 | Mean Difference (IV, Fixed, 95% CI) | 8.01 [6.84, 9.18] |
| Analysis 15.13  Comparison 15 Traditional suburethral sling operation versus open abdominal retropubic colposuspension, Outcome 13 Time to catheter removal (days). | ||||
| 13.1 urodynamic stress incontinence (only) | 2 | 108 | Mean Difference (IV, Fixed, 95% CI) | 8.01 [6.84, 9.18] |
| 13.2 stress urinary incontinence (symptoms only) | 0 | 0 | Mean Difference (IV, Fixed, 95% CI) | 0.0 [0.0, 0.0] |
| 13.3 mixed incontinence | 0 | 0 | Mean Difference (IV, Fixed, 95% CI) | 0.0 [0.0, 0.0] |
| 14 Length of hospital stay (days) Show forest plot | 3 | Mean Difference (IV, Fixed, 95% CI) | Totals not selected | |
| Analysis 15.14  Comparison 15 Traditional suburethral sling operation versus open abdominal retropubic colposuspension, Outcome 14 Length of hospital stay (days). | ||||
| 14.1 urodynamic stress incontinence (only) | 3 | Mean Difference (IV, Fixed, 95% CI) | 0.0 [0.0, 0.0] | |
| 14.2 stress urinary incontinence (symptoms only) | 0 | Mean Difference (IV, Fixed, 95% CI) | 0.0 [0.0, 0.0] | |
| 14.3 mixed incontinence | 0 | Mean Difference (IV, Fixed, 95% CI) | 0.0 [0.0, 0.0] | |
| 15 Time to return to normal activity level | 0 | 0 | Mean Difference (IV, Fixed, 95% CI) | 0.0 [0.0, 0.0] |
| 15.1 urodynamic stress incontinence (only) | 0 | 0 | Mean Difference (IV, Fixed, 95% CI) | 0.0 [0.0, 0.0] |
| 15.2 stress urinary incontinence (symptoms only) | 0 | 0 | Mean Difference (IV, Fixed, 95% CI) | 0.0 [0.0, 0.0] |
| 15.3 mixed incontinence | 0 | 0 | Mean Difference (IV, Fixed, 95% CI) | 0.0 [0.0, 0.0] |
| 16 Perioperative surgical complications Show forest plot | 4 | 792 | Risk Ratio (M‐H, Fixed, 95% CI) | 1.24 [0.83, 1.86] |
| Analysis 15.16  Comparison 15 Traditional suburethral sling operation versus open abdominal retropubic colposuspension, Outcome 16 Perioperative surgical complications. | ||||
| 16.1 urodynamic stress incontinence (only) | 3 | 137 | Risk Ratio (M‐H, Fixed, 95% CI) | 0.85 [0.28, 2.52] |
| 16.2 stress urinary incontinence (symptoms only) | 1 | 655 | Risk Ratio (M‐H, Fixed, 95% CI) | 1.32 [0.86, 2.04] |
| 16.3 mixed incontinence | 0 | 0 | Risk Ratio (M‐H, Fixed, 95% CI) | 0.0 [0.0, 0.0] |
| 17 Bladder perforation Show forest plot | 1 | Risk Ratio (M‐H, Fixed, 95% CI) | Totals not selected | |
| Analysis 15.17  Comparison 15 Traditional suburethral sling operation versus open abdominal retropubic colposuspension, Outcome 17 Bladder perforation. | ||||
| 17.1 urodynamic stress incontinence (only) | 0 | Risk Ratio (M‐H, Fixed, 95% CI) | 0.0 [0.0, 0.0] | |
| 17.2 stress urinary incontinence (symptoms only) | 1 | Risk Ratio (M‐H, Fixed, 95% CI) | 0.0 [0.0, 0.0] | |
| 17.3 mixed incontinence | 0 | Risk Ratio (M‐H, Fixed, 95% CI) | 0.0 [0.0, 0.0] | |
| 18 Urinary tract infection Show forest plot | 1 | Risk Ratio (M‐H, Fixed, 95% CI) | Totals not selected | |
| Analysis 15.18  Comparison 15 Traditional suburethral sling operation versus open abdominal retropubic colposuspension, Outcome 18 Urinary tract infection. | ||||
| 18.1 urodynamic stress incontinence (only) | 0 | Risk Ratio (M‐H, Fixed, 95% CI) | 0.0 [0.0, 0.0] | |
| 18.2 stress urinary incontinence (symptoms only) | 1 | Risk Ratio (M‐H, Fixed, 95% CI) | 0.0 [0.0, 0.0] | |
| 18.3 mixed incontinence | 0 | Risk Ratio (M‐H, Fixed, 95% CI) | 0.0 [0.0, 0.0] | |
| 19 Number of women with recurrent UTIs at > 5 years Show forest plot | 1 | Risk Ratio (M‐H, Fixed, 95% CI) | Totals not selected | |
| Analysis 15.19  Comparison 15 Traditional suburethral sling operation versus open abdominal retropubic colposuspension, Outcome 19 Number of women with recurrent UTIs at > 5 years. | ||||
| 19.1 urodynamic stress incontinence (only) | 0 | Risk Ratio (M‐H, Fixed, 95% CI) | 0.0 [0.0, 0.0] | |
| 19.2 stress urinary incontinence (symptoms only) | 1 | Risk Ratio (M‐H, Fixed, 95% CI) | 0.0 [0.0, 0.0] | |
| 19.3 mixed incontinence | 0 | Risk Ratio (M‐H, Fixed, 95% CI) | 0.0 [0.0, 0.0] | |
| 20 Urge urinary symptoms, urgency urinary incontinence Show forest plot | 2 | 525 | Risk Ratio (M‐H, Fixed, 95% CI) | 1.10 [0.74, 1.64] |
| Analysis 15.20  Comparison 15 Traditional suburethral sling operation versus open abdominal retropubic colposuspension, Outcome 20 Urge urinary symptoms, urgency urinary incontinence. | ||||
| 20.1 urodynamic stress incontinence (only) | 1 | 72 | Risk Ratio (M‐H, Fixed, 95% CI) | 2.0 [0.54, 7.39] |
| 20.2 stress urinary incontinence (symptoms only) | 1 | 453 | Risk Ratio (M‐H, Fixed, 95% CI) | 1.02 [0.67, 1.56] |
| 20.3 mixed incontinence | 0 | 0 | Risk Ratio (M‐H, Fixed, 95% CI) | 0.0 [0.0, 0.0] |
| 21 Detrusor overactivity (urodynamic diagnosis) Show forest plot | 4 | 203 | Risk Ratio (M‐H, Fixed, 95% CI) | 1.42 [0.52, 3.87] |
| Analysis 15.21  Comparison 15 Traditional suburethral sling operation versus open abdominal retropubic colposuspension, Outcome 21 Detrusor overactivity (urodynamic diagnosis). | ||||
| 21.1 urodynamic stress incontinence (only) | 4 | 203 | Risk Ratio (M‐H, Fixed, 95% CI) | 1.42 [0.52, 3.87] |
| 21.2 stress urinary incontinence (symptoms only) | 0 | 0 | Risk Ratio (M‐H, Fixed, 95% CI) | 0.0 [0.0, 0.0] |
| 21.3 mixed incontinence | 0 | 0 | Risk Ratio (M‐H, Fixed, 95% CI) | 0.0 [0.0, 0.0] |
| 22 Voiding dysfunction after 3 months Show forest plot | 5 | 853 | Risk Ratio (M‐H, Fixed, 95% CI) | 6.08 [3.10, 11.95] |
| Analysis 15.22  Comparison 15 Traditional suburethral sling operation versus open abdominal retropubic colposuspension, Outcome 22 Voiding dysfunction after 3 months. | ||||
| 22.1 urodynamic stress incontinence (only) | 4 | 198 | Risk Ratio (M‐H, Fixed, 95% CI) | 4.48 [1.16, 17.36] |
| 22.2 stress urinary incontinence (symptoms only) | 1 | 655 | Risk Ratio (M‐H, Fixed, 95% CI) | 6.63 [3.04, 14.47] |
| 22.3 mixed incontinence | 0 | 0 | Risk Ratio (M‐H, Fixed, 95% CI) | 0.0 [0.0, 0.0] |
| 23 Long‐term voiding dysfunction > 5 years Show forest plot | 1 | Risk Ratio (M‐H, Fixed, 95% CI) | Totals not selected | |
| Analysis 15.23  Comparison 15 Traditional suburethral sling operation versus open abdominal retropubic colposuspension, Outcome 23 Long‐term voiding dysfunction > 5 years. | ||||
| 23.1 urodynamic stress incontinence (only) | 0 | Risk Ratio (M‐H, Fixed, 95% CI) | 0.0 [0.0, 0.0] | |
| 23.2 stress urinary incontinence (symptoms only) | 1 | Risk Ratio (M‐H, Fixed, 95% CI) | 0.0 [0.0, 0.0] | |
| 23.3 mixed incontinence | 0 | Risk Ratio (M‐H, Fixed, 95% CI) | 0.0 [0.0, 0.0] | |
| 24 Number of women requiring treatment for pelvic organ prolapse Show forest plot | 3 | 559 | Risk Ratio (M‐H, Fixed, 95% CI) | 0.20 [0.05, 0.77] |
| Analysis 15.24  Comparison 15 Traditional suburethral sling operation versus open abdominal retropubic colposuspension, Outcome 24 Number of women requiring treatment for pelvic organ prolapse. | ||||
| 24.1 urodynamic stress incontinence (only) | 2 | 106 | Risk Ratio (M‐H, Fixed, 95% CI) | 0.2 [0.04, 1.11] |
| 24.2 stress urinary incontinence (symptoms only) | 1 | 453 | Risk Ratio (M‐H, Fixed, 95% CI) | 0.20 [0.02, 1.74] |
| 24.3 mixed incontinence | 0 | 0 | Risk Ratio (M‐H, Fixed, 95% CI) | 0.0 [0.0, 0.0] |
| 25 Repeat surgery for urinary incontinence Show forest plot | 1 | Risk Ratio (M‐H, Fixed, 95% CI) | Totals not selected | |
| Analysis 15.25  Comparison 15 Traditional suburethral sling operation versus open abdominal retropubic colposuspension, Outcome 25 Repeat surgery for urinary incontinence. | ||||
| 25.1 urodynamic stress incontinence (only) | 0 | Risk Ratio (M‐H, Fixed, 95% CI) | 0.0 [0.0, 0.0] | |
| 25.2 stress urinary incontinence (symptoms only) | 1 | Risk Ratio (M‐H, Fixed, 95% CI) | 0.0 [0.0, 0.0] | |
| 25.3 mixed incontinence | 0 | Risk Ratio (M‐H, Fixed, 95% CI) | 0.0 [0.0, 0.0] | |
| 26 Condition‐specific measures to assess quality of life Show forest plot | 1 | Mean Difference (IV, Fixed, 95% CI) | Totals not selected | |
| Analysis 15.26  Comparison 15 Traditional suburethral sling operation versus open abdominal retropubic colposuspension, Outcome 26 Condition‐specific measures to assess quality of life. | ||||
| 26.1 Urinary Distress Index (UDI) | 1 | Mean Difference (IV, Fixed, 95% CI) | 0.0 [0.0, 0.0] | |
| 26.2 Incontinence Impact Questionnaire (IIQ) | 1 | Mean Difference (IV, Fixed, 95% CI) | 0.0 [0.0, 0.0] | |
| Outcome or subgroup title | No. of studies | No. of participants | Statistical method | Effect size |
| 1 Number of women with urinary incontinence (worse, unchanged, or improved) within first year (women's observations) Show forest plot | 11 | 841 | Risk Ratio (M‐H, Fixed, 95% CI) | 1.04 [0.85, 1.28] |
| Analysis 16.1  Comparison 16 Traditional suburethral sling operation versus a mid‐urethral sling or tape, Outcome 1 Number of women with urinary incontinence (worse, unchanged, or improved) within first year (women's observations). | ||||
| 1.1 urodynamic stress incontinence (only) | 5 | 427 | Risk Ratio (M‐H, Fixed, 95% CI) | 1.02 [0.77, 1.36] |
| 1.2 stress urinary incontinence (symptoms only) | 1 | 53 | Risk Ratio (M‐H, Fixed, 95% CI) | 1.12 [0.17, 7.37] |
| 1.3 mixed urinary incontinence | 5 | 361 | Risk Ratio (M‐H, Fixed, 95% CI) | 1.06 [0.78, 1.42] |
| 2 Number not improved (worse or unchanged) within first year (women's observations) Show forest plot | 3 | 425 | Risk Ratio (M‐H, Fixed, 95% CI) | 0.79 [0.49, 1.29] |
| Analysis 16.2  Comparison 16 Traditional suburethral sling operation versus a mid‐urethral sling or tape, Outcome 2 Number not improved (worse or unchanged) within first year (women's observations). | ||||
| 2.1 urodynamic stress incontinence (only) | 2 | 286 | Risk Ratio (M‐H, Fixed, 95% CI) | 0.95 [0.40, 2.21] |
| 2.2 stress urinary incontinence (symptoms only) | 0 | 0 | Risk Ratio (M‐H, Fixed, 95% CI) | 0.0 [0.0, 0.0] |
| 2.3 mixed urinary incontinence | 1 | 139 | Risk Ratio (M‐H, Fixed, 95% CI) | 0.72 [0.40, 1.29] |
| 3 Number of women with urinary incontinence (worse, unchanged, or improved) at 1 to 5 years (women's observations) Show forest plot | 6 | 458 | Risk Ratio (M‐H, Fixed, 95% CI) | 1.29 [0.98, 1.68] |
| Analysis 16.3  Comparison 16 Traditional suburethral sling operation versus a mid‐urethral sling or tape, Outcome 3 Number of women with urinary incontinence (worse, unchanged, or improved) at 1 to 5 years (women's observations). | ||||
| 3.1 urodynamic stress incontinence (only) | 4 | 364 | Risk Ratio (M‐H, Fixed, 95% CI) | 1.18 [0.87, 1.59] |
| 3.2 stress urinary incontinence (symptoms only) | 0 | 0 | Risk Ratio (M‐H, Fixed, 95% CI) | 0.0 [0.0, 0.0] |
| 3.3 mixed urinary incontinence | 2 | 94 | Risk Ratio (M‐H, Fixed, 95% CI) | 1.79 [0.96, 3.31] |
| 4 Number not improved (worse or unchanged) after first year (women's observations) Show forest plot | 2 | 264 | Risk Ratio (M‐H, Fixed, 95% CI) | 1.28 [0.56, 2.94] |
| Analysis 16.4  Comparison 16 Traditional suburethral sling operation versus a mid‐urethral sling or tape, Outcome 4 Number not improved (worse or unchanged) after first year (women's observations). | ||||
| 4.1 urodynamic stress incontinence (only) | 2 | 264 | Risk Ratio (M‐H, Fixed, 95% CI) | 1.28 [0.56, 2.94] |
| 4.2 stress urinary incontinence (symptoms only) | 0 | 0 | Risk Ratio (M‐H, Fixed, 95% CI) | 0.0 [0.0, 0.0] |
| 4.3 mixed urinary incontinence | 0 | 0 | Risk Ratio (M‐H, Fixed, 95% CI) | 0.0 [0.0, 0.0] |
| 5 Number of women with urinary incontinence after 5 years (women's observations) Show forest plot | 1 | Risk Ratio (M‐H, Fixed, 95% CI) | Totals not selected | |
| Analysis 16.5  Comparison 16 Traditional suburethral sling operation versus a mid‐urethral sling or tape, Outcome 5 Number of women with urinary incontinence after 5 years (women's observations). | ||||
| 5.1 urodynamic stress incontinence (only) | 1 | Risk Ratio (M‐H, Fixed, 95% CI) | 0.0 [0.0, 0.0] | |
| 5.2 stress urinary incontinence (symptoms only) | 0 | Risk Ratio (M‐H, Fixed, 95% CI) | 0.0 [0.0, 0.0] | |
| 5.3 mixed urinary incontinence | 0 | Risk Ratio (M‐H, Fixed, 95% CI) | 0.0 [0.0, 0.0] | |
| 6 Number with incontinence not improved after 5 years (women's observations) Show forest plot | 1 | Risk Ratio (M‐H, Fixed, 95% CI) | Totals not selected | |
| Analysis 16.6  Comparison 16 Traditional suburethral sling operation versus a mid‐urethral sling or tape, Outcome 6 Number with incontinence not improved after 5 years (women's observations). | ||||
| 6.1 urodynamic stress incontinence (only) | 1 | Risk Ratio (M‐H, Fixed, 95% CI) | 0.0 [0.0, 0.0] | |
| 6.2 stress urinary incontinence (symptoms only) | 0 | Risk Ratio (M‐H, Fixed, 95% CI) | 0.0 [0.0, 0.0] | |
| 6.3 mixed urinary incontinence | 0 | Risk Ratio (M‐H, Fixed, 95% CI) | 0.0 [0.0, 0.0] | |
| 7 CURE: number of women cured at > 1 year (women's observations) Show forest plot | 4 | 337 | Odds Ratio (M‐H, Fixed, 95% CI) | 1.06 [0.65, 1.72] |
| Analysis 16.7  Comparison 16 Traditional suburethral sling operation versus a mid‐urethral sling or tape, Outcome 7 CURE: number of women cured at > 1 year (women's observations). | ||||
| 7.1 urodynamic stress incontinence (only) | 3 | 293 | Odds Ratio (M‐H, Fixed, 95% CI) | 1.21 [0.72, 2.03] |
| 7.2 stress urinary incontinence (symptoms only) | 0 | 0 | Odds Ratio (M‐H, Fixed, 95% CI) | 0.0 [0.0, 0.0] |
| 7.3 mixed urinary incontinence | 1 | 44 | Odds Ratio (M‐H, Fixed, 95% CI) | 0.42 [0.10, 1.72] |
| 8 Repeat surgery for urinary incontinence Show forest plot | 1 | Risk Ratio (M‐H, Fixed, 95% CI) | Totals not selected | |
| Analysis 16.8  Comparison 16 Traditional suburethral sling operation versus a mid‐urethral sling or tape, Outcome 8 Repeat surgery for urinary incontinence. | ||||
| 8.1 urodynamic stress incontinence (only) | 1 | Risk Ratio (M‐H, Fixed, 95% CI) | 0.0 [0.0, 0.0] | |
| 8.2 stress urinary incontinence (symptoms only) | 0 | Risk Ratio (M‐H, Fixed, 95% CI) | 0.0 [0.0, 0.0] | |
| 8.3 mixed incontinence | 0 | Risk Ratio (M‐H, Fixed, 95% CI) | 0.0 [0.0, 0.0] | |
| 9 Number of women not satisfied Show forest plot | 2 | Risk Ratio (M‐H, Fixed, 95% CI) | Subtotals only | |
| Analysis 16.9  Comparison 16 Traditional suburethral sling operation versus a mid‐urethral sling or tape, Outcome 9 Number of women not satisfied. | ||||
| 9.1 urodynamic stress incontinence (only) | 2 | 163 | Risk Ratio (M‐H, Fixed, 95% CI) | 0.82 [0.51, 1.32] |
| 9.2 stress urinary incontinence (symptoms only) | 0 | 0 | Risk Ratio (M‐H, Fixed, 95% CI) | 0.0 [0.0, 0.0] |
| 9.3 mixed urinary incontinence | 0 | 0 | Risk Ratio (M‐H, Fixed, 95% CI) | 0.0 [0.0, 0.0] |
| 10 Pad test of quantified leakage (mean weight of urine loss) Show forest plot | 1 | Mean Difference (IV, Fixed, 95% CI) | Totals not selected | |
| Analysis 16.10  Comparison 16 Traditional suburethral sling operation versus a mid‐urethral sling or tape, Outcome 10 Pad test of quantified leakage (mean weight of urine loss). | ||||
| 10.1 urodynamic stress incontinence (only) | 1 | Mean Difference (IV, Fixed, 95% CI) | 0.0 [0.0, 0.0] | |
| 10.2 stress urinary incontinence (symptoms only) | 0 | Mean Difference (IV, Fixed, 95% CI) | 0.0 [0.0, 0.0] | |
| 10.3 mixed urinary incontinence | 0 | Mean Difference (IV, Fixed, 95% CI) | 0.0 [0.0, 0.0] | |
| 11 Number of women with urinary incontinence (clinician's observations) within first year Show forest plot | 2 | 105 | Risk Ratio (M‐H, Fixed, 95% CI) | 1.29 [0.45, 3.71] |
| Analysis 16.11  Comparison 16 Traditional suburethral sling operation versus a mid‐urethral sling or tape, Outcome 11 Number of women with urinary incontinence (clinician's observations) within first year. | ||||
| 11.1 urodynamic stress incontinence (only) | 0 | 0 | Risk Ratio (M‐H, Fixed, 95% CI) | 0.0 [0.0, 0.0] |
| 11.2 stress urinary incontinence (symptoms only) | 0 | 0 | Risk Ratio (M‐H, Fixed, 95% CI) | 0.0 [0.0, 0.0] |
| 11.3 mixed urinary incontinence | 2 | 105 | Risk Ratio (M‐H, Fixed, 95% CI) | 1.29 [0.45, 3.71] |
| 12 Number of women with urinary incontinence (clinician's observations) after first year Show forest plot | 1 | Risk Ratio (M‐H, Fixed, 95% CI) | Totals not selected | |
| Analysis 16.12  Comparison 16 Traditional suburethral sling operation versus a mid‐urethral sling or tape, Outcome 12 Number of women with urinary incontinence (clinician's observations) after first year. | ||||
| 12.1 urodynamic stress incontinence (only) | 0 | Risk Ratio (M‐H, Fixed, 95% CI) | 0.0 [0.0, 0.0] | |
| 12.2 stress urinary incontinence (symptoms only) | 0 | Risk Ratio (M‐H, Fixed, 95% CI) | 0.0 [0.0, 0.0] | |
| 12.3 mixed urinary incontinence | 1 | Risk Ratio (M‐H, Fixed, 95% CI) | 0.0 [0.0, 0.0] | |
| 13 Duration of operation (minutes) Show forest plot | 7 | 355 | Mean Difference (IV, Fixed, 95% CI) | 57.08 [54.67, 59.49] |
| Analysis 16.13  Comparison 16 Traditional suburethral sling operation versus a mid‐urethral sling or tape, Outcome 13 Duration of operation (minutes). | ||||
| 13.1 urodynamic stress incontinence (only) | 2 | 61 | Mean Difference (IV, Fixed, 95% CI) | 46.91 [42.31, 51.52] |
| 13.2 stress urinary incontinence (symptoms only) | 1 | 53 | Mean Difference (IV, Fixed, 95% CI) | 20.0 [7.08, 32.92] |
| 13.3 mixed urinary incontinence | 4 | 241 | Mean Difference (IV, Fixed, 95% CI) | 62.96 [60.07, 65.86] |
| 14 Length of hospital stay (days) Show forest plot | 4 | 194 | Mean Difference (IV, Fixed, 95% CI) | 0.74 [0.55, 0.93] |
| Analysis 16.14  Comparison 16 Traditional suburethral sling operation versus a mid‐urethral sling or tape, Outcome 14 Length of hospital stay (days). | ||||
| 14.1 urodynamic stress incontinence (only) | 1 | 20 | Mean Difference (IV, Fixed, 95% CI) | 0.65 [0.39, 0.91] |
| 14.2 stress urinary incontinence (symptoms only) | 0 | 0 | Mean Difference (IV, Fixed, 95% CI) | 0.0 [0.0, 0.0] |
| 14.3 mixed urinary incontinence | 3 | 174 | Mean Difference (IV, Fixed, 95% CI) | 0.83 [0.56, 1.10] |
| 15 Time to catheter removal (days) Show forest plot | 2 | 113 | Mean Difference (IV, Fixed, 95% CI) | 0.11 [‐0.07, 0.30] |
| Analysis 16.15  Comparison 16 Traditional suburethral sling operation versus a mid‐urethral sling or tape, Outcome 15 Time to catheter removal (days). | ||||
| 15.1 urodynamic stress incontinence (only) | 0 | 0 | Mean Difference (IV, Fixed, 95% CI) | 0.0 [0.0, 0.0] |
| 15.2 stress urinary incontinence (symptoms only) | 1 | 53 | Mean Difference (IV, Fixed, 95% CI) | 2.3 [0.01, 4.59] |
| 15.3 mixed urinary incontinence | 1 | 60 | Mean Difference (IV, Fixed, 95% CI) | 0.10 [‐0.09, 0.29] |
| 16 Perioperative surgical complications Show forest plot | 4 | 293 | Risk Ratio (M‐H, Fixed, 95% CI) | 1.74 [1.16, 2.60] |
| Analysis 16.16  Comparison 16 Traditional suburethral sling operation versus a mid‐urethral sling or tape, Outcome 16 Perioperative surgical complications. | ||||
| 16.1 urodynamic stress incontinence (only) | 2 | 183 | Risk Ratio (M‐H, Fixed, 95% CI) | 1.73 [1.01, 2.96] |
| 16.2 stress urinary incontinence (symptoms only) | 0 | 0 | Risk Ratio (M‐H, Fixed, 95% CI) | 0.0 [0.0, 0.0] |
| 16.3 mixed urinary incontinence | 2 | 110 | Risk Ratio (M‐H, Fixed, 95% CI) | 1.74 [0.94, 3.21] |
| 17 Bladder perforations Show forest plot | 10 | 844 | Risk Ratio (M‐H, Fixed, 95% CI) | 0.59 [0.34, 1.01] |
| Analysis 16.17  Comparison 16 Traditional suburethral sling operation versus a mid‐urethral sling or tape, Outcome 17 Bladder perforations. | ||||
| 17.1 urodynamic stress incontinence (only) | 3 | 334 | Risk Ratio (M‐H, Fixed, 95% CI) | 0.74 [0.19, 2.86] |
| 17.2 stress urinary incontinence (symptoms only) | 1 | 53 | Risk Ratio (M‐H, Fixed, 95% CI) | 0.56 [0.05, 5.81] |
| 17.3 mixed urinary incontinence | 6 | 457 | Risk Ratio (M‐H, Fixed, 95% CI) | 0.56 [0.30, 1.03] |
| 18 Urethral injury Show forest plot | 1 | Risk Ratio (M‐H, Fixed, 95% CI) | Totals not selected | |
| Analysis 16.18  Comparison 16 Traditional suburethral sling operation versus a mid‐urethral sling or tape, Outcome 18 Urethral injury. | ||||
| 18.1 urodynamic stress incontinence (only) | 0 | Risk Ratio (M‐H, Fixed, 95% CI) | 0.0 [0.0, 0.0] | |
| 18.2 stress urinary incontinence (symptoms only) | 0 | Risk Ratio (M‐H, Fixed, 95% CI) | 0.0 [0.0, 0.0] | |
| 18.3 mixed urinary incontinence | 1 | Risk Ratio (M‐H, Fixed, 95% CI) | 0.0 [0.0, 0.0] | |
| 19 Vaginal bleeding Show forest plot | 1 | Risk Ratio (M‐H, Fixed, 95% CI) | Totals not selected | |
| Analysis 16.19  Comparison 16 Traditional suburethral sling operation versus a mid‐urethral sling or tape, Outcome 19 Vaginal bleeding. | ||||
| 19.1 urodynamic stress incontinence (only) | 0 | Risk Ratio (M‐H, Fixed, 95% CI) | 0.0 [0.0, 0.0] | |
| 19.2 stress urinary incontinence (symptoms only) | 0 | Risk Ratio (M‐H, Fixed, 95% CI) | 0.0 [0.0, 0.0] | |
| 19.3 mixed urinary incontinence | 1 | Risk Ratio (M‐H, Fixed, 95% CI) | 0.0 [0.0, 0.0] | |
| 20 Urinary tract infection Show forest plot | 1 | Risk Ratio (M‐H, Fixed, 95% CI) | Totals not selected | |
| Analysis 16.20  Comparison 16 Traditional suburethral sling operation versus a mid‐urethral sling or tape, Outcome 20 Urinary tract infection. | ||||
| 20.1 urodynamic stress incontinence (only) | 0 | Risk Ratio (M‐H, Fixed, 95% CI) | 0.0 [0.0, 0.0] | |
| 20.2 stress urinary incontinence (symptoms only) | 0 | Risk Ratio (M‐H, Fixed, 95% CI) | 0.0 [0.0, 0.0] | |
| 20.3 mixed urinary incontinence | 1 | Risk Ratio (M‐H, Fixed, 95% CI) | 0.0 [0.0, 0.0] | |
| 21 Voiding dysfunction Show forest plot | 8 | 629 | Risk Ratio (M‐H, Fixed, 95% CI) | 1.34 [0.85, 2.12] |
| Analysis 16.21  Comparison 16 Traditional suburethral sling operation versus a mid‐urethral sling or tape, Outcome 21 Voiding dysfunction. | ||||
| 21.1 urodynamic stress incontinence (only) | 3 | 325 | Risk Ratio (M‐H, Fixed, 95% CI) | 1.22 [0.60, 2.46] |
| 21.2 stress urinary incontinence (symptoms only) | 1 | 53 | Risk Ratio (M‐H, Fixed, 95% CI) | 2.61 [0.76, 9.03] |
| 21.3 mixed urinary incontinence | 4 | 251 | Risk Ratio (M‐H, Fixed, 95% CI) | 1.18 [0.58, 2.40] |
| 22 De novo detrusor urgency or urge symptoms Show forest plot | 5 | 348 | Risk Ratio (M‐H, Fixed, 95% CI) | 1.62 [0.66, 3.99] |
| Analysis 16.22  Comparison 16 Traditional suburethral sling operation versus a mid‐urethral sling or tape, Outcome 22 De novo detrusor urgency or urge symptoms. | ||||
| 22.1 urodynamic stress incontinence (only) | 1 | 124 | Risk Ratio (M‐H, Fixed, 95% CI) | 0.34 [0.01, 8.29] |
| 22.2 stress urinary incontinence (symptoms only) | 1 | 53 | Risk Ratio (M‐H, Fixed, 95% CI) | 3.35 [0.14, 78.60] |
| 22.3 mixed urinary incontinence | 3 | 171 | Risk Ratio (M‐H, Fixed, 95% CI) | 1.81 [0.65, 5.06] |
| 23 De novo detrusor overactivity (urodynamic diagnosis) Show forest plot | 4 | 325 | Risk Ratio (M‐H, Fixed, 95% CI) | 2.61 [1.17, 5.84] |
| Analysis 16.23  Comparison 16 Traditional suburethral sling operation versus a mid‐urethral sling or tape, Outcome 23 De novo detrusor overactivity (urodynamic diagnosis). | ||||
| 23.1 urodynamic stress incontinence (only) | 1 | 59 | Risk Ratio (M‐H, Fixed, 95% CI) | 0.0 [0.0, 0.0] |
| 23.2 stress urinary incontinence (symptoms only) | 1 | 47 | Risk Ratio (M‐H, Fixed, 95% CI) | 3.13 [0.13, 73.01] |
| 23.3 mixed urinary incontinence | 2 | 219 | Risk Ratio (M‐H, Fixed, 95% CI) | 2.57 [1.12, 5.92] |
| 24 Long‐term adverse effects (release of sling required) Show forest plot | 3 | 326 | Risk Ratio (M‐H, Fixed, 95% CI) | 2.53 [0.87, 7.35] |
| Analysis 16.24  Comparison 16 Traditional suburethral sling operation versus a mid‐urethral sling or tape, Outcome 24 Long‐term adverse effects (release of sling required). | ||||
| 24.1 urodynamic stress incontinence (only) | 2 | 266 | Risk Ratio (M‐H, Fixed, 95% CI) | 1.68 [0.50, 5.66] |
| 24.2 stress urinary incontinence (symptoms only) | 0 | 0 | Risk Ratio (M‐H, Fixed, 95% CI) | 0.0 [0.0, 0.0] |
| 24.3 mixed urinary incontinence | 1 | 60 | Risk Ratio (M‐H, Fixed, 95% CI) | 9.6 [0.54, 170.84] |
| 25 Long‐term adverse effects (wound pain at 6 months) Show forest plot | 3 | 257 | Risk Ratio (M‐H, Fixed, 95% CI) | 6.40 [1.94, 21.12] |
| Analysis 16.25  Comparison 16 Traditional suburethral sling operation versus a mid‐urethral sling or tape, Outcome 25 Long‐term adverse effects (wound pain at 6 months). | ||||
| 25.1 urodynamic stress incontinence (only) | 1 | 124 | Risk Ratio (M‐H, Fixed, 95% CI) | 5.16 [0.25, 105.36] |
| 25.2 stress urinary incontinence (symptoms only) | 1 | 53 | Risk Ratio (M‐H, Fixed, 95% CI) | 3.92 [0.90, 17.15] |
| 25.3 mixed urinary incontinence | 1 | 80 | Risk Ratio (M‐H, Fixed, 95% CI) | 17.0 [1.01, 284.96] |
| 26 Long‐term adverse effects (vaginal mesh or graft exposure) Show forest plot | 5 | 348 | Risk Ratio (M‐H, Fixed, 95% CI) | 0.28 [0.05, 1.65] |
| Analysis 16.26  Comparison 16 Traditional suburethral sling operation versus a mid‐urethral sling or tape, Outcome 26 Long‐term adverse effects (vaginal mesh or graft exposure). | ||||
| 26.1 urodynamic stress incontinence (only) | 2 | 165 | Risk Ratio (M‐H, Fixed, 95% CI) | 0.35 [0.04, 3.24] |
| 26.2 stress urinary incontinence (symptoms only) | 1 | 53 | Risk Ratio (M‐H, Fixed, 95% CI) | 0.0 [0.0, 0.0] |
| 26.3 mixed urinary incontinence | 2 | 130 | Risk Ratio (M‐H, Fixed, 95% CI) | 0.2 [0.01, 3.97] |
| 27 Condition‐specific measures to assess quality of life: UDI‐6 Show forest plot | 1 | 63 | Mean Difference (IV, Fixed, 95% CI) | 7.30 [‐2.00, 16.60] |
| Analysis 16.27  Comparison 16 Traditional suburethral sling operation versus a mid‐urethral sling or tape, Outcome 27 Condition‐specific measures to assess quality of life: UDI‐6. | ||||
| 27.1 urodynamic stress incontinence (only) | 0 | 0 | Mean Difference (IV, Fixed, 95% CI) | 0.0 [0.0, 0.0] |
| 27.2 stress urinary incontinence (symptoms only) | 1 | 63 | Mean Difference (IV, Fixed, 95% CI) | 7.30 [‐2.00, 16.60] |
| 27.3 mixed urinary incontinence | 0 | 0 | Mean Difference (IV, Fixed, 95% CI) | 0.0 [0.0, 0.0] |
| 28 Condition‐specific measures to assess quality of life: IIQ‐7 Show forest plot | 1 | 63 | Mean Difference (IV, Fixed, 95% CI) | 0.60 [‐10.17, 11.37] |
| Analysis 16.28  Comparison 16 Traditional suburethral sling operation versus a mid‐urethral sling or tape, Outcome 28 Condition‐specific measures to assess quality of life: IIQ‐7. | ||||
| 28.1 urodynamic stress incontinence (only) | 0 | 0 | Mean Difference (IV, Fixed, 95% CI) | 0.0 [0.0, 0.0] |
| 28.2 stress urinary incontinence (symptoms only) | 1 | 63 | Mean Difference (IV, Fixed, 95% CI) | 0.60 [‐10.17, 11.37] |
| 28.3 mixed urinary incontinence | 0 | 0 | Mean Difference (IV, Fixed, 95% CI) | 0.0 [0.0, 0.0] |
| Outcome or subgroup title | No. of studies | No. of participants | Statistical method | Effect size |
| 1 Number of women with urinary incontinence in the medium term (1 to 5 years) Show forest plot | 1 | Risk Ratio (M‐H, Fixed, 95% CI) | Totals not selected | |
| Analysis 17.1  Comparison 17 Traditional suburethral sling operation versus a single‐incision sling (mini‐sling), Outcome 1 Number of women with urinary incontinence in the medium term (1 to 5 years). | ||||
| 1.1 urodynamic stress incontinence (only) | 1 | Risk Ratio (M‐H, Fixed, 95% CI) | 0.0 [0.0, 0.0] | |
| 1.2 stress urinary incontinence (symptoms only) | 0 | Risk Ratio (M‐H, Fixed, 95% CI) | 0.0 [0.0, 0.0] | |
| 1.3 mixed incontinence | 0 | Risk Ratio (M‐H, Fixed, 95% CI) | 0.0 [0.0, 0.0] | |
| 2 Number of women not satisfied within first year Show forest plot | 1 | Risk Ratio (M‐H, Fixed, 95% CI) | Totals not selected | |
| Analysis 17.2  Comparison 17 Traditional suburethral sling operation versus a single‐incision sling (mini‐sling), Outcome 2 Number of women not satisfied within first year. | ||||
| 2.1 urodynamic stress incontinence (only) | 1 | Risk Ratio (M‐H, Fixed, 95% CI) | 0.0 [0.0, 0.0] | |
| 2.2 stress urinary incontinence (symptoms only) | 0 | Risk Ratio (M‐H, Fixed, 95% CI) | 0.0 [0.0, 0.0] | |
| 2.3 mixed incontinence | 0 | Risk Ratio (M‐H, Fixed, 95% CI) | 0.0 [0.0, 0.0] | |
| 3 Number of women with urinary incontinence (clinician's observations) within first year Show forest plot | 1 | Risk Ratio (M‐H, Fixed, 95% CI) | Totals not selected | |
| Analysis 17.3  Comparison 17 Traditional suburethral sling operation versus a single‐incision sling (mini‐sling), Outcome 3 Number of women with urinary incontinence (clinician's observations) within first year. | ||||
| 3.1 urodynamic stress incontinence (only) | 1 | Risk Ratio (M‐H, Fixed, 95% CI) | 0.0 [0.0, 0.0] | |
| 3.2 stress urinary incontinence (symptoms only) | 0 | Risk Ratio (M‐H, Fixed, 95% CI) | 0.0 [0.0, 0.0] | |
| 3.3 mixed incontinence | 0 | Risk Ratio (M‐H, Fixed, 95% CI) | 0.0 [0.0, 0.0] | |
| 4 CURE: number of women cured at > 1 year (women's observations) Show forest plot | 1 | Odds Ratio (M‐H, Fixed, 95% CI) | Totals not selected | |
| Analysis 17.4  Comparison 17 Traditional suburethral sling operation versus a single‐incision sling (mini‐sling), Outcome 4 CURE: number of women cured at > 1 year (women's observations). | ||||
| 4.1 urodynamic stress incontinence (only) | 1 | Odds Ratio (M‐H, Fixed, 95% CI) | 0.0 [0.0, 0.0] | |
| 4.2 stress urinary incontinence (symptoms only) | 0 | Odds Ratio (M‐H, Fixed, 95% CI) | 0.0 [0.0, 0.0] | |
| 4.3 mixed incontinence | 0 | Odds Ratio (M‐H, Fixed, 95% CI) | 0.0 [0.0, 0.0] | |
| 5 Bladder perforation Show forest plot | 1 | Risk Ratio (M‐H, Fixed, 95% CI) | Totals not selected | |
| Analysis 17.5  Comparison 17 Traditional suburethral sling operation versus a single‐incision sling (mini‐sling), Outcome 5 Bladder perforation. | ||||
| 5.1 urodynamic stress incontinence (only) | 1 | Risk Ratio (M‐H, Fixed, 95% CI) | 0.0 [0.0, 0.0] | |
| 5.2 stress urinary incontinence (symptoms only) | 0 | Risk Ratio (M‐H, Fixed, 95% CI) | 0.0 [0.0, 0.0] | |
| 5.3 mixed incontinence | 0 | Risk Ratio (M‐H, Fixed, 95% CI) | 0.0 [0.0, 0.0] | |
| 6 Urge urinary symptoms, urgency urinary incontinence Show forest plot | 1 | Risk Ratio (M‐H, Fixed, 95% CI) | Totals not selected | |
| Analysis 17.6  Comparison 17 Traditional suburethral sling operation versus a single‐incision sling (mini‐sling), Outcome 6 Urge urinary symptoms, urgency urinary incontinence. | ||||
| 6.1 urodynamic stress incontinence (only) | 1 | Risk Ratio (M‐H, Fixed, 95% CI) | 0.0 [0.0, 0.0] | |
| 6.2 stress urinary incontinence (symptoms only) | 0 | Risk Ratio (M‐H, Fixed, 95% CI) | 0.0 [0.0, 0.0] | |
| 6.3 mixed incontinence | 0 | Risk Ratio (M‐H, Fixed, 95% CI) | 0.0 [0.0, 0.0] | |
| 7 Pain with intercourse (dyspareunia) Show forest plot | 1 | Risk Ratio (M‐H, Fixed, 95% CI) | Totals not selected | |
| Analysis 17.7  Comparison 17 Traditional suburethral sling operation versus a single‐incision sling (mini‐sling), Outcome 7 Pain with intercourse (dyspareunia). | ||||
| 7.1 urodynamic stress incontinence (only) | 1 | Risk Ratio (M‐H, Fixed, 95% CI) | 0.0 [0.0, 0.0] | |
| 7.2 stress urinary incontinence (symptoms only) | 0 | Risk Ratio (M‐H, Fixed, 95% CI) | 0.0 [0.0, 0.0] | |
| 7.3 mixed incontinence | 0 | Risk Ratio (M‐H, Fixed, 95% CI) | 0.0 [0.0, 0.0] | |
| 8 Long‐term adverse effects (vaginal mesh or graft exposure) Show forest plot | 1 | Risk Ratio (M‐H, Fixed, 95% CI) | Totals not selected | |
| Analysis 17.8  Comparison 17 Traditional suburethral sling operation versus a single‐incision sling (mini‐sling), Outcome 8 Long‐term adverse effects (vaginal mesh or graft exposure). | ||||
| 8.1 urodynamic stress incontinence (only) | 1 | Risk Ratio (M‐H, Fixed, 95% CI) | 0.0 [0.0, 0.0] | |
| 8.2 stress urinary incontinence (symptoms only) | 0 | Risk Ratio (M‐H, Fixed, 95% CI) | 0.0 [0.0, 0.0] | |
| 8.3 mixed incontinence | 0 | Risk Ratio (M‐H, Fixed, 95% CI) | 0.0 [0.0, 0.0] | |
| 9 Condition‐specific measures to assess quality of life: IIQ score Show forest plot | 1 | Mean Difference (IV, Fixed, 95% CI) | Totals not selected | |
| Analysis 17.9  Comparison 17 Traditional suburethral sling operation versus a single‐incision sling (mini‐sling), Outcome 9 Condition‐specific measures to assess quality of life: IIQ score. | ||||
| 9.1 urodynamic stress incontinence (only) | 1 | Mean Difference (IV, Fixed, 95% CI) | 0.0 [0.0, 0.0] | |
| 9.2 stress urinary incontinence (symptoms only) | 0 | Mean Difference (IV, Fixed, 95% CI) | 0.0 [0.0, 0.0] | |
| 9.3 mixed urinary incontinence | 0 | Mean Difference (IV, Fixed, 95% CI) | 0.0 [0.0, 0.0] | |
| Outcome or subgroup title | No. of studies | No. of participants | Statistical method | Effect size |
| 1 Number of women with urinary incontinence (worse, unchanged, or improved) within first year (women's observations) Show forest plot | 5 | Risk Ratio (M‐H, Fixed, 95% CI) | Totals not selected | |
| Analysis 18.1  Comparison 18 One type of traditional sling operation versus another type of traditional sling operation, Outcome 1 Number of women with urinary incontinence (worse, unchanged, or improved) within first year (women's observations). | ||||
| 1.1 fascial sling vs Pelvicol sling | 1 | Risk Ratio (M‐H, Fixed, 95% CI) | 0.0 [0.0, 0.0] | |
| 1.2 standard sling vs short sling | 1 | Risk Ratio (M‐H, Fixed, 95% CI) | 0.0 [0.0, 0.0] | |
| 1.3 autologous fascial sling vs Fortaperm sling | 1 | Risk Ratio (M‐H, Fixed, 95% CI) | 0.0 [0.0, 0.0] | |
| 1.4 Vypro vs Ultrapro | 1 | Risk Ratio (M‐H, Fixed, 95% CI) | 0.0 [0.0, 0.0] | |
| 1.5 Vypro vs Prolene light | 1 | Risk Ratio (M‐H, Fixed, 95% CI) | 0.0 [0.0, 0.0] | |
| 1.6 Ultrapro vs Prolene light | 1 | Risk Ratio (M‐H, Fixed, 95% CI) | 0.0 [0.0, 0.0] | |
| 1.7 fascial sling vs vaginal wall sling | 1 | Risk Ratio (M‐H, Fixed, 95% CI) | 0.0 [0.0, 0.0] | |
| 2 Number not improved (worse or unchanged) within first year (women's observations) Show forest plot | 3 | Risk Ratio (M‐H, Fixed, 95% CI) | Totals not selected | |
| Analysis 18.2  Comparison 18 One type of traditional sling operation versus another type of traditional sling operation, Outcome 2 Number not improved (worse or unchanged) within first year (women's observations). | ||||
| 2.1 fascial sling vs Pelvicol sling | 1 | Risk Ratio (M‐H, Fixed, 95% CI) | 0.0 [0.0, 0.0] | |
| 2.2 autologous fascial sling vs Fortaperm sling | 1 | Risk Ratio (M‐H, Fixed, 95% CI) | 0.0 [0.0, 0.0] | |
| 2.3 rectus fascia sling vs Goretex sling | 1 | Risk Ratio (M‐H, Fixed, 95% CI) | 0.0 [0.0, 0.0] | |
| 3 Number of women with urinary incontinence (worse, unchanged, or improved) at 1 to 5 years (women's observations) Show forest plot | 7 | Risk Ratio (M‐H, Fixed, 95% CI) | Totals not selected | |
| Analysis 18.3  Comparison 18 One type of traditional sling operation versus another type of traditional sling operation, Outcome 3 Number of women with urinary incontinence (worse, unchanged, or improved) at 1 to 5 years (women's observations). | ||||
| 3.1 fascial sling vs Pelvicol sling | 1 | Risk Ratio (M‐H, Fixed, 95% CI) | 0.0 [0.0, 0.0] | |
| 3.2 standard sling vs short sling | 1 | Risk Ratio (M‐H, Fixed, 95% CI) | 0.0 [0.0, 0.0] | |
| 3.3 autologous dermal graft patch vs cadaveric fascia lata | 1 | Risk Ratio (M‐H, Fixed, 95% CI) | 0.0 [0.0, 0.0] | |
| 3.4 rectus fascia sling vs Goretex sling | 1 | Risk Ratio (M‐H, Fixed, 95% CI) | 0.0 [0.0, 0.0] | |
| 3.5 Vypro vs Ultrapro | 1 | Risk Ratio (M‐H, Fixed, 95% CI) | 0.0 [0.0, 0.0] | |
| 3.6 Vypro vs Prolene light | 1 | Risk Ratio (M‐H, Fixed, 95% CI) | 0.0 [0.0, 0.0] | |
| 3.7 Ultrapro vs Prolene light | 1 | Risk Ratio (M‐H, Fixed, 95% CI) | 0.0 [0.0, 0.0] | |
| 3.8 anterior vaginal wall sling vs biosynthetic mesh sling | 1 | Risk Ratio (M‐H, Fixed, 95% CI) | 0.0 [0.0, 0.0] | |
| 3.9 anterior rectus sheath sling vs Prolene strip | 1 | Risk Ratio (M‐H, Fixed, 95% CI) | 0.0 [0.0, 0.0] | |
| 3.10 anterior rectus sheath sling vs anterior vaginal wall patch | 1 | Risk Ratio (M‐H, Fixed, 95% CI) | 0.0 [0.0, 0.0] | |
| 3.11 Prolene strip vs anterior vaginal wall patch | 1 | Risk Ratio (M‐H, Fixed, 95% CI) | 0.0 [0.0, 0.0] | |
| 4 Number not improved (worse or unchanged) after first year (women's observations) Show forest plot | 4 | Risk Ratio (M‐H, Fixed, 95% CI) | Totals not selected | |
| Analysis 18.4  Comparison 18 One type of traditional sling operation versus another type of traditional sling operation, Outcome 4 Number not improved (worse or unchanged) after first year (women's observations). | ||||
| 4.1 fascial sling vs Pelvicol sling | 1 | Risk Ratio (M‐H, Fixed, 95% CI) | 0.0 [0.0, 0.0] | |
| 4.2 autologous dermal graft patch vs cadaveric fascia lata | 1 | Risk Ratio (M‐H, Fixed, 95% CI) | 0.0 [0.0, 0.0] | |
| 4.3 rectus fascia sling vs Goretex sling | 1 | Risk Ratio (M‐H, Fixed, 95% CI) | 0.0 [0.0, 0.0] | |
| 4.4 anterior rectus sheath sling vs Prolene strip | 1 | Risk Ratio (M‐H, Fixed, 95% CI) | 0.0 [0.0, 0.0] | |
| 4.5 anterior rectus sheath sling vs anterior vaginal wall patch | 1 | Risk Ratio (M‐H, Fixed, 95% CI) | 0.0 [0.0, 0.0] | |
| 4.6 Prolene strip vs anterior vaginal wall patch | 1 | Risk Ratio (M‐H, Fixed, 95% CI) | 0.0 [0.0, 0.0] | |
| 5 Number of women with urinary incontinence (worse, unchanged, or improved) after 5 years (women's observations) Show forest plot | 1 | Risk Ratio (M‐H, Fixed, 95% CI) | Totals not selected | |
| Analysis 18.5  Comparison 18 One type of traditional sling operation versus another type of traditional sling operation, Outcome 5 Number of women with urinary incontinence (worse, unchanged, or improved) after 5 years (women's observations). | ||||
| 5.1 standard sling vs short sling | 1 | Risk Ratio (M‐H, Fixed, 95% CI) | 0.0 [0.0, 0.0] | |
| 6 CURE: number of women with urinary incontinence > 1 year (women's observations) Show forest plot | 3 | Odds Ratio (M‐H, Fixed, 95% CI) | Totals not selected | |
| Analysis 18.6  Comparison 18 One type of traditional sling operation versus another type of traditional sling operation, Outcome 6 CURE: number of women with urinary incontinence > 1 year (women's observations). | ||||
| 6.1 fascial sling vs Pelvicol sling | 1 | Odds Ratio (M‐H, Fixed, 95% CI) | 0.0 [0.0, 0.0] | |
| 6.2 standard sling vs short sling | 1 | Odds Ratio (M‐H, Fixed, 95% CI) | 0.0 [0.0, 0.0] | |
| 6.3 autologous dermal graft patch vs cadaveric fascia lata | 1 | Odds Ratio (M‐H, Fixed, 95% CI) | 0.0 [0.0, 0.0] | |
| 7 Number of women not satisfied Show forest plot | 3 | Risk Ratio (M‐H, Fixed, 95% CI) | Totals not selected | |
| Analysis 18.7  Comparison 18 One type of traditional sling operation versus another type of traditional sling operation, Outcome 7 Number of women not satisfied. | ||||
| 7.1 fascial sling vs Pelvicol sling | 1 | Risk Ratio (M‐H, Fixed, 95% CI) | 0.0 [0.0, 0.0] | |
| 7.2 Vypro vs Ultrapro | 1 | Risk Ratio (M‐H, Fixed, 95% CI) | 0.0 [0.0, 0.0] | |
| 7.3 Vypro vs Prolene light | 1 | Risk Ratio (M‐H, Fixed, 95% CI) | 0.0 [0.0, 0.0] | |
| 7.4 Ultrapro vs Prolene light | 1 | Risk Ratio (M‐H, Fixed, 95% CI) | 0.0 [0.0, 0.0] | |
| 7.5 anterior vaginal wall sling vs biosynthetic mesh sling | 1 | Risk Ratio (M‐H, Fixed, 95% CI) | 0.0 [0.0, 0.0] | |
| 8 Pad test of quantified leakage (mean weight of urine loss) at 1 year Show forest plot | 2 | Mean Difference (IV, Fixed, 95% CI) | Totals not selected | |
| Analysis 18.8  Comparison 18 One type of traditional sling operation versus another type of traditional sling operation, Outcome 8 Pad test of quantified leakage (mean weight of urine loss) at 1 year. | ||||
| 8.1 standard sling vs short sling | 1 | Mean Difference (IV, Fixed, 95% CI) | 0.0 [0.0, 0.0] | |
| 8.2 Vypro vs Ultrapro | 1 | Mean Difference (IV, Fixed, 95% CI) | 0.0 [0.0, 0.0] | |
| 8.3 Vypro vs Prolene light | 1 | Mean Difference (IV, Fixed, 95% CI) | 0.0 [0.0, 0.0] | |
| 8.4 Ultrapro vs Prolene light | 1 | Mean Difference (IV, Fixed, 95% CI) | 0.0 [0.0, 0.0] | |
| 9 Pad test of quantified leakage (mean weight of urine loss) at 1 to 5 years Show forest plot | 1 | Mean Difference (IV, Fixed, 95% CI) | Totals not selected | |
| Analysis 18.9  Comparison 18 One type of traditional sling operation versus another type of traditional sling operation, Outcome 9 Pad test of quantified leakage (mean weight of urine loss) at 1 to 5 years. | ||||
| 9.1 Vypro vs Ultrapro | 1 | Mean Difference (IV, Fixed, 95% CI) | 0.0 [0.0, 0.0] | |
| 9.2 Vypro vs Prolene light | 1 | Mean Difference (IV, Fixed, 95% CI) | 0.0 [0.0, 0.0] | |
| 9.3 Ultrapro vs Prolene light | 1 | Mean Difference (IV, Fixed, 95% CI) | 0.0 [0.0, 0.0] | |
| 10 Duration of operation (minutes) Show forest plot | 2 | Mean Difference (IV, Fixed, 95% CI) | Totals not selected | |
| Analysis 18.10  Comparison 18 One type of traditional sling operation versus another type of traditional sling operation, Outcome 10 Duration of operation (minutes). | ||||
| 10.1 standard sling vs short sling | 1 | Mean Difference (IV, Fixed, 95% CI) | 0.0 [0.0, 0.0] | |
| 10.2 anterior rectus sheath sling vs Prolene strip | 1 | Mean Difference (IV, Fixed, 95% CI) | 0.0 [0.0, 0.0] | |
| 10.3 anterior rectus sheath sling vs anterior vaginal wall patch | 1 | Mean Difference (IV, Fixed, 95% CI) | 0.0 [0.0, 0.0] | |
| 10.4 Prolene strip vs anterior vaginal wall patch | 1 | Mean Difference (IV, Fixed, 95% CI) | 0.0 [0.0, 0.0] | |
| 11 Blood loss (mL) Show forest plot | 1 | Mean Difference (IV, Fixed, 95% CI) | Totals not selected | |
| Analysis 18.11  Comparison 18 One type of traditional sling operation versus another type of traditional sling operation, Outcome 11 Blood loss (mL). | ||||
| 11.1 anterior rectus sheath sling vs Prolene strip | 1 | Mean Difference (IV, Fixed, 95% CI) | 0.0 [0.0, 0.0] | |
| 11.2 anterior rectus sheath sling vs anterior vaginal wall patch | 1 | Mean Difference (IV, Fixed, 95% CI) | 0.0 [0.0, 0.0] | |
| 11.3 Prolene strip vs anterior vaginal wall patch | 1 | Mean Difference (IV, Fixed, 95% CI) | 0.0 [0.0, 0.0] | |
| 12 Length of hospital stay (days) Show forest plot | 1 | Mean Difference (IV, Fixed, 95% CI) | Totals not selected | |
| Analysis 18.12  Comparison 18 One type of traditional sling operation versus another type of traditional sling operation, Outcome 12 Length of hospital stay (days). | ||||
| 12.1 anterior rectus sheath sling vs Prolene strip | 1 | Mean Difference (IV, Fixed, 95% CI) | 0.0 [0.0, 0.0] | |
| 12.2 anterior rectus sheath sling vs anterior vaginal wall patch | 1 | Mean Difference (IV, Fixed, 95% CI) | 0.0 [0.0, 0.0] | |
| 12.3 Prolene strip vs anterior vaginal wall patch | 1 | Mean Difference (IV, Fixed, 95% CI) | 0.0 [0.0, 0.0] | |
| 13 Perioperative surgical complications Show forest plot | 3 | Risk Ratio (M‐H, Fixed, 95% CI) | Totals not selected | |
| Analysis 18.13  Comparison 18 One type of traditional sling operation versus another type of traditional sling operation, Outcome 13 Perioperative surgical complications. | ||||
| 13.1 standard sling vs short sling | 1 | Risk Ratio (M‐H, Fixed, 95% CI) | 0.0 [0.0, 0.0] | |
| 13.2 rectus fascia sling vs Goretex sling | 1 | Risk Ratio (M‐H, Fixed, 95% CI) | 0.0 [0.0, 0.0] | |
| 13.3 fascial sling vs vaginal wall sling | 1 | Risk Ratio (M‐H, Fixed, 95% CI) | 0.0 [0.0, 0.0] | |
| 14 Bladder perforation Show forest plot | 3 | Risk Ratio (M‐H, Fixed, 95% CI) | Totals not selected | |
| Analysis 18.14  Comparison 18 One type of traditional sling operation versus another type of traditional sling operation, Outcome 14 Bladder perforation. | ||||
| 14.1 standard sling vs short sling | 1 | Risk Ratio (M‐H, Fixed, 95% CI) | 0.0 [0.0, 0.0] | |
| 14.2 fascial sling vs Pelvicol sling | 1 | Risk Ratio (M‐H, Fixed, 95% CI) | 0.0 [0.0, 0.0] | |
| 14.3 anterior rectus sheath sling vs Prolene strip | 1 | Risk Ratio (M‐H, Fixed, 95% CI) | 0.0 [0.0, 0.0] | |
| 14.4 anterior rectus sheath sling vs anterior vaginal wall patch | 1 | Risk Ratio (M‐H, Fixed, 95% CI) | 0.0 [0.0, 0.0] | |
| 14.5 Prolene strip vs anterior vaginal wall patch | 1 | Risk Ratio (M‐H, Fixed, 95% CI) | 0.0 [0.0, 0.0] | |
| 15 Urinary tract infection Show forest plot | 2 | Risk Ratio (M‐H, Fixed, 95% CI) | Totals not selected | |
| Analysis 18.15  Comparison 18 One type of traditional sling operation versus another type of traditional sling operation, Outcome 15 Urinary tract infection. | ||||
| 15.1 standard sling vs short sling | 1 | Risk Ratio (M‐H, Fixed, 95% CI) | 0.0 [0.0, 0.0] | |
| 15.2 anterior vaginal wall sling vs biosynthetic mesh sling | 1 | Risk Ratio (M‐H, Fixed, 95% CI) | 0.0 [0.0, 0.0] | |
| 16 Vaginal bleeding Show forest plot | 1 | Risk Ratio (M‐H, Fixed, 95% CI) | Totals not selected | |
| Analysis 18.16  Comparison 18 One type of traditional sling operation versus another type of traditional sling operation, Outcome 16 Vaginal bleeding. | ||||
| 16.1 anterior vaginal wall sling vs biosynthetic mesh sling | 1 | Risk Ratio (M‐H, Fixed, 95% CI) | 0.0 [0.0, 0.0] | |
| 17 Long‐term adverse effects (wound pain) Show forest plot | 1 | Risk Ratio (M‐H, Fixed, 95% CI) | Totals not selected | |
| Analysis 18.17  Comparison 18 One type of traditional sling operation versus another type of traditional sling operation, Outcome 17 Long‐term adverse effects (wound pain). | ||||
| 17.1 fascial sling vs Pelvicol sling | 1 | Risk Ratio (M‐H, Fixed, 95% CI) | 0.0 [0.0, 0.0] | |
| 18 Voiding dysfunction Show forest plot | 6 | Risk Ratio (M‐H, Fixed, 95% CI) | Totals not selected | |
| Analysis 18.18  Comparison 18 One type of traditional sling operation versus another type of traditional sling operation, Outcome 18 Voiding dysfunction. | ||||
| 18.1 fascial sling vs Pelvicol sling | 1 | Risk Ratio (M‐H, Fixed, 95% CI) | 0.0 [0.0, 0.0] | |
| 18.2 standard sling vs short sling | 1 | Risk Ratio (M‐H, Fixed, 95% CI) | 0.0 [0.0, 0.0] | |
| 18.3 Vypro vs Ultrapro | 1 | Risk Ratio (M‐H, Fixed, 95% CI) | 0.0 [0.0, 0.0] | |
| 18.4 Vypro vs Prolene light | 1 | Risk Ratio (M‐H, Fixed, 95% CI) | 0.0 [0.0, 0.0] | |
| 18.5 Ultrapro vs Prolene light | 1 | Risk Ratio (M‐H, Fixed, 95% CI) | 0.0 [0.0, 0.0] | |
| 18.6 anterior vaginal wall sling vs biosynthetic mesh sling | 1 | Risk Ratio (M‐H, Fixed, 95% CI) | 0.0 [0.0, 0.0] | |
| 18.7 anterior rectus sheath sling vs Prolene strip | 1 | Risk Ratio (M‐H, Fixed, 95% CI) | 0.0 [0.0, 0.0] | |
| 18.8 anterior rectus sheath sling vs anterior vaginal wall patch | 1 | Risk Ratio (M‐H, Fixed, 95% CI) | 0.0 [0.0, 0.0] | |
| 18.9 Prolene strip vs anterior vaginal wall patch | 1 | Risk Ratio (M‐H, Fixed, 95% CI) | 0.0 [0.0, 0.0] | |
| 18.10 fascial sling vs vaginal wall sling | 1 | Risk Ratio (M‐H, Fixed, 95% CI) | 0.0 [0.0, 0.0] | |
| 19 Long‐term adverse effects (release of sling required) Show forest plot | 1 | Risk Ratio (M‐H, Fixed, 95% CI) | Totals not selected | |
| Analysis 18.19  Comparison 18 One type of traditional sling operation versus another type of traditional sling operation, Outcome 19 Long‐term adverse effects (release of sling required). | ||||
| 19.1 fascial sling vs Pelvicol sling | 1 | Risk Ratio (M‐H, Fixed, 95% CI) | 0.0 [0.0, 0.0] | |
| 20 De novo detrusor urgency or urge symptoms or detrusor overactivity Show forest plot | 4 | Risk Ratio (M‐H, Fixed, 95% CI) | Totals not selected | |
| Analysis 18.20  Comparison 18 One type of traditional sling operation versus another type of traditional sling operation, Outcome 20 De novo detrusor urgency or urge symptoms or detrusor overactivity. | ||||
| 20.1 standard sling vs short sling | 1 | Risk Ratio (M‐H, Fixed, 95% CI) | 0.0 [0.0, 0.0] | |
| 20.2 Vypro vs Ultrapro | 1 | Risk Ratio (M‐H, Fixed, 95% CI) | 0.0 [0.0, 0.0] | |
| 20.3 Vypro vs Prolene light | 1 | Risk Ratio (M‐H, Fixed, 95% CI) | 0.0 [0.0, 0.0] | |
| 20.4 Ultrapro vs Prolene light | 1 | Risk Ratio (M‐H, Fixed, 95% CI) | 0.0 [0.0, 0.0] | |
| 20.5 autologous dermal graft patch vs cadaveric fascia lata | 1 | Risk Ratio (M‐H, Fixed, 95% CI) | 0.0 [0.0, 0.0] | |
| 20.6 rectus fascia sling vs Goretex sling | 1 | Risk Ratio (M‐H, Fixed, 95% CI) | 0.0 [0.0, 0.0] | |
| 21 Repeat surgery for urinary incontinence at first year Show forest plot | 1 | Risk Ratio (M‐H, Fixed, 95% CI) | Totals not selected | |
| Analysis 18.21  Comparison 18 One type of traditional sling operation versus another type of traditional sling operation, Outcome 21 Repeat surgery for urinary incontinence at first year. | ||||
| 21.1 Fascial sling vs Pelvicol sling | 1 | Risk Ratio (M‐H, Fixed, 95% CI) | 0.0 [0.0, 0.0] | |
| 22 Long‐term adverse effects (vaginal mesh or graft exposure) Show forest plot | 3 | Risk Ratio (M‐H, Fixed, 95% CI) | Totals not selected | |
| Analysis 18.22  Comparison 18 One type of traditional sling operation versus another type of traditional sling operation, Outcome 22 Long‐term adverse effects (vaginal mesh or graft exposure). | ||||
| 22.1 fascial sling vs Pelvicol sling | 1 | Risk Ratio (M‐H, Fixed, 95% CI) | 0.0 [0.0, 0.0] | |
| 22.2 Vypro vs Ultrapro | 1 | Risk Ratio (M‐H, Fixed, 95% CI) | 0.0 [0.0, 0.0] | |
| 22.3 Vypro vs Prolene light | 1 | Risk Ratio (M‐H, Fixed, 95% CI) | 0.0 [0.0, 0.0] | |
| 22.4 Ultrapro vs Prolene light | 1 | Risk Ratio (M‐H, Fixed, 95% CI) | 0.0 [0.0, 0.0] | |
| 22.5 anterior vaginal wall sling vs biosynthetic mesh sling | 1 | Risk Ratio (M‐H, Fixed, 95% CI) | 0.0 [0.0, 0.0] | |
| 23 Condition‐specific measures to assess quality of life (ICI‐Q short form UI score at 1 year) Show forest plot | 1 | Mean Difference (IV, Fixed, 95% CI) | Totals not selected | |
| Analysis 18.23  Comparison 18 One type of traditional sling operation versus another type of traditional sling operation, Outcome 23 Condition‐specific measures to assess quality of life (ICI‐Q short form UI score at 1 year). | ||||
| 23.1 Vypro vs Ultrapro | 1 | Mean Difference (IV, Fixed, 95% CI) | 0.0 [0.0, 0.0] | |
| 23.2 Vypro vs Prolene light | 1 | Mean Difference (IV, Fixed, 95% CI) | 0.0 [0.0, 0.0] | |
| 23.3 Ultrapro vs Prolene light | 1 | Mean Difference (IV, Fixed, 95% CI) | 0.0 [0.0, 0.0] | |
| 24 Condition‐specific measures to assess quality of life (ICI‐Q short form UI score at 1 to 5 years) Show forest plot | 1 | Mean Difference (IV, Fixed, 95% CI) | Totals not selected | |
| Analysis 18.24  Comparison 18 One type of traditional sling operation versus another type of traditional sling operation, Outcome 24 Condition‐specific measures to assess quality of life (ICI‐Q short form UI score at 1 to 5 years). | ||||
| 24.1 Vypro vs Ultrapro | 1 | Mean Difference (IV, Fixed, 95% CI) | 0.0 [0.0, 0.0] | |
| 24.2 Vypro vs Prolene light | 1 | Mean Difference (IV, Fixed, 95% CI) | 0.0 [0.0, 0.0] | |
| 24.3 Ultrapro vs Prolene light | 1 | Mean Difference (IV, Fixed, 95% CI) | 0.0 [0.0, 0.0] | |
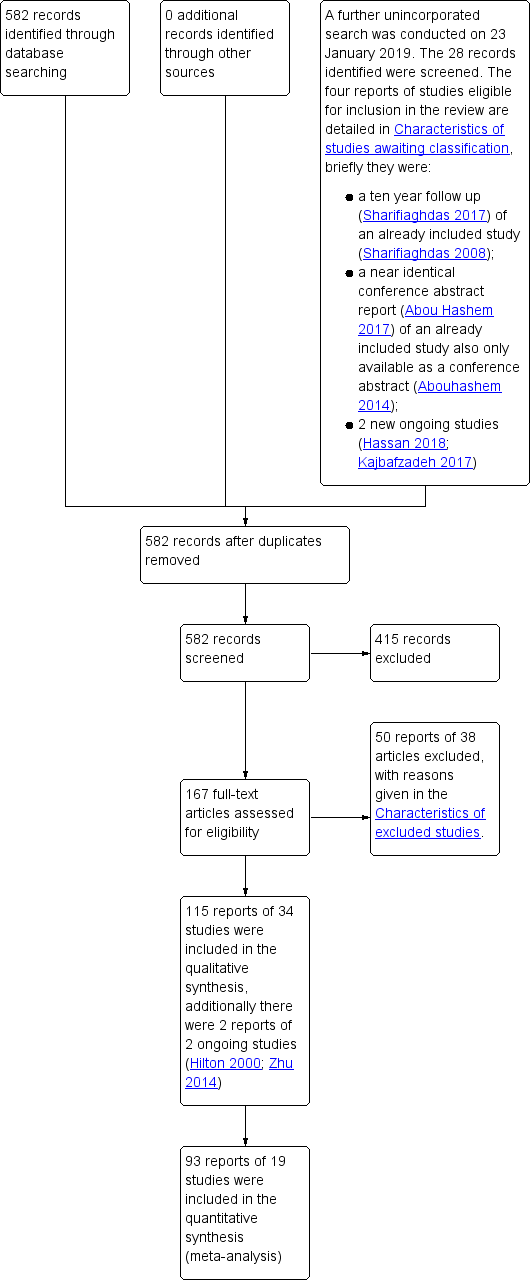
PRISMA study flow diagram ‐ search for clinical effectiveness studies.

PRISMA study flow diagram ‐ search for economic evaluations for the BEC.
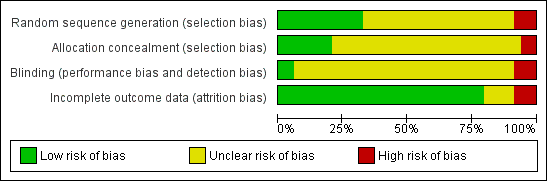
Risk of bias graph: review authors' judgements about each risk of bias item presented as percentages across all included studies.
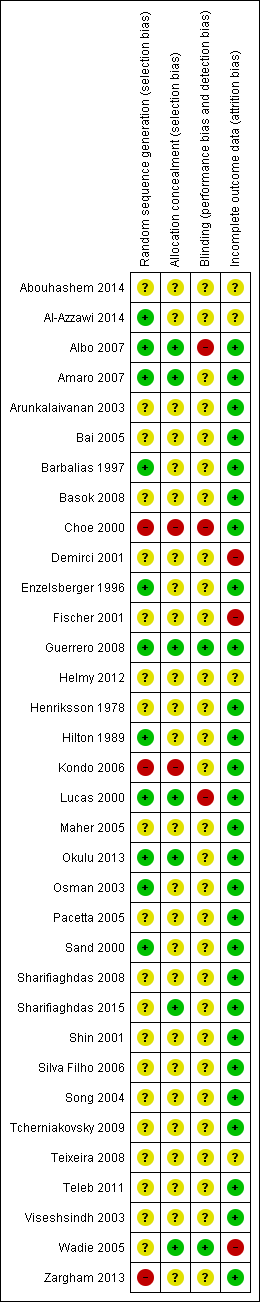
Risk of bias summary: review authors' judgements about each risk of bias item for each included study.
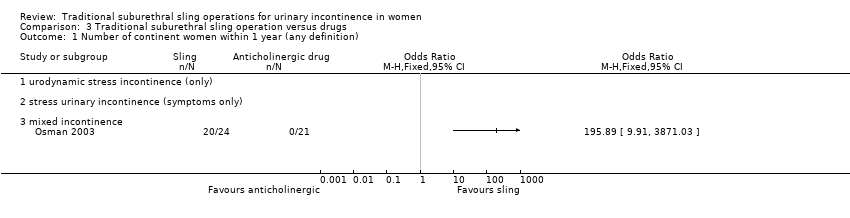
Comparison 3 Traditional suburethral sling operation versus drugs, Outcome 1 Number of continent women within 1 year (any definition).
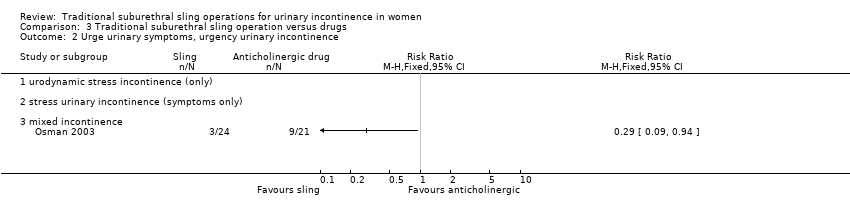
Comparison 3 Traditional suburethral sling operation versus drugs, Outcome 2 Urge urinary symptoms, urgency urinary incontinence.

Comparison 4 Traditional suburethral sling operation versus injectables, Outcome 1 Number of continent women within 1 year (any definition).

Comparison 4 Traditional suburethral sling operation versus injectables, Outcome 2 Number of continent women at 1 to 5 years (any definition).

Comparison 4 Traditional suburethral sling operation versus injectables, Outcome 3 Repeat surgery for urinary incontinence.
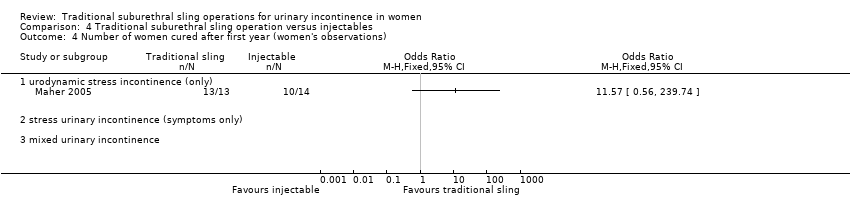
Comparison 4 Traditional suburethral sling operation versus injectables, Outcome 4 Number of women cured after first year (women's observations).
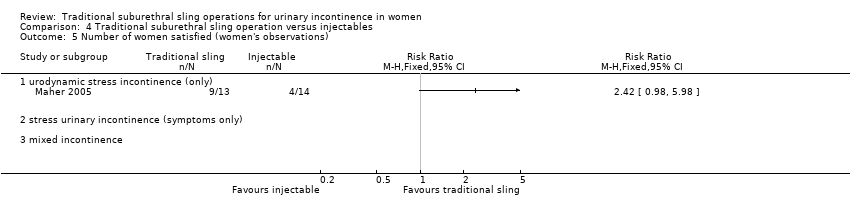
Comparison 4 Traditional suburethral sling operation versus injectables, Outcome 5 Number of women satisfied (women's observations).
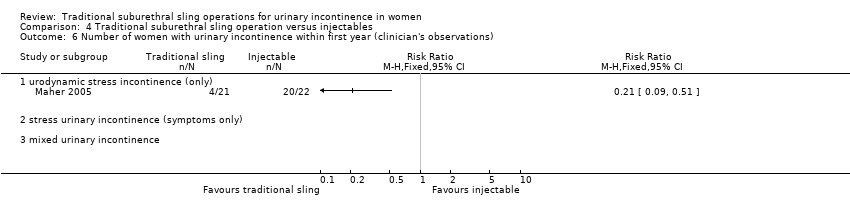
Comparison 4 Traditional suburethral sling operation versus injectables, Outcome 6 Number of women with urinary incontinence within first year (clinician's observations).

Comparison 4 Traditional suburethral sling operation versus injectables, Outcome 7 Urinary tract infection.

Comparison 4 Traditional suburethral sling operation versus injectables, Outcome 8 De novo detrusor overactivity (urodynamic diagnosis).

Comparison 4 Traditional suburethral sling operation versus injectables, Outcome 9 Voiding dysfunction.

Comparison 6 Traditional suburethral sling operation versus bladder neck needle suspension (abdominal and vaginal), Outcome 1 Number of continent women within 1 year (any definition).
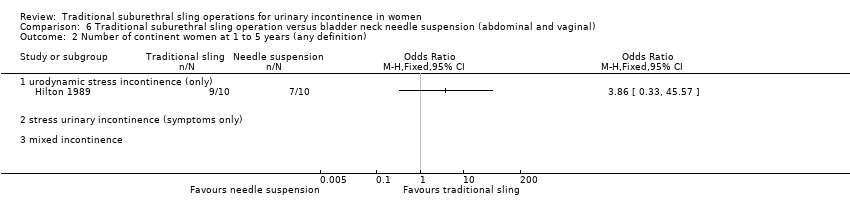
Comparison 6 Traditional suburethral sling operation versus bladder neck needle suspension (abdominal and vaginal), Outcome 2 Number of continent women at 1 to 5 years (any definition).
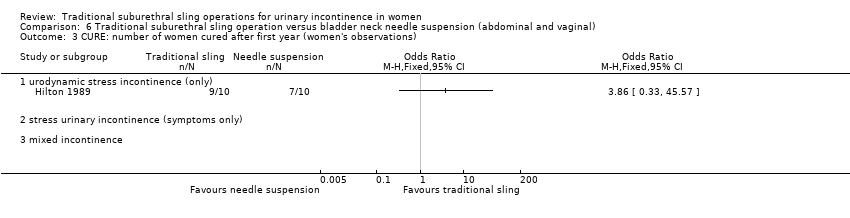
Comparison 6 Traditional suburethral sling operation versus bladder neck needle suspension (abdominal and vaginal), Outcome 3 CURE: number of women cured after first year (women's observations).

Comparison 6 Traditional suburethral sling operation versus bladder neck needle suspension (abdominal and vaginal), Outcome 4 Length of hospital stay (hours).

Comparison 6 Traditional suburethral sling operation versus bladder neck needle suspension (abdominal and vaginal), Outcome 5 Perioperative surgical complications.

Comparison 6 Traditional suburethral sling operation versus bladder neck needle suspension (abdominal and vaginal), Outcome 6 Urinary urgency symptoms, urgency urinary incontinence.

Comparison 6 Traditional suburethral sling operation versus bladder neck needle suspension (abdominal and vaginal), Outcome 7 Detrusor overactivity (urodynamic diagnosis).

Comparison 6 Traditional suburethral sling operation versus bladder neck needle suspension (abdominal and vaginal), Outcome 8 Voiding dysfunction after 3 months.
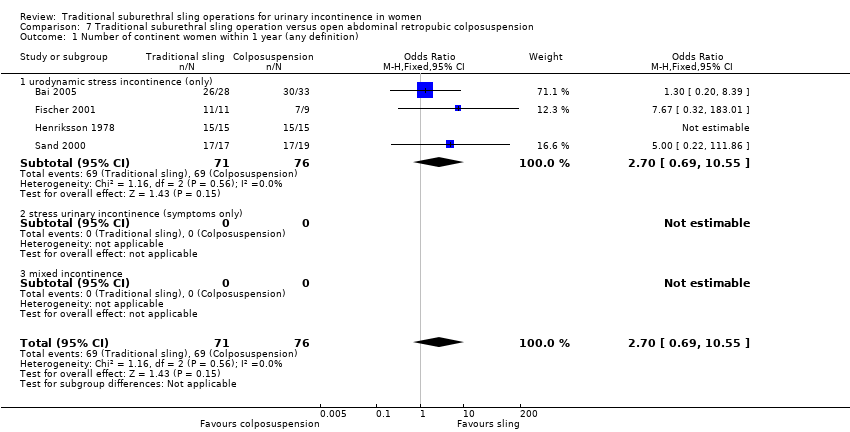
Comparison 7 Traditional suburethral sling operation versus open abdominal retropubic colposuspension, Outcome 1 Number of continent women within 1 year (any definition).

Comparison 7 Traditional suburethral sling operation versus open abdominal retropubic colposuspension, Outcome 2 Number of continent women at 1 to 5 years (any definition).
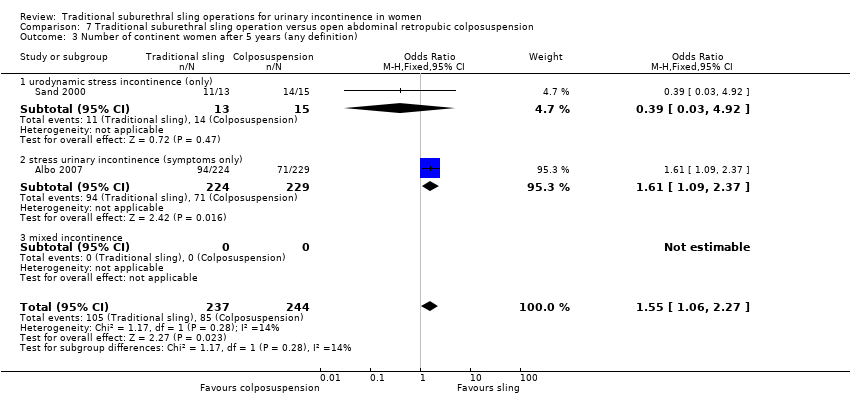
Comparison 7 Traditional suburethral sling operation versus open abdominal retropubic colposuspension, Outcome 3 Number of continent women after 5 years (any definition).

Comparison 7 Traditional suburethral sling operation versus open abdominal retropubic colposuspension, Outcome 4 Repeat surgery for urinary incontinence.

Comparison 7 Traditional suburethral sling operation versus open abdominal retropubic colposuspension, Outcome 5 Number of women cured after first year (women's observations).

Comparison 7 Traditional suburethral sling operation versus open abdominal retropubic colposuspension, Outcome 6 Number of women satisfied (women's observations).
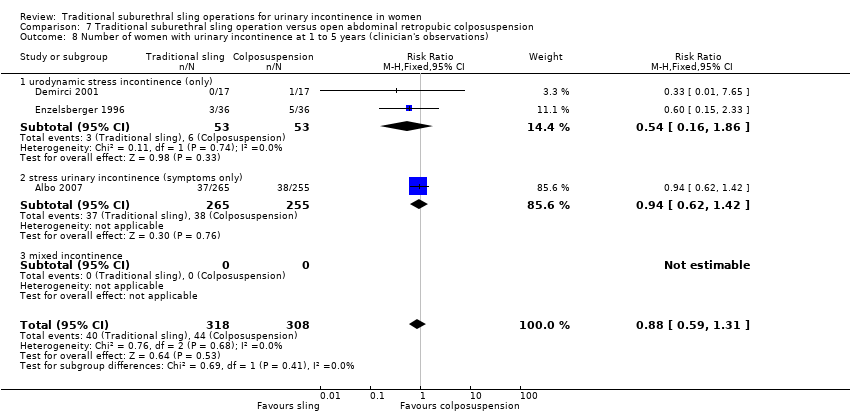
Comparison 7 Traditional suburethral sling operation versus open abdominal retropubic colposuspension, Outcome 8 Number of women with urinary incontinence at 1 to 5 years (clinician's observations).
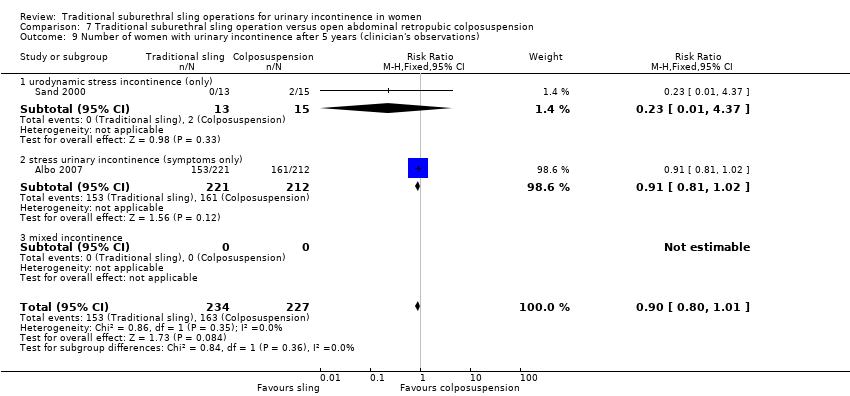
Comparison 7 Traditional suburethral sling operation versus open abdominal retropubic colposuspension, Outcome 9 Number of women with urinary incontinence after 5 years (clinician's observations).
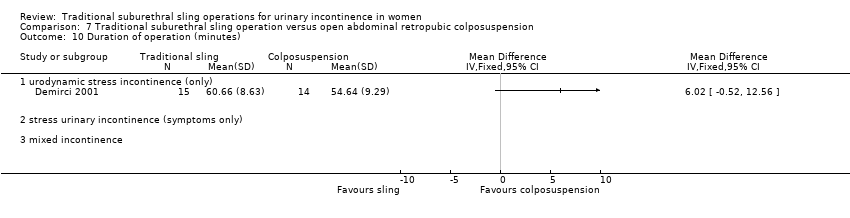
Comparison 7 Traditional suburethral sling operation versus open abdominal retropubic colposuspension, Outcome 10 Duration of operation (minutes).

Comparison 7 Traditional suburethral sling operation versus open abdominal retropubic colposuspension, Outcome 11 Length of hospital stay (days).

Comparison 7 Traditional suburethral sling operation versus open abdominal retropubic colposuspension, Outcome 12 Time to catheter removal (days).
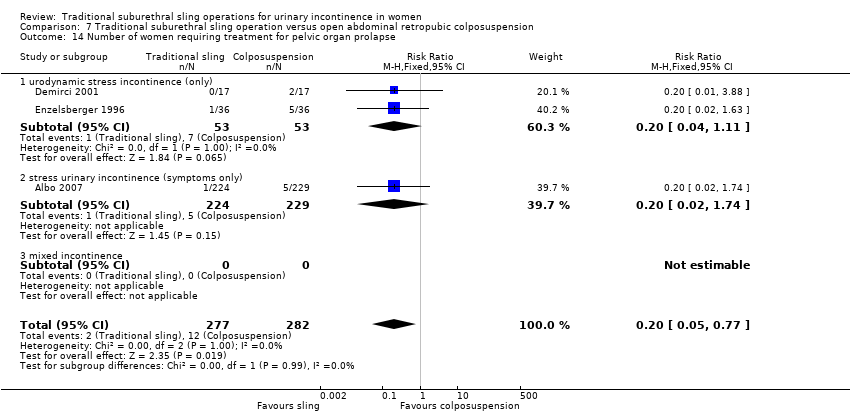
Comparison 7 Traditional suburethral sling operation versus open abdominal retropubic colposuspension, Outcome 14 Number of women requiring treatment for pelvic organ prolapse.

Comparison 7 Traditional suburethral sling operation versus open abdominal retropubic colposuspension, Outcome 15 Perioperative surgical complications.

Comparison 7 Traditional suburethral sling operation versus open abdominal retropubic colposuspension, Outcome 16 Bladder perforation.
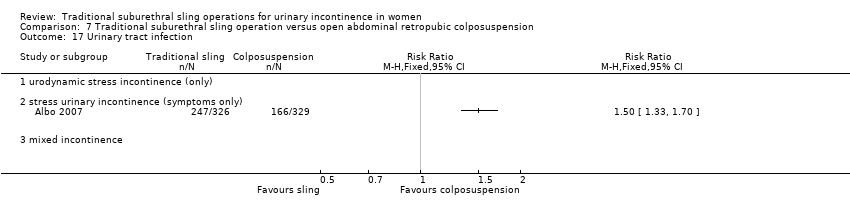
Comparison 7 Traditional suburethral sling operation versus open abdominal retropubic colposuspension, Outcome 17 Urinary tract infection.
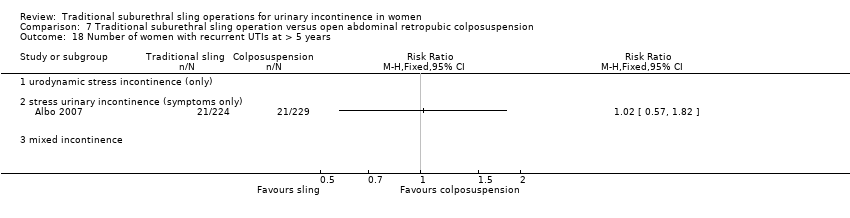
Comparison 7 Traditional suburethral sling operation versus open abdominal retropubic colposuspension, Outcome 18 Number of women with recurrent UTIs at > 5 years.

Comparison 7 Traditional suburethral sling operation versus open abdominal retropubic colposuspension, Outcome 19 Urinary urgency symptoms, urgency urinary incontinence.
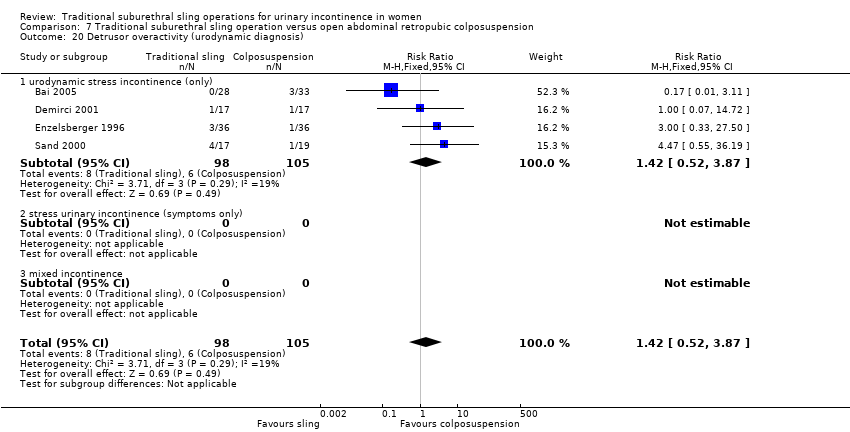
Comparison 7 Traditional suburethral sling operation versus open abdominal retropubic colposuspension, Outcome 20 Detrusor overactivity (urodynamic diagnosis).

Comparison 7 Traditional suburethral sling operation versus open abdominal retropubic colposuspension, Outcome 21 Voiding dysfunction after 3 months.

Comparison 7 Traditional suburethral sling operation versus open abdominal retropubic colposuspension, Outcome 22 Long‐term voiding dysfunction > 5 years.
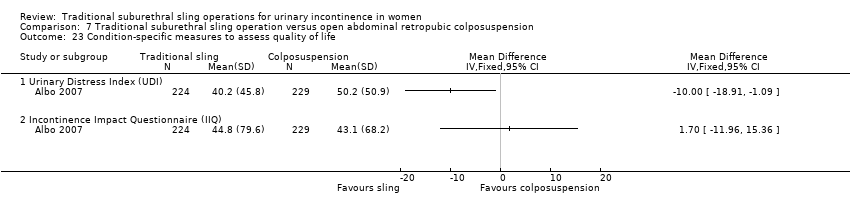
Comparison 7 Traditional suburethral sling operation versus open abdominal retropubic colposuspension, Outcome 23 Condition‐specific measures to assess quality of life.

Comparison 9 Traditional suburethral sling operation versus mid‐urethral sling or tape, Outcome 1 Number of continent women within 1 year (any definition).
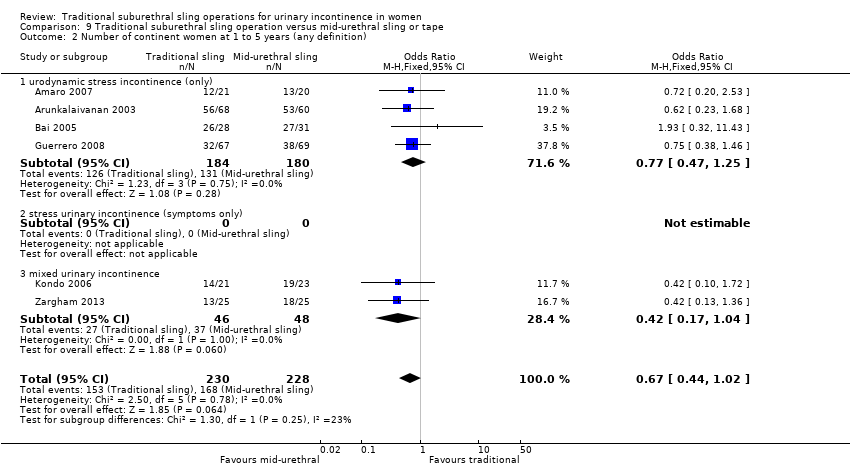
Comparison 9 Traditional suburethral sling operation versus mid‐urethral sling or tape, Outcome 2 Number of continent women at 1 to 5 years (any definition).
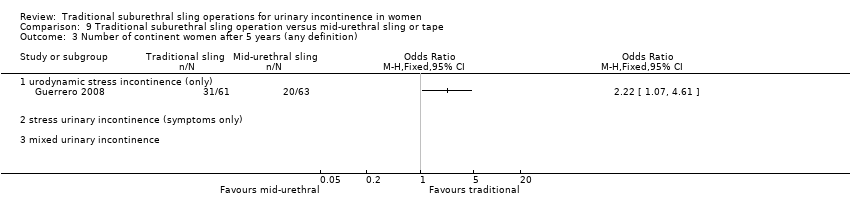
Comparison 9 Traditional suburethral sling operation versus mid‐urethral sling or tape, Outcome 3 Number of continent women after 5 years (any definition).

Comparison 9 Traditional suburethral sling operation versus mid‐urethral sling or tape, Outcome 4 Repeat surgery for urinary incontinence.
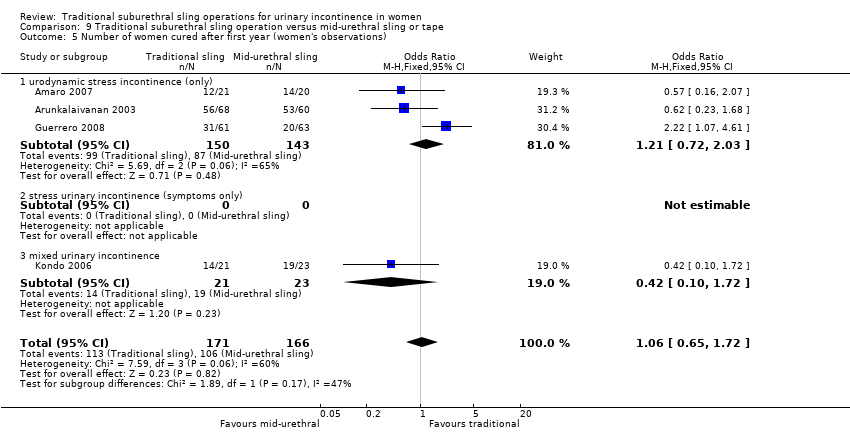
Comparison 9 Traditional suburethral sling operation versus mid‐urethral sling or tape, Outcome 5 Number of women cured after first year (women's observations).

Comparison 9 Traditional suburethral sling operation versus mid‐urethral sling or tape, Outcome 6 Number of women improved or cured within 1 year (women's observations).

Comparison 9 Traditional suburethral sling operation versus mid‐urethral sling or tape, Outcome 7 Number of women improved or cured at 1 to 5 years (women's observations).

Comparison 9 Traditional suburethral sling operation versus mid‐urethral sling or tape, Outcome 8 Number of women improved or cured after 5 years (women's observations).

Comparison 9 Traditional suburethral sling operation versus mid‐urethral sling or tape, Outcome 9 Number of women satisfied (women's observations).

Comparison 9 Traditional suburethral sling operation versus mid‐urethral sling or tape, Outcome 10 Pad test of quantified leakage (mean weight of urine lost).

Comparison 9 Traditional suburethral sling operation versus mid‐urethral sling or tape, Outcome 11 Number of women with urinary incontinence within first year (clinician's observations).
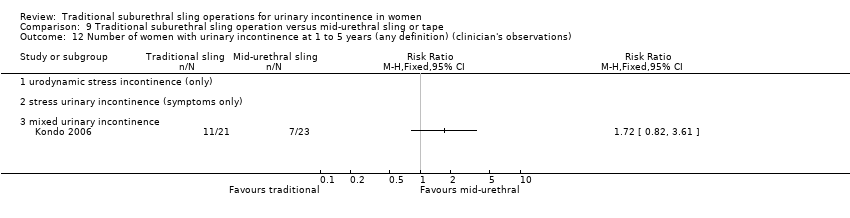
Comparison 9 Traditional suburethral sling operation versus mid‐urethral sling or tape, Outcome 12 Number of women with urinary incontinence at 1 to 5 years (any definition) (clinician's observations).

Comparison 9 Traditional suburethral sling operation versus mid‐urethral sling or tape, Outcome 13 Duration of operation (minutes).

Comparison 9 Traditional suburethral sling operation versus mid‐urethral sling or tape, Outcome 14 Length of hospital stay (days).

Comparison 9 Traditional suburethral sling operation versus mid‐urethral sling or tape, Outcome 15 Time to catheter removal (days).

Comparison 9 Traditional suburethral sling operation versus mid‐urethral sling or tape, Outcome 16 Perioperative surgical complications.

Comparison 9 Traditional suburethral sling operation versus mid‐urethral sling or tape, Outcome 17 Bladder perforations.

Comparison 9 Traditional suburethral sling operation versus mid‐urethral sling or tape, Outcome 18 Urethral injury.
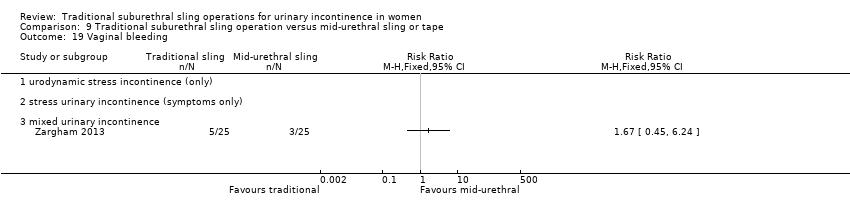
Comparison 9 Traditional suburethral sling operation versus mid‐urethral sling or tape, Outcome 19 Vaginal bleeding.

Comparison 9 Traditional suburethral sling operation versus mid‐urethral sling or tape, Outcome 20 Urinary tract infection.

Comparison 9 Traditional suburethral sling operation versus mid‐urethral sling or tape, Outcome 21 Voiding dysfunction.

Comparison 9 Traditional suburethral sling operation versus mid‐urethral sling or tape, Outcome 22 Urinary urgency symptoms, urgency urinary incontinence.

Comparison 9 Traditional suburethral sling operation versus mid‐urethral sling or tape, Outcome 23 De novo detrusor overactivity (urodynamic diagnosis).

Comparison 9 Traditional suburethral sling operation versus mid‐urethral sling or tape, Outcome 24 Long‐term adverse effects (release of sling required).

Comparison 9 Traditional suburethral sling operation versus mid‐urethral sling or tape, Outcome 25 Long‐term adverse effects (wound pain at 6 months).

Comparison 9 Traditional suburethral sling operation versus mid‐urethral sling or tape, Outcome 26 Long‐term adverse effects (vaginal mesh or graft exposure).

Comparison 9 Traditional suburethral sling operation versus mid‐urethral sling or tape, Outcome 27 Condition‐specific measures to assess quality of life: UDI‐6.

Comparison 9 Traditional suburethral sling operation versus mid‐urethral sling or tape, Outcome 28 Condition‐specific measures to assess quality of life: IIQ‐7.
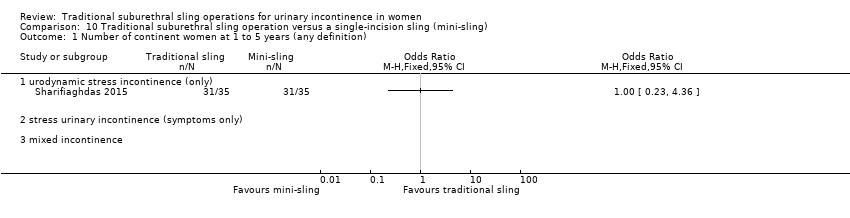
Comparison 10 Traditional suburethral sling operation versus a single‐incision sling (mini‐sling), Outcome 1 Number of continent women at 1 to 5 years (any definition).
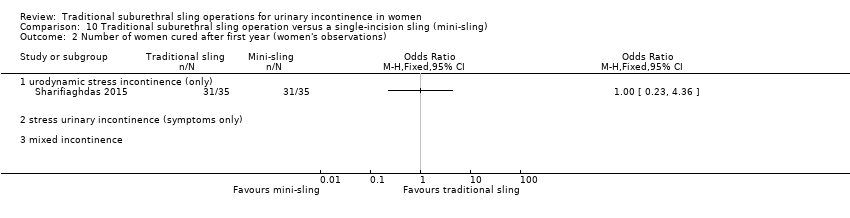
Comparison 10 Traditional suburethral sling operation versus a single‐incision sling (mini‐sling), Outcome 2 Number of women cured after first year (women's observations).

Comparison 10 Traditional suburethral sling operation versus a single‐incision sling (mini‐sling), Outcome 3 Number of women satisfied (women's observations).
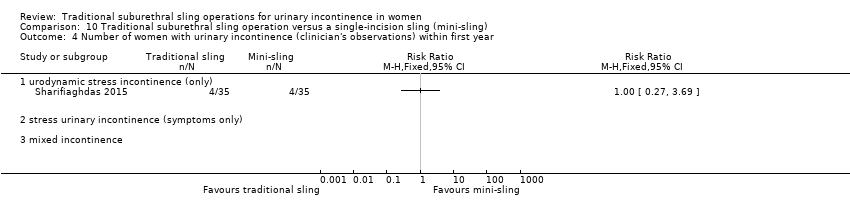
Comparison 10 Traditional suburethral sling operation versus a single‐incision sling (mini‐sling), Outcome 4 Number of women with urinary incontinence (clinician's observations) within first year.
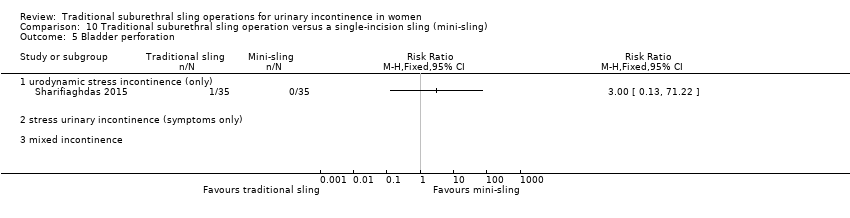
Comparison 10 Traditional suburethral sling operation versus a single‐incision sling (mini‐sling), Outcome 5 Bladder perforation.

Comparison 10 Traditional suburethral sling operation versus a single‐incision sling (mini‐sling), Outcome 6 Urinary urgency symptoms, urgency urinary incontinence.

Comparison 10 Traditional suburethral sling operation versus a single‐incision sling (mini‐sling), Outcome 7 Pain with intercourse (dyspareunia).

Comparison 10 Traditional suburethral sling operation versus a single‐incision sling (mini‐sling), Outcome 8 Long‐term adverse effects (vaginal mesh or graft exposure).

Comparison 10 Traditional suburethral sling operation versus a single‐incision sling (mini‐sling), Outcome 9 Condition‐specific measures to assess quality of life: IIQ score.

Comparison 11 One type of traditional sling operation versus another type of traditional sling operation, Outcome 1 Number of continent women within 1 year (any definition).
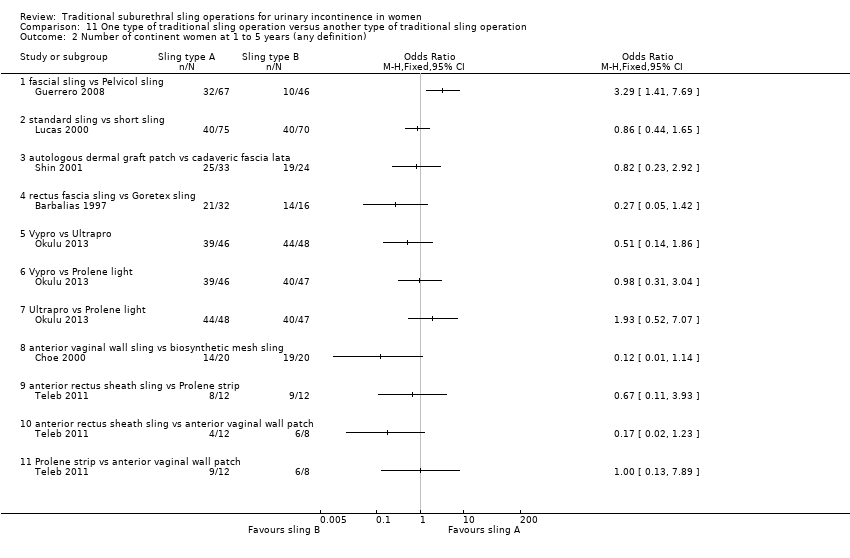
Comparison 11 One type of traditional sling operation versus another type of traditional sling operation, Outcome 2 Number of continent women at 1 to 5 years (any definition).
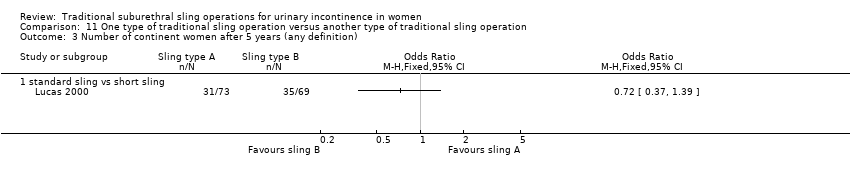
Comparison 11 One type of traditional sling operation versus another type of traditional sling operation, Outcome 3 Number of continent women after 5 years (any definition).
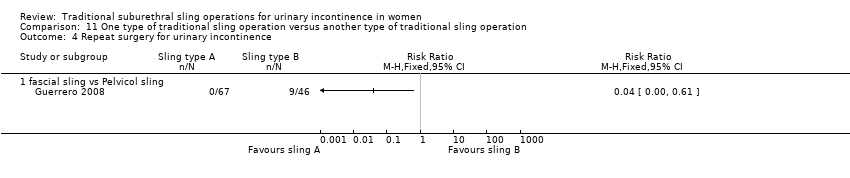
Comparison 11 One type of traditional sling operation versus another type of traditional sling operation, Outcome 4 Repeat surgery for urinary incontinence.
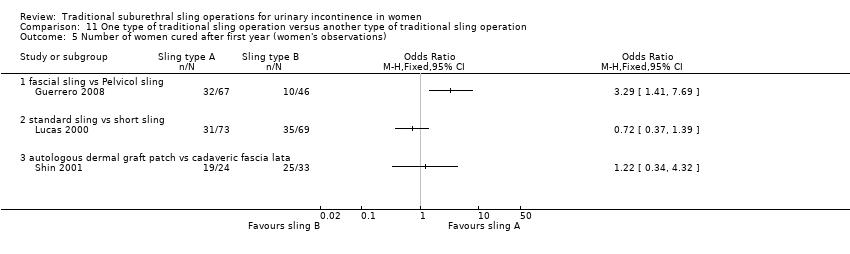
Comparison 11 One type of traditional sling operation versus another type of traditional sling operation, Outcome 5 Number of women cured after first year (women's observations).
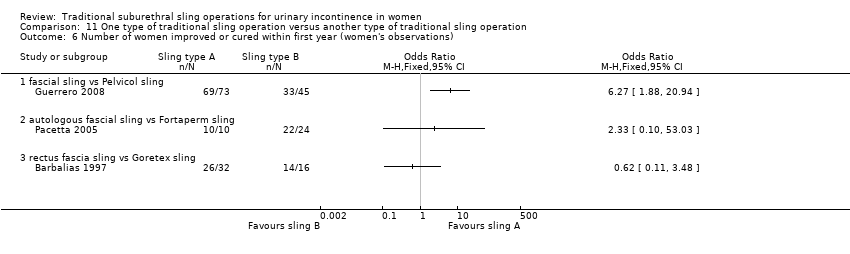
Comparison 11 One type of traditional sling operation versus another type of traditional sling operation, Outcome 6 Number of women improved or cured within first year (women's observations).

Comparison 11 One type of traditional sling operation versus another type of traditional sling operation, Outcome 7 Number of women improved or cured at 1 to 5 years (women's observations).
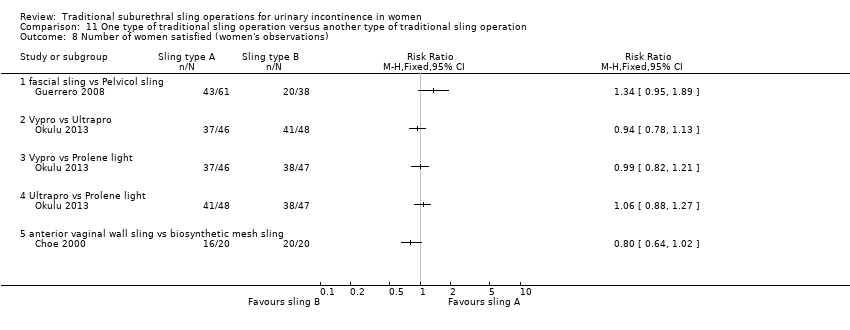
Comparison 11 One type of traditional sling operation versus another type of traditional sling operation, Outcome 8 Number of women satisfied (women's observations).

Comparison 11 One type of traditional sling operation versus another type of traditional sling operation, Outcome 9 Pad test of quantified leakage (mean weight of urine lost) within 1 year.

Comparison 11 One type of traditional sling operation versus another type of traditional sling operation, Outcome 10 Pad test of quantified leakage (mean weight of urine lost) at 1 to 5 years.

Comparison 11 One type of traditional sling operation versus another type of traditional sling operation, Outcome 11 Duration of operation (minutes).

Comparison 11 One type of traditional sling operation versus another type of traditional sling operation, Outcome 12 Blood loss (mL).

Comparison 11 One type of traditional sling operation versus another type of traditional sling operation, Outcome 13 Length of hospital stay (days).

Comparison 11 One type of traditional sling operation versus another type of traditional sling operation, Outcome 14 Perioperative surgical complications.

Comparison 11 One type of traditional sling operation versus another type of traditional sling operation, Outcome 15 Bladder perforation.

Comparison 11 One type of traditional sling operation versus another type of traditional sling operation, Outcome 16 Urinary tract infection.

Comparison 11 One type of traditional sling operation versus another type of traditional sling operation, Outcome 17 Vaginal bleeding.

Comparison 11 One type of traditional sling operation versus another type of traditional sling operation, Outcome 18 Long‐term adverse effects (wound pain).
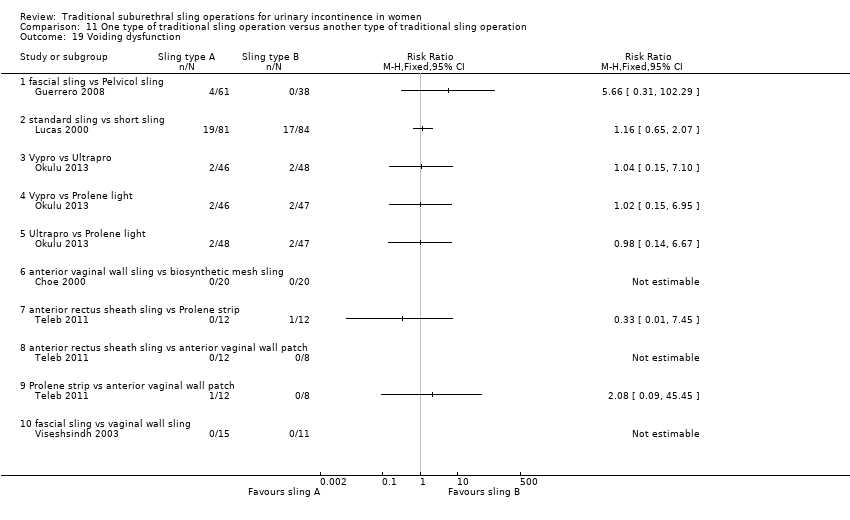
Comparison 11 One type of traditional sling operation versus another type of traditional sling operation, Outcome 19 Voiding dysfunction.

Comparison 11 One type of traditional sling operation versus another type of traditional sling operation, Outcome 20 Urinary urgency symptoms, urgency urinary incontinence.

Comparison 11 One type of traditional sling operation versus another type of traditional sling operation, Outcome 21 Detrusor overactivity (urodynamic overactivity).

Comparison 11 One type of traditional sling operation versus another type of traditional sling operation, Outcome 22 Long‐term adverse effects (release of sling required).

Comparison 11 One type of traditional sling operation versus another type of traditional sling operation, Outcome 23 Long‐term adverse effects (vaginal mesh or graft exposure).

Comparison 11 One type of traditional sling operation versus another type of traditional sling operation, Outcome 24 Condition‐specific measures to assess quality of life (ICI‐Q short form UI score at 1 year).

Comparison 11 One type of traditional sling operation versus another type of traditional sling operation, Outcome 25 Condition‐specific measures to assess quality of life (ICI‐Q short form UI score at 1 to 5 years).
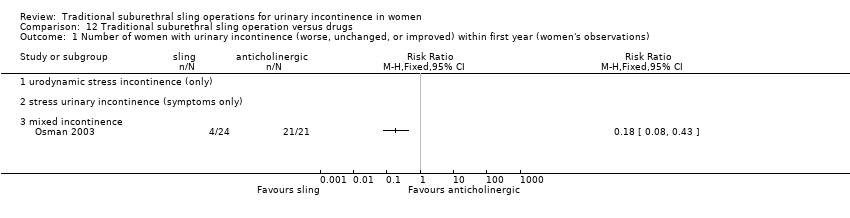
Comparison 12 Traditional suburethral sling operation versus drugs, Outcome 1 Number of women with urinary incontinence (worse, unchanged, or improved) within first year (women's observations).

Comparison 12 Traditional suburethral sling operation versus drugs, Outcome 2 Urge urinary symptoms, urgency urinary incontinence.
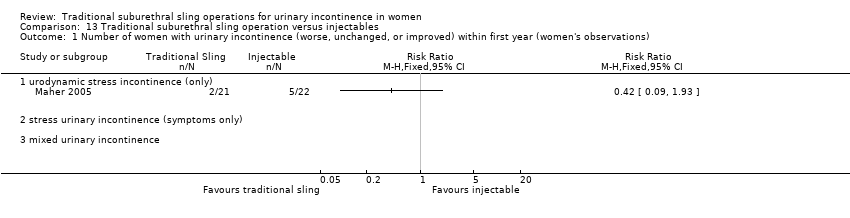
Comparison 13 Traditional suburethral sling operation versus injectables, Outcome 1 Number of women with urinary incontinence (worse, unchanged, or improved) within first year (women's observations).

Comparison 13 Traditional suburethral sling operation versus injectables, Outcome 2 Number of women with urinary incontinence (worse, unchanged, or improved) after first year (women's observations).

Comparison 13 Traditional suburethral sling operation versus injectables, Outcome 3 Number of women with urinary incontinence (clinician's observations) within first year.

Comparison 13 Traditional suburethral sling operation versus injectables, Outcome 4 CURE: number of women cured after first year (women's observations).

Comparison 13 Traditional suburethral sling operation versus injectables, Outcome 5 Voiding dysfunction.

Comparison 13 Traditional suburethral sling operation versus injectables, Outcome 6 De novo detrusor overactivity (urodynamic diagnosis).
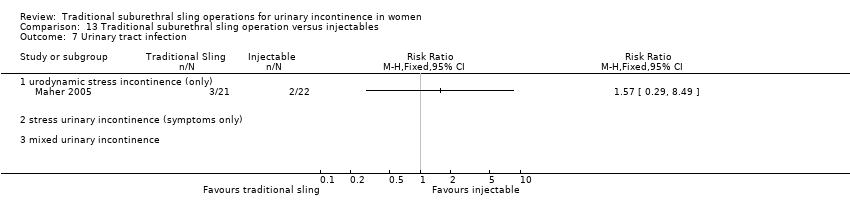
Comparison 13 Traditional suburethral sling operation versus injectables, Outcome 7 Urinary tract infection.

Comparison 13 Traditional suburethral sling operation versus injectables, Outcome 8 Repeat surgery for urinary incontinence.
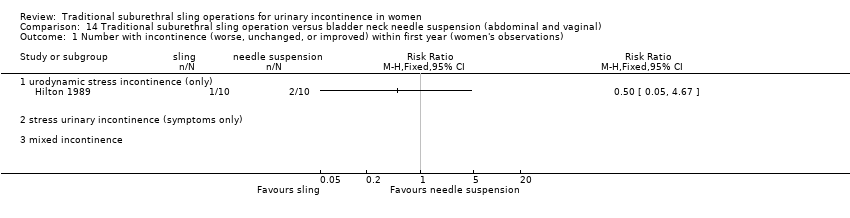
Comparison 14 Traditional suburethral sling operation versus bladder neck needle suspension (abdominal and vaginal), Outcome 1 Number with incontinence (worse, unchanged, or improved) within first year (women's observations).

Comparison 14 Traditional suburethral sling operation versus bladder neck needle suspension (abdominal and vaginal), Outcome 2 Number with incontinence (worse, unchanged, or improved) after first year (women's observations).

Comparison 14 Traditional suburethral sling operation versus bladder neck needle suspension (abdominal and vaginal), Outcome 3 CURE: number of women cured after first year (women's observations).
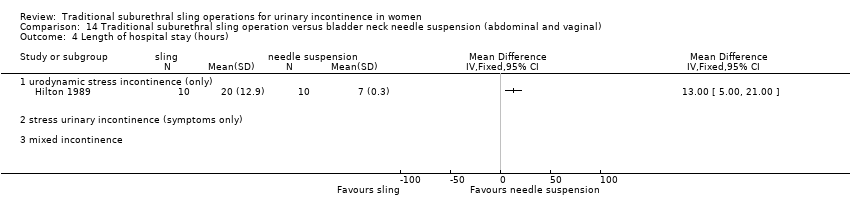
Comparison 14 Traditional suburethral sling operation versus bladder neck needle suspension (abdominal and vaginal), Outcome 4 Length of hospital stay (hours).

Comparison 14 Traditional suburethral sling operation versus bladder neck needle suspension (abdominal and vaginal), Outcome 5 Perioperative surgical complications.

Comparison 14 Traditional suburethral sling operation versus bladder neck needle suspension (abdominal and vaginal), Outcome 6 Urge urinary symptoms, urgency urinary incontinence.
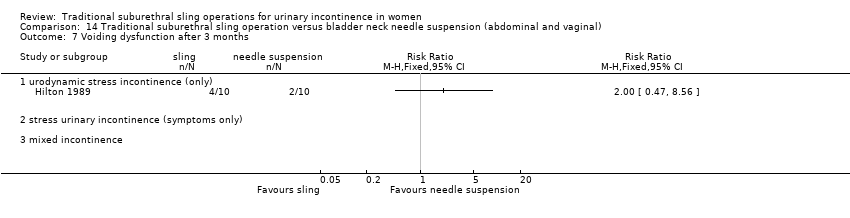
Comparison 14 Traditional suburethral sling operation versus bladder neck needle suspension (abdominal and vaginal), Outcome 7 Voiding dysfunction after 3 months.
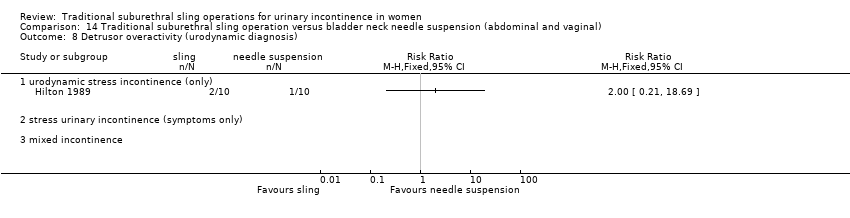
Comparison 14 Traditional suburethral sling operation versus bladder neck needle suspension (abdominal and vaginal), Outcome 8 Detrusor overactivity (urodynamic diagnosis).

Comparison 15 Traditional suburethral sling operation versus open abdominal retropubic colposuspension, Outcome 1 Number of women with urinary incontinence (worse, unchanged, or improved) within first year (women's observations).

Comparison 15 Traditional suburethral sling operation versus open abdominal retropubic colposuspension, Outcome 3 Number of women with urinary incontinence (worse, unchanged, or improved) at 1 to 5 years (women's observations).
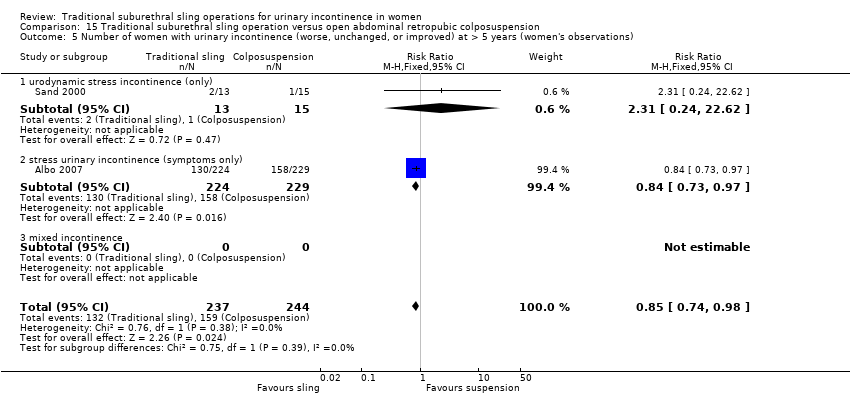
Comparison 15 Traditional suburethral sling operation versus open abdominal retropubic colposuspension, Outcome 5 Number of women with urinary incontinence (worse, unchanged, or improved) at > 5 years (women's observations).

Comparison 15 Traditional suburethral sling operation versus open abdominal retropubic colposuspension, Outcome 6 CURE: number of women cured at > 1 year (women's observations).

Comparison 15 Traditional suburethral sling operation versus open abdominal retropubic colposuspension, Outcome 7 Number of women not satisfied at > 5 years.

Comparison 15 Traditional suburethral sling operation versus open abdominal retropubic colposuspension, Outcome 10 Number of women with urinary incontinence (clinician's observations) at 1 to 5 years.

Comparison 15 Traditional suburethral sling operation versus open abdominal retropubic colposuspension, Outcome 11 Number of women with urinary incontinence (clinician's observations) at > 5 years.
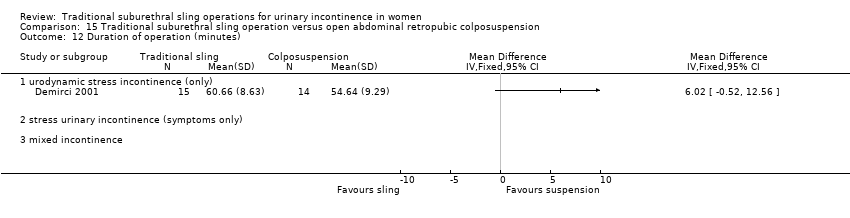
Comparison 15 Traditional suburethral sling operation versus open abdominal retropubic colposuspension, Outcome 12 Duration of operation (minutes).

Comparison 15 Traditional suburethral sling operation versus open abdominal retropubic colposuspension, Outcome 13 Time to catheter removal (days).

Comparison 15 Traditional suburethral sling operation versus open abdominal retropubic colposuspension, Outcome 14 Length of hospital stay (days).

Comparison 15 Traditional suburethral sling operation versus open abdominal retropubic colposuspension, Outcome 16 Perioperative surgical complications.
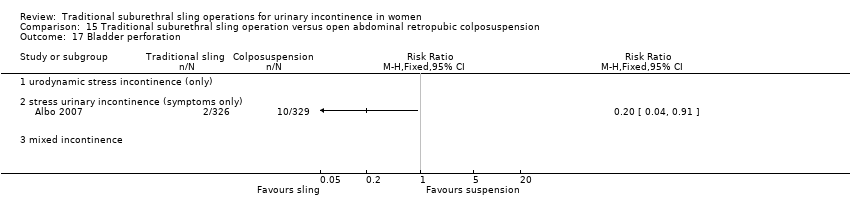
Comparison 15 Traditional suburethral sling operation versus open abdominal retropubic colposuspension, Outcome 17 Bladder perforation.
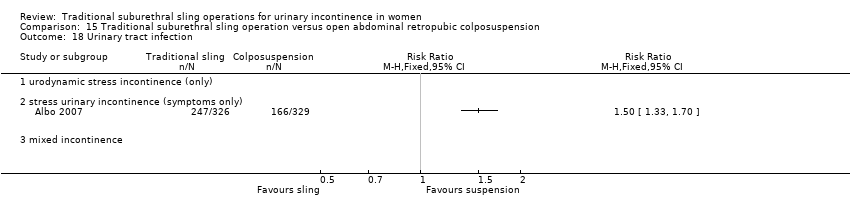
Comparison 15 Traditional suburethral sling operation versus open abdominal retropubic colposuspension, Outcome 18 Urinary tract infection.
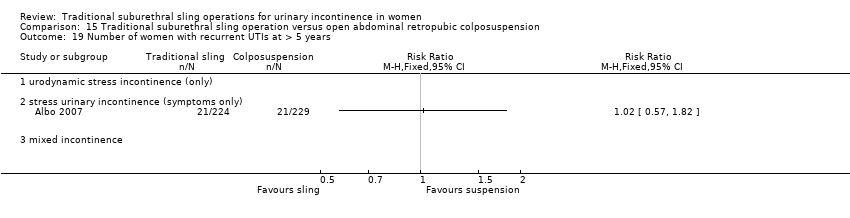
Comparison 15 Traditional suburethral sling operation versus open abdominal retropubic colposuspension, Outcome 19 Number of women with recurrent UTIs at > 5 years.
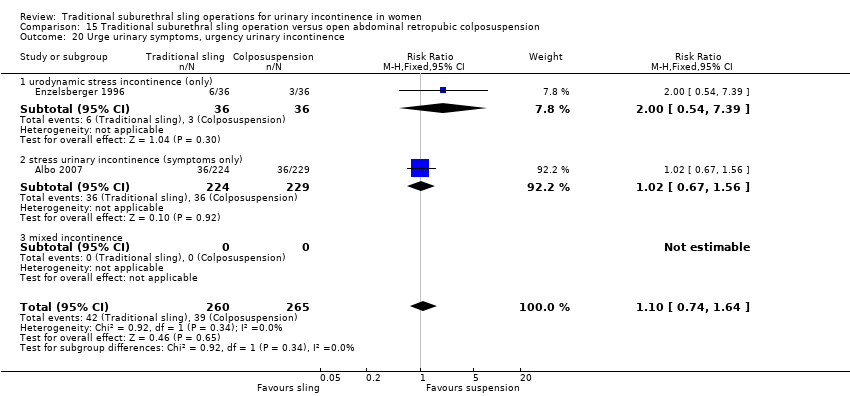
Comparison 15 Traditional suburethral sling operation versus open abdominal retropubic colposuspension, Outcome 20 Urge urinary symptoms, urgency urinary incontinence.

Comparison 15 Traditional suburethral sling operation versus open abdominal retropubic colposuspension, Outcome 21 Detrusor overactivity (urodynamic diagnosis).
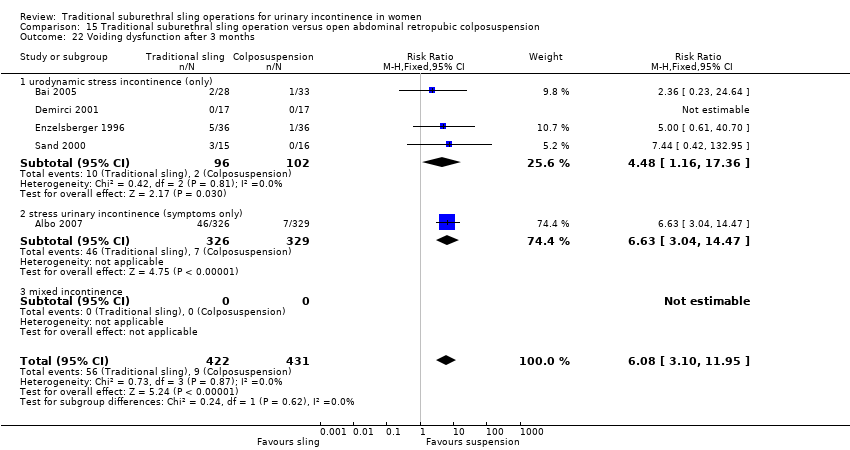
Comparison 15 Traditional suburethral sling operation versus open abdominal retropubic colposuspension, Outcome 22 Voiding dysfunction after 3 months.
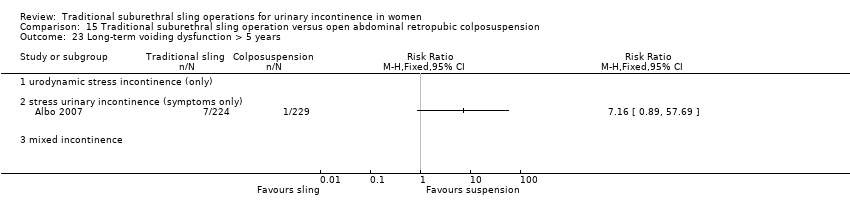
Comparison 15 Traditional suburethral sling operation versus open abdominal retropubic colposuspension, Outcome 23 Long‐term voiding dysfunction > 5 years.
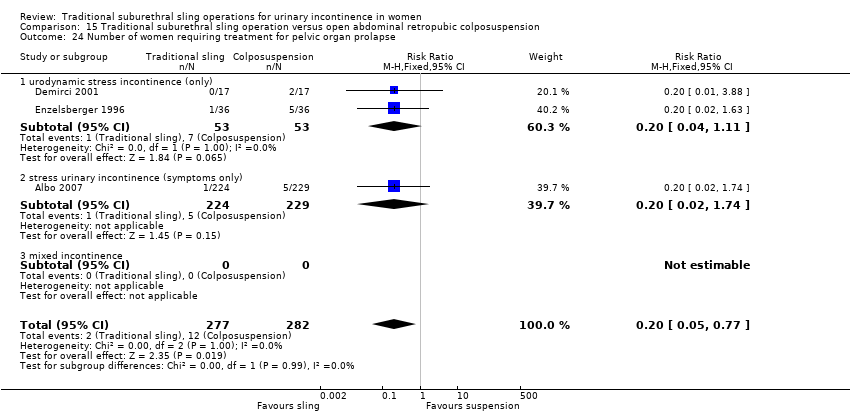
Comparison 15 Traditional suburethral sling operation versus open abdominal retropubic colposuspension, Outcome 24 Number of women requiring treatment for pelvic organ prolapse.

Comparison 15 Traditional suburethral sling operation versus open abdominal retropubic colposuspension, Outcome 25 Repeat surgery for urinary incontinence.

Comparison 15 Traditional suburethral sling operation versus open abdominal retropubic colposuspension, Outcome 26 Condition‐specific measures to assess quality of life.

Comparison 16 Traditional suburethral sling operation versus a mid‐urethral sling or tape, Outcome 1 Number of women with urinary incontinence (worse, unchanged, or improved) within first year (women's observations).

Comparison 16 Traditional suburethral sling operation versus a mid‐urethral sling or tape, Outcome 2 Number not improved (worse or unchanged) within first year (women's observations).

Comparison 16 Traditional suburethral sling operation versus a mid‐urethral sling or tape, Outcome 3 Number of women with urinary incontinence (worse, unchanged, or improved) at 1 to 5 years (women's observations).

Comparison 16 Traditional suburethral sling operation versus a mid‐urethral sling or tape, Outcome 4 Number not improved (worse or unchanged) after first year (women's observations).

Comparison 16 Traditional suburethral sling operation versus a mid‐urethral sling or tape, Outcome 5 Number of women with urinary incontinence after 5 years (women's observations).

Comparison 16 Traditional suburethral sling operation versus a mid‐urethral sling or tape, Outcome 6 Number with incontinence not improved after 5 years (women's observations).
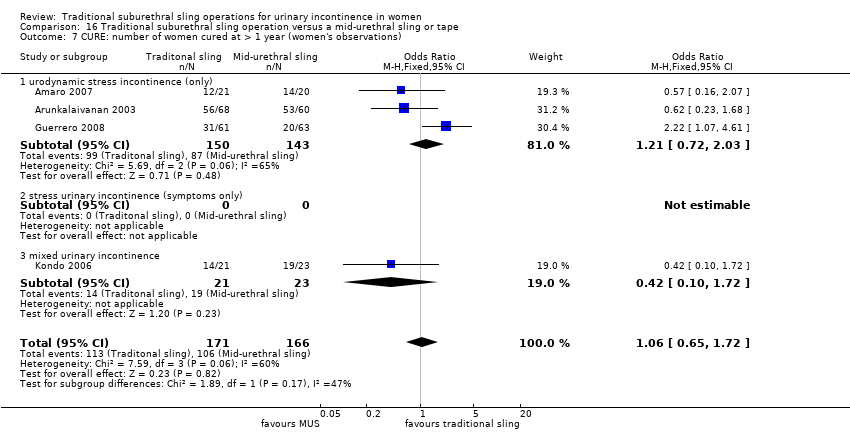
Comparison 16 Traditional suburethral sling operation versus a mid‐urethral sling or tape, Outcome 7 CURE: number of women cured at > 1 year (women's observations).

Comparison 16 Traditional suburethral sling operation versus a mid‐urethral sling or tape, Outcome 8 Repeat surgery for urinary incontinence.

Comparison 16 Traditional suburethral sling operation versus a mid‐urethral sling or tape, Outcome 9 Number of women not satisfied.

Comparison 16 Traditional suburethral sling operation versus a mid‐urethral sling or tape, Outcome 10 Pad test of quantified leakage (mean weight of urine loss).
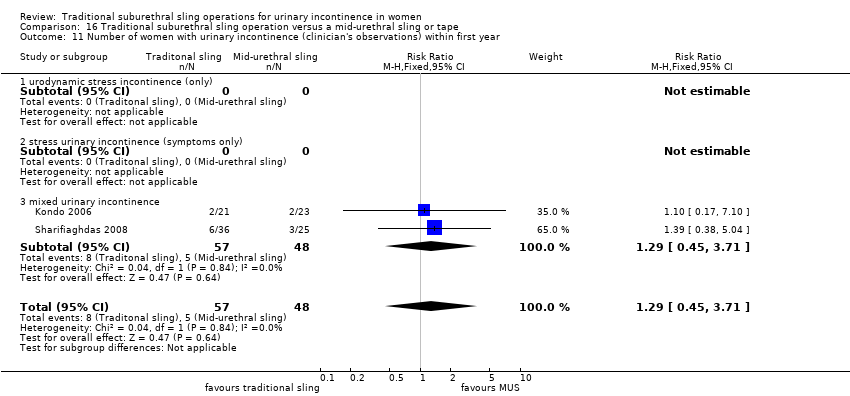
Comparison 16 Traditional suburethral sling operation versus a mid‐urethral sling or tape, Outcome 11 Number of women with urinary incontinence (clinician's observations) within first year.

Comparison 16 Traditional suburethral sling operation versus a mid‐urethral sling or tape, Outcome 12 Number of women with urinary incontinence (clinician's observations) after first year.

Comparison 16 Traditional suburethral sling operation versus a mid‐urethral sling or tape, Outcome 13 Duration of operation (minutes).

Comparison 16 Traditional suburethral sling operation versus a mid‐urethral sling or tape, Outcome 14 Length of hospital stay (days).

Comparison 16 Traditional suburethral sling operation versus a mid‐urethral sling or tape, Outcome 15 Time to catheter removal (days).

Comparison 16 Traditional suburethral sling operation versus a mid‐urethral sling or tape, Outcome 16 Perioperative surgical complications.

Comparison 16 Traditional suburethral sling operation versus a mid‐urethral sling or tape, Outcome 17 Bladder perforations.
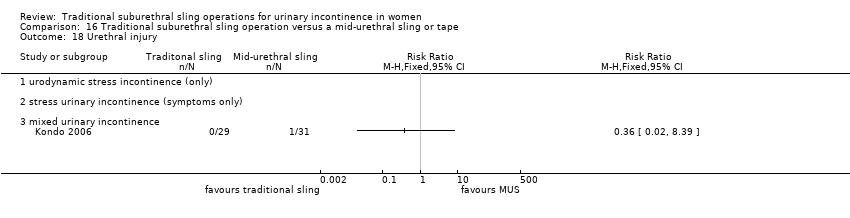
Comparison 16 Traditional suburethral sling operation versus a mid‐urethral sling or tape, Outcome 18 Urethral injury.

Comparison 16 Traditional suburethral sling operation versus a mid‐urethral sling or tape, Outcome 19 Vaginal bleeding.

Comparison 16 Traditional suburethral sling operation versus a mid‐urethral sling or tape, Outcome 20 Urinary tract infection.

Comparison 16 Traditional suburethral sling operation versus a mid‐urethral sling or tape, Outcome 21 Voiding dysfunction.

Comparison 16 Traditional suburethral sling operation versus a mid‐urethral sling or tape, Outcome 22 De novo detrusor urgency or urge symptoms.

Comparison 16 Traditional suburethral sling operation versus a mid‐urethral sling or tape, Outcome 23 De novo detrusor overactivity (urodynamic diagnosis).

Comparison 16 Traditional suburethral sling operation versus a mid‐urethral sling or tape, Outcome 24 Long‐term adverse effects (release of sling required).
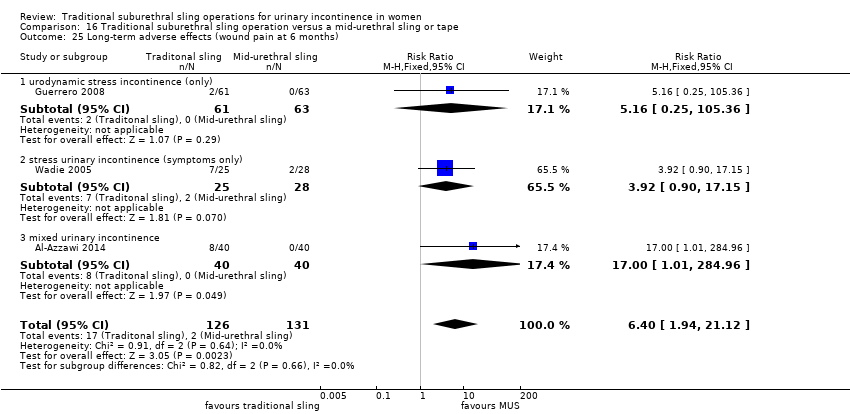
Comparison 16 Traditional suburethral sling operation versus a mid‐urethral sling or tape, Outcome 25 Long‐term adverse effects (wound pain at 6 months).
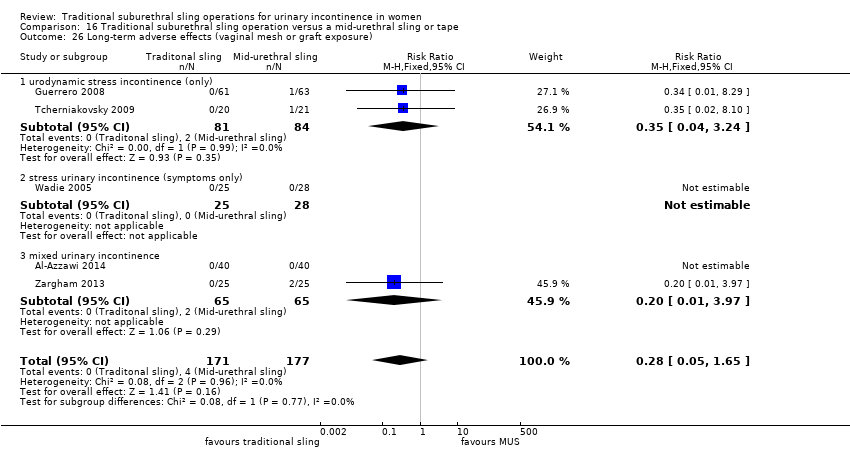
Comparison 16 Traditional suburethral sling operation versus a mid‐urethral sling or tape, Outcome 26 Long‐term adverse effects (vaginal mesh or graft exposure).

Comparison 16 Traditional suburethral sling operation versus a mid‐urethral sling or tape, Outcome 27 Condition‐specific measures to assess quality of life: UDI‐6.
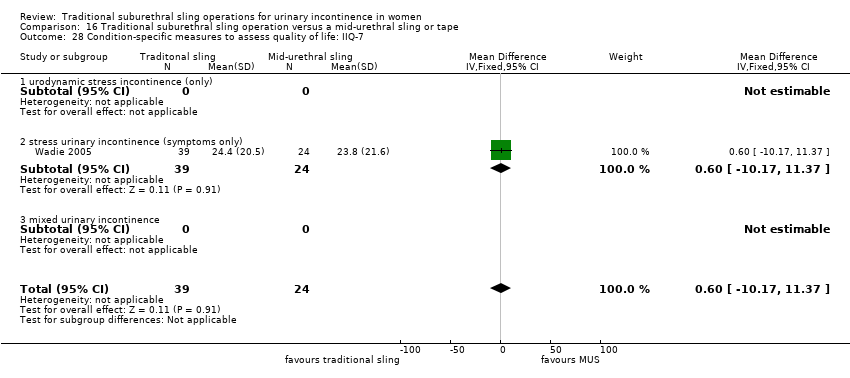
Comparison 16 Traditional suburethral sling operation versus a mid‐urethral sling or tape, Outcome 28 Condition‐specific measures to assess quality of life: IIQ‐7.

Comparison 17 Traditional suburethral sling operation versus a single‐incision sling (mini‐sling), Outcome 1 Number of women with urinary incontinence in the medium term (1 to 5 years).

Comparison 17 Traditional suburethral sling operation versus a single‐incision sling (mini‐sling), Outcome 2 Number of women not satisfied within first year.

Comparison 17 Traditional suburethral sling operation versus a single‐incision sling (mini‐sling), Outcome 3 Number of women with urinary incontinence (clinician's observations) within first year.
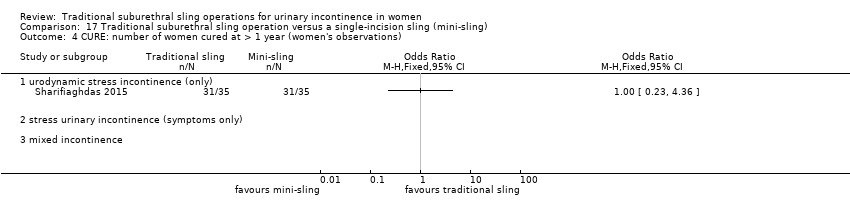
Comparison 17 Traditional suburethral sling operation versus a single‐incision sling (mini‐sling), Outcome 4 CURE: number of women cured at > 1 year (women's observations).

Comparison 17 Traditional suburethral sling operation versus a single‐incision sling (mini‐sling), Outcome 5 Bladder perforation.
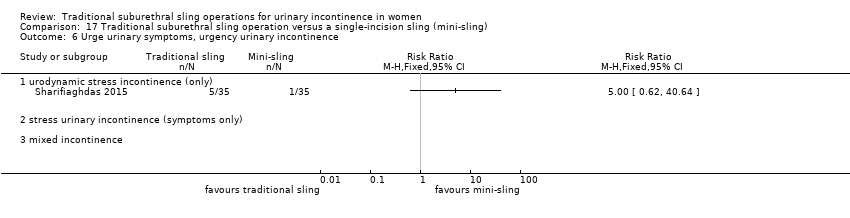
Comparison 17 Traditional suburethral sling operation versus a single‐incision sling (mini‐sling), Outcome 6 Urge urinary symptoms, urgency urinary incontinence.
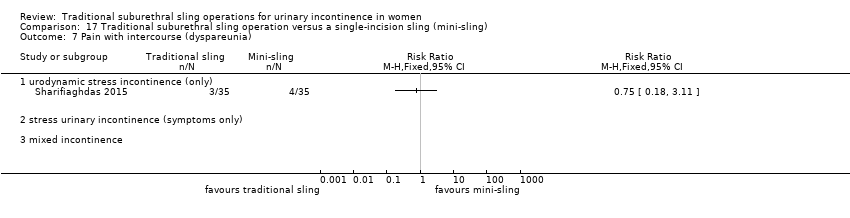
Comparison 17 Traditional suburethral sling operation versus a single‐incision sling (mini‐sling), Outcome 7 Pain with intercourse (dyspareunia).
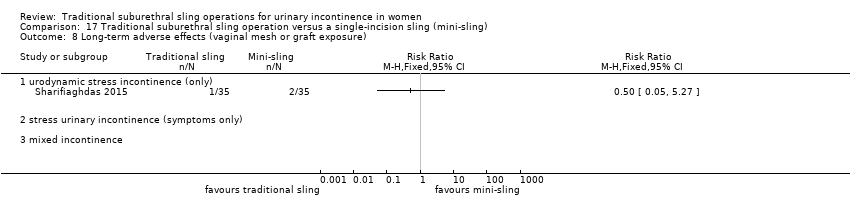
Comparison 17 Traditional suburethral sling operation versus a single‐incision sling (mini‐sling), Outcome 8 Long‐term adverse effects (vaginal mesh or graft exposure).
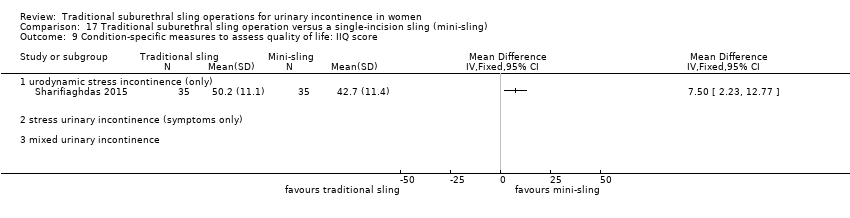
Comparison 17 Traditional suburethral sling operation versus a single‐incision sling (mini‐sling), Outcome 9 Condition‐specific measures to assess quality of life: IIQ score.
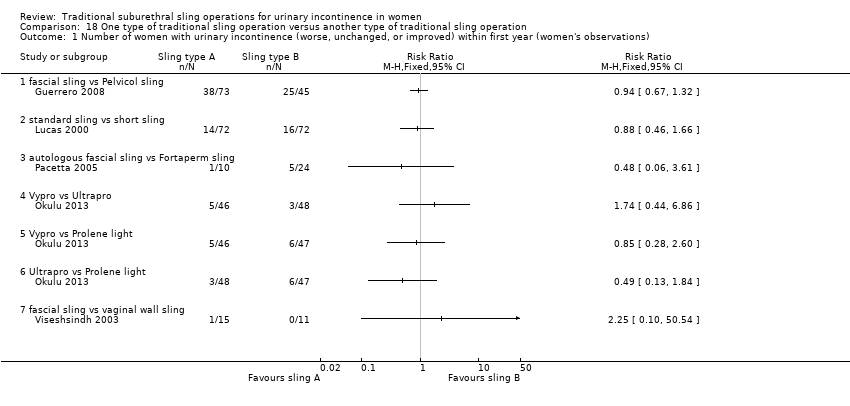
Comparison 18 One type of traditional sling operation versus another type of traditional sling operation, Outcome 1 Number of women with urinary incontinence (worse, unchanged, or improved) within first year (women's observations).
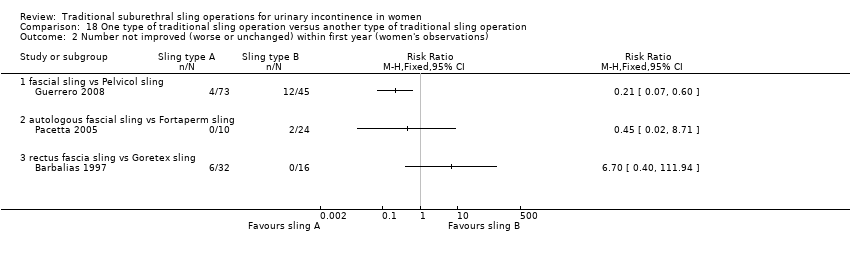
Comparison 18 One type of traditional sling operation versus another type of traditional sling operation, Outcome 2 Number not improved (worse or unchanged) within first year (women's observations).
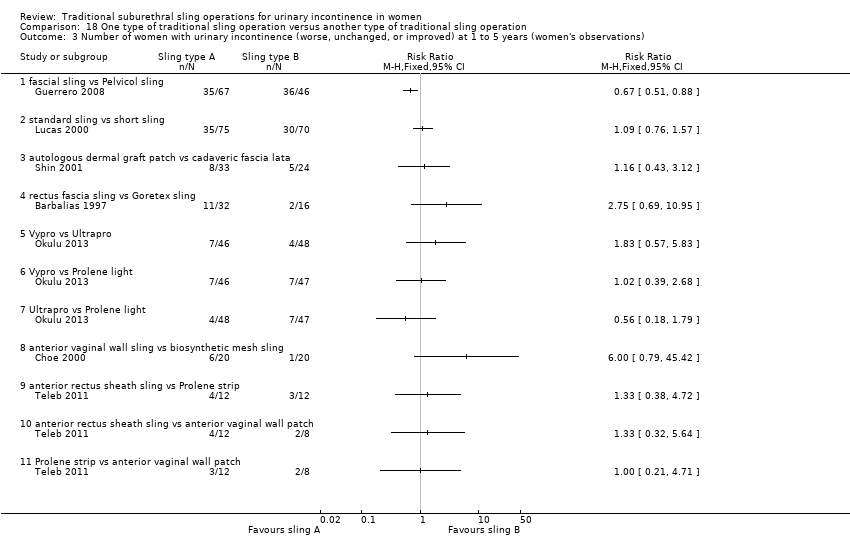
Comparison 18 One type of traditional sling operation versus another type of traditional sling operation, Outcome 3 Number of women with urinary incontinence (worse, unchanged, or improved) at 1 to 5 years (women's observations).

Comparison 18 One type of traditional sling operation versus another type of traditional sling operation, Outcome 4 Number not improved (worse or unchanged) after first year (women's observations).

Comparison 18 One type of traditional sling operation versus another type of traditional sling operation, Outcome 5 Number of women with urinary incontinence (worse, unchanged, or improved) after 5 years (women's observations).

Comparison 18 One type of traditional sling operation versus another type of traditional sling operation, Outcome 6 CURE: number of women with urinary incontinence > 1 year (women's observations).

Comparison 18 One type of traditional sling operation versus another type of traditional sling operation, Outcome 7 Number of women not satisfied.

Comparison 18 One type of traditional sling operation versus another type of traditional sling operation, Outcome 8 Pad test of quantified leakage (mean weight of urine loss) at 1 year.

Comparison 18 One type of traditional sling operation versus another type of traditional sling operation, Outcome 9 Pad test of quantified leakage (mean weight of urine loss) at 1 to 5 years.
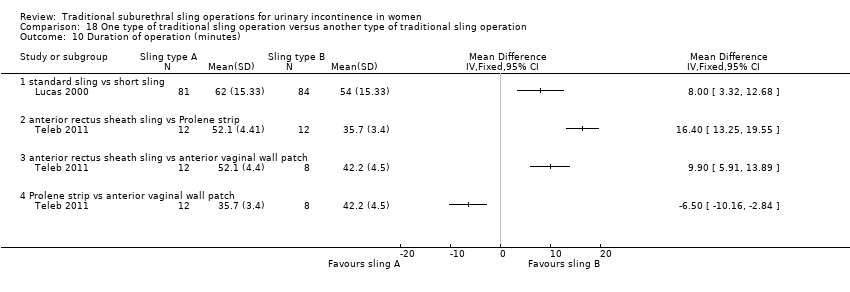
Comparison 18 One type of traditional sling operation versus another type of traditional sling operation, Outcome 10 Duration of operation (minutes).

Comparison 18 One type of traditional sling operation versus another type of traditional sling operation, Outcome 11 Blood loss (mL).
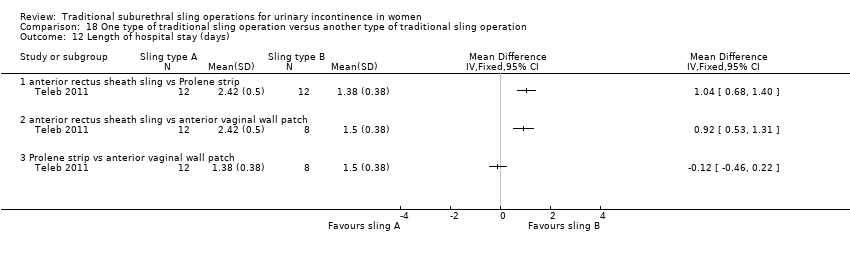
Comparison 18 One type of traditional sling operation versus another type of traditional sling operation, Outcome 12 Length of hospital stay (days).
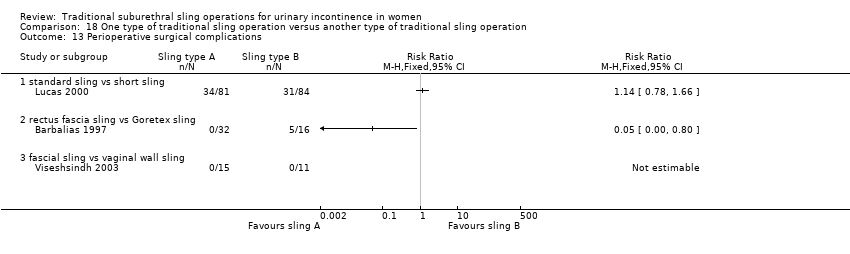
Comparison 18 One type of traditional sling operation versus another type of traditional sling operation, Outcome 13 Perioperative surgical complications.

Comparison 18 One type of traditional sling operation versus another type of traditional sling operation, Outcome 14 Bladder perforation.
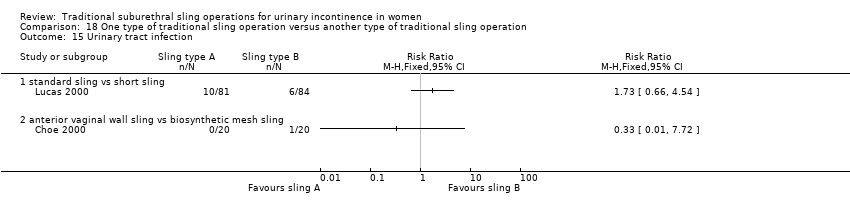
Comparison 18 One type of traditional sling operation versus another type of traditional sling operation, Outcome 15 Urinary tract infection.
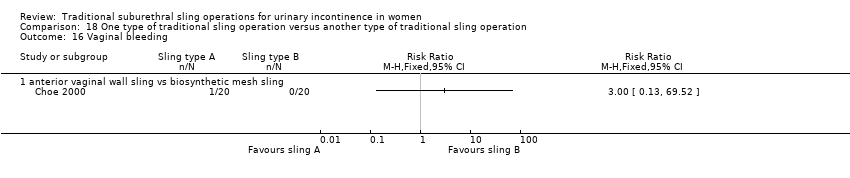
Comparison 18 One type of traditional sling operation versus another type of traditional sling operation, Outcome 16 Vaginal bleeding.

Comparison 18 One type of traditional sling operation versus another type of traditional sling operation, Outcome 17 Long‐term adverse effects (wound pain).

Comparison 18 One type of traditional sling operation versus another type of traditional sling operation, Outcome 18 Voiding dysfunction.
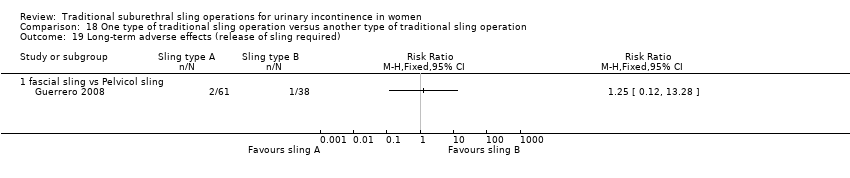
Comparison 18 One type of traditional sling operation versus another type of traditional sling operation, Outcome 19 Long‐term adverse effects (release of sling required).

Comparison 18 One type of traditional sling operation versus another type of traditional sling operation, Outcome 20 De novo detrusor urgency or urge symptoms or detrusor overactivity.
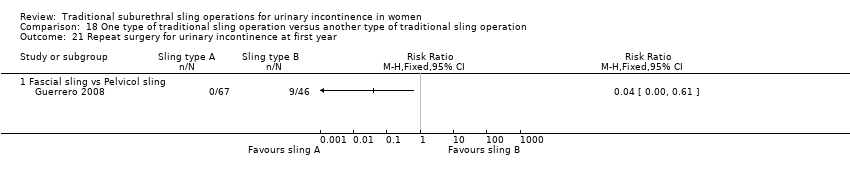
Comparison 18 One type of traditional sling operation versus another type of traditional sling operation, Outcome 21 Repeat surgery for urinary incontinence at first year.
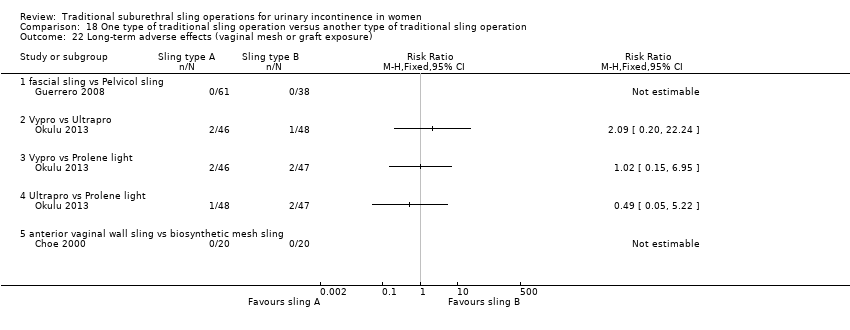
Comparison 18 One type of traditional sling operation versus another type of traditional sling operation, Outcome 22 Long‐term adverse effects (vaginal mesh or graft exposure).

Comparison 18 One type of traditional sling operation versus another type of traditional sling operation, Outcome 23 Condition‐specific measures to assess quality of life (ICI‐Q short form UI score at 1 year).

Comparison 18 One type of traditional sling operation versus another type of traditional sling operation, Outcome 24 Condition‐specific measures to assess quality of life (ICI‐Q short form UI score at 1 to 5 years).
| Traditional suburethral sling operation versus no treatment or sham operation | ||||||
| Patient or population: women with urinary incontinence | ||||||
| Outcomes | Illustrative comparative risks* (95% CI) | Relative effect | Number of participants | Quality of the evidence | Comments | |
| Assumed risk | Corresponding risk | |||||
| No treatment or sham treatment | Sling | |||||
| Number of continent (dry) women (any definition) in the medium term (1 to 5 years) | Not reported | |||||
| Repeat surgery for urinary incontinence | Not reported | |||||
| Perioperative surgical complications | Not reported | |||||
| Long‐term adverse effects | Not reported | |||||
| Condition‐specific quality of life | Not reported | |||||
| *The basis for the assumed risk (e.g. the median control group risk across studies) is provided in footnotes. The corresponding risk (and its 95% confidence interval) is based on the assumed risk in the comparison group and the relative effect of the intervention (and its 95% CI). | ||||||
| GRADE Working Group grades of evidence. | ||||||
| Traditional suburethral sling operation versus conservative management | ||||||
| Patient or population: women with urinary incontinence | ||||||
| Outcomes | Illustrative comparative risks* (95% CI) | Relative effect | Number of participants | Quality of the evidence | Comments | |
| Assumed risk | Corresponding risk | |||||
| Conservative treatment | Sling | |||||
| Number of continent (dry) women (any definition) in the medium term (1 to 5 years) | Not reported | |||||
| Repeat surgery for urinary incontinence | Not reported | |||||
| Perioperative surgical complications | Not reported | |||||
| Long‐term adverse effects | Not reported | |||||
| Condition‐specific quality of life | Not reported | |||||
| *The basis for the assumed risk (e.g. the median control group risk across studies) is provided in footnotes. The corresponding risk (and its 95% confidence interval) is based on the assumed risk in the comparison group and the relative effect of the intervention (and its 95% CI). | ||||||
| GRADE Working Group grades of evidence. | ||||||
| Traditional suburethral sling operation versus drugs | ||||||
| Patient or population: women with urinary incontinence | ||||||
| Outcomes | Illustrative comparative risks* (95% CI) | Relative effect | Number of participants | Quality of the evidence | Comments | |
| Assumed risk | Corresponding risk | |||||
| Drugs | Sling | |||||
| Number of continent (dry) women (any definition) in the medium term (1 to 5 years) | Not reported | |||||
| Repeat surgery for urinary incontinence | Not reported | |||||
| Perioperative surgical complications | Not reported | |||||
| Long‐term adverse effects | Not reported | |||||
| Condition‐specific quality of life | Not reported | |||||
| *The basis for the assumed risk (e.g. the median control group risk across studies) is provided in footnotes. The corresponding risk (and its 95% confidence interval) is based on the assumed risk in the comparison group and the relative effect of the intervention (and its 95% CI). | ||||||
| GRADE Working Group grades of evidence. | ||||||
| Traditional suburethral sling operation versus injectables | ||||||
| Patient or population: women with urinary incontinence | ||||||
| Outcomes | Illustrative comparative risks* (95% CI) | Relative effect | Number of participants | Quality of the evidence | Comments | |
| Assumed risk | Corresponding risk | |||||
| Injectable | Sling | |||||
| Number of continent (dry) women (any definition) in the medium term (1 to 5 years) | 714 per 1000 | 967 per 1000 (583 to 998) | OR 11.57 (0.56 to 239.7) | 43 | ⊕⊝⊝⊝ | 252 more women, per 1000, with traditional sling (131 fewer to 284 more) |
| Repeat surgery for urinary incontinence ‐ urodynamic stress incontinence (only) | 91 per 1000 | 47 per 1000 (5 to 487) | RR 0.52 (0.05 to 5.36) | 43 | ⊕⊝⊝⊝ | 44 fewer women, per 1000, with traditional sling (86 fewer to 396 more) |
| Perioperative surgical complications | 91 per 1000 | 143 per 1000 | RR 1.57 | 43 | ⊕⊝⊝⊝ | 52 more women, per 1000, with traditional sling (65 fewer to 681 more) |
| Long‐term adverse effects | Not reported | |||||
| Condition‐specific quality of life | Not reported | |||||
| *The basis for the assumed risk (e.g. the median control group risk across studies) is provided in footnotes. The corresponding risk (and its 95% confidence interval) is based on the assumed risk in the comparison group and the relative effect of the intervention (and its 95% CI). | ||||||
| GRADE Working Group grades of evidence. | ||||||
| aDowngraded one level due to serious risk of bias (unclear for sequence generation, allocation concealment, and blinding) and two levels for imprecision (95% CI very wide, 0.56 to 239.74; crosses line of no effect). bDowngraded two levels due to very serious imprecision: single trial with small sample size. | ||||||
| Traditional suburethral sling operation versus anterior repair | ||||||
| Patient or population: women with urinary incontinence | ||||||
| Outcomes | Illustrative comparative risks* (95% CI) | Relative effect | Number of participants | Quality of the evidence | Comments | |
| Assumed risk | Corresponding risk | |||||
| Anterior repair | Sling | |||||
| Number of continent (dry) women (any definition) in the medium term (1 to 5 years) | Not reported | |||||
| Repeat surgery for urinary incontinence | Not reported | |||||
| Perioperative surgical complications | Not reported | |||||
| Long‐term adverse effects | Not reported | |||||
| Condition‐specific quality of life | Not reported | |||||
| *The basis for the assumed risk (e.g. the median control group risk across studies) is provided in footnotes. The corresponding risk (and its 95% confidence interval) is based on the assumed risk in the comparison group and the relative effect of the intervention (and its 95% CI). | ||||||
| GRADE Working Group grades of evidence. | ||||||
| Traditional suburethral sling operation versus bladder neck needle suspension (abdominal and vaginal) | ||||||
| Patient or population: women with urinary incontinence | ||||||
| Outcomes | Illustrative comparative risks* (95% CI) | Relative effect | Number of participants | Quality of the evidence | Comments | |
| Assumed risk | Corresponding risk | |||||
| Bladder neck needle suspension | Sling | |||||
| Number of continent (dry) women (any definition) in the medium term (1 to 5 years) | 700 per 1000 | 900 per 1000 (435 to 991) | OR 3.86 0.33 to 45.57 | 20 | ⊕⊝⊝⊝ | 200 more women, per 1000, with traditional sling (265 fewer to 291 more) |
| Repeat surgery for urinary incontinence | Not reported | |||||
| Perioperative surgical complications ‐ urodynamic stress incontinence (only) | 200 per 1000 | 900 per 1000 | RR 4.5 | 20 | ⊕⊝⊝⊝ | 700 more women, per 1000, with traditional sling (56 fewer to 2962 more) |
| Long‐term adverse effects | Not reported | |||||
| Condition‐specific quality of life | Not reported | |||||
| *The basis for the assumed risk (e.g. the median control group risk across studies) is provided in footnotes. The corresponding risk (and its 95% confidence interval) is based on the assumed risk in the comparison group and the relative effect of the intervention (and its 95% CI). | ||||||
| GRADE Working Group grades of evidence. | ||||||
| aDowngraded two levels for risk of bias (evidence comes from a single trial that was judged to be unclear for allocation concealment and blinding) and two levels for imprecision (95% CI very wide). | ||||||
| Traditional suburethral sling operation versus open abdominal retropubic suspension | ||||||
| Patient or population: women with urinary incontinence | ||||||
| Outcomes | Illustrative comparative risks* (95% CI) | Relative effect | Number of participants | Quality of the evidence | Comments | |
| Assumed risk | Corresponding risk | |||||
| Open abdominal retropubic suspension | Sling | |||||
| Number of continent (dry) women (any definition) in the medium term (1 to 5 years) | 589 per 1000 | 711 per 1000 (638 to 774) | OR 1.70 (1.22 to 2.37) | 687 (4 RCTs) | ⊕⊕⊕⊝ | 120 more dry women, per 1000, with traditional sling (47 more to 186 more) |
| Repeat surgery for urinary incontinence‐stress urinary incontinence (symptoms only) | 119 per 1000 | 18 per 1000 | RR 0.15 (0.05 to 0.42) | 450 | ⊕⊕⊕⊕ | 101 fewer women having repeat continence surgery, per 1000, with traditional sling (113 fewer to 69 fewer) |
| Perioperative surgical complications | 95 per 1000 | 118 per 1000 | RR 1.24 | 792 | ⊕⊝⊝⊝ | 23 more women, per 1000, with traditional sling (16 fewer to 82 more) |
| Long‐term adverse effects | 92 per 1000 | 94 per 1000 | RR 1.02 (0.57 to 1.82) | 453 | ⊕⊕⊝⊝ | 2 more women, per 1000, with traditional sling (39 fewer to 75 more) |
| Condition‐specific quality of life | Mean IIQ score in the control group was 44.8 | Mean condition‐specific quality of life in the intervention groups was | 453 | ⊕⊝⊝⊝ | Another trial reported no evidence of a difference between colposuspension groups and sling groups in IIQ and UDI scores but reported no actual numbers | |
| *The basis for the assumed risk (e.g. the median control group risk across studies) is provided in footnotes. The corresponding risk (and its 95% confidence interval) is based on the assumed risk in the comparison group and the relative effect of the intervention (and its 95% CI). | ||||||
| GRADE Working Group grades of evidence. | ||||||
| aDowngraded one level due to serious risk of bias (unclear randomisation and allocation concealment in two of the smaller trials), but the trial carrying 90% of weight in the meta‐analysis was judged to have low risk of selection bias. bDowngraded one level for risk of bias (sequence generation was unclear in one‐fourth of trials and allocation concealment was unclear in three‐quarters of trials taking part in the meta‐analysis; participants were not blinded) and one level for imprecision (95% confidence interval was very wide). cDowngraded two levels for imprecision (95% confidence interval was very wide; 0.57 to 1.82). dDowngraded two levels for risk of bias (sequence generation and allocation concealment were judged to be "low risk"; blinding of participants was judged to be "high risk") and two levels for imprecision (95% confidence interval was very wide; ‐11.96 to 15.36). | ||||||
| Traditional suburethral sling operation versus laparoscopic colposuspension | ||||||
| Patient or population: women with urinary incontinence | ||||||
| Outcomes | Illustrative comparative risks* (95% CI) | Relative effect | Number of participants | Quality of the evidence | Comments | |
| Assumed risk | Corresponding risk | |||||
| Laparoscopic procedures | Sling | |||||
| Number of continent (dry) women (any definition) in the medium term (1 to 5 years) | Not reported | |||||
| Repeat surgery for urinary incontinence | Not reported | |||||
| Perioperative surgical complications | Not reported | |||||
| Voiding dysfunction | Not reported | |||||
| Long‐term adverse effects | Not reported | |||||
| Condition‐specific quality of life | Not reported | |||||
| *The basis for the assumed risk (e.g. the median control group risk across studies) is provided in footnotes. The corresponding risk (and its 95% confidence interval) is based on the assumed risk in the comparison group and the relative effect of the intervention (and its 95% CI). | ||||||
| GRADE Working Group grades of evidence. | ||||||
| Traditional suburethral sling operation versus a mid‐urethral sling or tape | ||||||
| Patient or population: women with urinary incontinence | ||||||
| Outcomes | Illustrative comparative risks* (95% CI) | Relative effect | Number of participants | Quality of the evidence | Comments | |
| Assumed risk | Corresponding risk | |||||
| Minimally invasive sling operation | Traditional sling | |||||
| Number of continent (dry) women (any definition) in the medium term (1 to 5 years) | 737 per 1000 | 652 per 1000 (552 to 741) | OR 0.67 (0.44 to 1.02) | 445 (6 RCTs) | ⊕⊕⊕⊝ | 85 fewer women, per 1000, with traditional sling (185 fewer to 4 more) |
| Repeat surgery for urinary incontinence ‐ urodynamic stress incontinence (only) | One trial reported the numbers of women having repeat continence surgery at 10‐year follow‐up: traditional sling: 0/67; mid‐urethral sling: 2/69 | 136 | ⊕⊕⊝⊝ | |||
| Perioperative surgical complications | 193 per 1000 | 336 per 1000 | RR 1.74 | 293 | ⊕⊕⊝⊝ | 143 more women, per 1000, with traditional sling (31 more to 309 more) |
| Long‐term adverse effects | 25 per 1000 | 62 per 1000 | RR 2.53 | 326 | ⊕⊝⊝⊝ | 38 more women, per 1000, with traditional sling (3 fewer to 157 more) |
| Condition‐specific quality of life | Mean IIQ‐7 score in the control group was 24.4 | Mean condition‐specific quality of life score in the intervention groups was | 63 | ⊕⊝⊝⊝ | Eight other trials reported some measure of QoL but the data were unsuitable for met‐analysis. Overall, there was no evidence of a difference between groups in QoL scores | |
| *The basis for the assumed risk (e.g. the median control group risk across studies) is provided in footnotes. The corresponding risk (and its 95% confidence interval) is based on the assumed risk in the comparison group and the relative effect of the intervention (and its 95% CI). | ||||||
| GRADE Working Group grades of evidence. | ||||||
| 1Downgraded one level due to serious risk of bias: 2/6 trials had high risk of selection bias. 2Downgraded two levels due to very serious imprecision: single study with small sample size. 3Downgraded two levels for risk of bias (sequence generation and allocation concealment were high or unclear risk in all four trials taking part in the meta‐analysis). 4Downgraded two levels for risk of bias (sequence generation and allocation concealment were high or unclear risk in two of three trials taking part in the meta‐analysis) and two levels for imprecision (95% confidence interval was very wide: 0.87 to 7.35). 5Downgraded two levels for risk of bias (sequence generation was judged to be high risk, and allocation concealment was judged to be low risk; outcome data were incomplete) and two levels for imprecision (95% confidence interval was very wide: ‐10.17 to 11.37). | ||||||
| Traditional suburethral sling operation versus a single‐incision sling (mini‐sling) | ||||||
| Patient or population: women with urinary incontinence | ||||||
| Outcomes | Illustrative comparative risks* (95% CI) | Relative effect | Number of participants | Quality of the evidence | Comments | |
| Assumed risk | Corresponding risk | |||||
| Number of continent (dry) women (any definition) in the medium term (1 to 5 years) | 886 per 1000 | 886 per 1000 (641 to 971) | OR 1.00 (0.23 to 4.36) | 70 | ⊕⊝⊝⊝ | 0 fewer women, per 1000, with traditional sling (245 fewer to 86 more) |
| Repeat surgery for urinary incontinence | not reported | |||||
| Perioperative surgical complications ‐ bladder perforation | 0 per 1000 | 0 per 1000 (0 to 0) | RR 3 (0.13 to 71.22) | 70 | ⊕⊝⊝⊝ | |
| Long‐term adverse effects | not reported | |||||
| Condition‐specific quality of life IIQ | Mean IIQ score in the control group was 42.7 | Mean condition‐specific quality of life score in the intervention groups was 50.2 higher (2.23 higher to 12.77 higher) | 70 | ⊕⊝⊝⊝ | Based on mean IIQ score, quality of life was worse in the traditional sling group compared with the mini‐sling group | |
| *The basis for the assumed risk (e.g. the median control group risk across studies) is provided in footnotes. The corresponding risk (and its 95% confidence interval) is based on the assumed risk in the comparison group and the relative effect of the intervention (and its 95% CI). | ||||||
| GRADE Working Group grades of evidence. | ||||||
| aDowngraded two levels due to very serious risk of bias: unclear randomisation and inadequate blinding. bDowngraded two levels due to very serious imprecision: single trial, small sample size, wide 95% confidence intervals. | ||||||
| One type of traditional sling operation versus another type of traditional sling operation | ||||||
| Patient or population: women with urinary incontinence | ||||||
| Outcomes | Illustrative comparative risks* (95% CI) | Relative effect | Number of participants | Quality of the evidence | Comments | |
| Assumed risk | Corresponding risk | |||||
| Another type of traditional sling | One type of traditional sling | |||||
| Number of continent (dry) women (any definition) in the medium term (1 to 5 years) | Not estimable | 749 | ⊕⊝⊝⊝ | Results not pooled (Analysis 11.2) | ||
| Repeat surgery for urinary incontinence at first year Fascial sling vs Pelvicol sling | 196 per 1000 | 8 per 1000 (0 to 119) | RR 0.04 (0.00 to 0.61) | 113 | ⊕⊕⊝⊝2 | 188 fewer women, per 1000, with fascial sling (0 fewer to 76 fewer) (Analysis 11.4 |
| Perioperative surgical complications | Not estimable | 239 | ⊕⊝⊝⊝ | Results not pooled (Analysis 11.14) | ||
| Long‐term adverse effects | Not estimable | 421 | ⊕⊝⊝⊝ | Results not pooled (Analysis 11.23) | ||
| Condition‐specific quality of life | Not estimable | 282 | ⊕⊝⊝⊝ | Results not pooled* (Analysis 11.25) | ||
| *The basis for the assumed risk (e.g. the median control group risk across studies) is provided in footnotes. The corresponding risk (and its 95% confidence interval) is based on the assumed risk in the comparison group and the relative effect of the intervention (and its 95% CI). | ||||||
| GRADE Working Group grades of evidence. | ||||||
| 1Downgraded two levels for imprecision (Analysis 11.2) and two levels for heterogeneity, as the trials used different materials for the traditional sling procedure. 2Downgraded two levels for imprecision (Analysis 11.4) 3Downgraded one level for risk of bias (sequence generation was judged to be at low risk of bias in two of three trials and unclear in the third trial; allocation concealment was unclear in two of three trials). Blinding (performance bias and detection bias) was judged to be unclear (two of three) or high risk (one of three). Downgraded two levels for heterogeneity, as the trials used three different materials for the traditional sling procedure, and one level for inconsistency, as 95% CIs did not overlap (Analysis 11.14). 4Downgraded two levels for heterogeneity, as the trials used four different materials for the traditional sling procedure, and one level for imprecision, as the 95% CIs were very wide (Analysis 11.23). 5Downgraded two levels for heterogeneity, as the trials used three different materials for the traditional sling procedure, and one level for inconsistency, as 95% CIs did not overlap (Analysis 11.25). * Data from two other trials were identified and are reported narratively in the text. These two trials did not report their data in a form suitable for meta‐analysis | ||||||
| Trial ID | Definition of outcome | Notes |
| WOMAN‐REPORTED | ||
| Overall success defined as no self‐reported symptoms of UI, no incontinence on 3‐day diary, negative stress test, no re‐treatment (combined outcome). Failure (self‐reported UI) at 5 years only (woman‐reported) | Also combined outcome before 5 years | |
| Cure defined as complete dryness with no usage of pads (woman‐reported) | ||
| Cure of incontinence defined as a quality of life (QoL) improvement of 90% and/or patient‐determined continent status as dry (woman‐reported) | Questionnaire‐based | |
| Dry (symptom‐free) patients (woman‐reported) | ||
| Assessment of cure not defined. Data abstracted from this trial therefore assumed to be woman‐reported | ||
| Cure stated as subjective (woman‐reported) at 24 months' follow‐up Objective (urodynamic diagnosis, pad test (clinician‐reported)) at 3 months | Also clinician‐reported outcome at 3 months | |
| Subjective cure consistent with complete dryness or a few drops of water with strong exercises (assumed to be woman‐reported) | Also separate clinician‐reported outcome | |
| Success rate measured by recurrence of stress leakage as reported in patient questionnaire (woman‐reported) | ||
| Subjective success: no or occasional (less than once a week) stress incontinence (woman‐reported) | Also separate clinician‐reported outcome | |
| Cure defined as subjective (history: woman‐reported) | Also separate clinician‐reported outcome | |
| Cure defined as of some degree of SUI at 1 year after surgery (woman‐reported) | ||
| Success rate (dry) (method unspecified: assumed woman‐reported) | ||
| Cure rate (method unspecified: assumed woman‐reported) | ||
| Stress urinary incontinence (method unspecified: assumed woman‐reported) | ||
| QUANTITATIVE | ||
| Cure = dry pads, improvement = 1 wet pad, failure ≥ 1 wet pad per day (quantitative) | Satisfaction separately measured by questionnaire | |
| Subjective cure assessed via comparison between pre‐operative and postoperative Incontinence Impact Questionnaire (IIQ), Urinary Distress Inventory (UDI) (quantitative) | Also separate clinician‐reported outcome | |
| Cure defined as no pad use (quantitative) | ||
| Subjective improvement only; subjective patient evaluations included QoL questionnaire, incontinence diary, pain and global outcome assessments (quantitative) | Also separate clinician‐reported outcome | |
| Objective cure defined as 1‐hour pad test ≤ 2 grams (quantitative) | Also separate clinician‐reported outcome | |
| Women declared objectively cured when they had a postoperative pad test < 8 grams (quantitative) | ||
| Objective assessment via 48‐hour frequency volume chart, 48‐hour pad test, and standardised stress test. Surgery was considered successful when there was no postoperative SUI (patient was dry (quantitative)) | Also separate clinician‐reported outcome | |
| CLINICIAN‐REPORTED | ||
| No leakage of urine during stress test and urodynamic testing (clinician‐reported) | ||
| Cure defined as complete freedom from SUI (clinician‐reported) | ||
| Urine loss during cough‐stress test defined as persistent stress incontinence (clinician‐assessed) | ||
| Objective cure by stress test, voiding dysfunction by urodynamic assessment if incontinence seen (clinician‐reported) | Also separate quantitative outcome | |
| Cure stated as objective (urodynamic diagnosis, pad test (clinician‐reported)) at 3 months | Also woman‐reported outcome at 24 months | |
| Objective cure defined as complete absence of leakage during cough‐stress test with 250 or 300 mL of water in the bladder (clinician‐reported) | Also separate woman‐reported outcome | |
| Objective success: no leakage due to SUI on repeat urodynamic study (clinician‐reported) | Also separate woman‐reported outcome | |
| Objective outcome assessment: urine loss via a provocative pad test (clinician‐reported) | Also separate quantitative outcome (improvement only) | |
| Cure defined as objective (urodynamic: clinician‐reported) | Also separate woman‐reported outcome | |
| Objective cure defined as negative cough‐induced stress test with full bladder (≥ 250 mL filled) in lithotomy and standing positions (clinician‐reported) | Also separate quantitative outcome | |
| Objective assessment via 48‐hour frequency volume chart, 48‐hour pad test, and standardised stress test. Surgery considered successful when stress test was negative (clinician‐reported) and postoperative cystocoele was < grade 2 | Also separate quantitative outcome | |
| COMBINED WOMAN‐ AND CLINICIAN‐REPORTED | ||
| Overall success defined as no self‐reported symptoms of UI, no incontinence on 3‐day diary, negative stress test, no re‐treatment (combined outcome). Failure (self‐reported UI) at 5 years only (woman‐reported) | Also woman‐reported outcome at 5 years | |
| Cure of SUI defined as significant dryness as perceived by the patient, no more use of pads, negative stress test, and acceptable voiding stream (combined primary outcome) | However, no data after first week, so not useable | |
| Cure defined as absence of subjective complaints of leakage and absence of urinary leakage on stress test (combined outcome) | ||
| Cure defined as dry, symptom‐free without objective urine loss during stress with bladder filled to 300 mL or positive urethral‐closure pressure during stress provocation (combined outcome) | ||
| Continence defined as no urinary leakage on a 3‐day voiding diary, no self‐reported stress incontinence symptoms, and no stress incontinence surgical treatment (combined outcome) | ||
| Cure defined as complete freedom from SUI (subjective and objective demonstrations) (combined outcome) | ||
| Patients evaluated by SEAPI score (subjective and objective) after urodynamic examination before and after treatment (combined outcome) | ||
| Cure defined as reported absence of SUI with no urinary loss during effort manoeuvres (combined outcome) | ||
| Cure defined as no leakage reported by the patient or noticed at examination (combined outcome) | ||
| Cure defined as complete dryness with no usage of pad and negative cough‐stress test (combined outcome) | ||
| Trials that did not report cure rates.
| ||
| Comparison 3. Traditional suburethral sling operation versus drugs | |
| Osman 2003 included 75 women with mixed urinary incontinence treated with surgery (either Burch colposuspension (n = 24) or rectus fascia sling (n = 26)) or oxybutynin (an anticholinergic drug treatment for urinary incontinence, overactive bladder, and detrusor overactivity ‐ not for stress incontinence; n = 25) (Osman 2003). The type of surgery was selected according to Valsalva leak point pressure (VLPP) ‐ those with VLPP < 90 cm of water had rectus fascia sling, and those with VLPP > 90 cm of water had Burch colposuspension) Results for the surgically managed group were similar to those of the subgroup having slings. Due to small sample sizes, data were too few to be reliable; we therefore compared only data from oxybutynin versus sling patients provided in tables Primary outcomes Number of continent (dry) women Data suggest that, within the first year, women were significantly more likely to be continent after undergoing surgery with slings than after treatment with oxybutynin (20/24; 83% vs 0/21; OR 195.89, 95% CI 9.91 to 3871.03; n = 45; Analysis 3.1) Number of women who have repeat continence surgery Not reported Secondary outcomes Fewer women had persistent urgency urinary incontinence after traditional sling surgery (3/24; 13% vs 9/21; 43% with oxybutynin; RR 0.29, 95% CI 0.09 to 0.94; n = 45; Analysis 3.2) | |
| Comparison 4. Traditional suburethral sling operation vs injectables | |
| Maher 2005 compared slings (21) vs injectable Macroplastique (22) in 45 women. Due to the small size of the trial, the data were too few to be reliable Primary outcomes Number of continent (dry) women Short‐term: data from 1 small trial were too few to reliably identify evidence of a difference between traditional sling and injectables in the number of continent women within the first year (OR 2.79, 95% CI 0.48 to 16.33; n = 43; Maher 2005; Analysis 4.1) Medium‐term: Maher 2005 found no evidence of a difference between groups in the number of continent women after the first year (13/13; 100% continent with a traditional sling vs 10/14, 71% with the injectable; OR 11.57, 95% CI 0.56 to 239.74; n = 27; very low‐quality evidence; Analysis 4.2;summary of findings Table 4) Number of women who have repeat continence surgery We found no evidence of a difference between groups in the numbers of women having repeat surgery for urinary incontinence (1 after traditional sling vs 2 after injectable: RR 0.52, 95% CI 0.05 to 5.36; n = 43; very low‐quality evidence; Maher 2005; Analysis 4.3;summary of findings Table 4) Secondary outcomes Number of women cured at 1 year or later (women's observations) The trial was too small to reliably identify evidence of a difference between groups in the number of women cured after the first year (OR 11.57, 95% CI 0.56 to 239.74; n = 27; Analysis 4.4) Number of women improved Not reported Number of women satisfied Data from Maher 2005 were too few to identify a difference between groups in satisfaction rates at 6 months (P = 0.41) or at 5 years (RR 2.42, 95% CI 0.98 to 5.98; n = 27; Analysis 4.5) Quantification of symptoms Not reported Clinician's observations Data suggest there were more women with incontinence (clinician‐observed) within the first year with injectables compared with the traditional sling: 4/21 vs 20/22 (RR 0.21, 95% 0.09 to 0.21; n = 43; Maher 2005; Analysis 4.6) Surgical outcome measures Injectables were quicker to perform, involved shorter hospital stay and time to catheter removal, and led to quicker return to normal activity than after traditional sling surgery, but the data were not suitable for meta‐analysis (Maher 2005) Further treatment Not reported Adverse events Perioperative surgical complications Not reported Bladder perforation Not reported Urinary tract infection Maher 2005 reported no evidence of a difference between traditional slings and injectables in the numbers of women with urinary tract infection (RR 1.57, 95% CI 0.29 to 8.49; very low‐quality evidence; Analysis 4.7;summary of findings Table 4) Urinary urgency symptoms, urgency urinary incontinence Not reported Detrusor overactivity (urodynamic overactivity) Maher 2005 reported no evidence of a difference between traditional slings and injectables in the numbers of women with de novo detrusor overactivity (RR 3.14, 95% CI 0.13 to 72.96; Analysis 4.8) Voiding dysfunction (with or without urodynamic confirmation) Maher 2005 reported no evidence of a difference between traditional slings and injectables in the numbers of women with voiding dysfunction (RR 4.19, 95% CI 0.51 to 34.50; Analysis 4.9) Long‐term adverse effects Not reported Quality of life Maher 2005 reported a significant reduction in Incontinence Impact Questionnaire (IIQ) scores compared with baseline (P < 0.01) in both groups, although he provided no data | |
| Comparison 6. Traditional suburethral sling operation vs bladder neck needle suspension (abdominal and vaginal) | |
| Only 1 trial compared porcine dermis sling vs Stamey needle suspension (Hilton 1989). This was a small trial with only 10 women in each arm. The women were unsuitable for abdominal colposuspension (the study author's preferred procedure) because they had vaginal narrowing secondary to previous interventions or atrophic vaginitis. Thus they constitute a population of women with SUI who are not typical of the majority. All women had urodynamic stress incontinence. Groups were comparable for age, parity, previous interventions, and hormonal status. Follow‐up was reported at 3 months and 24 months. Due to the small size of the trial, the data were too few to be reliable Primary outcomes Number of continent (dry) women Short‐term: within the first year after surgery, 1 small trial reported 9/10 and 8/10 continent women in the traditional sling and needle suspension groups, respectively (OR 2.25, 95% CI 0.17 to 29.77; n = 20; Hilton 1989; Analysis 6.1) Medium‐term: very low‐quality evidence from 1 trial comparing slings vs bladder neck needle suspension suggested no evidence of a difference between groups in the likelihood of being continent at 2 years after surgery (OR 3.86, 95% CI 0.33 to 45.57; n = 20; Hilton 1989; Analysis 6.2;summary of findings Table 6) Long‐term: not reported Number of women who have repeat continence surgery Not reported Secondary outcomes Women's observations Number of women cured at 1 year or later (women's observations) Evidence from 1 small trial comparing slings vs bladder neck needle suspension suggests no difference between groups in cure rates at 2 years after surgery (OR 3.86, 95% CI 0.33 to 45.57; n = 20; Hilton 1989) Quantification of symptoms Pad test at 12 months and 24 months stated but not reported (Hilton 1989) Clinician's observations Not reported Surgical outcome measures Duration of operation Not reported Length of hospital stay Sling group needed an indwelling catheter for longer and more adjuvant therapy, resulting in a longer stay in hospital than those with bladder neck needle suspension (MD 13 days longer, 95% CI 5 to 21; n = 20; Hilton 1989; Analysis 6.4) Time to return to normal activity level Not reported Blood loss Not reported Further treatment Not reported Adverse events Perioperative surgical complications Nine of the 10 women who had sling operations had complications, compared with 2/10 who had needle suspension. These included pyrexia, blood loss, wound infection, and pulmonary embolus (RR 4.50, 95% CI 1.28 to 15.81; n = 20; very low‐quality evidence; Hilton 1989; Analysis 6.5;summary of findings Table 6) Bladder perforation Not reported Urinary tract infection Not reported Urinary urgency symptoms, urgency urinary incontinence At 3 months: sling: 5/10, needle suspension: 3/10 (Hilton 1989; Analysis 6.6) Detrusor overactivity (urodynamic overactivity) At 3 months: sling: 2/10, needle suspension: 1/10 (Hilton 1989; Analysis 6.7) Voiding dysfunction (with or without urodynamic confirmation) At 3 months: sling: 4/10, needle suspension: 2/10 (Hilton 1989; Analysis 6.8) Long‐term adverse effects Not reported Quality of life Not reported | |
| Comparison 10. Traditional suburethral sling operation vs a single‐incision sling (mini‐sling) | |
| One small trial compared a rectus fascia pubovaginal traditional sling vs a single‐incision sling (mini‐sling; Ophira) and included women with urodynamically diagnosed stress urinary incontinence (USI) (Sharifiaghdas 2015) Due to the small size of the trial, the data were too few to be reliable Primary outcomes Number of continent (dry) women Short‐term: not reported Medium‐term: exactly the same proportion of women were continent at 1 year after surgery (traditional sling: 31/35; mini‐sling: 31/35; very low‐quality evidence; Sharifiaghdas 2015; Analysis 10.1;summary of findings Table 10) Long‐term: not reported Number of women who have repeat continence surgery Not reported Secondary outcomes Women's observations Cure For self‐report of cure at 1 year after surgery, exactly the same proportion of women were cured (traditional sling: 31/35; mini‐sling: 31/35; Sharifiaghdas 2015; Analysis 10.2) Number of women improved Not reported Number of women satisfied 10/35 women in the traditional sling group and 7/35 in the mini‐sling group reported that they were satisfied with their treatment at 1 year (RR 0.89, 95% CI 0.68 to 1.17; n = 70; Sharifiaghdas 2015; Analysis 10.3) Quantification of symptoms Not reported Clinician's observations The clinician's report of observed stress incontinence concurred with that reported by women ‐ 4 in each group (RR 1.00, 95% CI 0.27 to 3.69; n = 70; Sharifiaghdas 2015) Surgical outcome measures Not reported Further treatment Not reported Adverse effects Perioperative complications Not reported Bladder perforation One woman (of 35) had a bladder perforation in the traditional sling group compared with none (of 35) in the mini‐sling group (very low‐quality evidence; Sharifiaghdas 2008; Analysis 10.5;summary of findings Table 10) Urinary tract infection Not reported Urinary urgency symptoms, urgency urinary incontinence More women in the traditional sling group reported urinary urgency incontinence (5/35) compared with the mini‐sling group (1/35) (RR 5.00, 95% CI 0.62 to 40.64; n = 70; Sharifiaghdas 2015; Analysis 10.6) Detrusor overactivity (urodynamic overactivity) Not reported Voiding dysfunction (with or without urodynamic confirmation) Not reported Long‐term adverse effects Dyspareunia: 3/35 and 4/35 in traditional sling and mini‐sling groups, respectively, reported pain with intercourse (RR 0.75, 95% CI 0.18 to 3.11; n = 70; Sharifiaghdas 2008; Analysis 10.7) Tape or mesh exposure: 1 woman in the traditional sling group and 2 in the mini‐sling group were found to have tape or mesh exposure (RR 0.50, 95% CI 0.05 to 5.27; n = 70; Sharifiaghdas 2008; Analysis 10.8) Quality of life Based on mean IIQ score, quality of life was lower in the traditional sling group compared with the mini‐sling group (MD 7.50, 95% CI 2.23 to 12.77; very low‐quality evidence; Analysis 10.9;summary of findings Table 10) | |
| USI: urodynamically diagnosed stress urinary incontinence VLPP: Valsalva leak point pressure | |
| Outcome or subgroup title | No. of studies | No. of participants | Statistical method | Effect size |
| 1 Number of continent women within 1 year (any definition) Show forest plot | 1 | Odds Ratio (M‐H, Fixed, 95% CI) | Totals not selected | |
| 1.1 urodynamic stress incontinence (only) | 0 | Odds Ratio (M‐H, Fixed, 95% CI) | 0.0 [0.0, 0.0] | |
| 1.2 stress urinary incontinence (symptoms only) | 0 | Odds Ratio (M‐H, Fixed, 95% CI) | 0.0 [0.0, 0.0] | |
| 1.3 mixed incontinence | 1 | Odds Ratio (M‐H, Fixed, 95% CI) | 0.0 [0.0, 0.0] | |
| 2 Urge urinary symptoms, urgency urinary incontinence Show forest plot | 1 | Risk Ratio (M‐H, Fixed, 95% CI) | Totals not selected | |
| 2.1 urodynamic stress incontinence (only) | 0 | Risk Ratio (M‐H, Fixed, 95% CI) | 0.0 [0.0, 0.0] | |
| 2.2 stress urinary incontinence (symptoms only) | 0 | Risk Ratio (M‐H, Fixed, 95% CI) | 0.0 [0.0, 0.0] | |
| 2.3 mixed incontinence | 1 | Risk Ratio (M‐H, Fixed, 95% CI) | 0.0 [0.0, 0.0] | |
| Outcome or subgroup title | No. of studies | No. of participants | Statistical method | Effect size |
| 1 Number of continent women within 1 year (any definition) Show forest plot | 1 | Odds Ratio (M‐H, Fixed, 95% CI) | Totals not selected | |
| 1.1 urodynamic stress incontinence (only) | 1 | Odds Ratio (M‐H, Fixed, 95% CI) | 0.0 [0.0, 0.0] | |
| 1.2 stress urinary incontinence (symptoms only) | 0 | Odds Ratio (M‐H, Fixed, 95% CI) | 0.0 [0.0, 0.0] | |
| 1.3 mixed urinary incontinence | 0 | Odds Ratio (M‐H, Fixed, 95% CI) | 0.0 [0.0, 0.0] | |
| 2 Number of continent women at 1 to 5 years (any definition) Show forest plot | 1 | Odds Ratio (M‐H, Fixed, 95% CI) | Totals not selected | |
| 2.1 urodynamic stress incontinence (only) | 1 | Odds Ratio (M‐H, Fixed, 95% CI) | 0.0 [0.0, 0.0] | |
| 2.2 stress urinary incontinence (symptoms only) | 0 | Odds Ratio (M‐H, Fixed, 95% CI) | 0.0 [0.0, 0.0] | |
| 2.3 mixed urinary incontinence | 0 | Odds Ratio (M‐H, Fixed, 95% CI) | 0.0 [0.0, 0.0] | |
| 3 Repeat surgery for urinary incontinence Show forest plot | 1 | Risk Ratio (M‐H, Fixed, 95% CI) | Totals not selected | |
| 3.1 urodynamic stress incontinence (only) | 1 | Risk Ratio (M‐H, Fixed, 95% CI) | 0.0 [0.0, 0.0] | |
| 3.2 stress urinary incontinence (symptoms only) | 0 | Risk Ratio (M‐H, Fixed, 95% CI) | 0.0 [0.0, 0.0] | |
| 3.3 mixed urinary incontinence | 0 | Risk Ratio (M‐H, Fixed, 95% CI) | 0.0 [0.0, 0.0] | |
| 4 Number of women cured after first year (women's observations) Show forest plot | 1 | Odds Ratio (M‐H, Fixed, 95% CI) | Totals not selected | |
| 4.1 urodynamic stress incontinence (only) | 1 | Odds Ratio (M‐H, Fixed, 95% CI) | 0.0 [0.0, 0.0] | |
| 4.2 stress urinary incontinence (symptoms only) | 0 | Odds Ratio (M‐H, Fixed, 95% CI) | 0.0 [0.0, 0.0] | |
| 4.3 mixed urinary incontinence | 0 | Odds Ratio (M‐H, Fixed, 95% CI) | 0.0 [0.0, 0.0] | |
| 5 Number of women satisfied (women's observations) Show forest plot | 1 | Risk Ratio (M‐H, Fixed, 95% CI) | Totals not selected | |
| 5.1 urodynamic stress incontinence (only) | 1 | Risk Ratio (M‐H, Fixed, 95% CI) | 0.0 [0.0, 0.0] | |
| 5.2 stress urinary incontinence (symptoms only) | 0 | Risk Ratio (M‐H, Fixed, 95% CI) | 0.0 [0.0, 0.0] | |
| 5.3 mixed incontinence | 0 | Risk Ratio (M‐H, Fixed, 95% CI) | 0.0 [0.0, 0.0] | |
| 6 Number of women with urinary incontinence within first year (clinician's observations) Show forest plot | 1 | Risk Ratio (M‐H, Fixed, 95% CI) | Totals not selected | |
| 6.1 urodynamic stress incontinence (only) | 1 | Risk Ratio (M‐H, Fixed, 95% CI) | 0.0 [0.0, 0.0] | |
| 6.2 stress urinary incontinence (symptoms only) | 0 | Risk Ratio (M‐H, Fixed, 95% CI) | 0.0 [0.0, 0.0] | |
| 6.3 mixed urinary incontinence | 0 | Risk Ratio (M‐H, Fixed, 95% CI) | 0.0 [0.0, 0.0] | |
| 7 Urinary tract infection Show forest plot | 1 | Risk Ratio (M‐H, Fixed, 95% CI) | Totals not selected | |
| 7.1 urodynamic stress incontinence (only) | 1 | Risk Ratio (M‐H, Fixed, 95% CI) | 0.0 [0.0, 0.0] | |
| 7.2 stress urinary incontinence (symptoms only) | 0 | Risk Ratio (M‐H, Fixed, 95% CI) | 0.0 [0.0, 0.0] | |
| 7.3 mixed urinary incontinence | 0 | Risk Ratio (M‐H, Fixed, 95% CI) | 0.0 [0.0, 0.0] | |
| 8 De novo detrusor overactivity (urodynamic diagnosis) Show forest plot | 1 | Risk Ratio (M‐H, Fixed, 95% CI) | Totals not selected | |
| 8.1 urodynamic stress incontinence (only) | 1 | Risk Ratio (M‐H, Fixed, 95% CI) | 0.0 [0.0, 0.0] | |
| 8.2 stress urinary incontinence (symptoms only) | 0 | Risk Ratio (M‐H, Fixed, 95% CI) | 0.0 [0.0, 0.0] | |
| 8.3 mixed urinary incontinence | 0 | Risk Ratio (M‐H, Fixed, 95% CI) | 0.0 [0.0, 0.0] | |
| 9 Voiding dysfunction Show forest plot | 1 | Risk Ratio (M‐H, Fixed, 95% CI) | Totals not selected | |
| 9.1 urodynamic stress incontinence (only) | 1 | Risk Ratio (M‐H, Fixed, 95% CI) | 0.0 [0.0, 0.0] | |
| 9.2 stress urinary incontinence (symptoms only) | 0 | Risk Ratio (M‐H, Fixed, 95% CI) | 0.0 [0.0, 0.0] | |
| 9.3 mixed urinary incontinence | 0 | Risk Ratio (M‐H, Fixed, 95% CI) | 0.0 [0.0, 0.0] | |
| Outcome or subgroup title | No. of studies | No. of participants | Statistical method | Effect size |
| 1 Number of continent women within 1 year (any definition) Show forest plot | 1 | Odds Ratio (M‐H, Fixed, 95% CI) | Totals not selected | |
| 1.1 urodynamic stress incontinence (only) | 1 | Odds Ratio (M‐H, Fixed, 95% CI) | 0.0 [0.0, 0.0] | |
| 1.2 stress urinary incontinence (symptoms only) | 0 | Odds Ratio (M‐H, Fixed, 95% CI) | 0.0 [0.0, 0.0] | |
| 1.3 mixed incontinence | 0 | Odds Ratio (M‐H, Fixed, 95% CI) | 0.0 [0.0, 0.0] | |
| 2 Number of continent women at 1 to 5 years (any definition) Show forest plot | 1 | Odds Ratio (M‐H, Fixed, 95% CI) | Totals not selected | |
| 2.1 urodynamic stress incontinence (only) | 1 | Odds Ratio (M‐H, Fixed, 95% CI) | 0.0 [0.0, 0.0] | |
| 2.2 stress urinary incontinence (symptoms only) | 0 | Odds Ratio (M‐H, Fixed, 95% CI) | 0.0 [0.0, 0.0] | |
| 2.3 mixed incontinence | 0 | Odds Ratio (M‐H, Fixed, 95% CI) | 0.0 [0.0, 0.0] | |
| 3 CURE: number of women cured after first year (women's observations) Show forest plot | 1 | Odds Ratio (M‐H, Fixed, 95% CI) | Totals not selected | |
| 3.1 urodynamic stress incontinence (only) | 1 | Odds Ratio (M‐H, Fixed, 95% CI) | 0.0 [0.0, 0.0] | |
| 3.2 stress urinary incontinence (symptoms only) | 0 | Odds Ratio (M‐H, Fixed, 95% CI) | 0.0 [0.0, 0.0] | |
| 3.3 mixed incontinence | 0 | Odds Ratio (M‐H, Fixed, 95% CI) | 0.0 [0.0, 0.0] | |
| 4 Length of hospital stay (hours) Show forest plot | 1 | Mean Difference (IV, Fixed, 95% CI) | Totals not selected | |
| 4.1 urodynamic stress incontinence (only) | 1 | Mean Difference (IV, Fixed, 95% CI) | 0.0 [0.0, 0.0] | |
| 4.2 stress urinary incontinence (symptoms only) | 0 | Mean Difference (IV, Fixed, 95% CI) | 0.0 [0.0, 0.0] | |
| 4.3 mixed incontinence | 0 | Mean Difference (IV, Fixed, 95% CI) | 0.0 [0.0, 0.0] | |
| 5 Perioperative surgical complications Show forest plot | 1 | Risk Ratio (M‐H, Fixed, 95% CI) | Totals not selected | |
| 5.1 urodynamic stress incontinence (only) | 1 | Risk Ratio (M‐H, Fixed, 95% CI) | 0.0 [0.0, 0.0] | |
| 5.2 stress urinary incontinence (symptoms only) | 0 | Risk Ratio (M‐H, Fixed, 95% CI) | 0.0 [0.0, 0.0] | |
| 5.3 mixed incontinence | 0 | Risk Ratio (M‐H, Fixed, 95% CI) | 0.0 [0.0, 0.0] | |
| 6 Urinary urgency symptoms, urgency urinary incontinence Show forest plot | 1 | Risk Ratio (M‐H, Fixed, 95% CI) | Totals not selected | |
| 6.1 urodynamic stress incontinence (only) | 1 | Risk Ratio (M‐H, Fixed, 95% CI) | 0.0 [0.0, 0.0] | |
| 6.2 stress urinary incontinence (symptoms only) | 0 | Risk Ratio (M‐H, Fixed, 95% CI) | 0.0 [0.0, 0.0] | |
| 6.3 mixed incontinence | 0 | Risk Ratio (M‐H, Fixed, 95% CI) | 0.0 [0.0, 0.0] | |
| 7 Detrusor overactivity (urodynamic diagnosis) Show forest plot | 1 | Risk Ratio (M‐H, Fixed, 95% CI) | Totals not selected | |
| 7.1 urodynamic stress incontinence (only) | 1 | Risk Ratio (M‐H, Fixed, 95% CI) | 0.0 [0.0, 0.0] | |
| 7.2 stress urinary incontinence (symptoms only) | 0 | Risk Ratio (M‐H, Fixed, 95% CI) | 0.0 [0.0, 0.0] | |
| 7.3 mixed incontinence | 0 | Risk Ratio (M‐H, Fixed, 95% CI) | 0.0 [0.0, 0.0] | |
| 8 Voiding dysfunction after 3 months Show forest plot | 1 | Risk Ratio (M‐H, Fixed, 95% CI) | Totals not selected | |
| 8.1 urodynamic stress incontinence (only) | 1 | Risk Ratio (M‐H, Fixed, 95% CI) | 0.0 [0.0, 0.0] | |
| 8.2 stress urinary incontinence (symptoms only) | 0 | Risk Ratio (M‐H, Fixed, 95% CI) | 0.0 [0.0, 0.0] | |
| 8.3 mixed incontinence | 0 | Risk Ratio (M‐H, Fixed, 95% CI) | 0.0 [0.0, 0.0] | |
| Outcome or subgroup title | No. of studies | No. of participants | Statistical method | Effect size |
| 1 Number of continent women within 1 year (any definition) Show forest plot | 4 | 147 | Odds Ratio (M‐H, Fixed, 95% CI) | 2.70 [0.69, 10.55] |
| 1.1 urodynamic stress incontinence (only) | 4 | 147 | Odds Ratio (M‐H, Fixed, 95% CI) | 2.70 [0.69, 10.55] |
| 1.2 stress urinary incontinence (symptoms only) | 0 | 0 | Odds Ratio (M‐H, Fixed, 95% CI) | 0.0 [0.0, 0.0] |
| 1.3 mixed incontinence | 0 | 0 | Odds Ratio (M‐H, Fixed, 95% CI) | 0.0 [0.0, 0.0] |
| 2 Number of continent women at 1 to 5 years (any definition) Show forest plot | 4 | 687 | Odds Ratio (M‐H, Fixed, 95% CI) | 1.70 [1.22, 2.37] |
| 2.1 urodynamic stress incontinence (only) | 3 | 167 | Odds Ratio (M‐H, Fixed, 95% CI) | 1.84 [0.65, 5.24] |
| 2.2 stress urinary incontinence (symptoms only) | 1 | 520 | Odds Ratio (M‐H, Fixed, 95% CI) | 1.69 [1.19, 2.39] |
| 2.3 mixed incontinence | 0 | 0 | Odds Ratio (M‐H, Fixed, 95% CI) | 0.0 [0.0, 0.0] |
| 3 Number of continent women after 5 years (any definition) Show forest plot | 2 | 481 | Odds Ratio (M‐H, Fixed, 95% CI) | 1.55 [1.06, 2.27] |
| 3.1 urodynamic stress incontinence (only) | 1 | 28 | Odds Ratio (M‐H, Fixed, 95% CI) | 0.39 [0.03, 4.92] |
| 3.2 stress urinary incontinence (symptoms only) | 1 | 453 | Odds Ratio (M‐H, Fixed, 95% CI) | 1.61 [1.09, 2.37] |
| 3.3 mixed incontinence | 0 | 0 | Odds Ratio (M‐H, Fixed, 95% CI) | 0.0 [0.0, 0.0] |
| 4 Repeat surgery for urinary incontinence Show forest plot | 1 | Risk Ratio (M‐H, Fixed, 95% CI) | Totals not selected | |
| 4.1 urodynamic stress incontinence (only) | 0 | Risk Ratio (M‐H, Fixed, 95% CI) | 0.0 [0.0, 0.0] | |
| 4.2 stress urinary incontinence (symptoms only) | 1 | Risk Ratio (M‐H, Fixed, 95% CI) | 0.0 [0.0, 0.0] | |
| 4.3 mixed incontinence | 0 | Risk Ratio (M‐H, Fixed, 95% CI) | 0.0 [0.0, 0.0] | |
| 5 Number of women cured after first year (women's observations) Show forest plot | 3 | 515 | Odds Ratio (M‐H, Fixed, 95% CI) | 1.56 [1.07, 2.28] |
| 5.1 urodynamic stress incontinence (only) | 2 | 62 | Odds Ratio (M‐H, Fixed, 95% CI) | 0.93 [0.18, 4.89] |
| 5.2 stress urinary incontinence (symptoms only) | 1 | 453 | Odds Ratio (M‐H, Fixed, 95% CI) | 1.61 [1.09, 2.37] |
| 5.3 mixed incontinence | 0 | 0 | Odds Ratio (M‐H, Fixed, 95% CI) | 0.0 [0.0, 0.0] |
| 6 Number of women satisfied (women's observations) Show forest plot | 1 | Risk Ratio (M‐H, Fixed, 95% CI) | Totals not selected | |
| 6.1 urodynamic stress incontinence (only) | 0 | Risk Ratio (M‐H, Fixed, 95% CI) | 0.0 [0.0, 0.0] | |
| 6.2 stress urinary incontinence (symptoms only) | 1 | Risk Ratio (M‐H, Fixed, 95% CI) | 0.0 [0.0, 0.0] | |
| 6.3 mixed incontinence | 0 | Risk Ratio (M‐H, Fixed, 95% CI) | 0.0 [0.0, 0.0] | |
| 7 Number of women with urinary incontinence within first year (clinician's observations) | 0 | 0 | Risk Ratio (M‐H, Fixed, 95% CI) | 0.0 [0.0, 0.0] |
| 7.1 urodynamic stress incontinence (only) | 0 | 0 | Risk Ratio (M‐H, Fixed, 95% CI) | 0.0 [0.0, 0.0] |
| 7.2 stress urinary incontinence (symptoms only) | 0 | 0 | Risk Ratio (M‐H, Fixed, 95% CI) | 0.0 [0.0, 0.0] |
| 7.3 mixed incontinence | 0 | 0 | Risk Ratio (M‐H, Fixed, 95% CI) | 0.0 [0.0, 0.0] |
| 8 Number of women with urinary incontinence at 1 to 5 years (clinician's observations) Show forest plot | 3 | 626 | Risk Ratio (M‐H, Fixed, 95% CI) | 0.88 [0.59, 1.31] |
| 8.1 urodynamic stress incontinence (only) | 2 | 106 | Risk Ratio (M‐H, Fixed, 95% CI) | 0.54 [0.16, 1.86] |
| 8.2 stress urinary incontinence (symptoms only) | 1 | 520 | Risk Ratio (M‐H, Fixed, 95% CI) | 0.94 [0.62, 1.42] |
| 8.3 mixed incontinence | 0 | 0 | Risk Ratio (M‐H, Fixed, 95% CI) | 0.0 [0.0, 0.0] |
| 9 Number of women with urinary incontinence after 5 years (clinician's observations) Show forest plot | 2 | 461 | Risk Ratio (M‐H, Fixed, 95% CI) | 0.90 [0.80, 1.01] |
| 9.1 urodynamic stress incontinence (only) | 1 | 28 | Risk Ratio (M‐H, Fixed, 95% CI) | 0.23 [0.01, 4.37] |
| 9.2 stress urinary incontinence (symptoms only) | 1 | 433 | Risk Ratio (M‐H, Fixed, 95% CI) | 0.91 [0.81, 1.02] |
| 9.3 mixed incontinence | 0 | 0 | Risk Ratio (M‐H, Fixed, 95% CI) | 0.0 [0.0, 0.0] |
| 10 Duration of operation (minutes) Show forest plot | 1 | Mean Difference (IV, Fixed, 95% CI) | Totals not selected | |
| 10.1 urodynamic stress incontinence (only) | 1 | Mean Difference (IV, Fixed, 95% CI) | 0.0 [0.0, 0.0] | |
| 10.2 stress urinary incontinence (symptoms only) | 0 | Mean Difference (IV, Fixed, 95% CI) | 0.0 [0.0, 0.0] | |
| 10.3 mixed incontinence | 0 | Mean Difference (IV, Fixed, 95% CI) | 0.0 [0.0, 0.0] | |
| 11 Length of hospital stay (days) Show forest plot | 3 | 137 | Mean Difference (IV, Fixed, 95% CI) | 2.03 [1.47, 2.59] |
| 11.1 urodynamic stress incontinence (only) | 3 | 137 | Mean Difference (IV, Fixed, 95% CI) | 2.03 [1.47, 2.59] |
| 11.2 stress urinary incontinence (symptoms only) | 0 | 0 | Mean Difference (IV, Fixed, 95% CI) | 0.0 [0.0, 0.0] |
| 11.3 mixed incontinence | 0 | 0 | Mean Difference (IV, Fixed, 95% CI) | 0.0 [0.0, 0.0] |
| 12 Time to catheter removal (days) Show forest plot | 2 | 108 | Mean Difference (IV, Fixed, 95% CI) | 8.01 [6.84, 9.18] |
| 12.1 urodynamic stress incontinence (only) | 2 | 108 | Mean Difference (IV, Fixed, 95% CI) | 8.01 [6.84, 9.18] |
| 12.2 stress urinary incontinence (symptoms only) | 0 | 0 | Mean Difference (IV, Fixed, 95% CI) | 0.0 [0.0, 0.0] |
| 12.3 mixed incontinence | 0 | 0 | Mean Difference (IV, Fixed, 95% CI) | 0.0 [0.0, 0.0] |
| 13 Time to return to normal activity level | 0 | 0 | Mean Difference (IV, Fixed, 95% CI) | 0.0 [0.0, 0.0] |
| 13.1 urodynamic stress incontinence (only) | 0 | 0 | Mean Difference (IV, Fixed, 95% CI) | 0.0 [0.0, 0.0] |
| 13.2 stress urinary incontinence (symptoms only) | 0 | 0 | Mean Difference (IV, Fixed, 95% CI) | 0.0 [0.0, 0.0] |
| 13.3 mixed incontinence | 0 | 0 | Mean Difference (IV, Fixed, 95% CI) | 0.0 [0.0, 0.0] |
| 14 Number of women requiring treatment for pelvic organ prolapse Show forest plot | 3 | 559 | Risk Ratio (M‐H, Fixed, 95% CI) | 0.20 [0.05, 0.77] |
| 14.1 urodynamic stress incontinence (only) | 2 | 106 | Risk Ratio (M‐H, Fixed, 95% CI) | 0.2 [0.04, 1.11] |
| 14.2 stress urinary incontinence (symptoms only) | 1 | 453 | Risk Ratio (M‐H, Fixed, 95% CI) | 0.20 [0.02, 1.74] |
| 14.3 mixed incontinence | 0 | 0 | Risk Ratio (M‐H, Fixed, 95% CI) | 0.0 [0.0, 0.0] |
| 15 Perioperative surgical complications Show forest plot | 4 | 792 | Risk Ratio (M‐H, Fixed, 95% CI) | 1.24 [0.83, 1.86] |
| 15.1 urodynamic stress incontinence (only) | 3 | 137 | Risk Ratio (M‐H, Fixed, 95% CI) | 0.85 [0.28, 2.52] |
| 15.2 stress urinary incontinence (symptoms only) | 1 | 655 | Risk Ratio (M‐H, Fixed, 95% CI) | 1.32 [0.86, 2.04] |
| 15.3 mixed incontinence | 0 | 0 | Risk Ratio (M‐H, Fixed, 95% CI) | 0.0 [0.0, 0.0] |
| 16 Bladder perforation Show forest plot | 1 | Risk Ratio (M‐H, Fixed, 95% CI) | Totals not selected | |
| 16.1 urodynamic stress incontinence (only) | 0 | Risk Ratio (M‐H, Fixed, 95% CI) | 0.0 [0.0, 0.0] | |
| 16.2 stress urinary incontinence (symptoms only) | 1 | Risk Ratio (M‐H, Fixed, 95% CI) | 0.0 [0.0, 0.0] | |
| 16.3 mixed incontinence | 0 | Risk Ratio (M‐H, Fixed, 95% CI) | 0.0 [0.0, 0.0] | |
| 17 Urinary tract infection Show forest plot | 1 | Risk Ratio (M‐H, Fixed, 95% CI) | Totals not selected | |
| 17.1 urodynamic stress incontinence (only) | 0 | Risk Ratio (M‐H, Fixed, 95% CI) | 0.0 [0.0, 0.0] | |
| 17.2 stress urinary incontinence (symptoms only) | 1 | Risk Ratio (M‐H, Fixed, 95% CI) | 0.0 [0.0, 0.0] | |
| 17.3 mixed incontinence | 0 | Risk Ratio (M‐H, Fixed, 95% CI) | 0.0 [0.0, 0.0] | |
| 18 Number of women with recurrent UTIs at > 5 years Show forest plot | 1 | Risk Ratio (M‐H, Fixed, 95% CI) | Totals not selected | |
| 18.1 urodynamic stress incontinence (only) | 0 | Risk Ratio (M‐H, Fixed, 95% CI) | 0.0 [0.0, 0.0] | |
| 18.2 stress urinary incontinence (symptoms only) | 1 | Risk Ratio (M‐H, Fixed, 95% CI) | 0.0 [0.0, 0.0] | |
| 18.3 mixed incontinence | 0 | Risk Ratio (M‐H, Fixed, 95% CI) | 0.0 [0.0, 0.0] | |
| 19 Urinary urgency symptoms, urgency urinary incontinence Show forest plot | 2 | 525 | Risk Ratio (M‐H, Fixed, 95% CI) | 1.10 [0.74, 1.64] |
| 19.1 urodynamic stress incontinence (only) | 1 | 72 | Risk Ratio (M‐H, Fixed, 95% CI) | 2.0 [0.54, 7.39] |
| 19.2 stress urinary incontinence (symptoms only) | 1 | 453 | Risk Ratio (M‐H, Fixed, 95% CI) | 1.02 [0.67, 1.56] |
| 19.3 mixed incontinence | 0 | 0 | Risk Ratio (M‐H, Fixed, 95% CI) | 0.0 [0.0, 0.0] |
| 20 Detrusor overactivity (urodynamic diagnosis) Show forest plot | 4 | 203 | Risk Ratio (M‐H, Fixed, 95% CI) | 1.42 [0.52, 3.87] |
| 20.1 urodynamic stress incontinence (only) | 4 | 203 | Risk Ratio (M‐H, Fixed, 95% CI) | 1.42 [0.52, 3.87] |
| 20.2 stress urinary incontinence (symptoms only) | 0 | 0 | Risk Ratio (M‐H, Fixed, 95% CI) | 0.0 [0.0, 0.0] |
| 20.3 mixed incontinence | 0 | 0 | Risk Ratio (M‐H, Fixed, 95% CI) | 0.0 [0.0, 0.0] |
| 21 Voiding dysfunction after 3 months Show forest plot | 5 | 853 | Risk Ratio (M‐H, Fixed, 95% CI) | 6.08 [3.10, 11.95] |
| 21.1 urodynamic stress incontinence (only) | 4 | 198 | Risk Ratio (M‐H, Fixed, 95% CI) | 4.48 [1.16, 17.36] |
| 21.2 stress urinary incontinence (symptoms only) | 1 | 655 | Risk Ratio (M‐H, Fixed, 95% CI) | 6.63 [3.04, 14.47] |
| 21.3 mixed incontinence | 0 | 0 | Risk Ratio (M‐H, Fixed, 95% CI) | 0.0 [0.0, 0.0] |
| 22 Long‐term voiding dysfunction > 5 years Show forest plot | 1 | Risk Ratio (M‐H, Fixed, 95% CI) | Totals not selected | |
| 22.1 urodynamic stress incontinence (only) | 0 | Risk Ratio (M‐H, Fixed, 95% CI) | 0.0 [0.0, 0.0] | |
| 22.2 stress urinary incontinence (symptoms only) | 1 | Risk Ratio (M‐H, Fixed, 95% CI) | 0.0 [0.0, 0.0] | |
| 22.3 mixed incontinence | 0 | Risk Ratio (M‐H, Fixed, 95% CI) | 0.0 [0.0, 0.0] | |
| 23 Condition‐specific measures to assess quality of life Show forest plot | 1 | Mean Difference (IV, Fixed, 95% CI) | Totals not selected | |
| 23.1 Urinary Distress Index (UDI) | 1 | Mean Difference (IV, Fixed, 95% CI) | 0.0 [0.0, 0.0] | |
| 23.2 Incontinence Impact Questionnaire (IIQ) | 1 | Mean Difference (IV, Fixed, 95% CI) | 0.0 [0.0, 0.0] | |
| Outcome or subgroup title | No. of studies | No. of participants | Statistical method | Effect size |
| 1 Number of continent women within 1 year (any definition) Show forest plot | 11 | 841 | Odds Ratio (M‐H, Fixed, 95% CI) | 0.94 [0.67, 1.32] |
| 1.1 urodynamic stress incontinence (only) | 5 | 427 | Odds Ratio (M‐H, Fixed, 95% CI) | 0.97 [0.60, 1.56] |
| 1.2 stress urinary incontinence (symptoms only) | 1 | 53 | Odds Ratio (M‐H, Fixed, 95% CI) | 0.88 [0.12, 6.79] |
| 1.3 mixed urinary incontinence | 5 | 361 | Odds Ratio (M‐H, Fixed, 95% CI) | 0.91 [0.55, 1.51] |
| 2 Number of continent women at 1 to 5 years (any definition) Show forest plot | 6 | 458 | Odds Ratio (M‐H, Fixed, 95% CI) | 0.67 [0.44, 1.02] |
| 2.1 urodynamic stress incontinence (only) | 4 | 364 | Odds Ratio (M‐H, Fixed, 95% CI) | 0.77 [0.47, 1.25] |
| 2.2 stress urinary incontinence (symptoms only) | 0 | 0 | Odds Ratio (M‐H, Fixed, 95% CI) | 0.0 [0.0, 0.0] |
| 2.3 mixed urinary incontinence | 2 | 94 | Odds Ratio (M‐H, Fixed, 95% CI) | 0.42 [0.17, 1.04] |
| 3 Number of continent women after 5 years (any definition) Show forest plot | 1 | Odds Ratio (M‐H, Fixed, 95% CI) | Totals not selected | |
| 3.1 urodynamic stress incontinence (only) | 1 | Odds Ratio (M‐H, Fixed, 95% CI) | 0.0 [0.0, 0.0] | |
| 3.2 stress urinary incontinence (symptoms only) | 0 | Odds Ratio (M‐H, Fixed, 95% CI) | 0.0 [0.0, 0.0] | |
| 3.3 mixed urinary incontinence | 0 | Odds Ratio (M‐H, Fixed, 95% CI) | 0.0 [0.0, 0.0] | |
| 4 Repeat surgery for urinary incontinence Show forest plot | 1 | Risk Ratio (M‐H, Fixed, 95% CI) | Totals not selected | |
| 4.1 urodynamic stress incontinence (only) | 1 | Risk Ratio (M‐H, Fixed, 95% CI) | 0.0 [0.0, 0.0] | |
| 4.2 stress urinary incontinence (symptoms only) | 1 | Risk Ratio (M‐H, Fixed, 95% CI) | 0.0 [0.0, 0.0] | |
| 4.3 mixed incontinence | 0 | Risk Ratio (M‐H, Fixed, 95% CI) | 0.0 [0.0, 0.0] | |
| 5 Number of women cured after first year (women's observations) Show forest plot | 4 | 337 | Odds Ratio (M‐H, Fixed, 95% CI) | 1.06 [0.65, 1.72] |
| 5.1 urodynamic stress incontinence (only) | 3 | 293 | Odds Ratio (M‐H, Fixed, 95% CI) | 1.21 [0.72, 2.03] |
| 5.2 stress urinary incontinence (symptoms only) | 0 | 0 | Odds Ratio (M‐H, Fixed, 95% CI) | 0.0 [0.0, 0.0] |
| 5.3 mixed urinary incontinence | 1 | 44 | Odds Ratio (M‐H, Fixed, 95% CI) | 0.42 [0.10, 1.72] |
| 6 Number of women improved or cured within 1 year (women's observations) Show forest plot | 3 | 425 | Odds Ratio (M‐H, Fixed, 95% CI) | 1.33 [0.74, 2.39] |
| 6.1 urodynamic stress incontinence (only) | 2 | 286 | Odds Ratio (M‐H, Fixed, 95% CI) | 1.06 [0.43, 2.64] |
| 6.2 stress urinary incontinence (symptoms only) | 0 | 0 | Odds Ratio (M‐H, Fixed, 95% CI) | 0.0 [0.0, 0.0] |
| 6.3 mixed urinary incontinence | 1 | 139 | Odds Ratio (M‐H, Fixed, 95% CI) | 1.56 [0.72, 3.39] |
| 7 Number of women improved or cured at 1 to 5 years (women's observations) Show forest plot | 2 | 264 | Odds Ratio (M‐H, Fixed, 95% CI) | 0.76 [0.31, 1.87] |
| 7.1 urodynamic stress incontinence (only) | 2 | 264 | Odds Ratio (M‐H, Fixed, 95% CI) | 0.76 [0.31, 1.87] |
| 7.2 stress urinary incontinence (symptoms only) | 0 | 0 | Odds Ratio (M‐H, Fixed, 95% CI) | 0.0 [0.0, 0.0] |
| 7.3 mixed urinary incontinence | 0 | 0 | Odds Ratio (M‐H, Fixed, 95% CI) | 0.0 [0.0, 0.0] |
| 8 Number of women improved or cured after 5 years (women's observations) Show forest plot | 1 | Odds Ratio (M‐H, Fixed, 95% CI) | Totals not selected | |
| 8.1 urodynamic stress incontinence (only) | 1 | Odds Ratio (M‐H, Fixed, 95% CI) | 0.0 [0.0, 0.0] | |
| 8.2 stress urinary incontinence (symptoms only) | 0 | Odds Ratio (M‐H, Fixed, 95% CI) | 0.0 [0.0, 0.0] | |
| 8.3 mixed urinary incontinence | 0 | Odds Ratio (M‐H, Fixed, 95% CI) | 0.0 [0.0, 0.0] | |
| 9 Number of women satisfied (women's observations) Show forest plot | 2 | Risk Ratio (M‐H, Fixed, 95% CI) | Subtotals only | |
| 9.1 urodynamic stress incontinence (only) | 2 | 163 | Risk Ratio (M‐H, Fixed, 95% CI) | 1.09 [0.89, 1.33] |
| 9.2 stress urinary incontinence (symptoms only) | 0 | 0 | Risk Ratio (M‐H, Fixed, 95% CI) | 0.0 [0.0, 0.0] |
| 9.3 mixed urinary incontinence | 0 | 0 | Risk Ratio (M‐H, Fixed, 95% CI) | 0.0 [0.0, 0.0] |
| 10 Pad test of quantified leakage (mean weight of urine lost) Show forest plot | 1 | Mean Difference (IV, Fixed, 95% CI) | Totals not selected | |
| 10.1 urodynamic stress incontinence (only) | 1 | Mean Difference (IV, Fixed, 95% CI) | 0.0 [0.0, 0.0] | |
| 10.2 stress urinary incontinence (symptoms only) | 0 | Mean Difference (IV, Fixed, 95% CI) | 0.0 [0.0, 0.0] | |
| 10.3 mixed urinary incontinence | 0 | Mean Difference (IV, Fixed, 95% CI) | 0.0 [0.0, 0.0] | |
| 11 Number of women with urinary incontinence within first year (clinician's observations) Show forest plot | 2 | 105 | Risk Ratio (M‐H, Fixed, 95% CI) | 1.29 [0.45, 3.71] |
| 11.1 urodynamic stress incontinence (only) | 0 | 0 | Risk Ratio (M‐H, Fixed, 95% CI) | 0.0 [0.0, 0.0] |
| 11.2 stress urinary incontinence (symptoms only) | 0 | 0 | Risk Ratio (M‐H, Fixed, 95% CI) | 0.0 [0.0, 0.0] |
| 11.3 mixed urinary incontinence | 2 | 105 | Risk Ratio (M‐H, Fixed, 95% CI) | 1.29 [0.45, 3.71] |
| 12 Number of women with urinary incontinence at 1 to 5 years (any definition) (clinician's observations) Show forest plot | 1 | Risk Ratio (M‐H, Fixed, 95% CI) | Totals not selected | |
| 12.1 urodynamic stress incontinence (only) | 0 | Risk Ratio (M‐H, Fixed, 95% CI) | 0.0 [0.0, 0.0] | |
| 12.2 stress urinary incontinence (symptoms only) | 0 | Risk Ratio (M‐H, Fixed, 95% CI) | 0.0 [0.0, 0.0] | |
| 12.3 mixed urinary incontinence | 1 | Risk Ratio (M‐H, Fixed, 95% CI) | 0.0 [0.0, 0.0] | |
| 13 Duration of operation (minutes) Show forest plot | 7 | 355 | Mean Difference (IV, Fixed, 95% CI) | 57.08 [54.67, 59.49] |
| 13.1 urodynamic stress incontinence (only) | 2 | 61 | Mean Difference (IV, Fixed, 95% CI) | 46.91 [42.31, 51.52] |
| 13.2 stress urinary incontinence (symptoms only) | 1 | 53 | Mean Difference (IV, Fixed, 95% CI) | 20.0 [7.08, 32.92] |
| 13.3 mixed urinary incontinence | 4 | 241 | Mean Difference (IV, Fixed, 95% CI) | 62.96 [60.07, 65.86] |
| 14 Length of hospital stay (days) Show forest plot | 4 | 194 | Mean Difference (IV, Fixed, 95% CI) | 0.74 [0.55, 0.93] |
| 14.1 urodynamic stress incontinence (only) | 1 | 20 | Mean Difference (IV, Fixed, 95% CI) | 0.65 [0.39, 0.91] |
| 14.2 stress urinary incontinence (symptoms only) | 0 | 0 | Mean Difference (IV, Fixed, 95% CI) | 0.0 [0.0, 0.0] |
| 14.3 mixed urinary incontinence | 3 | 174 | Mean Difference (IV, Fixed, 95% CI) | 0.83 [0.56, 1.10] |
| 15 Time to catheter removal (days) Show forest plot | 2 | 113 | Mean Difference (IV, Fixed, 95% CI) | 0.11 [‐0.07, 0.30] |
| 15.1 urodynamic stress incontinence (only) | 0 | 0 | Mean Difference (IV, Fixed, 95% CI) | 0.0 [0.0, 0.0] |
| 15.2 stress urinary incontinence (symptoms only) | 1 | 53 | Mean Difference (IV, Fixed, 95% CI) | 2.3 [0.01, 4.59] |
| 15.3 mixed urinary incontinence | 1 | 60 | Mean Difference (IV, Fixed, 95% CI) | 0.10 [‐0.09, 0.29] |
| 16 Perioperative surgical complications Show forest plot | 4 | 293 | Risk Ratio (M‐H, Fixed, 95% CI) | 1.74 [1.16, 2.60] |
| 16.1 urodynamic stress incontinence (only) | 2 | 183 | Risk Ratio (M‐H, Fixed, 95% CI) | 1.73 [1.01, 2.96] |
| 16.2 stress urinary incontinence (symptoms only) | 0 | 0 | Risk Ratio (M‐H, Fixed, 95% CI) | 0.0 [0.0, 0.0] |
| 16.3 mixed urinary incontinence | 2 | 110 | Risk Ratio (M‐H, Fixed, 95% CI) | 1.74 [0.94, 3.21] |
| 17 Bladder perforations Show forest plot | 10 | 844 | Risk Ratio (M‐H, Fixed, 95% CI) | 0.59 [0.34, 1.01] |
| 17.1 urodynamic stress incontinence (only) | 3 | 334 | Risk Ratio (M‐H, Fixed, 95% CI) | 0.74 [0.19, 2.86] |
| 17.2 stress urinary incontinence (symptoms only) | 1 | 53 | Risk Ratio (M‐H, Fixed, 95% CI) | 0.56 [0.05, 5.81] |
| 17.3 mixed urinary incontinence | 6 | 457 | Risk Ratio (M‐H, Fixed, 95% CI) | 0.56 [0.30, 1.03] |
| 18 Urethral injury Show forest plot | 1 | Risk Ratio (M‐H, Fixed, 95% CI) | Totals not selected | |
| 18.1 urodynamic stress incontinence (only) | 0 | Risk Ratio (M‐H, Fixed, 95% CI) | 0.0 [0.0, 0.0] | |
| 18.2 stress urinary incontinence (symptoms only) | 0 | Risk Ratio (M‐H, Fixed, 95% CI) | 0.0 [0.0, 0.0] | |
| 18.3 mixed urinary incontinence | 1 | Risk Ratio (M‐H, Fixed, 95% CI) | 0.0 [0.0, 0.0] | |
| 19 Vaginal bleeding Show forest plot | 1 | Risk Ratio (M‐H, Fixed, 95% CI) | Totals not selected | |
| 19.1 urodynamic stress incontinence (only) | 0 | Risk Ratio (M‐H, Fixed, 95% CI) | 0.0 [0.0, 0.0] | |
| 19.2 stress urinary incontinence (symptoms only) | 0 | Risk Ratio (M‐H, Fixed, 95% CI) | 0.0 [0.0, 0.0] | |
| 19.3 mixed urinary incontinence | 1 | Risk Ratio (M‐H, Fixed, 95% CI) | 0.0 [0.0, 0.0] | |
| 20 Urinary tract infection Show forest plot | 1 | Risk Ratio (M‐H, Fixed, 95% CI) | Totals not selected | |
| 20.1 urodynamic stress incontinence (only) | 0 | Risk Ratio (M‐H, Fixed, 95% CI) | 0.0 [0.0, 0.0] | |
| 20.2 stress urinary incontinence (symptoms only) | 0 | Risk Ratio (M‐H, Fixed, 95% CI) | 0.0 [0.0, 0.0] | |
| 20.3 mixed urinary incontinence | 1 | Risk Ratio (M‐H, Fixed, 95% CI) | 0.0 [0.0, 0.0] | |
| 21 Voiding dysfunction Show forest plot | 8 | 629 | Risk Ratio (M‐H, Fixed, 95% CI) | 1.34 [0.85, 2.12] |
| 21.1 urodynamic stress incontinence (only) | 3 | 325 | Risk Ratio (M‐H, Fixed, 95% CI) | 1.22 [0.60, 2.46] |
| 21.2 stress urinary incontinence (symptoms only) | 1 | 53 | Risk Ratio (M‐H, Fixed, 95% CI) | 2.61 [0.76, 9.03] |
| 21.3 mixed urinary incontinence | 4 | 251 | Risk Ratio (M‐H, Fixed, 95% CI) | 1.18 [0.58, 2.40] |
| 22 Urinary urgency symptoms, urgency urinary incontinence Show forest plot | 4 | 295 | Risk Ratio (M‐H, Fixed, 95% CI) | 1.50 [0.58, 3.88] |
| 22.1 urodynamic stress incontinence (only) | 1 | 124 | Risk Ratio (M‐H, Fixed, 95% CI) | 0.34 [0.01, 8.29] |
| 22.2 stress urinary incontinence (symptoms only) | 0 | 0 | Risk Ratio (M‐H, Fixed, 95% CI) | 0.0 [0.0, 0.0] |
| 22.3 mixed urinary incontinence | 3 | 171 | Risk Ratio (M‐H, Fixed, 95% CI) | 1.81 [0.65, 5.06] |
| 23 De novo detrusor overactivity (urodynamic diagnosis) Show forest plot | 4 | 325 | Risk Ratio (M‐H, Fixed, 95% CI) | 2.61 [1.17, 5.84] |
| 23.1 urodynamic stress incontinence (only) | 1 | 59 | Risk Ratio (M‐H, Fixed, 95% CI) | 0.0 [0.0, 0.0] |
| 23.2 stress urinary incontinence (symptoms only) | 1 | 47 | Risk Ratio (M‐H, Fixed, 95% CI) | 3.13 [0.13, 73.01] |
| 23.3 mixed urinary incontinence | 2 | 219 | Risk Ratio (M‐H, Fixed, 95% CI) | 2.57 [1.12, 5.92] |
| 24 Long‐term adverse effects (release of sling required) Show forest plot | 3 | 326 | Risk Ratio (M‐H, Fixed, 95% CI) | 2.53 [0.87, 7.35] |
| 24.1 urodynamic stress incontinence (only) | 2 | 266 | Risk Ratio (M‐H, Fixed, 95% CI) | 1.68 [0.50, 5.66] |
| 24.2 stress urinary incontinence (symptoms only) | 0 | 0 | Risk Ratio (M‐H, Fixed, 95% CI) | 0.0 [0.0, 0.0] |
| 24.3 mixed urinary incontinence | 1 | 60 | Risk Ratio (M‐H, Fixed, 95% CI) | 9.6 [0.54, 170.84] |
| 25 Long‐term adverse effects (wound pain at 6 months) Show forest plot | 3 | 257 | Risk Ratio (M‐H, Fixed, 95% CI) | 6.40 [1.94, 21.12] |
| 25.1 urodynamic stress incontinence (only) | 1 | 124 | Risk Ratio (M‐H, Fixed, 95% CI) | 5.16 [0.25, 105.36] |
| 25.2 stress urinary incontinence (symptoms only) | 1 | 53 | Risk Ratio (M‐H, Fixed, 95% CI) | 3.92 [0.90, 17.15] |
| 25.3 mixed urinary incontinence | 1 | 80 | Risk Ratio (M‐H, Fixed, 95% CI) | 17.0 [1.01, 284.96] |
| 26 Long‐term adverse effects (vaginal mesh or graft exposure) Show forest plot | 5 | 348 | Risk Ratio (M‐H, Fixed, 95% CI) | 0.28 [0.05, 1.65] |
| 26.1 urodynamic stress incontinence (only) | 2 | 165 | Risk Ratio (M‐H, Fixed, 95% CI) | 0.35 [0.04, 3.24] |
| 26.2 stress urinary incontinence (symptoms only) | 1 | 53 | Risk Ratio (M‐H, Fixed, 95% CI) | 0.0 [0.0, 0.0] |
| 26.3 mixed urinary incontinence | 2 | 130 | Risk Ratio (M‐H, Fixed, 95% CI) | 0.2 [0.01, 3.97] |
| 27 Condition‐specific measures to assess quality of life: UDI‐6 Show forest plot | 1 | 63 | Mean Difference (IV, Fixed, 95% CI) | 7.30 [‐2.00, 16.60] |
| 27.1 urodynamic stress incontinence (only) | 0 | 0 | Mean Difference (IV, Fixed, 95% CI) | 0.0 [0.0, 0.0] |
| 27.2 stress urinary incontinence (symptoms only) | 1 | 63 | Mean Difference (IV, Fixed, 95% CI) | 7.30 [‐2.00, 16.60] |
| 27.3 mixed urinary incontinence | 0 | 0 | Mean Difference (IV, Fixed, 95% CI) | 0.0 [0.0, 0.0] |
| 28 Condition‐specific measures to assess quality of life: IIQ‐7 Show forest plot | 1 | 63 | Mean Difference (IV, Fixed, 95% CI) | 0.60 [‐10.17, 11.37] |
| 28.1 urodynamic stress incontinence (only) | 0 | 0 | Mean Difference (IV, Fixed, 95% CI) | 0.0 [0.0, 0.0] |
| 28.2 stress urinary incontinence (symptoms only) | 1 | 63 | Mean Difference (IV, Fixed, 95% CI) | 0.60 [‐10.17, 11.37] |
| 28.3 mixed urinary incontinence | 0 | 0 | Mean Difference (IV, Fixed, 95% CI) | 0.0 [0.0, 0.0] |
| Outcome or subgroup title | No. of studies | No. of participants | Statistical method | Effect size |
| 1 Number of continent women at 1 to 5 years (any definition) Show forest plot | 1 | Odds Ratio (M‐H, Fixed, 95% CI) | Totals not selected | |
| 1.1 urodynamic stress incontinence (only) | 1 | Odds Ratio (M‐H, Fixed, 95% CI) | 0.0 [0.0, 0.0] | |
| 1.2 stress urinary incontinence (symptoms only) | 0 | Odds Ratio (M‐H, Fixed, 95% CI) | 0.0 [0.0, 0.0] | |
| 1.3 mixed incontinence | 0 | Odds Ratio (M‐H, Fixed, 95% CI) | 0.0 [0.0, 0.0] | |
| 2 Number of women cured after first year (women's observations) Show forest plot | 1 | Odds Ratio (M‐H, Fixed, 95% CI) | Totals not selected | |
| 2.1 urodynamic stress incontinence (only) | 1 | Odds Ratio (M‐H, Fixed, 95% CI) | 0.0 [0.0, 0.0] | |
| 2.2 stress urinary incontinence (symptoms only) | 0 | Odds Ratio (M‐H, Fixed, 95% CI) | 0.0 [0.0, 0.0] | |
| 2.3 mixed incontinence | 0 | Odds Ratio (M‐H, Fixed, 95% CI) | 0.0 [0.0, 0.0] | |
| 3 Number of women satisfied (women's observations) Show forest plot | 1 | Risk Ratio (M‐H, Fixed, 95% CI) | Totals not selected | |
| 3.1 urodynamic stress incontinence (only) | 1 | Risk Ratio (M‐H, Fixed, 95% CI) | 0.0 [0.0, 0.0] | |
| 3.2 stress urinary incontinence (symptoms only) | 0 | Risk Ratio (M‐H, Fixed, 95% CI) | 0.0 [0.0, 0.0] | |
| 3.3 mixed incontinence | 0 | Risk Ratio (M‐H, Fixed, 95% CI) | 0.0 [0.0, 0.0] | |
| 4 Number of women with urinary incontinence (clinician's observations) within first year Show forest plot | 1 | Risk Ratio (M‐H, Fixed, 95% CI) | Totals not selected | |
| 4.1 urodynamic stress incontinence (only) | 1 | Risk Ratio (M‐H, Fixed, 95% CI) | 0.0 [0.0, 0.0] | |
| 4.2 stress urinary incontinence (symptoms only) | 0 | Risk Ratio (M‐H, Fixed, 95% CI) | 0.0 [0.0, 0.0] | |
| 4.3 mixed incontinence | 0 | Risk Ratio (M‐H, Fixed, 95% CI) | 0.0 [0.0, 0.0] | |
| 5 Bladder perforation Show forest plot | 1 | Risk Ratio (M‐H, Fixed, 95% CI) | Totals not selected | |
| 5.1 urodynamic stress incontinence (only) | 1 | Risk Ratio (M‐H, Fixed, 95% CI) | 0.0 [0.0, 0.0] | |
| 5.2 stress urinary incontinence (symptoms only) | 0 | Risk Ratio (M‐H, Fixed, 95% CI) | 0.0 [0.0, 0.0] | |
| 5.3 mixed incontinence | 0 | Risk Ratio (M‐H, Fixed, 95% CI) | 0.0 [0.0, 0.0] | |
| 6 Urinary urgency symptoms, urgency urinary incontinence Show forest plot | 1 | Risk Ratio (M‐H, Fixed, 95% CI) | Totals not selected | |
| 6.1 urodynamic stress incontinence (only) | 1 | Risk Ratio (M‐H, Fixed, 95% CI) | 0.0 [0.0, 0.0] | |
| 6.2 stress urinary incontinence (symptoms only) | 0 | Risk Ratio (M‐H, Fixed, 95% CI) | 0.0 [0.0, 0.0] | |
| 6.3 mixed incontinence | 0 | Risk Ratio (M‐H, Fixed, 95% CI) | 0.0 [0.0, 0.0] | |
| 7 Pain with intercourse (dyspareunia) Show forest plot | 1 | Risk Ratio (M‐H, Fixed, 95% CI) | Totals not selected | |
| 7.1 urodynamic stress incontinence (only) | 1 | Risk Ratio (M‐H, Fixed, 95% CI) | 0.0 [0.0, 0.0] | |
| 7.2 stress urinary incontinence (symptoms only) | 0 | Risk Ratio (M‐H, Fixed, 95% CI) | 0.0 [0.0, 0.0] | |
| 7.3 mixed incontinence | 0 | Risk Ratio (M‐H, Fixed, 95% CI) | 0.0 [0.0, 0.0] | |
| 8 Long‐term adverse effects (vaginal mesh or graft exposure) Show forest plot | 1 | Risk Ratio (M‐H, Fixed, 95% CI) | Totals not selected | |
| 8.1 urodynamic stress incontinence (only) | 1 | Risk Ratio (M‐H, Fixed, 95% CI) | 0.0 [0.0, 0.0] | |
| 8.2 stress urinary incontinence (symptoms only) | 0 | Risk Ratio (M‐H, Fixed, 95% CI) | 0.0 [0.0, 0.0] | |
| 8.3 mixed incontinence | 0 | Risk Ratio (M‐H, Fixed, 95% CI) | 0.0 [0.0, 0.0] | |
| 9 Condition‐specific measures to assess quality of life: IIQ score Show forest plot | 1 | Mean Difference (IV, Fixed, 95% CI) | Totals not selected | |
| 9.1 urodynamic stress incontinence (only) | 1 | Mean Difference (IV, Fixed, 95% CI) | 0.0 [0.0, 0.0] | |
| 9.2 stress urinary incontinence (symptoms only) | 0 | Mean Difference (IV, Fixed, 95% CI) | 0.0 [0.0, 0.0] | |
| 9.3 mixed urinary incontinence | 0 | Mean Difference (IV, Fixed, 95% CI) | 0.0 [0.0, 0.0] | |
| Outcome or subgroup title | No. of studies | No. of participants | Statistical method | Effect size |
| 1 Number of continent women within 1 year (any definition) Show forest plot | 5 | Odds Ratio (M‐H, Fixed, 95% CI) | Totals not selected | |
| 1.1 fascial sling vs Pelvicol sling | 1 | Odds Ratio (M‐H, Fixed, 95% CI) | 0.0 [0.0, 0.0] | |
| 1.2 standard sling vs short sling | 1 | Odds Ratio (M‐H, Fixed, 95% CI) | 0.0 [0.0, 0.0] | |
| 1.3 autologous fascial sling vs Fortaperm sling | 1 | Odds Ratio (M‐H, Fixed, 95% CI) | 0.0 [0.0, 0.0] | |
| 1.4 Vypro vs Ultrapro | 1 | Odds Ratio (M‐H, Fixed, 95% CI) | 0.0 [0.0, 0.0] | |
| 1.5 Vypro vs Prolene light | 1 | Odds Ratio (M‐H, Fixed, 95% CI) | 0.0 [0.0, 0.0] | |
| 1.6 Ultrapro vs Prolene light | 1 | Odds Ratio (M‐H, Fixed, 95% CI) | 0.0 [0.0, 0.0] | |
| 1.7 fascial sling vs vaginal wall sling | 1 | Odds Ratio (M‐H, Fixed, 95% CI) | 0.0 [0.0, 0.0] | |
| 2 Number of continent women at 1 to 5 years (any definition) Show forest plot | 7 | Odds Ratio (M‐H, Fixed, 95% CI) | Totals not selected | |
| 2.1 fascial sling vs Pelvicol sling | 1 | Odds Ratio (M‐H, Fixed, 95% CI) | 0.0 [0.0, 0.0] | |
| 2.2 standard sling vs short sling | 1 | Odds Ratio (M‐H, Fixed, 95% CI) | 0.0 [0.0, 0.0] | |
| 2.3 autologous dermal graft patch vs cadaveric fascia lata | 1 | Odds Ratio (M‐H, Fixed, 95% CI) | 0.0 [0.0, 0.0] | |
| 2.4 rectus fascia sling vs Goretex sling | 1 | Odds Ratio (M‐H, Fixed, 95% CI) | 0.0 [0.0, 0.0] | |
| 2.5 Vypro vs Ultrapro | 1 | Odds Ratio (M‐H, Fixed, 95% CI) | 0.0 [0.0, 0.0] | |
| 2.6 Vypro vs Prolene light | 1 | Odds Ratio (M‐H, Fixed, 95% CI) | 0.0 [0.0, 0.0] | |
| 2.7 Ultrapro vs Prolene light | 1 | Odds Ratio (M‐H, Fixed, 95% CI) | 0.0 [0.0, 0.0] | |
| 2.8 anterior vaginal wall sling vs biosynthetic mesh sling | 1 | Odds Ratio (M‐H, Fixed, 95% CI) | 0.0 [0.0, 0.0] | |
| 2.9 anterior rectus sheath sling vs Prolene strip | 1 | Odds Ratio (M‐H, Fixed, 95% CI) | 0.0 [0.0, 0.0] | |
| 2.10 anterior rectus sheath sling vs anterior vaginal wall patch | 1 | Odds Ratio (M‐H, Fixed, 95% CI) | 0.0 [0.0, 0.0] | |
| 2.11 Prolene strip vs anterior vaginal wall patch | 1 | Odds Ratio (M‐H, Fixed, 95% CI) | 0.0 [0.0, 0.0] | |
| 3 Number of continent women after 5 years (any definition) Show forest plot | 1 | Odds Ratio (M‐H, Fixed, 95% CI) | Totals not selected | |
| 3.1 standard sling vs short sling | 1 | Odds Ratio (M‐H, Fixed, 95% CI) | 0.0 [0.0, 0.0] | |
| 4 Repeat surgery for urinary incontinence Show forest plot | 1 | Risk Ratio (M‐H, Fixed, 95% CI) | Totals not selected | |
| 4.1 fascial sling vs Pelvicol sling | 1 | Risk Ratio (M‐H, Fixed, 95% CI) | 0.0 [0.0, 0.0] | |
| 5 Number of women cured after first year (women's observations) Show forest plot | 3 | Odds Ratio (M‐H, Fixed, 95% CI) | Totals not selected | |
| 5.1 fascial sling vs Pelvicol sling | 1 | Odds Ratio (M‐H, Fixed, 95% CI) | 0.0 [0.0, 0.0] | |
| 5.2 standard sling vs short sling | 1 | Odds Ratio (M‐H, Fixed, 95% CI) | 0.0 [0.0, 0.0] | |
| 5.3 autologous dermal graft patch vs cadaveric fascia lata | 1 | Odds Ratio (M‐H, Fixed, 95% CI) | 0.0 [0.0, 0.0] | |
| 6 Number of women improved or cured within first year (women's observations) Show forest plot | 3 | Odds Ratio (M‐H, Fixed, 95% CI) | Totals not selected | |
| 6.1 fascial sling vs Pelvicol sling | 1 | Odds Ratio (M‐H, Fixed, 95% CI) | 0.0 [0.0, 0.0] | |
| 6.2 autologous fascial sling vs Fortaperm sling | 1 | Odds Ratio (M‐H, Fixed, 95% CI) | 0.0 [0.0, 0.0] | |
| 6.3 rectus fascia sling vs Goretex sling | 1 | Odds Ratio (M‐H, Fixed, 95% CI) | 0.0 [0.0, 0.0] | |
| 7 Number of women improved or cured at 1 to 5 years (women's observations) Show forest plot | 4 | Risk Ratio (M‐H, Fixed, 95% CI) | Totals not selected | |
| 7.1 fascial sling vs Pelvicol sling | 1 | Risk Ratio (M‐H, Fixed, 95% CI) | 0.0 [0.0, 0.0] | |
| 7.2 autologous dermal graft patch vs cadaveric fascia lata | 1 | Risk Ratio (M‐H, Fixed, 95% CI) | 0.0 [0.0, 0.0] | |
| 7.3 rectus fascia sling vs Goretex sling | 1 | Risk Ratio (M‐H, Fixed, 95% CI) | 0.0 [0.0, 0.0] | |
| 7.4 anterior rectus sheath sling vs Prolene strip | 1 | Risk Ratio (M‐H, Fixed, 95% CI) | 0.0 [0.0, 0.0] | |
| 7.5 anterior rectus sheath sling vs anterior vaginal wall patch | 1 | Risk Ratio (M‐H, Fixed, 95% CI) | 0.0 [0.0, 0.0] | |
| 7.6 Prolene strip vs anterior vaginal wall patch | 1 | Risk Ratio (M‐H, Fixed, 95% CI) | 0.0 [0.0, 0.0] | |
| 8 Number of women satisfied (women's observations) Show forest plot | 3 | Risk Ratio (M‐H, Fixed, 95% CI) | Totals not selected | |
| 8.1 fascial sling vs Pelvicol sling | 1 | Risk Ratio (M‐H, Fixed, 95% CI) | 0.0 [0.0, 0.0] | |
| 8.2 Vypro vs Ultrapro | 1 | Risk Ratio (M‐H, Fixed, 95% CI) | 0.0 [0.0, 0.0] | |
| 8.3 Vypro vs Prolene light | 1 | Risk Ratio (M‐H, Fixed, 95% CI) | 0.0 [0.0, 0.0] | |
| 8.4 Ultrapro vs Prolene light | 1 | Risk Ratio (M‐H, Fixed, 95% CI) | 0.0 [0.0, 0.0] | |
| 8.5 anterior vaginal wall sling vs biosynthetic mesh sling | 1 | Risk Ratio (M‐H, Fixed, 95% CI) | 0.0 [0.0, 0.0] | |
| 9 Pad test of quantified leakage (mean weight of urine lost) within 1 year Show forest plot | 2 | Mean Difference (IV, Fixed, 95% CI) | Totals not selected | |
| 9.1 standard sling vs short sling | 1 | Mean Difference (IV, Fixed, 95% CI) | 0.0 [0.0, 0.0] | |
| 9.2 Vypro vs Ultrapro | 1 | Mean Difference (IV, Fixed, 95% CI) | 0.0 [0.0, 0.0] | |
| 9.3 Vypro vs Prolene light | 1 | Mean Difference (IV, Fixed, 95% CI) | 0.0 [0.0, 0.0] | |
| 9.4 Ultrapro vs Prolene light | 1 | Mean Difference (IV, Fixed, 95% CI) | 0.0 [0.0, 0.0] | |
| 10 Pad test of quantified leakage (mean weight of urine lost) at 1 to 5 years Show forest plot | 1 | Mean Difference (IV, Fixed, 95% CI) | Totals not selected | |
| 10.1 Vypro vs Ultrapro | 1 | Mean Difference (IV, Fixed, 95% CI) | 0.0 [0.0, 0.0] | |
| 10.2 Vypro vs Prolene light | 1 | Mean Difference (IV, Fixed, 95% CI) | 0.0 [0.0, 0.0] | |
| 10.3 Ultrapro vs Prolene light | 1 | Mean Difference (IV, Fixed, 95% CI) | 0.0 [0.0, 0.0] | |
| 11 Duration of operation (minutes) Show forest plot | 2 | Mean Difference (IV, Fixed, 95% CI) | Totals not selected | |
| 11.1 standard sling vs short sling | 1 | Mean Difference (IV, Fixed, 95% CI) | 0.0 [0.0, 0.0] | |
| 11.2 anterior rectus sheath sling vs Prolene strip | 1 | Mean Difference (IV, Fixed, 95% CI) | 0.0 [0.0, 0.0] | |
| 11.3 anterior rectus sheath sling vs anterior vaginal wall patch | 1 | Mean Difference (IV, Fixed, 95% CI) | 0.0 [0.0, 0.0] | |
| 11.4 Prolene strip vs anterior vaginal wall patch | 1 | Mean Difference (IV, Fixed, 95% CI) | 0.0 [0.0, 0.0] | |
| 12 Blood loss (mL) Show forest plot | 1 | Mean Difference (IV, Fixed, 95% CI) | Totals not selected | |
| 12.1 anterior rectus sheath sling vs Prolene strip | 1 | Mean Difference (IV, Fixed, 95% CI) | 0.0 [0.0, 0.0] | |
| 12.2 anterior rectus sheath sling vs anterior vaginal wall patch | 1 | Mean Difference (IV, Fixed, 95% CI) | 0.0 [0.0, 0.0] | |
| 12.3 Prolene strip vs anterior vaginal wall patch | 1 | Mean Difference (IV, Fixed, 95% CI) | 0.0 [0.0, 0.0] | |
| 13 Length of hospital stay (days) Show forest plot | 1 | Mean Difference (IV, Fixed, 95% CI) | Totals not selected | |
| 13.1 anterior rectus sheath sling vs Prolene strip | 1 | Mean Difference (IV, Fixed, 95% CI) | 0.0 [0.0, 0.0] | |
| 13.2 anterior rectus sheath sling vs anterior vaginal wall patch | 1 | Mean Difference (IV, Fixed, 95% CI) | 0.0 [0.0, 0.0] | |
| 13.3 Prolene strip vs anterior vaginal wall patch | 1 | Mean Difference (IV, Fixed, 95% CI) | 0.0 [0.0, 0.0] | |
| 14 Perioperative surgical complications Show forest plot | 3 | Risk Ratio (M‐H, Fixed, 95% CI) | Totals not selected | |
| 14.1 standard sling vs short sling | 1 | Risk Ratio (M‐H, Fixed, 95% CI) | 0.0 [0.0, 0.0] | |
| 14.2 rectus fascia sling vs Goretex sling | 1 | Risk Ratio (M‐H, Fixed, 95% CI) | 0.0 [0.0, 0.0] | |
| 14.3 fascial sling vs vaginal wall sling | 1 | Risk Ratio (M‐H, Fixed, 95% CI) | 0.0 [0.0, 0.0] | |
| 15 Bladder perforation Show forest plot | 3 | Risk Ratio (M‐H, Fixed, 95% CI) | Totals not selected | |
| 15.1 standard sling vs short sling | 1 | Risk Ratio (M‐H, Fixed, 95% CI) | 0.0 [0.0, 0.0] | |
| 15.2 fascial sling vs Pelvicol sling | 1 | Risk Ratio (M‐H, Fixed, 95% CI) | 0.0 [0.0, 0.0] | |
| 15.3 anterior rectus sheath sling vs Prolene strip | 1 | Risk Ratio (M‐H, Fixed, 95% CI) | 0.0 [0.0, 0.0] | |
| 15.4 anterior rectus sheath sling vs anterior vaginal wall patch | 1 | Risk Ratio (M‐H, Fixed, 95% CI) | 0.0 [0.0, 0.0] | |
| 15.5 Prolene strip vs anterior vaginal wall patch | 1 | Risk Ratio (M‐H, Fixed, 95% CI) | 0.0 [0.0, 0.0] | |
| 16 Urinary tract infection Show forest plot | 2 | Risk Ratio (M‐H, Fixed, 95% CI) | Totals not selected | |
| 16.1 standard sling vs short sling | 1 | Risk Ratio (M‐H, Fixed, 95% CI) | 0.0 [0.0, 0.0] | |
| 16.2 anterior vaginal wall sling vs biosynthetic mesh sling | 1 | Risk Ratio (M‐H, Fixed, 95% CI) | 0.0 [0.0, 0.0] | |
| 17 Vaginal bleeding Show forest plot | 1 | Risk Ratio (M‐H, Fixed, 95% CI) | Totals not selected | |
| 17.1 anterior vaginal wall sling vs biosynthetic mesh sling | 1 | Risk Ratio (M‐H, Fixed, 95% CI) | 0.0 [0.0, 0.0] | |
| 18 Long‐term adverse effects (wound pain) Show forest plot | 1 | Risk Ratio (M‐H, Fixed, 95% CI) | Totals not selected | |
| 18.1 fascial sling vs Pelvicol sling | 1 | Risk Ratio (M‐H, Fixed, 95% CI) | 0.0 [0.0, 0.0] | |
| 19 Voiding dysfunction Show forest plot | 6 | Risk Ratio (M‐H, Fixed, 95% CI) | Totals not selected | |
| 19.1 fascial sling vs Pelvicol sling | 1 | Risk Ratio (M‐H, Fixed, 95% CI) | 0.0 [0.0, 0.0] | |
| 19.2 standard sling vs short sling | 1 | Risk Ratio (M‐H, Fixed, 95% CI) | 0.0 [0.0, 0.0] | |
| 19.3 Vypro vs Ultrapro | 1 | Risk Ratio (M‐H, Fixed, 95% CI) | 0.0 [0.0, 0.0] | |
| 19.4 Vypro vs Prolene light | 1 | Risk Ratio (M‐H, Fixed, 95% CI) | 0.0 [0.0, 0.0] | |
| 19.5 Ultrapro vs Prolene light | 1 | Risk Ratio (M‐H, Fixed, 95% CI) | 0.0 [0.0, 0.0] | |
| 19.6 anterior vaginal wall sling vs biosynthetic mesh sling | 1 | Risk Ratio (M‐H, Fixed, 95% CI) | 0.0 [0.0, 0.0] | |
| 19.7 anterior rectus sheath sling vs Prolene strip | 1 | Risk Ratio (M‐H, Fixed, 95% CI) | 0.0 [0.0, 0.0] | |
| 19.8 anterior rectus sheath sling vs anterior vaginal wall patch | 1 | Risk Ratio (M‐H, Fixed, 95% CI) | 0.0 [0.0, 0.0] | |
| 19.9 Prolene strip vs anterior vaginal wall patch | 1 | Risk Ratio (M‐H, Fixed, 95% CI) | 0.0 [0.0, 0.0] | |
| 19.10 fascial sling vs vaginal wall sling | 1 | Risk Ratio (M‐H, Fixed, 95% CI) | 0.0 [0.0, 0.0] | |
| 20 Urinary urgency symptoms, urgency urinary incontinence Show forest plot | 3 | Risk Ratio (M‐H, Fixed, 95% CI) | Totals not selected | |
| 20.1 standard sling vs short sling | 1 | Risk Ratio (M‐H, Fixed, 95% CI) | 0.0 [0.0, 0.0] | |
| 20.2 Vypro vs Ultrapro | 1 | Risk Ratio (M‐H, Fixed, 95% CI) | 0.0 [0.0, 0.0] | |
| 20.3 Vypro vs Prolene light | 1 | Risk Ratio (M‐H, Fixed, 95% CI) | 0.0 [0.0, 0.0] | |
| 20.4 Ultrapro vs Prolene light | 1 | Risk Ratio (M‐H, Fixed, 95% CI) | 0.0 [0.0, 0.0] | |
| 20.5 rectus fascia sling vs Goretex sling | 1 | Risk Ratio (M‐H, Fixed, 95% CI) | 0.0 [0.0, 0.0] | |
| 21 Detrusor overactivity (urodynamic overactivity) Show forest plot | 1 | Risk Ratio (M‐H, Fixed, 95% CI) | Totals not selected | |
| 21.1 autologous dermal graft patch vs cadaveric fascia lata | 1 | Risk Ratio (M‐H, Fixed, 95% CI) | 0.0 [0.0, 0.0] | |
| 22 Long‐term adverse effects (release of sling required) Show forest plot | 1 | Risk Ratio (M‐H, Fixed, 95% CI) | Totals not selected | |
| 22.1 fascial sling vs Pelvicol sling | 1 | Risk Ratio (M‐H, Fixed, 95% CI) | 0.0 [0.0, 0.0] | |
| 23 Long‐term adverse effects (vaginal mesh or graft exposure) Show forest plot | 3 | Risk Ratio (M‐H, Fixed, 95% CI) | Totals not selected | |
| 23.1 fascial sling vs Pelvicol sling | 1 | Risk Ratio (M‐H, Fixed, 95% CI) | 0.0 [0.0, 0.0] | |
| 23.2 Vypro vs Ultrapro | 1 | Risk Ratio (M‐H, Fixed, 95% CI) | 0.0 [0.0, 0.0] | |
| 23.3 Vypro vs Prolene light | 1 | Risk Ratio (M‐H, Fixed, 95% CI) | 0.0 [0.0, 0.0] | |
| 23.4 Ultrapro vs Prolene light | 1 | Risk Ratio (M‐H, Fixed, 95% CI) | 0.0 [0.0, 0.0] | |
| 23.5 anterior vaginal wall sling vs biosynthetic mesh sling | 1 | Risk Ratio (M‐H, Fixed, 95% CI) | 0.0 [0.0, 0.0] | |
| 24 Condition‐specific measures to assess quality of life (ICI‐Q short form UI score at 1 year) Show forest plot | 1 | Mean Difference (IV, Fixed, 95% CI) | Totals not selected | |
| 24.1 Vypro vs Ultrapro | 1 | Mean Difference (IV, Fixed, 95% CI) | 0.0 [0.0, 0.0] | |
| 24.2 Vypro vs Prolene light | 1 | Mean Difference (IV, Fixed, 95% CI) | 0.0 [0.0, 0.0] | |
| 24.3 Ultrapro vs Prolene light | 1 | Mean Difference (IV, Fixed, 95% CI) | 0.0 [0.0, 0.0] | |
| 25 Condition‐specific measures to assess quality of life (ICI‐Q short form UI score at 1 to 5 years) Show forest plot | 1 | Mean Difference (IV, Fixed, 95% CI) | Totals not selected | |
| 25.1 Vypro vs Ultrapro | 1 | Mean Difference (IV, Fixed, 95% CI) | 0.0 [0.0, 0.0] | |
| 25.2 Vypro vs Prolene light | 1 | Mean Difference (IV, Fixed, 95% CI) | 0.0 [0.0, 0.0] | |
| 25.3 Ultrapro vs Prolene light | 1 | Mean Difference (IV, Fixed, 95% CI) | 0.0 [0.0, 0.0] | |
| Outcome or subgroup title | No. of studies | No. of participants | Statistical method | Effect size |
| 1 Number of women with urinary incontinence (worse, unchanged, or improved) within first year (women's observations) Show forest plot | 1 | Risk Ratio (M‐H, Fixed, 95% CI) | Totals not selected | |
| 1.1 urodynamic stress incontinence (only) | 0 | Risk Ratio (M‐H, Fixed, 95% CI) | 0.0 [0.0, 0.0] | |
| 1.2 stress urinary incontinence (symptoms only) | 0 | Risk Ratio (M‐H, Fixed, 95% CI) | 0.0 [0.0, 0.0] | |
| 1.3 mixed incontinence | 1 | Risk Ratio (M‐H, Fixed, 95% CI) | 0.0 [0.0, 0.0] | |
| 2 Urge urinary symptoms, urgency urinary incontinence Show forest plot | 1 | Risk Ratio (M‐H, Fixed, 95% CI) | Totals not selected | |
| 2.1 urodynamic stress incontinence (only) | 0 | Risk Ratio (M‐H, Fixed, 95% CI) | 0.0 [0.0, 0.0] | |
| 2.2 stress urinary incontinence (symptoms only) | 0 | Risk Ratio (M‐H, Fixed, 95% CI) | 0.0 [0.0, 0.0] | |
| 2.3 mixed incontinence | 1 | Risk Ratio (M‐H, Fixed, 95% CI) | 0.0 [0.0, 0.0] | |
| Outcome or subgroup title | No. of studies | No. of participants | Statistical method | Effect size |
| 1 Number of women with urinary incontinence (worse, unchanged, or improved) within first year (women's observations) Show forest plot | 1 | Risk Ratio (M‐H, Fixed, 95% CI) | Totals not selected | |
| 1.1 urodynamic stress incontinence (only) | 1 | Risk Ratio (M‐H, Fixed, 95% CI) | 0.0 [0.0, 0.0] | |
| 1.2 stress urinary incontinence (symptoms only) | 0 | Risk Ratio (M‐H, Fixed, 95% CI) | 0.0 [0.0, 0.0] | |
| 1.3 mixed urinary incontinence | 0 | Risk Ratio (M‐H, Fixed, 95% CI) | 0.0 [0.0, 0.0] | |
| 2 Number of women with urinary incontinence (worse, unchanged, or improved) after first year (women's observations) Show forest plot | 1 | Risk Ratio (M‐H, Fixed, 95% CI) | Totals not selected | |
| 2.1 urodynamic stress incontinence (only) | 1 | Risk Ratio (M‐H, Fixed, 95% CI) | 0.0 [0.0, 0.0] | |
| 2.2 stress urinary incontinence (symptoms only) | 0 | Risk Ratio (M‐H, Fixed, 95% CI) | 0.0 [0.0, 0.0] | |
| 2.3 mixed urinary incontinence | 0 | Risk Ratio (M‐H, Fixed, 95% CI) | 0.0 [0.0, 0.0] | |
| 3 Number of women with urinary incontinence (clinician's observations) within first year Show forest plot | 1 | Risk Ratio (M‐H, Fixed, 95% CI) | Totals not selected | |
| 3.1 urodynamic stress incontinence (only) | 1 | Risk Ratio (M‐H, Fixed, 95% CI) | 0.0 [0.0, 0.0] | |
| 3.2 stress urinary incontinence (symptoms only) | 0 | Risk Ratio (M‐H, Fixed, 95% CI) | 0.0 [0.0, 0.0] | |
| 3.3 mixed urinary incontinence | 0 | Risk Ratio (M‐H, Fixed, 95% CI) | 0.0 [0.0, 0.0] | |
| 4 CURE: number of women cured after first year (women's observations) Show forest plot | 1 | Odds Ratio (M‐H, Fixed, 95% CI) | Totals not selected | |
| 4.1 urodynamic stress incontinence (only) | 1 | Odds Ratio (M‐H, Fixed, 95% CI) | 0.0 [0.0, 0.0] | |
| 4.2 stress urinary incontinence (symptoms only) | 0 | Odds Ratio (M‐H, Fixed, 95% CI) | 0.0 [0.0, 0.0] | |
| 4.3 mixed urinary incontinence | 0 | Odds Ratio (M‐H, Fixed, 95% CI) | 0.0 [0.0, 0.0] | |
| 5 Voiding dysfunction Show forest plot | 1 | Risk Ratio (M‐H, Fixed, 95% CI) | Totals not selected | |
| 5.1 urodynamic stress incontinence (only) | 1 | Risk Ratio (M‐H, Fixed, 95% CI) | 0.0 [0.0, 0.0] | |
| 5.2 stress urinary incontinence (symptoms only) | 0 | Risk Ratio (M‐H, Fixed, 95% CI) | 0.0 [0.0, 0.0] | |
| 5.3 mixed urinary incontinence | 0 | Risk Ratio (M‐H, Fixed, 95% CI) | 0.0 [0.0, 0.0] | |
| 6 De novo detrusor overactivity (urodynamic diagnosis) Show forest plot | 1 | Risk Ratio (M‐H, Fixed, 95% CI) | Totals not selected | |
| 6.1 urodynamic stress incontinence (only) | 1 | Risk Ratio (M‐H, Fixed, 95% CI) | 0.0 [0.0, 0.0] | |
| 6.2 stress urinary incontinence (symptoms only) | 0 | Risk Ratio (M‐H, Fixed, 95% CI) | 0.0 [0.0, 0.0] | |
| 6.3 mixed urinary incontinence | 0 | Risk Ratio (M‐H, Fixed, 95% CI) | 0.0 [0.0, 0.0] | |
| 7 Urinary tract infection Show forest plot | 1 | Risk Ratio (M‐H, Fixed, 95% CI) | Totals not selected | |
| 7.1 urodynamic stress incontinence (only) | 1 | Risk Ratio (M‐H, Fixed, 95% CI) | 0.0 [0.0, 0.0] | |
| 7.2 stress urinary incontinence (symptoms only) | 0 | Risk Ratio (M‐H, Fixed, 95% CI) | 0.0 [0.0, 0.0] | |
| 7.3 mixed urinary incontinence | 0 | Risk Ratio (M‐H, Fixed, 95% CI) | 0.0 [0.0, 0.0] | |
| 8 Repeat surgery for urinary incontinence Show forest plot | 1 | Risk Ratio (M‐H, Fixed, 95% CI) | Totals not selected | |
| 8.1 urodynamic stress incontinence (only) | 1 | Risk Ratio (M‐H, Fixed, 95% CI) | 0.0 [0.0, 0.0] | |
| 8.2 stress urinary incontinence (symptoms only) | 0 | Risk Ratio (M‐H, Fixed, 95% CI) | 0.0 [0.0, 0.0] | |
| 8.3 mixed urinary incontinence | 0 | Risk Ratio (M‐H, Fixed, 95% CI) | 0.0 [0.0, 0.0] | |
| Outcome or subgroup title | No. of studies | No. of participants | Statistical method | Effect size |
| 1 Number with incontinence (worse, unchanged, or improved) within first year (women's observations) Show forest plot | 1 | Risk Ratio (M‐H, Fixed, 95% CI) | Totals not selected | |
| 1.1 urodynamic stress incontinence (only) | 1 | Risk Ratio (M‐H, Fixed, 95% CI) | 0.0 [0.0, 0.0] | |
| 1.2 stress urinary incontinence (symptoms only) | 0 | Risk Ratio (M‐H, Fixed, 95% CI) | 0.0 [0.0, 0.0] | |
| 1.3 mixed incontinence | 0 | Risk Ratio (M‐H, Fixed, 95% CI) | 0.0 [0.0, 0.0] | |
| 2 Number with incontinence (worse, unchanged, or improved) after first year (women's observations) Show forest plot | 1 | Risk Ratio (M‐H, Fixed, 95% CI) | Totals not selected | |
| 2.1 urodynamic stress incontinence (only) | 1 | Risk Ratio (M‐H, Fixed, 95% CI) | 0.0 [0.0, 0.0] | |
| 2.2 stress urinary incontinence (symptoms only) | 0 | Risk Ratio (M‐H, Fixed, 95% CI) | 0.0 [0.0, 0.0] | |
| 2.3 mixed incontinence | 0 | Risk Ratio (M‐H, Fixed, 95% CI) | 0.0 [0.0, 0.0] | |
| 3 CURE: number of women cured after first year (women's observations) Show forest plot | 1 | Odds Ratio (M‐H, Fixed, 95% CI) | Totals not selected | |
| 3.1 urodynamic stress incontinence (only) | 1 | Odds Ratio (M‐H, Fixed, 95% CI) | 0.0 [0.0, 0.0] | |
| 3.2 stress urinary incontinence (symptoms only) | 0 | Odds Ratio (M‐H, Fixed, 95% CI) | 0.0 [0.0, 0.0] | |
| 3.3 mixed incontinence | 0 | Odds Ratio (M‐H, Fixed, 95% CI) | 0.0 [0.0, 0.0] | |
| 4 Length of hospital stay (hours) Show forest plot | 1 | Mean Difference (IV, Fixed, 95% CI) | Totals not selected | |
| 4.1 urodynamic stress incontinence (only) | 1 | Mean Difference (IV, Fixed, 95% CI) | 0.0 [0.0, 0.0] | |
| 4.2 stress urinary incontinence (symptoms only) | 0 | Mean Difference (IV, Fixed, 95% CI) | 0.0 [0.0, 0.0] | |
| 4.3 mixed incontinence | 0 | Mean Difference (IV, Fixed, 95% CI) | 0.0 [0.0, 0.0] | |
| 5 Perioperative surgical complications Show forest plot | 1 | Risk Ratio (M‐H, Fixed, 95% CI) | Totals not selected | |
| 5.1 urodynamic stress incontinence (only) | 1 | Risk Ratio (M‐H, Fixed, 95% CI) | 0.0 [0.0, 0.0] | |
| 5.2 stress urinary incontinence (symptoms only) | 0 | Risk Ratio (M‐H, Fixed, 95% CI) | 0.0 [0.0, 0.0] | |
| 5.3 mixed incontinence | 0 | Risk Ratio (M‐H, Fixed, 95% CI) | 0.0 [0.0, 0.0] | |
| 6 Urge urinary symptoms, urgency urinary incontinence Show forest plot | 1 | Risk Ratio (M‐H, Fixed, 95% CI) | Totals not selected | |
| 6.1 urodynamic stress incontinence (only) | 1 | Risk Ratio (M‐H, Fixed, 95% CI) | 0.0 [0.0, 0.0] | |
| 6.2 stress urinary incontinence (symptoms only) | 0 | Risk Ratio (M‐H, Fixed, 95% CI) | 0.0 [0.0, 0.0] | |
| 6.3 mixed incontinence | 0 | Risk Ratio (M‐H, Fixed, 95% CI) | 0.0 [0.0, 0.0] | |
| 7 Voiding dysfunction after 3 months Show forest plot | 1 | Risk Ratio (M‐H, Fixed, 95% CI) | Totals not selected | |
| 7.1 urodynamic stress incontinence (only) | 1 | Risk Ratio (M‐H, Fixed, 95% CI) | 0.0 [0.0, 0.0] | |
| 7.2 stress urinary incontinence (symptoms only) | 0 | Risk Ratio (M‐H, Fixed, 95% CI) | 0.0 [0.0, 0.0] | |
| 7.3 mixed incontinence | 0 | Risk Ratio (M‐H, Fixed, 95% CI) | 0.0 [0.0, 0.0] | |
| 8 Detrusor overactivity (urodynamic diagnosis) Show forest plot | 1 | Risk Ratio (M‐H, Fixed, 95% CI) | Totals not selected | |
| 8.1 urodynamic stress incontinence (only) | 1 | Risk Ratio (M‐H, Fixed, 95% CI) | 0.0 [0.0, 0.0] | |
| 8.2 stress urinary incontinence (symptoms only) | 0 | Risk Ratio (M‐H, Fixed, 95% CI) | 0.0 [0.0, 0.0] | |
| 8.3 mixed incontinence | 0 | Risk Ratio (M‐H, Fixed, 95% CI) | 0.0 [0.0, 0.0] | |
| Outcome or subgroup title | No. of studies | No. of participants | Statistical method | Effect size |
| 1 Number of women with urinary incontinence (worse, unchanged, or improved) within first year (women's observations) Show forest plot | 4 | 147 | Risk Ratio (M‐H, Fixed, 95% CI) | 0.40 [0.11, 1.41] |
| 1.1 urodynamic stress incontinence (only) | 4 | 147 | Risk Ratio (M‐H, Fixed, 95% CI) | 0.40 [0.11, 1.41] |
| 1.2 stress urinary incontinence (symptoms only) | 0 | 0 | Risk Ratio (M‐H, Fixed, 95% CI) | 0.0 [0.0, 0.0] |
| 1.3 mixed incontinence | 0 | 0 | Risk Ratio (M‐H, Fixed, 95% CI) | 0.0 [0.0, 0.0] |
| 2 Number not improved (worse or unchanged) within first year (women's observations) | 0 | 0 | Risk Ratio (M‐H, Fixed, 95% CI) | 0.0 [0.0, 0.0] |
| 2.1 urodynamic stress incontinence (only) | 0 | 0 | Risk Ratio (M‐H, Fixed, 95% CI) | 0.0 [0.0, 0.0] |
| 2.2 stress urinary incontinence (symptoms only) | 0 | 0 | Risk Ratio (M‐H, Fixed, 95% CI) | 0.0 [0.0, 0.0] |
| 2.3 mixed incontinence | 0 | 0 | Risk Ratio (M‐H, Fixed, 95% CI) | 0.0 [0.0, 0.0] |
| 3 Number of women with urinary incontinence (worse, unchanged, or improved) at 1 to 5 years (women's observations) Show forest plot | 4 | 687 | Risk Ratio (M‐H, Fixed, 95% CI) | 0.73 [0.61, 0.89] |
| 3.1 urodynamic stress incontinence (only) | 3 | 167 | Risk Ratio (M‐H, Fixed, 95% CI) | 0.58 [0.22, 1.49] |
| 3.2 stress urinary incontinence (symptoms only) | 1 | 520 | Risk Ratio (M‐H, Fixed, 95% CI) | 0.75 [0.62, 0.91] |
| 3.3 mixed incontinence | 0 | 0 | Risk Ratio (M‐H, Fixed, 95% CI) | 0.0 [0.0, 0.0] |
| 4 Number not improved (worse or unchanged) at 1 to 5 years (women's observations) | 0 | 0 | Risk Ratio (M‐H, Fixed, 95% CI) | 0.0 [0.0, 0.0] |
| 4.1 urodynamic stress incontinence (only) | 0 | 0 | Risk Ratio (M‐H, Fixed, 95% CI) | 0.0 [0.0, 0.0] |
| 4.2 stress urinary incontinence (symptoms only) | 0 | 0 | Risk Ratio (M‐H, Fixed, 95% CI) | 0.0 [0.0, 0.0] |
| 4.3 mixed incontinence | 0 | 0 | Risk Ratio (M‐H, Fixed, 95% CI) | 0.0 [0.0, 0.0] |
| 5 Number of women with urinary incontinence (worse, unchanged, or improved) at > 5 years (women's observations) Show forest plot | 2 | 481 | Risk Ratio (M‐H, Fixed, 95% CI) | 0.85 [0.74, 0.98] |
| 5.1 urodynamic stress incontinence (only) | 1 | 28 | Risk Ratio (M‐H, Fixed, 95% CI) | 2.31 [0.24, 22.62] |
| 5.2 stress urinary incontinence (symptoms only) | 1 | 453 | Risk Ratio (M‐H, Fixed, 95% CI) | 0.84 [0.73, 0.97] |
| 5.3 mixed incontinence | 0 | 0 | Risk Ratio (M‐H, Fixed, 95% CI) | 0.0 [0.0, 0.0] |
| 6 CURE: number of women cured at > 1 year (women's observations) Show forest plot | 3 | 515 | Odds Ratio (M‐H, Fixed, 95% CI) | 1.56 [1.07, 2.28] |
| 6.1 urodynamic stress incontinence (only) | 2 | 62 | Odds Ratio (M‐H, Fixed, 95% CI) | 0.93 [0.18, 4.89] |
| 6.2 stress urinary incontinence (symptoms only) | 1 | 453 | Odds Ratio (M‐H, Fixed, 95% CI) | 1.61 [1.09, 2.37] |
| 6.3 mixed incontinence | 0 | 0 | Odds Ratio (M‐H, Fixed, 95% CI) | 0.0 [0.0, 0.0] |
| 7 Number of women not satisfied at > 5 years Show forest plot | 1 | Risk Ratio (M‐H, Fixed, 95% CI) | Totals not selected | |
| 7.1 urodynamic stress incontinence (only) | 0 | Risk Ratio (M‐H, Fixed, 95% CI) | 0.0 [0.0, 0.0] | |
| 7.2 stress urinary incontinence (symptoms only) | 1 | Risk Ratio (M‐H, Fixed, 95% CI) | 0.0 [0.0, 0.0] | |
| 7.3 mixed incontinence | 0 | Risk Ratio (M‐H, Fixed, 95% CI) | 0.0 [0.0, 0.0] | |
| 8 Incontinent episodes over 24 hours | 0 | 0 | Mean Difference (IV, Fixed, 95% CI) | 0.0 [0.0, 0.0] |
| 8.1 urodynamic stress incontinence (only) | 0 | 0 | Mean Difference (IV, Fixed, 95% CI) | 0.0 [0.0, 0.0] |
| 8.2 stress urinary incontinence (symptoms only) | 0 | 0 | Mean Difference (IV, Fixed, 95% CI) | 0.0 [0.0, 0.0] |
| 8.3 mixed incontinence | 0 | 0 | Mean Difference (IV, Fixed, 95% CI) | 0.0 [0.0, 0.0] |
| 9 Number of women with urinary incontinence (clinician's observations) within first year | 0 | 0 | Risk Ratio (M‐H, Fixed, 95% CI) | 0.0 [0.0, 0.0] |
| 9.1 urodynamic stress incontinence (only) | 0 | 0 | Risk Ratio (M‐H, Fixed, 95% CI) | 0.0 [0.0, 0.0] |
| 9.2 stress urinary incontinence (symptoms only) | 0 | 0 | Risk Ratio (M‐H, Fixed, 95% CI) | 0.0 [0.0, 0.0] |
| 9.3 mixed incontinence | 0 | 0 | Risk Ratio (M‐H, Fixed, 95% CI) | 0.0 [0.0, 0.0] |
| 10 Number of women with urinary incontinence (clinician's observations) at 1 to 5 years Show forest plot | 2 | 592 | Risk Ratio (M‐H, Fixed, 95% CI) | 0.90 [0.60, 1.34] |
| 10.1 urodynamic stress incontinence (only) | 1 | 72 | Risk Ratio (M‐H, Fixed, 95% CI) | 0.6 [0.15, 2.33] |
| 10.2 stress urinary incontinence (symptoms only) | 1 | 520 | Risk Ratio (M‐H, Fixed, 95% CI) | 0.94 [0.62, 1.42] |
| 10.3 mixed incontinence | 0 | 0 | Risk Ratio (M‐H, Fixed, 95% CI) | 0.0 [0.0, 0.0] |
| 11 Number of women with urinary incontinence (clinician's observations) at > 5 years Show forest plot | 2 | 461 | Risk Ratio (M‐H, Fixed, 95% CI) | 0.90 [0.80, 1.01] |
| 11.1 urodynamic stress incontinence (only) | 1 | 28 | Risk Ratio (M‐H, Fixed, 95% CI) | 0.23 [0.01, 4.37] |
| 11.2 stress urinary incontinence (symptoms only) | 1 | 433 | Risk Ratio (M‐H, Fixed, 95% CI) | 0.91 [0.81, 1.02] |
| 11.3 mixed incontinence | 0 | 0 | Risk Ratio (M‐H, Fixed, 95% CI) | 0.0 [0.0, 0.0] |
| 12 Duration of operation (minutes) Show forest plot | 1 | Mean Difference (IV, Fixed, 95% CI) | Totals not selected | |
| 12.1 urodynamic stress incontinence (only) | 1 | Mean Difference (IV, Fixed, 95% CI) | 0.0 [0.0, 0.0] | |
| 12.2 stress urinary incontinence (symptoms only) | 0 | Mean Difference (IV, Fixed, 95% CI) | 0.0 [0.0, 0.0] | |
| 12.3 mixed incontinence | 0 | Mean Difference (IV, Fixed, 95% CI) | 0.0 [0.0, 0.0] | |
| 13 Time to catheter removal (days) Show forest plot | 2 | 108 | Mean Difference (IV, Fixed, 95% CI) | 8.01 [6.84, 9.18] |
| 13.1 urodynamic stress incontinence (only) | 2 | 108 | Mean Difference (IV, Fixed, 95% CI) | 8.01 [6.84, 9.18] |
| 13.2 stress urinary incontinence (symptoms only) | 0 | 0 | Mean Difference (IV, Fixed, 95% CI) | 0.0 [0.0, 0.0] |
| 13.3 mixed incontinence | 0 | 0 | Mean Difference (IV, Fixed, 95% CI) | 0.0 [0.0, 0.0] |
| 14 Length of hospital stay (days) Show forest plot | 3 | Mean Difference (IV, Fixed, 95% CI) | Totals not selected | |
| 14.1 urodynamic stress incontinence (only) | 3 | Mean Difference (IV, Fixed, 95% CI) | 0.0 [0.0, 0.0] | |
| 14.2 stress urinary incontinence (symptoms only) | 0 | Mean Difference (IV, Fixed, 95% CI) | 0.0 [0.0, 0.0] | |
| 14.3 mixed incontinence | 0 | Mean Difference (IV, Fixed, 95% CI) | 0.0 [0.0, 0.0] | |
| 15 Time to return to normal activity level | 0 | 0 | Mean Difference (IV, Fixed, 95% CI) | 0.0 [0.0, 0.0] |
| 15.1 urodynamic stress incontinence (only) | 0 | 0 | Mean Difference (IV, Fixed, 95% CI) | 0.0 [0.0, 0.0] |
| 15.2 stress urinary incontinence (symptoms only) | 0 | 0 | Mean Difference (IV, Fixed, 95% CI) | 0.0 [0.0, 0.0] |
| 15.3 mixed incontinence | 0 | 0 | Mean Difference (IV, Fixed, 95% CI) | 0.0 [0.0, 0.0] |
| 16 Perioperative surgical complications Show forest plot | 4 | 792 | Risk Ratio (M‐H, Fixed, 95% CI) | 1.24 [0.83, 1.86] |
| 16.1 urodynamic stress incontinence (only) | 3 | 137 | Risk Ratio (M‐H, Fixed, 95% CI) | 0.85 [0.28, 2.52] |
| 16.2 stress urinary incontinence (symptoms only) | 1 | 655 | Risk Ratio (M‐H, Fixed, 95% CI) | 1.32 [0.86, 2.04] |
| 16.3 mixed incontinence | 0 | 0 | Risk Ratio (M‐H, Fixed, 95% CI) | 0.0 [0.0, 0.0] |
| 17 Bladder perforation Show forest plot | 1 | Risk Ratio (M‐H, Fixed, 95% CI) | Totals not selected | |
| 17.1 urodynamic stress incontinence (only) | 0 | Risk Ratio (M‐H, Fixed, 95% CI) | 0.0 [0.0, 0.0] | |
| 17.2 stress urinary incontinence (symptoms only) | 1 | Risk Ratio (M‐H, Fixed, 95% CI) | 0.0 [0.0, 0.0] | |
| 17.3 mixed incontinence | 0 | Risk Ratio (M‐H, Fixed, 95% CI) | 0.0 [0.0, 0.0] | |
| 18 Urinary tract infection Show forest plot | 1 | Risk Ratio (M‐H, Fixed, 95% CI) | Totals not selected | |
| 18.1 urodynamic stress incontinence (only) | 0 | Risk Ratio (M‐H, Fixed, 95% CI) | 0.0 [0.0, 0.0] | |
| 18.2 stress urinary incontinence (symptoms only) | 1 | Risk Ratio (M‐H, Fixed, 95% CI) | 0.0 [0.0, 0.0] | |
| 18.3 mixed incontinence | 0 | Risk Ratio (M‐H, Fixed, 95% CI) | 0.0 [0.0, 0.0] | |
| 19 Number of women with recurrent UTIs at > 5 years Show forest plot | 1 | Risk Ratio (M‐H, Fixed, 95% CI) | Totals not selected | |
| 19.1 urodynamic stress incontinence (only) | 0 | Risk Ratio (M‐H, Fixed, 95% CI) | 0.0 [0.0, 0.0] | |
| 19.2 stress urinary incontinence (symptoms only) | 1 | Risk Ratio (M‐H, Fixed, 95% CI) | 0.0 [0.0, 0.0] | |
| 19.3 mixed incontinence | 0 | Risk Ratio (M‐H, Fixed, 95% CI) | 0.0 [0.0, 0.0] | |
| 20 Urge urinary symptoms, urgency urinary incontinence Show forest plot | 2 | 525 | Risk Ratio (M‐H, Fixed, 95% CI) | 1.10 [0.74, 1.64] |
| 20.1 urodynamic stress incontinence (only) | 1 | 72 | Risk Ratio (M‐H, Fixed, 95% CI) | 2.0 [0.54, 7.39] |
| 20.2 stress urinary incontinence (symptoms only) | 1 | 453 | Risk Ratio (M‐H, Fixed, 95% CI) | 1.02 [0.67, 1.56] |
| 20.3 mixed incontinence | 0 | 0 | Risk Ratio (M‐H, Fixed, 95% CI) | 0.0 [0.0, 0.0] |
| 21 Detrusor overactivity (urodynamic diagnosis) Show forest plot | 4 | 203 | Risk Ratio (M‐H, Fixed, 95% CI) | 1.42 [0.52, 3.87] |
| 21.1 urodynamic stress incontinence (only) | 4 | 203 | Risk Ratio (M‐H, Fixed, 95% CI) | 1.42 [0.52, 3.87] |
| 21.2 stress urinary incontinence (symptoms only) | 0 | 0 | Risk Ratio (M‐H, Fixed, 95% CI) | 0.0 [0.0, 0.0] |
| 21.3 mixed incontinence | 0 | 0 | Risk Ratio (M‐H, Fixed, 95% CI) | 0.0 [0.0, 0.0] |
| 22 Voiding dysfunction after 3 months Show forest plot | 5 | 853 | Risk Ratio (M‐H, Fixed, 95% CI) | 6.08 [3.10, 11.95] |
| 22.1 urodynamic stress incontinence (only) | 4 | 198 | Risk Ratio (M‐H, Fixed, 95% CI) | 4.48 [1.16, 17.36] |
| 22.2 stress urinary incontinence (symptoms only) | 1 | 655 | Risk Ratio (M‐H, Fixed, 95% CI) | 6.63 [3.04, 14.47] |
| 22.3 mixed incontinence | 0 | 0 | Risk Ratio (M‐H, Fixed, 95% CI) | 0.0 [0.0, 0.0] |
| 23 Long‐term voiding dysfunction > 5 years Show forest plot | 1 | Risk Ratio (M‐H, Fixed, 95% CI) | Totals not selected | |
| 23.1 urodynamic stress incontinence (only) | 0 | Risk Ratio (M‐H, Fixed, 95% CI) | 0.0 [0.0, 0.0] | |
| 23.2 stress urinary incontinence (symptoms only) | 1 | Risk Ratio (M‐H, Fixed, 95% CI) | 0.0 [0.0, 0.0] | |
| 23.3 mixed incontinence | 0 | Risk Ratio (M‐H, Fixed, 95% CI) | 0.0 [0.0, 0.0] | |
| 24 Number of women requiring treatment for pelvic organ prolapse Show forest plot | 3 | 559 | Risk Ratio (M‐H, Fixed, 95% CI) | 0.20 [0.05, 0.77] |
| 24.1 urodynamic stress incontinence (only) | 2 | 106 | Risk Ratio (M‐H, Fixed, 95% CI) | 0.2 [0.04, 1.11] |
| 24.2 stress urinary incontinence (symptoms only) | 1 | 453 | Risk Ratio (M‐H, Fixed, 95% CI) | 0.20 [0.02, 1.74] |
| 24.3 mixed incontinence | 0 | 0 | Risk Ratio (M‐H, Fixed, 95% CI) | 0.0 [0.0, 0.0] |
| 25 Repeat surgery for urinary incontinence Show forest plot | 1 | Risk Ratio (M‐H, Fixed, 95% CI) | Totals not selected | |
| 25.1 urodynamic stress incontinence (only) | 0 | Risk Ratio (M‐H, Fixed, 95% CI) | 0.0 [0.0, 0.0] | |
| 25.2 stress urinary incontinence (symptoms only) | 1 | Risk Ratio (M‐H, Fixed, 95% CI) | 0.0 [0.0, 0.0] | |
| 25.3 mixed incontinence | 0 | Risk Ratio (M‐H, Fixed, 95% CI) | 0.0 [0.0, 0.0] | |
| 26 Condition‐specific measures to assess quality of life Show forest plot | 1 | Mean Difference (IV, Fixed, 95% CI) | Totals not selected | |
| 26.1 Urinary Distress Index (UDI) | 1 | Mean Difference (IV, Fixed, 95% CI) | 0.0 [0.0, 0.0] | |
| 26.2 Incontinence Impact Questionnaire (IIQ) | 1 | Mean Difference (IV, Fixed, 95% CI) | 0.0 [0.0, 0.0] | |
| Outcome or subgroup title | No. of studies | No. of participants | Statistical method | Effect size |
| 1 Number of women with urinary incontinence (worse, unchanged, or improved) within first year (women's observations) Show forest plot | 11 | 841 | Risk Ratio (M‐H, Fixed, 95% CI) | 1.04 [0.85, 1.28] |
| 1.1 urodynamic stress incontinence (only) | 5 | 427 | Risk Ratio (M‐H, Fixed, 95% CI) | 1.02 [0.77, 1.36] |
| 1.2 stress urinary incontinence (symptoms only) | 1 | 53 | Risk Ratio (M‐H, Fixed, 95% CI) | 1.12 [0.17, 7.37] |
| 1.3 mixed urinary incontinence | 5 | 361 | Risk Ratio (M‐H, Fixed, 95% CI) | 1.06 [0.78, 1.42] |
| 2 Number not improved (worse or unchanged) within first year (women's observations) Show forest plot | 3 | 425 | Risk Ratio (M‐H, Fixed, 95% CI) | 0.79 [0.49, 1.29] |
| 2.1 urodynamic stress incontinence (only) | 2 | 286 | Risk Ratio (M‐H, Fixed, 95% CI) | 0.95 [0.40, 2.21] |
| 2.2 stress urinary incontinence (symptoms only) | 0 | 0 | Risk Ratio (M‐H, Fixed, 95% CI) | 0.0 [0.0, 0.0] |
| 2.3 mixed urinary incontinence | 1 | 139 | Risk Ratio (M‐H, Fixed, 95% CI) | 0.72 [0.40, 1.29] |
| 3 Number of women with urinary incontinence (worse, unchanged, or improved) at 1 to 5 years (women's observations) Show forest plot | 6 | 458 | Risk Ratio (M‐H, Fixed, 95% CI) | 1.29 [0.98, 1.68] |
| 3.1 urodynamic stress incontinence (only) | 4 | 364 | Risk Ratio (M‐H, Fixed, 95% CI) | 1.18 [0.87, 1.59] |
| 3.2 stress urinary incontinence (symptoms only) | 0 | 0 | Risk Ratio (M‐H, Fixed, 95% CI) | 0.0 [0.0, 0.0] |
| 3.3 mixed urinary incontinence | 2 | 94 | Risk Ratio (M‐H, Fixed, 95% CI) | 1.79 [0.96, 3.31] |
| 4 Number not improved (worse or unchanged) after first year (women's observations) Show forest plot | 2 | 264 | Risk Ratio (M‐H, Fixed, 95% CI) | 1.28 [0.56, 2.94] |
| 4.1 urodynamic stress incontinence (only) | 2 | 264 | Risk Ratio (M‐H, Fixed, 95% CI) | 1.28 [0.56, 2.94] |
| 4.2 stress urinary incontinence (symptoms only) | 0 | 0 | Risk Ratio (M‐H, Fixed, 95% CI) | 0.0 [0.0, 0.0] |
| 4.3 mixed urinary incontinence | 0 | 0 | Risk Ratio (M‐H, Fixed, 95% CI) | 0.0 [0.0, 0.0] |
| 5 Number of women with urinary incontinence after 5 years (women's observations) Show forest plot | 1 | Risk Ratio (M‐H, Fixed, 95% CI) | Totals not selected | |
| 5.1 urodynamic stress incontinence (only) | 1 | Risk Ratio (M‐H, Fixed, 95% CI) | 0.0 [0.0, 0.0] | |
| 5.2 stress urinary incontinence (symptoms only) | 0 | Risk Ratio (M‐H, Fixed, 95% CI) | 0.0 [0.0, 0.0] | |
| 5.3 mixed urinary incontinence | 0 | Risk Ratio (M‐H, Fixed, 95% CI) | 0.0 [0.0, 0.0] | |
| 6 Number with incontinence not improved after 5 years (women's observations) Show forest plot | 1 | Risk Ratio (M‐H, Fixed, 95% CI) | Totals not selected | |
| 6.1 urodynamic stress incontinence (only) | 1 | Risk Ratio (M‐H, Fixed, 95% CI) | 0.0 [0.0, 0.0] | |
| 6.2 stress urinary incontinence (symptoms only) | 0 | Risk Ratio (M‐H, Fixed, 95% CI) | 0.0 [0.0, 0.0] | |
| 6.3 mixed urinary incontinence | 0 | Risk Ratio (M‐H, Fixed, 95% CI) | 0.0 [0.0, 0.0] | |
| 7 CURE: number of women cured at > 1 year (women's observations) Show forest plot | 4 | 337 | Odds Ratio (M‐H, Fixed, 95% CI) | 1.06 [0.65, 1.72] |
| 7.1 urodynamic stress incontinence (only) | 3 | 293 | Odds Ratio (M‐H, Fixed, 95% CI) | 1.21 [0.72, 2.03] |
| 7.2 stress urinary incontinence (symptoms only) | 0 | 0 | Odds Ratio (M‐H, Fixed, 95% CI) | 0.0 [0.0, 0.0] |
| 7.3 mixed urinary incontinence | 1 | 44 | Odds Ratio (M‐H, Fixed, 95% CI) | 0.42 [0.10, 1.72] |
| 8 Repeat surgery for urinary incontinence Show forest plot | 1 | Risk Ratio (M‐H, Fixed, 95% CI) | Totals not selected | |
| 8.1 urodynamic stress incontinence (only) | 1 | Risk Ratio (M‐H, Fixed, 95% CI) | 0.0 [0.0, 0.0] | |
| 8.2 stress urinary incontinence (symptoms only) | 0 | Risk Ratio (M‐H, Fixed, 95% CI) | 0.0 [0.0, 0.0] | |
| 8.3 mixed incontinence | 0 | Risk Ratio (M‐H, Fixed, 95% CI) | 0.0 [0.0, 0.0] | |
| 9 Number of women not satisfied Show forest plot | 2 | Risk Ratio (M‐H, Fixed, 95% CI) | Subtotals only | |
| 9.1 urodynamic stress incontinence (only) | 2 | 163 | Risk Ratio (M‐H, Fixed, 95% CI) | 0.82 [0.51, 1.32] |
| 9.2 stress urinary incontinence (symptoms only) | 0 | 0 | Risk Ratio (M‐H, Fixed, 95% CI) | 0.0 [0.0, 0.0] |
| 9.3 mixed urinary incontinence | 0 | 0 | Risk Ratio (M‐H, Fixed, 95% CI) | 0.0 [0.0, 0.0] |
| 10 Pad test of quantified leakage (mean weight of urine loss) Show forest plot | 1 | Mean Difference (IV, Fixed, 95% CI) | Totals not selected | |
| 10.1 urodynamic stress incontinence (only) | 1 | Mean Difference (IV, Fixed, 95% CI) | 0.0 [0.0, 0.0] | |
| 10.2 stress urinary incontinence (symptoms only) | 0 | Mean Difference (IV, Fixed, 95% CI) | 0.0 [0.0, 0.0] | |
| 10.3 mixed urinary incontinence | 0 | Mean Difference (IV, Fixed, 95% CI) | 0.0 [0.0, 0.0] | |
| 11 Number of women with urinary incontinence (clinician's observations) within first year Show forest plot | 2 | 105 | Risk Ratio (M‐H, Fixed, 95% CI) | 1.29 [0.45, 3.71] |
| 11.1 urodynamic stress incontinence (only) | 0 | 0 | Risk Ratio (M‐H, Fixed, 95% CI) | 0.0 [0.0, 0.0] |
| 11.2 stress urinary incontinence (symptoms only) | 0 | 0 | Risk Ratio (M‐H, Fixed, 95% CI) | 0.0 [0.0, 0.0] |
| 11.3 mixed urinary incontinence | 2 | 105 | Risk Ratio (M‐H, Fixed, 95% CI) | 1.29 [0.45, 3.71] |
| 12 Number of women with urinary incontinence (clinician's observations) after first year Show forest plot | 1 | Risk Ratio (M‐H, Fixed, 95% CI) | Totals not selected | |
| 12.1 urodynamic stress incontinence (only) | 0 | Risk Ratio (M‐H, Fixed, 95% CI) | 0.0 [0.0, 0.0] | |
| 12.2 stress urinary incontinence (symptoms only) | 0 | Risk Ratio (M‐H, Fixed, 95% CI) | 0.0 [0.0, 0.0] | |
| 12.3 mixed urinary incontinence | 1 | Risk Ratio (M‐H, Fixed, 95% CI) | 0.0 [0.0, 0.0] | |
| 13 Duration of operation (minutes) Show forest plot | 7 | 355 | Mean Difference (IV, Fixed, 95% CI) | 57.08 [54.67, 59.49] |
| 13.1 urodynamic stress incontinence (only) | 2 | 61 | Mean Difference (IV, Fixed, 95% CI) | 46.91 [42.31, 51.52] |
| 13.2 stress urinary incontinence (symptoms only) | 1 | 53 | Mean Difference (IV, Fixed, 95% CI) | 20.0 [7.08, 32.92] |
| 13.3 mixed urinary incontinence | 4 | 241 | Mean Difference (IV, Fixed, 95% CI) | 62.96 [60.07, 65.86] |
| 14 Length of hospital stay (days) Show forest plot | 4 | 194 | Mean Difference (IV, Fixed, 95% CI) | 0.74 [0.55, 0.93] |
| 14.1 urodynamic stress incontinence (only) | 1 | 20 | Mean Difference (IV, Fixed, 95% CI) | 0.65 [0.39, 0.91] |
| 14.2 stress urinary incontinence (symptoms only) | 0 | 0 | Mean Difference (IV, Fixed, 95% CI) | 0.0 [0.0, 0.0] |
| 14.3 mixed urinary incontinence | 3 | 174 | Mean Difference (IV, Fixed, 95% CI) | 0.83 [0.56, 1.10] |
| 15 Time to catheter removal (days) Show forest plot | 2 | 113 | Mean Difference (IV, Fixed, 95% CI) | 0.11 [‐0.07, 0.30] |
| 15.1 urodynamic stress incontinence (only) | 0 | 0 | Mean Difference (IV, Fixed, 95% CI) | 0.0 [0.0, 0.0] |
| 15.2 stress urinary incontinence (symptoms only) | 1 | 53 | Mean Difference (IV, Fixed, 95% CI) | 2.3 [0.01, 4.59] |
| 15.3 mixed urinary incontinence | 1 | 60 | Mean Difference (IV, Fixed, 95% CI) | 0.10 [‐0.09, 0.29] |
| 16 Perioperative surgical complications Show forest plot | 4 | 293 | Risk Ratio (M‐H, Fixed, 95% CI) | 1.74 [1.16, 2.60] |
| 16.1 urodynamic stress incontinence (only) | 2 | 183 | Risk Ratio (M‐H, Fixed, 95% CI) | 1.73 [1.01, 2.96] |
| 16.2 stress urinary incontinence (symptoms only) | 0 | 0 | Risk Ratio (M‐H, Fixed, 95% CI) | 0.0 [0.0, 0.0] |
| 16.3 mixed urinary incontinence | 2 | 110 | Risk Ratio (M‐H, Fixed, 95% CI) | 1.74 [0.94, 3.21] |
| 17 Bladder perforations Show forest plot | 10 | 844 | Risk Ratio (M‐H, Fixed, 95% CI) | 0.59 [0.34, 1.01] |
| 17.1 urodynamic stress incontinence (only) | 3 | 334 | Risk Ratio (M‐H, Fixed, 95% CI) | 0.74 [0.19, 2.86] |
| 17.2 stress urinary incontinence (symptoms only) | 1 | 53 | Risk Ratio (M‐H, Fixed, 95% CI) | 0.56 [0.05, 5.81] |
| 17.3 mixed urinary incontinence | 6 | 457 | Risk Ratio (M‐H, Fixed, 95% CI) | 0.56 [0.30, 1.03] |
| 18 Urethral injury Show forest plot | 1 | Risk Ratio (M‐H, Fixed, 95% CI) | Totals not selected | |
| 18.1 urodynamic stress incontinence (only) | 0 | Risk Ratio (M‐H, Fixed, 95% CI) | 0.0 [0.0, 0.0] | |
| 18.2 stress urinary incontinence (symptoms only) | 0 | Risk Ratio (M‐H, Fixed, 95% CI) | 0.0 [0.0, 0.0] | |
| 18.3 mixed urinary incontinence | 1 | Risk Ratio (M‐H, Fixed, 95% CI) | 0.0 [0.0, 0.0] | |
| 19 Vaginal bleeding Show forest plot | 1 | Risk Ratio (M‐H, Fixed, 95% CI) | Totals not selected | |
| 19.1 urodynamic stress incontinence (only) | 0 | Risk Ratio (M‐H, Fixed, 95% CI) | 0.0 [0.0, 0.0] | |
| 19.2 stress urinary incontinence (symptoms only) | 0 | Risk Ratio (M‐H, Fixed, 95% CI) | 0.0 [0.0, 0.0] | |
| 19.3 mixed urinary incontinence | 1 | Risk Ratio (M‐H, Fixed, 95% CI) | 0.0 [0.0, 0.0] | |
| 20 Urinary tract infection Show forest plot | 1 | Risk Ratio (M‐H, Fixed, 95% CI) | Totals not selected | |
| 20.1 urodynamic stress incontinence (only) | 0 | Risk Ratio (M‐H, Fixed, 95% CI) | 0.0 [0.0, 0.0] | |
| 20.2 stress urinary incontinence (symptoms only) | 0 | Risk Ratio (M‐H, Fixed, 95% CI) | 0.0 [0.0, 0.0] | |
| 20.3 mixed urinary incontinence | 1 | Risk Ratio (M‐H, Fixed, 95% CI) | 0.0 [0.0, 0.0] | |
| 21 Voiding dysfunction Show forest plot | 8 | 629 | Risk Ratio (M‐H, Fixed, 95% CI) | 1.34 [0.85, 2.12] |
| 21.1 urodynamic stress incontinence (only) | 3 | 325 | Risk Ratio (M‐H, Fixed, 95% CI) | 1.22 [0.60, 2.46] |
| 21.2 stress urinary incontinence (symptoms only) | 1 | 53 | Risk Ratio (M‐H, Fixed, 95% CI) | 2.61 [0.76, 9.03] |
| 21.3 mixed urinary incontinence | 4 | 251 | Risk Ratio (M‐H, Fixed, 95% CI) | 1.18 [0.58, 2.40] |
| 22 De novo detrusor urgency or urge symptoms Show forest plot | 5 | 348 | Risk Ratio (M‐H, Fixed, 95% CI) | 1.62 [0.66, 3.99] |
| 22.1 urodynamic stress incontinence (only) | 1 | 124 | Risk Ratio (M‐H, Fixed, 95% CI) | 0.34 [0.01, 8.29] |
| 22.2 stress urinary incontinence (symptoms only) | 1 | 53 | Risk Ratio (M‐H, Fixed, 95% CI) | 3.35 [0.14, 78.60] |
| 22.3 mixed urinary incontinence | 3 | 171 | Risk Ratio (M‐H, Fixed, 95% CI) | 1.81 [0.65, 5.06] |
| 23 De novo detrusor overactivity (urodynamic diagnosis) Show forest plot | 4 | 325 | Risk Ratio (M‐H, Fixed, 95% CI) | 2.61 [1.17, 5.84] |
| 23.1 urodynamic stress incontinence (only) | 1 | 59 | Risk Ratio (M‐H, Fixed, 95% CI) | 0.0 [0.0, 0.0] |
| 23.2 stress urinary incontinence (symptoms only) | 1 | 47 | Risk Ratio (M‐H, Fixed, 95% CI) | 3.13 [0.13, 73.01] |
| 23.3 mixed urinary incontinence | 2 | 219 | Risk Ratio (M‐H, Fixed, 95% CI) | 2.57 [1.12, 5.92] |
| 24 Long‐term adverse effects (release of sling required) Show forest plot | 3 | 326 | Risk Ratio (M‐H, Fixed, 95% CI) | 2.53 [0.87, 7.35] |
| 24.1 urodynamic stress incontinence (only) | 2 | 266 | Risk Ratio (M‐H, Fixed, 95% CI) | 1.68 [0.50, 5.66] |
| 24.2 stress urinary incontinence (symptoms only) | 0 | 0 | Risk Ratio (M‐H, Fixed, 95% CI) | 0.0 [0.0, 0.0] |
| 24.3 mixed urinary incontinence | 1 | 60 | Risk Ratio (M‐H, Fixed, 95% CI) | 9.6 [0.54, 170.84] |
| 25 Long‐term adverse effects (wound pain at 6 months) Show forest plot | 3 | 257 | Risk Ratio (M‐H, Fixed, 95% CI) | 6.40 [1.94, 21.12] |
| 25.1 urodynamic stress incontinence (only) | 1 | 124 | Risk Ratio (M‐H, Fixed, 95% CI) | 5.16 [0.25, 105.36] |
| 25.2 stress urinary incontinence (symptoms only) | 1 | 53 | Risk Ratio (M‐H, Fixed, 95% CI) | 3.92 [0.90, 17.15] |
| 25.3 mixed urinary incontinence | 1 | 80 | Risk Ratio (M‐H, Fixed, 95% CI) | 17.0 [1.01, 284.96] |
| 26 Long‐term adverse effects (vaginal mesh or graft exposure) Show forest plot | 5 | 348 | Risk Ratio (M‐H, Fixed, 95% CI) | 0.28 [0.05, 1.65] |
| 26.1 urodynamic stress incontinence (only) | 2 | 165 | Risk Ratio (M‐H, Fixed, 95% CI) | 0.35 [0.04, 3.24] |
| 26.2 stress urinary incontinence (symptoms only) | 1 | 53 | Risk Ratio (M‐H, Fixed, 95% CI) | 0.0 [0.0, 0.0] |
| 26.3 mixed urinary incontinence | 2 | 130 | Risk Ratio (M‐H, Fixed, 95% CI) | 0.2 [0.01, 3.97] |
| 27 Condition‐specific measures to assess quality of life: UDI‐6 Show forest plot | 1 | 63 | Mean Difference (IV, Fixed, 95% CI) | 7.30 [‐2.00, 16.60] |
| 27.1 urodynamic stress incontinence (only) | 0 | 0 | Mean Difference (IV, Fixed, 95% CI) | 0.0 [0.0, 0.0] |
| 27.2 stress urinary incontinence (symptoms only) | 1 | 63 | Mean Difference (IV, Fixed, 95% CI) | 7.30 [‐2.00, 16.60] |
| 27.3 mixed urinary incontinence | 0 | 0 | Mean Difference (IV, Fixed, 95% CI) | 0.0 [0.0, 0.0] |
| 28 Condition‐specific measures to assess quality of life: IIQ‐7 Show forest plot | 1 | 63 | Mean Difference (IV, Fixed, 95% CI) | 0.60 [‐10.17, 11.37] |
| 28.1 urodynamic stress incontinence (only) | 0 | 0 | Mean Difference (IV, Fixed, 95% CI) | 0.0 [0.0, 0.0] |
| 28.2 stress urinary incontinence (symptoms only) | 1 | 63 | Mean Difference (IV, Fixed, 95% CI) | 0.60 [‐10.17, 11.37] |
| 28.3 mixed urinary incontinence | 0 | 0 | Mean Difference (IV, Fixed, 95% CI) | 0.0 [0.0, 0.0] |
| Outcome or subgroup title | No. of studies | No. of participants | Statistical method | Effect size |
| 1 Number of women with urinary incontinence in the medium term (1 to 5 years) Show forest plot | 1 | Risk Ratio (M‐H, Fixed, 95% CI) | Totals not selected | |
| 1.1 urodynamic stress incontinence (only) | 1 | Risk Ratio (M‐H, Fixed, 95% CI) | 0.0 [0.0, 0.0] | |
| 1.2 stress urinary incontinence (symptoms only) | 0 | Risk Ratio (M‐H, Fixed, 95% CI) | 0.0 [0.0, 0.0] | |
| 1.3 mixed incontinence | 0 | Risk Ratio (M‐H, Fixed, 95% CI) | 0.0 [0.0, 0.0] | |
| 2 Number of women not satisfied within first year Show forest plot | 1 | Risk Ratio (M‐H, Fixed, 95% CI) | Totals not selected | |
| 2.1 urodynamic stress incontinence (only) | 1 | Risk Ratio (M‐H, Fixed, 95% CI) | 0.0 [0.0, 0.0] | |
| 2.2 stress urinary incontinence (symptoms only) | 0 | Risk Ratio (M‐H, Fixed, 95% CI) | 0.0 [0.0, 0.0] | |
| 2.3 mixed incontinence | 0 | Risk Ratio (M‐H, Fixed, 95% CI) | 0.0 [0.0, 0.0] | |
| 3 Number of women with urinary incontinence (clinician's observations) within first year Show forest plot | 1 | Risk Ratio (M‐H, Fixed, 95% CI) | Totals not selected | |
| 3.1 urodynamic stress incontinence (only) | 1 | Risk Ratio (M‐H, Fixed, 95% CI) | 0.0 [0.0, 0.0] | |
| 3.2 stress urinary incontinence (symptoms only) | 0 | Risk Ratio (M‐H, Fixed, 95% CI) | 0.0 [0.0, 0.0] | |
| 3.3 mixed incontinence | 0 | Risk Ratio (M‐H, Fixed, 95% CI) | 0.0 [0.0, 0.0] | |
| 4 CURE: number of women cured at > 1 year (women's observations) Show forest plot | 1 | Odds Ratio (M‐H, Fixed, 95% CI) | Totals not selected | |
| 4.1 urodynamic stress incontinence (only) | 1 | Odds Ratio (M‐H, Fixed, 95% CI) | 0.0 [0.0, 0.0] | |
| 4.2 stress urinary incontinence (symptoms only) | 0 | Odds Ratio (M‐H, Fixed, 95% CI) | 0.0 [0.0, 0.0] | |
| 4.3 mixed incontinence | 0 | Odds Ratio (M‐H, Fixed, 95% CI) | 0.0 [0.0, 0.0] | |
| 5 Bladder perforation Show forest plot | 1 | Risk Ratio (M‐H, Fixed, 95% CI) | Totals not selected | |
| 5.1 urodynamic stress incontinence (only) | 1 | Risk Ratio (M‐H, Fixed, 95% CI) | 0.0 [0.0, 0.0] | |
| 5.2 stress urinary incontinence (symptoms only) | 0 | Risk Ratio (M‐H, Fixed, 95% CI) | 0.0 [0.0, 0.0] | |
| 5.3 mixed incontinence | 0 | Risk Ratio (M‐H, Fixed, 95% CI) | 0.0 [0.0, 0.0] | |
| 6 Urge urinary symptoms, urgency urinary incontinence Show forest plot | 1 | Risk Ratio (M‐H, Fixed, 95% CI) | Totals not selected | |
| 6.1 urodynamic stress incontinence (only) | 1 | Risk Ratio (M‐H, Fixed, 95% CI) | 0.0 [0.0, 0.0] | |
| 6.2 stress urinary incontinence (symptoms only) | 0 | Risk Ratio (M‐H, Fixed, 95% CI) | 0.0 [0.0, 0.0] | |
| 6.3 mixed incontinence | 0 | Risk Ratio (M‐H, Fixed, 95% CI) | 0.0 [0.0, 0.0] | |
| 7 Pain with intercourse (dyspareunia) Show forest plot | 1 | Risk Ratio (M‐H, Fixed, 95% CI) | Totals not selected | |
| 7.1 urodynamic stress incontinence (only) | 1 | Risk Ratio (M‐H, Fixed, 95% CI) | 0.0 [0.0, 0.0] | |
| 7.2 stress urinary incontinence (symptoms only) | 0 | Risk Ratio (M‐H, Fixed, 95% CI) | 0.0 [0.0, 0.0] | |
| 7.3 mixed incontinence | 0 | Risk Ratio (M‐H, Fixed, 95% CI) | 0.0 [0.0, 0.0] | |
| 8 Long‐term adverse effects (vaginal mesh or graft exposure) Show forest plot | 1 | Risk Ratio (M‐H, Fixed, 95% CI) | Totals not selected | |
| 8.1 urodynamic stress incontinence (only) | 1 | Risk Ratio (M‐H, Fixed, 95% CI) | 0.0 [0.0, 0.0] | |
| 8.2 stress urinary incontinence (symptoms only) | 0 | Risk Ratio (M‐H, Fixed, 95% CI) | 0.0 [0.0, 0.0] | |
| 8.3 mixed incontinence | 0 | Risk Ratio (M‐H, Fixed, 95% CI) | 0.0 [0.0, 0.0] | |
| 9 Condition‐specific measures to assess quality of life: IIQ score Show forest plot | 1 | Mean Difference (IV, Fixed, 95% CI) | Totals not selected | |
| 9.1 urodynamic stress incontinence (only) | 1 | Mean Difference (IV, Fixed, 95% CI) | 0.0 [0.0, 0.0] | |
| 9.2 stress urinary incontinence (symptoms only) | 0 | Mean Difference (IV, Fixed, 95% CI) | 0.0 [0.0, 0.0] | |
| 9.3 mixed urinary incontinence | 0 | Mean Difference (IV, Fixed, 95% CI) | 0.0 [0.0, 0.0] | |
| Outcome or subgroup title | No. of studies | No. of participants | Statistical method | Effect size |
| 1 Number of women with urinary incontinence (worse, unchanged, or improved) within first year (women's observations) Show forest plot | 5 | Risk Ratio (M‐H, Fixed, 95% CI) | Totals not selected | |
| 1.1 fascial sling vs Pelvicol sling | 1 | Risk Ratio (M‐H, Fixed, 95% CI) | 0.0 [0.0, 0.0] | |
| 1.2 standard sling vs short sling | 1 | Risk Ratio (M‐H, Fixed, 95% CI) | 0.0 [0.0, 0.0] | |
| 1.3 autologous fascial sling vs Fortaperm sling | 1 | Risk Ratio (M‐H, Fixed, 95% CI) | 0.0 [0.0, 0.0] | |
| 1.4 Vypro vs Ultrapro | 1 | Risk Ratio (M‐H, Fixed, 95% CI) | 0.0 [0.0, 0.0] | |
| 1.5 Vypro vs Prolene light | 1 | Risk Ratio (M‐H, Fixed, 95% CI) | 0.0 [0.0, 0.0] | |
| 1.6 Ultrapro vs Prolene light | 1 | Risk Ratio (M‐H, Fixed, 95% CI) | 0.0 [0.0, 0.0] | |
| 1.7 fascial sling vs vaginal wall sling | 1 | Risk Ratio (M‐H, Fixed, 95% CI) | 0.0 [0.0, 0.0] | |
| 2 Number not improved (worse or unchanged) within first year (women's observations) Show forest plot | 3 | Risk Ratio (M‐H, Fixed, 95% CI) | Totals not selected | |
| 2.1 fascial sling vs Pelvicol sling | 1 | Risk Ratio (M‐H, Fixed, 95% CI) | 0.0 [0.0, 0.0] | |
| 2.2 autologous fascial sling vs Fortaperm sling | 1 | Risk Ratio (M‐H, Fixed, 95% CI) | 0.0 [0.0, 0.0] | |
| 2.3 rectus fascia sling vs Goretex sling | 1 | Risk Ratio (M‐H, Fixed, 95% CI) | 0.0 [0.0, 0.0] | |
| 3 Number of women with urinary incontinence (worse, unchanged, or improved) at 1 to 5 years (women's observations) Show forest plot | 7 | Risk Ratio (M‐H, Fixed, 95% CI) | Totals not selected | |
| 3.1 fascial sling vs Pelvicol sling | 1 | Risk Ratio (M‐H, Fixed, 95% CI) | 0.0 [0.0, 0.0] | |
| 3.2 standard sling vs short sling | 1 | Risk Ratio (M‐H, Fixed, 95% CI) | 0.0 [0.0, 0.0] | |
| 3.3 autologous dermal graft patch vs cadaveric fascia lata | 1 | Risk Ratio (M‐H, Fixed, 95% CI) | 0.0 [0.0, 0.0] | |
| 3.4 rectus fascia sling vs Goretex sling | 1 | Risk Ratio (M‐H, Fixed, 95% CI) | 0.0 [0.0, 0.0] | |
| 3.5 Vypro vs Ultrapro | 1 | Risk Ratio (M‐H, Fixed, 95% CI) | 0.0 [0.0, 0.0] | |
| 3.6 Vypro vs Prolene light | 1 | Risk Ratio (M‐H, Fixed, 95% CI) | 0.0 [0.0, 0.0] | |
| 3.7 Ultrapro vs Prolene light | 1 | Risk Ratio (M‐H, Fixed, 95% CI) | 0.0 [0.0, 0.0] | |
| 3.8 anterior vaginal wall sling vs biosynthetic mesh sling | 1 | Risk Ratio (M‐H, Fixed, 95% CI) | 0.0 [0.0, 0.0] | |
| 3.9 anterior rectus sheath sling vs Prolene strip | 1 | Risk Ratio (M‐H, Fixed, 95% CI) | 0.0 [0.0, 0.0] | |
| 3.10 anterior rectus sheath sling vs anterior vaginal wall patch | 1 | Risk Ratio (M‐H, Fixed, 95% CI) | 0.0 [0.0, 0.0] | |
| 3.11 Prolene strip vs anterior vaginal wall patch | 1 | Risk Ratio (M‐H, Fixed, 95% CI) | 0.0 [0.0, 0.0] | |
| 4 Number not improved (worse or unchanged) after first year (women's observations) Show forest plot | 4 | Risk Ratio (M‐H, Fixed, 95% CI) | Totals not selected | |
| 4.1 fascial sling vs Pelvicol sling | 1 | Risk Ratio (M‐H, Fixed, 95% CI) | 0.0 [0.0, 0.0] | |
| 4.2 autologous dermal graft patch vs cadaveric fascia lata | 1 | Risk Ratio (M‐H, Fixed, 95% CI) | 0.0 [0.0, 0.0] | |
| 4.3 rectus fascia sling vs Goretex sling | 1 | Risk Ratio (M‐H, Fixed, 95% CI) | 0.0 [0.0, 0.0] | |
| 4.4 anterior rectus sheath sling vs Prolene strip | 1 | Risk Ratio (M‐H, Fixed, 95% CI) | 0.0 [0.0, 0.0] | |
| 4.5 anterior rectus sheath sling vs anterior vaginal wall patch | 1 | Risk Ratio (M‐H, Fixed, 95% CI) | 0.0 [0.0, 0.0] | |
| 4.6 Prolene strip vs anterior vaginal wall patch | 1 | Risk Ratio (M‐H, Fixed, 95% CI) | 0.0 [0.0, 0.0] | |
| 5 Number of women with urinary incontinence (worse, unchanged, or improved) after 5 years (women's observations) Show forest plot | 1 | Risk Ratio (M‐H, Fixed, 95% CI) | Totals not selected | |
| 5.1 standard sling vs short sling | 1 | Risk Ratio (M‐H, Fixed, 95% CI) | 0.0 [0.0, 0.0] | |
| 6 CURE: number of women with urinary incontinence > 1 year (women's observations) Show forest plot | 3 | Odds Ratio (M‐H, Fixed, 95% CI) | Totals not selected | |
| 6.1 fascial sling vs Pelvicol sling | 1 | Odds Ratio (M‐H, Fixed, 95% CI) | 0.0 [0.0, 0.0] | |
| 6.2 standard sling vs short sling | 1 | Odds Ratio (M‐H, Fixed, 95% CI) | 0.0 [0.0, 0.0] | |
| 6.3 autologous dermal graft patch vs cadaveric fascia lata | 1 | Odds Ratio (M‐H, Fixed, 95% CI) | 0.0 [0.0, 0.0] | |
| 7 Number of women not satisfied Show forest plot | 3 | Risk Ratio (M‐H, Fixed, 95% CI) | Totals not selected | |
| 7.1 fascial sling vs Pelvicol sling | 1 | Risk Ratio (M‐H, Fixed, 95% CI) | 0.0 [0.0, 0.0] | |
| 7.2 Vypro vs Ultrapro | 1 | Risk Ratio (M‐H, Fixed, 95% CI) | 0.0 [0.0, 0.0] | |
| 7.3 Vypro vs Prolene light | 1 | Risk Ratio (M‐H, Fixed, 95% CI) | 0.0 [0.0, 0.0] | |
| 7.4 Ultrapro vs Prolene light | 1 | Risk Ratio (M‐H, Fixed, 95% CI) | 0.0 [0.0, 0.0] | |
| 7.5 anterior vaginal wall sling vs biosynthetic mesh sling | 1 | Risk Ratio (M‐H, Fixed, 95% CI) | 0.0 [0.0, 0.0] | |
| 8 Pad test of quantified leakage (mean weight of urine loss) at 1 year Show forest plot | 2 | Mean Difference (IV, Fixed, 95% CI) | Totals not selected | |
| 8.1 standard sling vs short sling | 1 | Mean Difference (IV, Fixed, 95% CI) | 0.0 [0.0, 0.0] | |
| 8.2 Vypro vs Ultrapro | 1 | Mean Difference (IV, Fixed, 95% CI) | 0.0 [0.0, 0.0] | |
| 8.3 Vypro vs Prolene light | 1 | Mean Difference (IV, Fixed, 95% CI) | 0.0 [0.0, 0.0] | |
| 8.4 Ultrapro vs Prolene light | 1 | Mean Difference (IV, Fixed, 95% CI) | 0.0 [0.0, 0.0] | |
| 9 Pad test of quantified leakage (mean weight of urine loss) at 1 to 5 years Show forest plot | 1 | Mean Difference (IV, Fixed, 95% CI) | Totals not selected | |
| 9.1 Vypro vs Ultrapro | 1 | Mean Difference (IV, Fixed, 95% CI) | 0.0 [0.0, 0.0] | |
| 9.2 Vypro vs Prolene light | 1 | Mean Difference (IV, Fixed, 95% CI) | 0.0 [0.0, 0.0] | |
| 9.3 Ultrapro vs Prolene light | 1 | Mean Difference (IV, Fixed, 95% CI) | 0.0 [0.0, 0.0] | |
| 10 Duration of operation (minutes) Show forest plot | 2 | Mean Difference (IV, Fixed, 95% CI) | Totals not selected | |
| 10.1 standard sling vs short sling | 1 | Mean Difference (IV, Fixed, 95% CI) | 0.0 [0.0, 0.0] | |
| 10.2 anterior rectus sheath sling vs Prolene strip | 1 | Mean Difference (IV, Fixed, 95% CI) | 0.0 [0.0, 0.0] | |
| 10.3 anterior rectus sheath sling vs anterior vaginal wall patch | 1 | Mean Difference (IV, Fixed, 95% CI) | 0.0 [0.0, 0.0] | |
| 10.4 Prolene strip vs anterior vaginal wall patch | 1 | Mean Difference (IV, Fixed, 95% CI) | 0.0 [0.0, 0.0] | |
| 11 Blood loss (mL) Show forest plot | 1 | Mean Difference (IV, Fixed, 95% CI) | Totals not selected | |
| 11.1 anterior rectus sheath sling vs Prolene strip | 1 | Mean Difference (IV, Fixed, 95% CI) | 0.0 [0.0, 0.0] | |
| 11.2 anterior rectus sheath sling vs anterior vaginal wall patch | 1 | Mean Difference (IV, Fixed, 95% CI) | 0.0 [0.0, 0.0] | |
| 11.3 Prolene strip vs anterior vaginal wall patch | 1 | Mean Difference (IV, Fixed, 95% CI) | 0.0 [0.0, 0.0] | |
| 12 Length of hospital stay (days) Show forest plot | 1 | Mean Difference (IV, Fixed, 95% CI) | Totals not selected | |
| 12.1 anterior rectus sheath sling vs Prolene strip | 1 | Mean Difference (IV, Fixed, 95% CI) | 0.0 [0.0, 0.0] | |
| 12.2 anterior rectus sheath sling vs anterior vaginal wall patch | 1 | Mean Difference (IV, Fixed, 95% CI) | 0.0 [0.0, 0.0] | |
| 12.3 Prolene strip vs anterior vaginal wall patch | 1 | Mean Difference (IV, Fixed, 95% CI) | 0.0 [0.0, 0.0] | |
| 13 Perioperative surgical complications Show forest plot | 3 | Risk Ratio (M‐H, Fixed, 95% CI) | Totals not selected | |
| 13.1 standard sling vs short sling | 1 | Risk Ratio (M‐H, Fixed, 95% CI) | 0.0 [0.0, 0.0] | |
| 13.2 rectus fascia sling vs Goretex sling | 1 | Risk Ratio (M‐H, Fixed, 95% CI) | 0.0 [0.0, 0.0] | |
| 13.3 fascial sling vs vaginal wall sling | 1 | Risk Ratio (M‐H, Fixed, 95% CI) | 0.0 [0.0, 0.0] | |
| 14 Bladder perforation Show forest plot | 3 | Risk Ratio (M‐H, Fixed, 95% CI) | Totals not selected | |
| 14.1 standard sling vs short sling | 1 | Risk Ratio (M‐H, Fixed, 95% CI) | 0.0 [0.0, 0.0] | |
| 14.2 fascial sling vs Pelvicol sling | 1 | Risk Ratio (M‐H, Fixed, 95% CI) | 0.0 [0.0, 0.0] | |
| 14.3 anterior rectus sheath sling vs Prolene strip | 1 | Risk Ratio (M‐H, Fixed, 95% CI) | 0.0 [0.0, 0.0] | |
| 14.4 anterior rectus sheath sling vs anterior vaginal wall patch | 1 | Risk Ratio (M‐H, Fixed, 95% CI) | 0.0 [0.0, 0.0] | |
| 14.5 Prolene strip vs anterior vaginal wall patch | 1 | Risk Ratio (M‐H, Fixed, 95% CI) | 0.0 [0.0, 0.0] | |
| 15 Urinary tract infection Show forest plot | 2 | Risk Ratio (M‐H, Fixed, 95% CI) | Totals not selected | |
| 15.1 standard sling vs short sling | 1 | Risk Ratio (M‐H, Fixed, 95% CI) | 0.0 [0.0, 0.0] | |
| 15.2 anterior vaginal wall sling vs biosynthetic mesh sling | 1 | Risk Ratio (M‐H, Fixed, 95% CI) | 0.0 [0.0, 0.0] | |
| 16 Vaginal bleeding Show forest plot | 1 | Risk Ratio (M‐H, Fixed, 95% CI) | Totals not selected | |
| 16.1 anterior vaginal wall sling vs biosynthetic mesh sling | 1 | Risk Ratio (M‐H, Fixed, 95% CI) | 0.0 [0.0, 0.0] | |
| 17 Long‐term adverse effects (wound pain) Show forest plot | 1 | Risk Ratio (M‐H, Fixed, 95% CI) | Totals not selected | |
| 17.1 fascial sling vs Pelvicol sling | 1 | Risk Ratio (M‐H, Fixed, 95% CI) | 0.0 [0.0, 0.0] | |
| 18 Voiding dysfunction Show forest plot | 6 | Risk Ratio (M‐H, Fixed, 95% CI) | Totals not selected | |
| 18.1 fascial sling vs Pelvicol sling | 1 | Risk Ratio (M‐H, Fixed, 95% CI) | 0.0 [0.0, 0.0] | |
| 18.2 standard sling vs short sling | 1 | Risk Ratio (M‐H, Fixed, 95% CI) | 0.0 [0.0, 0.0] | |
| 18.3 Vypro vs Ultrapro | 1 | Risk Ratio (M‐H, Fixed, 95% CI) | 0.0 [0.0, 0.0] | |
| 18.4 Vypro vs Prolene light | 1 | Risk Ratio (M‐H, Fixed, 95% CI) | 0.0 [0.0, 0.0] | |
| 18.5 Ultrapro vs Prolene light | 1 | Risk Ratio (M‐H, Fixed, 95% CI) | 0.0 [0.0, 0.0] | |
| 18.6 anterior vaginal wall sling vs biosynthetic mesh sling | 1 | Risk Ratio (M‐H, Fixed, 95% CI) | 0.0 [0.0, 0.0] | |
| 18.7 anterior rectus sheath sling vs Prolene strip | 1 | Risk Ratio (M‐H, Fixed, 95% CI) | 0.0 [0.0, 0.0] | |
| 18.8 anterior rectus sheath sling vs anterior vaginal wall patch | 1 | Risk Ratio (M‐H, Fixed, 95% CI) | 0.0 [0.0, 0.0] | |
| 18.9 Prolene strip vs anterior vaginal wall patch | 1 | Risk Ratio (M‐H, Fixed, 95% CI) | 0.0 [0.0, 0.0] | |
| 18.10 fascial sling vs vaginal wall sling | 1 | Risk Ratio (M‐H, Fixed, 95% CI) | 0.0 [0.0, 0.0] | |
| 19 Long‐term adverse effects (release of sling required) Show forest plot | 1 | Risk Ratio (M‐H, Fixed, 95% CI) | Totals not selected | |
| 19.1 fascial sling vs Pelvicol sling | 1 | Risk Ratio (M‐H, Fixed, 95% CI) | 0.0 [0.0, 0.0] | |
| 20 De novo detrusor urgency or urge symptoms or detrusor overactivity Show forest plot | 4 | Risk Ratio (M‐H, Fixed, 95% CI) | Totals not selected | |
| 20.1 standard sling vs short sling | 1 | Risk Ratio (M‐H, Fixed, 95% CI) | 0.0 [0.0, 0.0] | |
| 20.2 Vypro vs Ultrapro | 1 | Risk Ratio (M‐H, Fixed, 95% CI) | 0.0 [0.0, 0.0] | |
| 20.3 Vypro vs Prolene light | 1 | Risk Ratio (M‐H, Fixed, 95% CI) | 0.0 [0.0, 0.0] | |
| 20.4 Ultrapro vs Prolene light | 1 | Risk Ratio (M‐H, Fixed, 95% CI) | 0.0 [0.0, 0.0] | |
| 20.5 autologous dermal graft patch vs cadaveric fascia lata | 1 | Risk Ratio (M‐H, Fixed, 95% CI) | 0.0 [0.0, 0.0] | |
| 20.6 rectus fascia sling vs Goretex sling | 1 | Risk Ratio (M‐H, Fixed, 95% CI) | 0.0 [0.0, 0.0] | |
| 21 Repeat surgery for urinary incontinence at first year Show forest plot | 1 | Risk Ratio (M‐H, Fixed, 95% CI) | Totals not selected | |
| 21.1 Fascial sling vs Pelvicol sling | 1 | Risk Ratio (M‐H, Fixed, 95% CI) | 0.0 [0.0, 0.0] | |
| 22 Long‐term adverse effects (vaginal mesh or graft exposure) Show forest plot | 3 | Risk Ratio (M‐H, Fixed, 95% CI) | Totals not selected | |
| 22.1 fascial sling vs Pelvicol sling | 1 | Risk Ratio (M‐H, Fixed, 95% CI) | 0.0 [0.0, 0.0] | |
| 22.2 Vypro vs Ultrapro | 1 | Risk Ratio (M‐H, Fixed, 95% CI) | 0.0 [0.0, 0.0] | |
| 22.3 Vypro vs Prolene light | 1 | Risk Ratio (M‐H, Fixed, 95% CI) | 0.0 [0.0, 0.0] | |
| 22.4 Ultrapro vs Prolene light | 1 | Risk Ratio (M‐H, Fixed, 95% CI) | 0.0 [0.0, 0.0] | |
| 22.5 anterior vaginal wall sling vs biosynthetic mesh sling | 1 | Risk Ratio (M‐H, Fixed, 95% CI) | 0.0 [0.0, 0.0] | |
| 23 Condition‐specific measures to assess quality of life (ICI‐Q short form UI score at 1 year) Show forest plot | 1 | Mean Difference (IV, Fixed, 95% CI) | Totals not selected | |
| 23.1 Vypro vs Ultrapro | 1 | Mean Difference (IV, Fixed, 95% CI) | 0.0 [0.0, 0.0] | |
| 23.2 Vypro vs Prolene light | 1 | Mean Difference (IV, Fixed, 95% CI) | 0.0 [0.0, 0.0] | |
| 23.3 Ultrapro vs Prolene light | 1 | Mean Difference (IV, Fixed, 95% CI) | 0.0 [0.0, 0.0] | |
| 24 Condition‐specific measures to assess quality of life (ICI‐Q short form UI score at 1 to 5 years) Show forest plot | 1 | Mean Difference (IV, Fixed, 95% CI) | Totals not selected | |
| 24.1 Vypro vs Ultrapro | 1 | Mean Difference (IV, Fixed, 95% CI) | 0.0 [0.0, 0.0] | |
| 24.2 Vypro vs Prolene light | 1 | Mean Difference (IV, Fixed, 95% CI) | 0.0 [0.0, 0.0] | |
| 24.3 Ultrapro vs Prolene light | 1 | Mean Difference (IV, Fixed, 95% CI) | 0.0 [0.0, 0.0] | |