Traditional suburethral sling operations for urinary incontinence in women
Information
- DOI:
- https://doi.org/10.1002/14651858.CD001754.pub5Copy DOI

- Database:
-
- Cochrane Database of Systematic Reviews
- Version published:
-
- 28 January 2020see what's new
- Type:
-
- Intervention
- Stage:
-
- Review
- Cochrane Editorial Group:
-
Cochrane Incontinence Group
- Copyright:
-
- Copyright © 2020 The Cochrane Collaboration. Published by John Wiley & Sons, Ltd.
Article metrics
Altmetric:
Cited by:
Authors
Contributions of authors
LS and CG updated the protocol and conducted the update of the review including screening, data abstraction, and updating of results and discussion. MO analysed and interpreted the results, assessed the quality of evidence (with LS), wrote the first draft of the abstract and plain language summary, and critically revised other sections of the review. HR updated a previous version of the review and contributed to this update by screening abstracts and commenting on the results, with assistance provided by JDC. PA conducted the brief economic commentary. All review authors contributed to writing the review.
Sources of support
Internal sources
-
No sources of support supplied
External sources
-
The National Institute for Health Research (NIHR), UK.
This project was supported by the National Institute for Health Research, via Cochrane Infrastructure, Cochrane Programme Grant, or Cochrane Incentive funding to Cochrane Incontinence. The views and opinions expressed therein are those of the authors and do not necessarily reflect those of the Systematic Reviews Programme, NIHR, NHS, or the Department of Health. The NIHR is the single largest funder of Cochrane Incontinence.
Declarations of interest
LS: none known.
HR: none known.
MIO: none known.
JDC: none known.
PA: none known.
CG: none known.
Acknowledgements
We are grateful to Adrian Grant, Jonathan Cook, Aldemar Araujo Castro, and several anonymous peer‐referees for assistance and valuable comments on this and previous versions of the review. Sheila Wallace provided support for each version of the review as well as for this update and in the classification and identification of new studies. Fiona Stewart assisted with rewriting the effects of interventions section, conversion of incontinence to continence outcomes, and related changes in 'Summary of findings' tables.
The review was originally conceived and conducted by Carlos CB Bezerra and Homero Bruschini.
An earlier version of this review was completed as part of a project to add brief economic commentaries to Cochrane Incontinence's Reviews on surgery for urinary incontinence in women (Dean 2017). This project was supported by the National Institute for Health Research (NIHR) via the Cochrane Review Incentive Scheme 2016.
Version history
| Published | Title | Stage | Authors | Version |
| 2020 Jan 28 | Traditional suburethral sling operations for urinary incontinence in women | Review | Lucky Saraswat, Haroon Rehman, Muhammad Imran Omar, June D Cody, Patricia Aluko, Cathryn MA Glazener | |
| 2017 Jul 26 | Traditional suburethral sling operations for urinary incontinence in women | Review | Haroon Rehman, Carlos A Bezerra, Homero Bruschini, June D Cody, Patricia Aluko | |
| 2011 Jan 19 | Traditional suburethral sling operations for urinary incontinence in women | Review | Haroon Rehman, Carlos CB Bezerra, Homero Bruschini, June D Cody | |
| 2005 Jul 20 | Traditional suburethral sling operations for urinary incontinence in women | Review | Carlos CB Bezerra, Homero Bruschini, June D Cody | |
| 2001 Jul 23 | Suburethral sling operations for urinary incontinence in women | Review | Carlos CB Bezerra, Homero Bruschini, D J Cody, June D Cody | |
Differences between protocol and review
For this update, published in 2020, the following changes were made.
-
New comparison was added: traditional suburethral sling operation versus a single‐incision sling (mini‐sling). The mini‐sling is a new procedure for surgical treatment of women with SUI, which differs significantly from the mid‐urethral sling technique and is considered to be less invasive.
-
Two new subgroup analyses were specified: primary versus recurrent SUI, and presence or absence of prolapse. These factors might be expected to affect the outcome and choice of surgery. We wished to explore whether different interventions had differential effects among women with these different clinical characteristics.
-
Outcome measures were re‐defined: primary outcomes were re‐defined as numbers of continent (dry) women using any definition of urinary incontinence and the need for repeat continence surgery. An additional outcome of 'cure' as reported by women was added.
-
We adopted the GRADE method for assessing the quality of evidence for those outcomes included in the 'Summary of findings' tables.
-
A brief economic commentary was added.
Keywords
MeSH
Medical Subject Headings (MeSH) Keywords
Medical Subject Headings Check Words
Female; Humans;
PICOs

PRISMA study flow diagram ‐ search for clinical effectiveness studies.

PRISMA study flow diagram ‐ search for economic evaluations for the BEC.
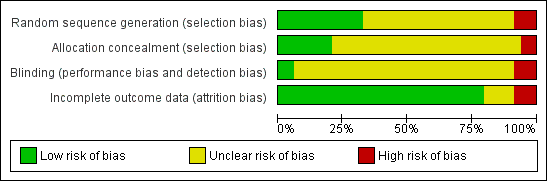
Risk of bias graph: review authors' judgements about each risk of bias item presented as percentages across all included studies.

Risk of bias summary: review authors' judgements about each risk of bias item for each included study.

Comparison 3 Traditional suburethral sling operation versus drugs, Outcome 1 Number of continent women within 1 year (any definition).

Comparison 3 Traditional suburethral sling operation versus drugs, Outcome 2 Urge urinary symptoms, urgency urinary incontinence.

Comparison 4 Traditional suburethral sling operation versus injectables, Outcome 1 Number of continent women within 1 year (any definition).

Comparison 4 Traditional suburethral sling operation versus injectables, Outcome 2 Number of continent women at 1 to 5 years (any definition).

Comparison 4 Traditional suburethral sling operation versus injectables, Outcome 3 Repeat surgery for urinary incontinence.

Comparison 4 Traditional suburethral sling operation versus injectables, Outcome 4 Number of women cured after first year (women's observations).

Comparison 4 Traditional suburethral sling operation versus injectables, Outcome 5 Number of women satisfied (women's observations).

Comparison 4 Traditional suburethral sling operation versus injectables, Outcome 6 Number of women with urinary incontinence within first year (clinician's observations).

Comparison 4 Traditional suburethral sling operation versus injectables, Outcome 7 Urinary tract infection.

Comparison 4 Traditional suburethral sling operation versus injectables, Outcome 8 De novo detrusor overactivity (urodynamic diagnosis).

Comparison 4 Traditional suburethral sling operation versus injectables, Outcome 9 Voiding dysfunction.

Comparison 6 Traditional suburethral sling operation versus bladder neck needle suspension (abdominal and vaginal), Outcome 1 Number of continent women within 1 year (any definition).

Comparison 6 Traditional suburethral sling operation versus bladder neck needle suspension (abdominal and vaginal), Outcome 2 Number of continent women at 1 to 5 years (any definition).

Comparison 6 Traditional suburethral sling operation versus bladder neck needle suspension (abdominal and vaginal), Outcome 3 CURE: number of women cured after first year (women's observations).

Comparison 6 Traditional suburethral sling operation versus bladder neck needle suspension (abdominal and vaginal), Outcome 4 Length of hospital stay (hours).

Comparison 6 Traditional suburethral sling operation versus bladder neck needle suspension (abdominal and vaginal), Outcome 5 Perioperative surgical complications.

Comparison 6 Traditional suburethral sling operation versus bladder neck needle suspension (abdominal and vaginal), Outcome 6 Urinary urgency symptoms, urgency urinary incontinence.

Comparison 6 Traditional suburethral sling operation versus bladder neck needle suspension (abdominal and vaginal), Outcome 7 Detrusor overactivity (urodynamic diagnosis).

Comparison 6 Traditional suburethral sling operation versus bladder neck needle suspension (abdominal and vaginal), Outcome 8 Voiding dysfunction after 3 months.

Comparison 7 Traditional suburethral sling operation versus open abdominal retropubic colposuspension, Outcome 1 Number of continent women within 1 year (any definition).

Comparison 7 Traditional suburethral sling operation versus open abdominal retropubic colposuspension, Outcome 2 Number of continent women at 1 to 5 years (any definition).

Comparison 7 Traditional suburethral sling operation versus open abdominal retropubic colposuspension, Outcome 3 Number of continent women after 5 years (any definition).

Comparison 7 Traditional suburethral sling operation versus open abdominal retropubic colposuspension, Outcome 4 Repeat surgery for urinary incontinence.

Comparison 7 Traditional suburethral sling operation versus open abdominal retropubic colposuspension, Outcome 5 Number of women cured after first year (women's observations).

Comparison 7 Traditional suburethral sling operation versus open abdominal retropubic colposuspension, Outcome 6 Number of women satisfied (women's observations).

Comparison 7 Traditional suburethral sling operation versus open abdominal retropubic colposuspension, Outcome 8 Number of women with urinary incontinence at 1 to 5 years (clinician's observations).

Comparison 7 Traditional suburethral sling operation versus open abdominal retropubic colposuspension, Outcome 9 Number of women with urinary incontinence after 5 years (clinician's observations).

Comparison 7 Traditional suburethral sling operation versus open abdominal retropubic colposuspension, Outcome 10 Duration of operation (minutes).

Comparison 7 Traditional suburethral sling operation versus open abdominal retropubic colposuspension, Outcome 11 Length of hospital stay (days).

Comparison 7 Traditional suburethral sling operation versus open abdominal retropubic colposuspension, Outcome 12 Time to catheter removal (days).

Comparison 7 Traditional suburethral sling operation versus open abdominal retropubic colposuspension, Outcome 14 Number of women requiring treatment for pelvic organ prolapse.

Comparison 7 Traditional suburethral sling operation versus open abdominal retropubic colposuspension, Outcome 15 Perioperative surgical complications.

Comparison 7 Traditional suburethral sling operation versus open abdominal retropubic colposuspension, Outcome 16 Bladder perforation.

Comparison 7 Traditional suburethral sling operation versus open abdominal retropubic colposuspension, Outcome 17 Urinary tract infection.

Comparison 7 Traditional suburethral sling operation versus open abdominal retropubic colposuspension, Outcome 18 Number of women with recurrent UTIs at > 5 years.

Comparison 7 Traditional suburethral sling operation versus open abdominal retropubic colposuspension, Outcome 19 Urinary urgency symptoms, urgency urinary incontinence.

Comparison 7 Traditional suburethral sling operation versus open abdominal retropubic colposuspension, Outcome 20 Detrusor overactivity (urodynamic diagnosis).

Comparison 7 Traditional suburethral sling operation versus open abdominal retropubic colposuspension, Outcome 21 Voiding dysfunction after 3 months.

Comparison 7 Traditional suburethral sling operation versus open abdominal retropubic colposuspension, Outcome 22 Long‐term voiding dysfunction > 5 years.

Comparison 7 Traditional suburethral sling operation versus open abdominal retropubic colposuspension, Outcome 23 Condition‐specific measures to assess quality of life.

Comparison 9 Traditional suburethral sling operation versus mid‐urethral sling or tape, Outcome 1 Number of continent women within 1 year (any definition).

Comparison 9 Traditional suburethral sling operation versus mid‐urethral sling or tape, Outcome 2 Number of continent women at 1 to 5 years (any definition).

Comparison 9 Traditional suburethral sling operation versus mid‐urethral sling or tape, Outcome 3 Number of continent women after 5 years (any definition).

Comparison 9 Traditional suburethral sling operation versus mid‐urethral sling or tape, Outcome 4 Repeat surgery for urinary incontinence.

Comparison 9 Traditional suburethral sling operation versus mid‐urethral sling or tape, Outcome 5 Number of women cured after first year (women's observations).

Comparison 9 Traditional suburethral sling operation versus mid‐urethral sling or tape, Outcome 6 Number of women improved or cured within 1 year (women's observations).

Comparison 9 Traditional suburethral sling operation versus mid‐urethral sling or tape, Outcome 7 Number of women improved or cured at 1 to 5 years (women's observations).

Comparison 9 Traditional suburethral sling operation versus mid‐urethral sling or tape, Outcome 8 Number of women improved or cured after 5 years (women's observations).

Comparison 9 Traditional suburethral sling operation versus mid‐urethral sling or tape, Outcome 9 Number of women satisfied (women's observations).

Comparison 9 Traditional suburethral sling operation versus mid‐urethral sling or tape, Outcome 10 Pad test of quantified leakage (mean weight of urine lost).

Comparison 9 Traditional suburethral sling operation versus mid‐urethral sling or tape, Outcome 11 Number of women with urinary incontinence within first year (clinician's observations).

Comparison 9 Traditional suburethral sling operation versus mid‐urethral sling or tape, Outcome 12 Number of women with urinary incontinence at 1 to 5 years (any definition) (clinician's observations).

Comparison 9 Traditional suburethral sling operation versus mid‐urethral sling or tape, Outcome 13 Duration of operation (minutes).

Comparison 9 Traditional suburethral sling operation versus mid‐urethral sling or tape, Outcome 14 Length of hospital stay (days).

Comparison 9 Traditional suburethral sling operation versus mid‐urethral sling or tape, Outcome 15 Time to catheter removal (days).

Comparison 9 Traditional suburethral sling operation versus mid‐urethral sling or tape, Outcome 16 Perioperative surgical complications.

Comparison 9 Traditional suburethral sling operation versus mid‐urethral sling or tape, Outcome 17 Bladder perforations.

Comparison 9 Traditional suburethral sling operation versus mid‐urethral sling or tape, Outcome 18 Urethral injury.

Comparison 9 Traditional suburethral sling operation versus mid‐urethral sling or tape, Outcome 19 Vaginal bleeding.

Comparison 9 Traditional suburethral sling operation versus mid‐urethral sling or tape, Outcome 20 Urinary tract infection.

Comparison 9 Traditional suburethral sling operation versus mid‐urethral sling or tape, Outcome 21 Voiding dysfunction.

Comparison 9 Traditional suburethral sling operation versus mid‐urethral sling or tape, Outcome 22 Urinary urgency symptoms, urgency urinary incontinence.

Comparison 9 Traditional suburethral sling operation versus mid‐urethral sling or tape, Outcome 23 De novo detrusor overactivity (urodynamic diagnosis).

Comparison 9 Traditional suburethral sling operation versus mid‐urethral sling or tape, Outcome 24 Long‐term adverse effects (release of sling required).

Comparison 9 Traditional suburethral sling operation versus mid‐urethral sling or tape, Outcome 25 Long‐term adverse effects (wound pain at 6 months).

Comparison 9 Traditional suburethral sling operation versus mid‐urethral sling or tape, Outcome 26 Long‐term adverse effects (vaginal mesh or graft exposure).

Comparison 9 Traditional suburethral sling operation versus mid‐urethral sling or tape, Outcome 27 Condition‐specific measures to assess quality of life: UDI‐6.

Comparison 9 Traditional suburethral sling operation versus mid‐urethral sling or tape, Outcome 28 Condition‐specific measures to assess quality of life: IIQ‐7.

Comparison 10 Traditional suburethral sling operation versus a single‐incision sling (mini‐sling), Outcome 1 Number of continent women at 1 to 5 years (any definition).

Comparison 10 Traditional suburethral sling operation versus a single‐incision sling (mini‐sling), Outcome 2 Number of women cured after first year (women's observations).

Comparison 10 Traditional suburethral sling operation versus a single‐incision sling (mini‐sling), Outcome 3 Number of women satisfied (women's observations).

Comparison 10 Traditional suburethral sling operation versus a single‐incision sling (mini‐sling), Outcome 4 Number of women with urinary incontinence (clinician's observations) within first year.

Comparison 10 Traditional suburethral sling operation versus a single‐incision sling (mini‐sling), Outcome 5 Bladder perforation.

Comparison 10 Traditional suburethral sling operation versus a single‐incision sling (mini‐sling), Outcome 6 Urinary urgency symptoms, urgency urinary incontinence.

Comparison 10 Traditional suburethral sling operation versus a single‐incision sling (mini‐sling), Outcome 7 Pain with intercourse (dyspareunia).

Comparison 10 Traditional suburethral sling operation versus a single‐incision sling (mini‐sling), Outcome 8 Long‐term adverse effects (vaginal mesh or graft exposure).

Comparison 10 Traditional suburethral sling operation versus a single‐incision sling (mini‐sling), Outcome 9 Condition‐specific measures to assess quality of life: IIQ score.

Comparison 11 One type of traditional sling operation versus another type of traditional sling operation, Outcome 1 Number of continent women within 1 year (any definition).

Comparison 11 One type of traditional sling operation versus another type of traditional sling operation, Outcome 2 Number of continent women at 1 to 5 years (any definition).

Comparison 11 One type of traditional sling operation versus another type of traditional sling operation, Outcome 3 Number of continent women after 5 years (any definition).

Comparison 11 One type of traditional sling operation versus another type of traditional sling operation, Outcome 4 Repeat surgery for urinary incontinence.

Comparison 11 One type of traditional sling operation versus another type of traditional sling operation, Outcome 5 Number of women cured after first year (women's observations).

Comparison 11 One type of traditional sling operation versus another type of traditional sling operation, Outcome 6 Number of women improved or cured within first year (women's observations).

Comparison 11 One type of traditional sling operation versus another type of traditional sling operation, Outcome 7 Number of women improved or cured at 1 to 5 years (women's observations).

Comparison 11 One type of traditional sling operation versus another type of traditional sling operation, Outcome 8 Number of women satisfied (women's observations).

Comparison 11 One type of traditional sling operation versus another type of traditional sling operation, Outcome 9 Pad test of quantified leakage (mean weight of urine lost) within 1 year.

Comparison 11 One type of traditional sling operation versus another type of traditional sling operation, Outcome 10 Pad test of quantified leakage (mean weight of urine lost) at 1 to 5 years.

Comparison 11 One type of traditional sling operation versus another type of traditional sling operation, Outcome 11 Duration of operation (minutes).

Comparison 11 One type of traditional sling operation versus another type of traditional sling operation, Outcome 12 Blood loss (mL).

Comparison 11 One type of traditional sling operation versus another type of traditional sling operation, Outcome 13 Length of hospital stay (days).

Comparison 11 One type of traditional sling operation versus another type of traditional sling operation, Outcome 14 Perioperative surgical complications.

Comparison 11 One type of traditional sling operation versus another type of traditional sling operation, Outcome 15 Bladder perforation.

Comparison 11 One type of traditional sling operation versus another type of traditional sling operation, Outcome 16 Urinary tract infection.

Comparison 11 One type of traditional sling operation versus another type of traditional sling operation, Outcome 17 Vaginal bleeding.

Comparison 11 One type of traditional sling operation versus another type of traditional sling operation, Outcome 18 Long‐term adverse effects (wound pain).

Comparison 11 One type of traditional sling operation versus another type of traditional sling operation, Outcome 19 Voiding dysfunction.

Comparison 11 One type of traditional sling operation versus another type of traditional sling operation, Outcome 20 Urinary urgency symptoms, urgency urinary incontinence.

Comparison 11 One type of traditional sling operation versus another type of traditional sling operation, Outcome 21 Detrusor overactivity (urodynamic overactivity).

Comparison 11 One type of traditional sling operation versus another type of traditional sling operation, Outcome 22 Long‐term adverse effects (release of sling required).

Comparison 11 One type of traditional sling operation versus another type of traditional sling operation, Outcome 23 Long‐term adverse effects (vaginal mesh or graft exposure).

Comparison 11 One type of traditional sling operation versus another type of traditional sling operation, Outcome 24 Condition‐specific measures to assess quality of life (ICI‐Q short form UI score at 1 year).

Comparison 11 One type of traditional sling operation versus another type of traditional sling operation, Outcome 25 Condition‐specific measures to assess quality of life (ICI‐Q short form UI score at 1 to 5 years).

Comparison 12 Traditional suburethral sling operation versus drugs, Outcome 1 Number of women with urinary incontinence (worse, unchanged, or improved) within first year (women's observations).

Comparison 12 Traditional suburethral sling operation versus drugs, Outcome 2 Urge urinary symptoms, urgency urinary incontinence.

Comparison 13 Traditional suburethral sling operation versus injectables, Outcome 1 Number of women with urinary incontinence (worse, unchanged, or improved) within first year (women's observations).

Comparison 13 Traditional suburethral sling operation versus injectables, Outcome 2 Number of women with urinary incontinence (worse, unchanged, or improved) after first year (women's observations).

Comparison 13 Traditional suburethral sling operation versus injectables, Outcome 3 Number of women with urinary incontinence (clinician's observations) within first year.

Comparison 13 Traditional suburethral sling operation versus injectables, Outcome 4 CURE: number of women cured after first year (women's observations).

Comparison 13 Traditional suburethral sling operation versus injectables, Outcome 5 Voiding dysfunction.

Comparison 13 Traditional suburethral sling operation versus injectables, Outcome 6 De novo detrusor overactivity (urodynamic diagnosis).

Comparison 13 Traditional suburethral sling operation versus injectables, Outcome 7 Urinary tract infection.

Comparison 13 Traditional suburethral sling operation versus injectables, Outcome 8 Repeat surgery for urinary incontinence.

Comparison 14 Traditional suburethral sling operation versus bladder neck needle suspension (abdominal and vaginal), Outcome 1 Number with incontinence (worse, unchanged, or improved) within first year (women's observations).

Comparison 14 Traditional suburethral sling operation versus bladder neck needle suspension (abdominal and vaginal), Outcome 2 Number with incontinence (worse, unchanged, or improved) after first year (women's observations).

Comparison 14 Traditional suburethral sling operation versus bladder neck needle suspension (abdominal and vaginal), Outcome 3 CURE: number of women cured after first year (women's observations).

Comparison 14 Traditional suburethral sling operation versus bladder neck needle suspension (abdominal and vaginal), Outcome 4 Length of hospital stay (hours).

Comparison 14 Traditional suburethral sling operation versus bladder neck needle suspension (abdominal and vaginal), Outcome 5 Perioperative surgical complications.

Comparison 14 Traditional suburethral sling operation versus bladder neck needle suspension (abdominal and vaginal), Outcome 6 Urge urinary symptoms, urgency urinary incontinence.

Comparison 14 Traditional suburethral sling operation versus bladder neck needle suspension (abdominal and vaginal), Outcome 7 Voiding dysfunction after 3 months.

Comparison 14 Traditional suburethral sling operation versus bladder neck needle suspension (abdominal and vaginal), Outcome 8 Detrusor overactivity (urodynamic diagnosis).

Comparison 15 Traditional suburethral sling operation versus open abdominal retropubic colposuspension, Outcome 1 Number of women with urinary incontinence (worse, unchanged, or improved) within first year (women's observations).

Comparison 15 Traditional suburethral sling operation versus open abdominal retropubic colposuspension, Outcome 3 Number of women with urinary incontinence (worse, unchanged, or improved) at 1 to 5 years (women's observations).

Comparison 15 Traditional suburethral sling operation versus open abdominal retropubic colposuspension, Outcome 5 Number of women with urinary incontinence (worse, unchanged, or improved) at > 5 years (women's observations).

Comparison 15 Traditional suburethral sling operation versus open abdominal retropubic colposuspension, Outcome 6 CURE: number of women cured at > 1 year (women's observations).

Comparison 15 Traditional suburethral sling operation versus open abdominal retropubic colposuspension, Outcome 7 Number of women not satisfied at > 5 years.

Comparison 15 Traditional suburethral sling operation versus open abdominal retropubic colposuspension, Outcome 10 Number of women with urinary incontinence (clinician's observations) at 1 to 5 years.

Comparison 15 Traditional suburethral sling operation versus open abdominal retropubic colposuspension, Outcome 11 Number of women with urinary incontinence (clinician's observations) at > 5 years.

Comparison 15 Traditional suburethral sling operation versus open abdominal retropubic colposuspension, Outcome 12 Duration of operation (minutes).

Comparison 15 Traditional suburethral sling operation versus open abdominal retropubic colposuspension, Outcome 13 Time to catheter removal (days).

Comparison 15 Traditional suburethral sling operation versus open abdominal retropubic colposuspension, Outcome 14 Length of hospital stay (days).

Comparison 15 Traditional suburethral sling operation versus open abdominal retropubic colposuspension, Outcome 16 Perioperative surgical complications.

Comparison 15 Traditional suburethral sling operation versus open abdominal retropubic colposuspension, Outcome 17 Bladder perforation.

Comparison 15 Traditional suburethral sling operation versus open abdominal retropubic colposuspension, Outcome 18 Urinary tract infection.

Comparison 15 Traditional suburethral sling operation versus open abdominal retropubic colposuspension, Outcome 19 Number of women with recurrent UTIs at > 5 years.

Comparison 15 Traditional suburethral sling operation versus open abdominal retropubic colposuspension, Outcome 20 Urge urinary symptoms, urgency urinary incontinence.

Comparison 15 Traditional suburethral sling operation versus open abdominal retropubic colposuspension, Outcome 21 Detrusor overactivity (urodynamic diagnosis).

Comparison 15 Traditional suburethral sling operation versus open abdominal retropubic colposuspension, Outcome 22 Voiding dysfunction after 3 months.

Comparison 15 Traditional suburethral sling operation versus open abdominal retropubic colposuspension, Outcome 23 Long‐term voiding dysfunction > 5 years.

Comparison 15 Traditional suburethral sling operation versus open abdominal retropubic colposuspension, Outcome 24 Number of women requiring treatment for pelvic organ prolapse.

Comparison 15 Traditional suburethral sling operation versus open abdominal retropubic colposuspension, Outcome 25 Repeat surgery for urinary incontinence.

Comparison 15 Traditional suburethral sling operation versus open abdominal retropubic colposuspension, Outcome 26 Condition‐specific measures to assess quality of life.

Comparison 16 Traditional suburethral sling operation versus a mid‐urethral sling or tape, Outcome 1 Number of women with urinary incontinence (worse, unchanged, or improved) within first year (women's observations).

Comparison 16 Traditional suburethral sling operation versus a mid‐urethral sling or tape, Outcome 2 Number not improved (worse or unchanged) within first year (women's observations).

Comparison 16 Traditional suburethral sling operation versus a mid‐urethral sling or tape, Outcome 3 Number of women with urinary incontinence (worse, unchanged, or improved) at 1 to 5 years (women's observations).

Comparison 16 Traditional suburethral sling operation versus a mid‐urethral sling or tape, Outcome 4 Number not improved (worse or unchanged) after first year (women's observations).

Comparison 16 Traditional suburethral sling operation versus a mid‐urethral sling or tape, Outcome 5 Number of women with urinary incontinence after 5 years (women's observations).

Comparison 16 Traditional suburethral sling operation versus a mid‐urethral sling or tape, Outcome 6 Number with incontinence not improved after 5 years (women's observations).

Comparison 16 Traditional suburethral sling operation versus a mid‐urethral sling or tape, Outcome 7 CURE: number of women cured at > 1 year (women's observations).

Comparison 16 Traditional suburethral sling operation versus a mid‐urethral sling or tape, Outcome 8 Repeat surgery for urinary incontinence.

Comparison 16 Traditional suburethral sling operation versus a mid‐urethral sling or tape, Outcome 9 Number of women not satisfied.

Comparison 16 Traditional suburethral sling operation versus a mid‐urethral sling or tape, Outcome 10 Pad test of quantified leakage (mean weight of urine loss).

Comparison 16 Traditional suburethral sling operation versus a mid‐urethral sling or tape, Outcome 11 Number of women with urinary incontinence (clinician's observations) within first year.

Comparison 16 Traditional suburethral sling operation versus a mid‐urethral sling or tape, Outcome 12 Number of women with urinary incontinence (clinician's observations) after first year.

Comparison 16 Traditional suburethral sling operation versus a mid‐urethral sling or tape, Outcome 13 Duration of operation (minutes).

Comparison 16 Traditional suburethral sling operation versus a mid‐urethral sling or tape, Outcome 14 Length of hospital stay (days).

Comparison 16 Traditional suburethral sling operation versus a mid‐urethral sling or tape, Outcome 15 Time to catheter removal (days).

Comparison 16 Traditional suburethral sling operation versus a mid‐urethral sling or tape, Outcome 16 Perioperative surgical complications.

Comparison 16 Traditional suburethral sling operation versus a mid‐urethral sling or tape, Outcome 17 Bladder perforations.

Comparison 16 Traditional suburethral sling operation versus a mid‐urethral sling or tape, Outcome 18 Urethral injury.

Comparison 16 Traditional suburethral sling operation versus a mid‐urethral sling or tape, Outcome 19 Vaginal bleeding.

Comparison 16 Traditional suburethral sling operation versus a mid‐urethral sling or tape, Outcome 20 Urinary tract infection.

Comparison 16 Traditional suburethral sling operation versus a mid‐urethral sling or tape, Outcome 21 Voiding dysfunction.

Comparison 16 Traditional suburethral sling operation versus a mid‐urethral sling or tape, Outcome 22 De novo detrusor urgency or urge symptoms.

Comparison 16 Traditional suburethral sling operation versus a mid‐urethral sling or tape, Outcome 23 De novo detrusor overactivity (urodynamic diagnosis).

Comparison 16 Traditional suburethral sling operation versus a mid‐urethral sling or tape, Outcome 24 Long‐term adverse effects (release of sling required).

Comparison 16 Traditional suburethral sling operation versus a mid‐urethral sling or tape, Outcome 25 Long‐term adverse effects (wound pain at 6 months).

Comparison 16 Traditional suburethral sling operation versus a mid‐urethral sling or tape, Outcome 26 Long‐term adverse effects (vaginal mesh or graft exposure).

Comparison 16 Traditional suburethral sling operation versus a mid‐urethral sling or tape, Outcome 27 Condition‐specific measures to assess quality of life: UDI‐6.

Comparison 16 Traditional suburethral sling operation versus a mid‐urethral sling or tape, Outcome 28 Condition‐specific measures to assess quality of life: IIQ‐7.

Comparison 17 Traditional suburethral sling operation versus a single‐incision sling (mini‐sling), Outcome 1 Number of women with urinary incontinence in the medium term (1 to 5 years).

Comparison 17 Traditional suburethral sling operation versus a single‐incision sling (mini‐sling), Outcome 2 Number of women not satisfied within first year.

Comparison 17 Traditional suburethral sling operation versus a single‐incision sling (mini‐sling), Outcome 3 Number of women with urinary incontinence (clinician's observations) within first year.

Comparison 17 Traditional suburethral sling operation versus a single‐incision sling (mini‐sling), Outcome 4 CURE: number of women cured at > 1 year (women's observations).

Comparison 17 Traditional suburethral sling operation versus a single‐incision sling (mini‐sling), Outcome 5 Bladder perforation.

Comparison 17 Traditional suburethral sling operation versus a single‐incision sling (mini‐sling), Outcome 6 Urge urinary symptoms, urgency urinary incontinence.

Comparison 17 Traditional suburethral sling operation versus a single‐incision sling (mini‐sling), Outcome 7 Pain with intercourse (dyspareunia).

Comparison 17 Traditional suburethral sling operation versus a single‐incision sling (mini‐sling), Outcome 8 Long‐term adverse effects (vaginal mesh or graft exposure).

Comparison 17 Traditional suburethral sling operation versus a single‐incision sling (mini‐sling), Outcome 9 Condition‐specific measures to assess quality of life: IIQ score.

Comparison 18 One type of traditional sling operation versus another type of traditional sling operation, Outcome 1 Number of women with urinary incontinence (worse, unchanged, or improved) within first year (women's observations).

Comparison 18 One type of traditional sling operation versus another type of traditional sling operation, Outcome 2 Number not improved (worse or unchanged) within first year (women's observations).

Comparison 18 One type of traditional sling operation versus another type of traditional sling operation, Outcome 3 Number of women with urinary incontinence (worse, unchanged, or improved) at 1 to 5 years (women's observations).

Comparison 18 One type of traditional sling operation versus another type of traditional sling operation, Outcome 4 Number not improved (worse or unchanged) after first year (women's observations).

Comparison 18 One type of traditional sling operation versus another type of traditional sling operation, Outcome 5 Number of women with urinary incontinence (worse, unchanged, or improved) after 5 years (women's observations).

Comparison 18 One type of traditional sling operation versus another type of traditional sling operation, Outcome 6 CURE: number of women with urinary incontinence > 1 year (women's observations).

Comparison 18 One type of traditional sling operation versus another type of traditional sling operation, Outcome 7 Number of women not satisfied.

Comparison 18 One type of traditional sling operation versus another type of traditional sling operation, Outcome 8 Pad test of quantified leakage (mean weight of urine loss) at 1 year.

Comparison 18 One type of traditional sling operation versus another type of traditional sling operation, Outcome 9 Pad test of quantified leakage (mean weight of urine loss) at 1 to 5 years.

Comparison 18 One type of traditional sling operation versus another type of traditional sling operation, Outcome 10 Duration of operation (minutes).

Comparison 18 One type of traditional sling operation versus another type of traditional sling operation, Outcome 11 Blood loss (mL).

Comparison 18 One type of traditional sling operation versus another type of traditional sling operation, Outcome 12 Length of hospital stay (days).

Comparison 18 One type of traditional sling operation versus another type of traditional sling operation, Outcome 13 Perioperative surgical complications.

Comparison 18 One type of traditional sling operation versus another type of traditional sling operation, Outcome 14 Bladder perforation.

Comparison 18 One type of traditional sling operation versus another type of traditional sling operation, Outcome 15 Urinary tract infection.

Comparison 18 One type of traditional sling operation versus another type of traditional sling operation, Outcome 16 Vaginal bleeding.

Comparison 18 One type of traditional sling operation versus another type of traditional sling operation, Outcome 17 Long‐term adverse effects (wound pain).

Comparison 18 One type of traditional sling operation versus another type of traditional sling operation, Outcome 18 Voiding dysfunction.

Comparison 18 One type of traditional sling operation versus another type of traditional sling operation, Outcome 19 Long‐term adverse effects (release of sling required).

Comparison 18 One type of traditional sling operation versus another type of traditional sling operation, Outcome 20 De novo detrusor urgency or urge symptoms or detrusor overactivity.

Comparison 18 One type of traditional sling operation versus another type of traditional sling operation, Outcome 21 Repeat surgery for urinary incontinence at first year.

Comparison 18 One type of traditional sling operation versus another type of traditional sling operation, Outcome 22 Long‐term adverse effects (vaginal mesh or graft exposure).

Comparison 18 One type of traditional sling operation versus another type of traditional sling operation, Outcome 23 Condition‐specific measures to assess quality of life (ICI‐Q short form UI score at 1 year).

Comparison 18 One type of traditional sling operation versus another type of traditional sling operation, Outcome 24 Condition‐specific measures to assess quality of life (ICI‐Q short form UI score at 1 to 5 years).
| Traditional suburethral sling operation versus no treatment or sham operation | ||||||
| Patient or population: women with urinary incontinence | ||||||
| Outcomes | Illustrative comparative risks* (95% CI) | Relative effect | Number of participants | Quality of the evidence | Comments | |
| Assumed risk | Corresponding risk | |||||
| No treatment or sham treatment | Sling | |||||
| Number of continent (dry) women (any definition) in the medium term (1 to 5 years) | Not reported | |||||
| Repeat surgery for urinary incontinence | Not reported | |||||
| Perioperative surgical complications | Not reported | |||||
| Long‐term adverse effects | Not reported | |||||
| Condition‐specific quality of life | Not reported | |||||
| *The basis for the assumed risk (e.g. the median control group risk across studies) is provided in footnotes. The corresponding risk (and its 95% confidence interval) is based on the assumed risk in the comparison group and the relative effect of the intervention (and its 95% CI). | ||||||
| GRADE Working Group grades of evidence. | ||||||
| Traditional suburethral sling operation versus conservative management | ||||||
| Patient or population: women with urinary incontinence | ||||||
| Outcomes | Illustrative comparative risks* (95% CI) | Relative effect | Number of participants | Quality of the evidence | Comments | |
| Assumed risk | Corresponding risk | |||||
| Conservative treatment | Sling | |||||
| Number of continent (dry) women (any definition) in the medium term (1 to 5 years) | Not reported | |||||
| Repeat surgery for urinary incontinence | Not reported | |||||
| Perioperative surgical complications | Not reported | |||||
| Long‐term adverse effects | Not reported | |||||
| Condition‐specific quality of life | Not reported | |||||
| *The basis for the assumed risk (e.g. the median control group risk across studies) is provided in footnotes. The corresponding risk (and its 95% confidence interval) is based on the assumed risk in the comparison group and the relative effect of the intervention (and its 95% CI). | ||||||
| GRADE Working Group grades of evidence. | ||||||
| Traditional suburethral sling operation versus drugs | ||||||
| Patient or population: women with urinary incontinence | ||||||
| Outcomes | Illustrative comparative risks* (95% CI) | Relative effect | Number of participants | Quality of the evidence | Comments | |
| Assumed risk | Corresponding risk | |||||
| Drugs | Sling | |||||
| Number of continent (dry) women (any definition) in the medium term (1 to 5 years) | Not reported | |||||
| Repeat surgery for urinary incontinence | Not reported | |||||
| Perioperative surgical complications | Not reported | |||||
| Long‐term adverse effects | Not reported | |||||
| Condition‐specific quality of life | Not reported | |||||
| *The basis for the assumed risk (e.g. the median control group risk across studies) is provided in footnotes. The corresponding risk (and its 95% confidence interval) is based on the assumed risk in the comparison group and the relative effect of the intervention (and its 95% CI). | ||||||
| GRADE Working Group grades of evidence. | ||||||
| Traditional suburethral sling operation versus injectables | ||||||
| Patient or population: women with urinary incontinence | ||||||
| Outcomes | Illustrative comparative risks* (95% CI) | Relative effect | Number of participants | Quality of the evidence | Comments | |
| Assumed risk | Corresponding risk | |||||
| Injectable | Sling | |||||
| Number of continent (dry) women (any definition) in the medium term (1 to 5 years) | 714 per 1000 | 967 per 1000 (583 to 998) | OR 11.57 (0.56 to 239.7) | 43 | ⊕⊝⊝⊝ | 252 more women, per 1000, with traditional sling (131 fewer to 284 more) |
| Repeat surgery for urinary incontinence ‐ urodynamic stress incontinence (only) | 91 per 1000 | 47 per 1000 (5 to 487) | RR 0.52 (0.05 to 5.36) | 43 | ⊕⊝⊝⊝ | 44 fewer women, per 1000, with traditional sling (86 fewer to 396 more) |
| Perioperative surgical complications | 91 per 1000 | 143 per 1000 | RR 1.57 | 43 | ⊕⊝⊝⊝ | 52 more women, per 1000, with traditional sling (65 fewer to 681 more) |
| Long‐term adverse effects | Not reported | |||||
| Condition‐specific quality of life | Not reported | |||||
| *The basis for the assumed risk (e.g. the median control group risk across studies) is provided in footnotes. The corresponding risk (and its 95% confidence interval) is based on the assumed risk in the comparison group and the relative effect of the intervention (and its 95% CI). | ||||||
| GRADE Working Group grades of evidence. | ||||||
| aDowngraded one level due to serious risk of bias (unclear for sequence generation, allocation concealment, and blinding) and two levels for imprecision (95% CI very wide, 0.56 to 239.74; crosses line of no effect). bDowngraded two levels due to very serious imprecision: single trial with small sample size. | ||||||
| Traditional suburethral sling operation versus anterior repair | ||||||
| Patient or population: women with urinary incontinence | ||||||
| Outcomes | Illustrative comparative risks* (95% CI) | Relative effect | Number of participants | Quality of the evidence | Comments | |
| Assumed risk | Corresponding risk | |||||
| Anterior repair | Sling | |||||
| Number of continent (dry) women (any definition) in the medium term (1 to 5 years) | Not reported | |||||
| Repeat surgery for urinary incontinence | Not reported | |||||
| Perioperative surgical complications | Not reported | |||||
| Long‐term adverse effects | Not reported | |||||
| Condition‐specific quality of life | Not reported | |||||
| *The basis for the assumed risk (e.g. the median control group risk across studies) is provided in footnotes. The corresponding risk (and its 95% confidence interval) is based on the assumed risk in the comparison group and the relative effect of the intervention (and its 95% CI). | ||||||
| GRADE Working Group grades of evidence. | ||||||
| Traditional suburethral sling operation versus bladder neck needle suspension (abdominal and vaginal) | ||||||
| Patient or population: women with urinary incontinence | ||||||
| Outcomes | Illustrative comparative risks* (95% CI) | Relative effect | Number of participants | Quality of the evidence | Comments | |
| Assumed risk | Corresponding risk | |||||
| Bladder neck needle suspension | Sling | |||||
| Number of continent (dry) women (any definition) in the medium term (1 to 5 years) | 700 per 1000 | 900 per 1000 (435 to 991) | OR 3.86 0.33 to 45.57 | 20 | ⊕⊝⊝⊝ | 200 more women, per 1000, with traditional sling (265 fewer to 291 more) |
| Repeat surgery for urinary incontinence | Not reported | |||||
| Perioperative surgical complications ‐ urodynamic stress incontinence (only) | 200 per 1000 | 900 per 1000 | RR 4.5 | 20 | ⊕⊝⊝⊝ | 700 more women, per 1000, with traditional sling (56 fewer to 2962 more) |
| Long‐term adverse effects | Not reported | |||||
| Condition‐specific quality of life | Not reported | |||||
| *The basis for the assumed risk (e.g. the median control group risk across studies) is provided in footnotes. The corresponding risk (and its 95% confidence interval) is based on the assumed risk in the comparison group and the relative effect of the intervention (and its 95% CI). | ||||||
| GRADE Working Group grades of evidence. | ||||||
| aDowngraded two levels for risk of bias (evidence comes from a single trial that was judged to be unclear for allocation concealment and blinding) and two levels for imprecision (95% CI very wide). | ||||||
| Traditional suburethral sling operation versus open abdominal retropubic suspension | ||||||
| Patient or population: women with urinary incontinence | ||||||
| Outcomes | Illustrative comparative risks* (95% CI) | Relative effect | Number of participants | Quality of the evidence | Comments | |
| Assumed risk | Corresponding risk | |||||
| Open abdominal retropubic suspension | Sling | |||||
| Number of continent (dry) women (any definition) in the medium term (1 to 5 years) | 589 per 1000 | 711 per 1000 (638 to 774) | OR 1.70 (1.22 to 2.37) | 687 (4 RCTs) | ⊕⊕⊕⊝ | 120 more dry women, per 1000, with traditional sling (47 more to 186 more) |
| Repeat surgery for urinary incontinence‐stress urinary incontinence (symptoms only) | 119 per 1000 | 18 per 1000 | RR 0.15 (0.05 to 0.42) | 450 | ⊕⊕⊕⊕ | 101 fewer women having repeat continence surgery, per 1000, with traditional sling (113 fewer to 69 fewer) |
| Perioperative surgical complications | 95 per 1000 | 118 per 1000 | RR 1.24 | 792 | ⊕⊝⊝⊝ | 23 more women, per 1000, with traditional sling (16 fewer to 82 more) |
| Long‐term adverse effects | 92 per 1000 | 94 per 1000 | RR 1.02 (0.57 to 1.82) | 453 | ⊕⊕⊝⊝ | 2 more women, per 1000, with traditional sling (39 fewer to 75 more) |
| Condition‐specific quality of life | Mean IIQ score in the control group was 44.8 | Mean condition‐specific quality of life in the intervention groups was | 453 | ⊕⊝⊝⊝ | Another trial reported no evidence of a difference between colposuspension groups and sling groups in IIQ and UDI scores but reported no actual numbers | |
| *The basis for the assumed risk (e.g. the median control group risk across studies) is provided in footnotes. The corresponding risk (and its 95% confidence interval) is based on the assumed risk in the comparison group and the relative effect of the intervention (and its 95% CI). | ||||||
| GRADE Working Group grades of evidence. | ||||||
| aDowngraded one level due to serious risk of bias (unclear randomisation and allocation concealment in two of the smaller trials), but the trial carrying 90% of weight in the meta‐analysis was judged to have low risk of selection bias. bDowngraded one level for risk of bias (sequence generation was unclear in one‐fourth of trials and allocation concealment was unclear in three‐quarters of trials taking part in the meta‐analysis; participants were not blinded) and one level for imprecision (95% confidence interval was very wide). cDowngraded two levels for imprecision (95% confidence interval was very wide; 0.57 to 1.82). dDowngraded two levels for risk of bias (sequence generation and allocation concealment were judged to be "low risk"; blinding of participants was judged to be "high risk") and two levels for imprecision (95% confidence interval was very wide; ‐11.96 to 15.36). | ||||||
| Traditional suburethral sling operation versus laparoscopic colposuspension | ||||||
| Patient or population: women with urinary incontinence | ||||||
| Outcomes | Illustrative comparative risks* (95% CI) | Relative effect | Number of participants | Quality of the evidence | Comments | |
| Assumed risk | Corresponding risk | |||||
| Laparoscopic procedures | Sling | |||||
| Number of continent (dry) women (any definition) in the medium term (1 to 5 years) | Not reported | |||||
| Repeat surgery for urinary incontinence | Not reported | |||||
| Perioperative surgical complications | Not reported | |||||
| Voiding dysfunction | Not reported | |||||
| Long‐term adverse effects | Not reported | |||||
| Condition‐specific quality of life | Not reported | |||||
| *The basis for the assumed risk (e.g. the median control group risk across studies) is provided in footnotes. The corresponding risk (and its 95% confidence interval) is based on the assumed risk in the comparison group and the relative effect of the intervention (and its 95% CI). | ||||||
| GRADE Working Group grades of evidence. | ||||||
| Traditional suburethral sling operation versus a mid‐urethral sling or tape | ||||||
| Patient or population: women with urinary incontinence | ||||||
| Outcomes | Illustrative comparative risks* (95% CI) | Relative effect | Number of participants | Quality of the evidence | Comments | |
| Assumed risk | Corresponding risk | |||||
| Minimally invasive sling operation | Traditional sling | |||||
| Number of continent (dry) women (any definition) in the medium term (1 to 5 years) | 737 per 1000 | 652 per 1000 (552 to 741) | OR 0.67 (0.44 to 1.02) | 445 (6 RCTs) | ⊕⊕⊕⊝ | 85 fewer women, per 1000, with traditional sling (185 fewer to 4 more) |
| Repeat surgery for urinary incontinence ‐ urodynamic stress incontinence (only) | One trial reported the numbers of women having repeat continence surgery at 10‐year follow‐up: traditional sling: 0/67; mid‐urethral sling: 2/69 | 136 | ⊕⊕⊝⊝ | |||
| Perioperative surgical complications | 193 per 1000 | 336 per 1000 | RR 1.74 | 293 | ⊕⊕⊝⊝ | 143 more women, per 1000, with traditional sling (31 more to 309 more) |
| Long‐term adverse effects | 25 per 1000 | 62 per 1000 | RR 2.53 | 326 | ⊕⊝⊝⊝ | 38 more women, per 1000, with traditional sling (3 fewer to 157 more) |
| Condition‐specific quality of life | Mean IIQ‐7 score in the control group was 24.4 | Mean condition‐specific quality of life score in the intervention groups was | 63 | ⊕⊝⊝⊝ | Eight other trials reported some measure of QoL but the data were unsuitable for met‐analysis. Overall, there was no evidence of a difference between groups in QoL scores | |
| *The basis for the assumed risk (e.g. the median control group risk across studies) is provided in footnotes. The corresponding risk (and its 95% confidence interval) is based on the assumed risk in the comparison group and the relative effect of the intervention (and its 95% CI). | ||||||
| GRADE Working Group grades of evidence. | ||||||
| 1Downgraded one level due to serious risk of bias: 2/6 trials had high risk of selection bias. 2Downgraded two levels due to very serious imprecision: single study with small sample size. 3Downgraded two levels for risk of bias (sequence generation and allocation concealment were high or unclear risk in all four trials taking part in the meta‐analysis). 4Downgraded two levels for risk of bias (sequence generation and allocation concealment were high or unclear risk in two of three trials taking part in the meta‐analysis) and two levels for imprecision (95% confidence interval was very wide: 0.87 to 7.35). 5Downgraded two levels for risk of bias (sequence generation was judged to be high risk, and allocation concealment was judged to be low risk; outcome data were incomplete) and two levels for imprecision (95% confidence interval was very wide: ‐10.17 to 11.37). | ||||||
| Traditional suburethral sling operation versus a single‐incision sling (mini‐sling) | ||||||
| Patient or population: women with urinary incontinence | ||||||
| Outcomes | Illustrative comparative risks* (95% CI) | Relative effect | Number of participants | Quality of the evidence | Comments | |
| Assumed risk | Corresponding risk | |||||
| Number of continent (dry) women (any definition) in the medium term (1 to 5 years) | 886 per 1000 | 886 per 1000 (641 to 971) | OR 1.00 (0.23 to 4.36) | 70 | ⊕⊝⊝⊝ | 0 fewer women, per 1000, with traditional sling (245 fewer to 86 more) |
| Repeat surgery for urinary incontinence | not reported | |||||
| Perioperative surgical complications ‐ bladder perforation | 0 per 1000 | 0 per 1000 (0 to 0) | RR 3 (0.13 to 71.22) | 70 | ⊕⊝⊝⊝ | |
| Long‐term adverse effects | not reported | |||||
| Condition‐specific quality of life IIQ | Mean IIQ score in the control group was 42.7 | Mean condition‐specific quality of life score in the intervention groups was 50.2 higher (2.23 higher to 12.77 higher) | 70 | ⊕⊝⊝⊝ | Based on mean IIQ score, quality of life was worse in the traditional sling group compared with the mini‐sling group | |
| *The basis for the assumed risk (e.g. the median control group risk across studies) is provided in footnotes. The corresponding risk (and its 95% confidence interval) is based on the assumed risk in the comparison group and the relative effect of the intervention (and its 95% CI). | ||||||
| GRADE Working Group grades of evidence. | ||||||
| aDowngraded two levels due to very serious risk of bias: unclear randomisation and inadequate blinding. bDowngraded two levels due to very serious imprecision: single trial, small sample size, wide 95% confidence intervals. | ||||||
| One type of traditional sling operation versus another type of traditional sling operation | ||||||
| Patient or population: women with urinary incontinence | ||||||
| Outcomes | Illustrative comparative risks* (95% CI) | Relative effect | Number of participants | Quality of the evidence | Comments | |
| Assumed risk | Corresponding risk | |||||
| Another type of traditional sling | One type of traditional sling | |||||
| Number of continent (dry) women (any definition) in the medium term (1 to 5 years) | Not estimable | 749 | ⊕⊝⊝⊝ | Results not pooled (Analysis 11.2) | ||
| Repeat surgery for urinary incontinence at first year Fascial sling vs Pelvicol sling | 196 per 1000 | 8 per 1000 (0 to 119) | RR 0.04 (0.00 to 0.61) | 113 | ⊕⊕⊝⊝2 | 188 fewer women, per 1000, with fascial sling (0 fewer to 76 fewer) (Analysis 11.4 |
| Perioperative surgical complications | Not estimable | 239 | ⊕⊝⊝⊝ | Results not pooled (Analysis 11.14) | ||
| Long‐term adverse effects | Not estimable | 421 | ⊕⊝⊝⊝ | Results not pooled (Analysis 11.23) | ||
| Condition‐specific quality of life | Not estimable | 282 | ⊕⊝⊝⊝ | Results not pooled* (Analysis 11.25) | ||
| *The basis for the assumed risk (e.g. the median control group risk across studies) is provided in footnotes. The corresponding risk (and its 95% confidence interval) is based on the assumed risk in the comparison group and the relative effect of the intervention (and its 95% CI). | ||||||
| GRADE Working Group grades of evidence. | ||||||
| 1Downgraded two levels for imprecision (Analysis 11.2) and two levels for heterogeneity, as the trials used different materials for the traditional sling procedure. 2Downgraded two levels for imprecision (Analysis 11.4) 3Downgraded one level for risk of bias (sequence generation was judged to be at low risk of bias in two of three trials and unclear in the third trial; allocation concealment was unclear in two of three trials). Blinding (performance bias and detection bias) was judged to be unclear (two of three) or high risk (one of three). Downgraded two levels for heterogeneity, as the trials used three different materials for the traditional sling procedure, and one level for inconsistency, as 95% CIs did not overlap (Analysis 11.14). 4Downgraded two levels for heterogeneity, as the trials used four different materials for the traditional sling procedure, and one level for imprecision, as the 95% CIs were very wide (Analysis 11.23). 5Downgraded two levels for heterogeneity, as the trials used three different materials for the traditional sling procedure, and one level for inconsistency, as 95% CIs did not overlap (Analysis 11.25). * Data from two other trials were identified and are reported narratively in the text. These two trials did not report their data in a form suitable for meta‐analysis | ||||||
| Trial ID | Definition of outcome | Notes |
| WOMAN‐REPORTED | ||
| Overall success defined as no self‐reported symptoms of UI, no incontinence on 3‐day diary, negative stress test, no re‐treatment (combined outcome). Failure (self‐reported UI) at 5 years only (woman‐reported) | Also combined outcome before 5 years | |
| Cure defined as complete dryness with no usage of pads (woman‐reported) | ||
| Cure of incontinence defined as a quality of life (QoL) improvement of 90% and/or patient‐determined continent status as dry (woman‐reported) | Questionnaire‐based | |
| Dry (symptom‐free) patients (woman‐reported) | ||
| Assessment of cure not defined. Data abstracted from this trial therefore assumed to be woman‐reported | ||
| Cure stated as subjective (woman‐reported) at 24 months' follow‐up Objective (urodynamic diagnosis, pad test (clinician‐reported)) at 3 months | Also clinician‐reported outcome at 3 months | |
| Subjective cure consistent with complete dryness or a few drops of water with strong exercises (assumed to be woman‐reported) | Also separate clinician‐reported outcome | |
| Success rate measured by recurrence of stress leakage as reported in patient questionnaire (woman‐reported) | ||
| Subjective success: no or occasional (less than once a week) stress incontinence (woman‐reported) | Also separate clinician‐reported outcome | |
| Cure defined as subjective (history: woman‐reported) | Also separate clinician‐reported outcome | |
| Cure defined as of some degree of SUI at 1 year after surgery (woman‐reported) | ||
| Success rate (dry) (method unspecified: assumed woman‐reported) | ||
| Cure rate (method unspecified: assumed woman‐reported) | ||
| Stress urinary incontinence (method unspecified: assumed woman‐reported) | ||
| QUANTITATIVE | ||
| Cure = dry pads, improvement = 1 wet pad, failure ≥ 1 wet pad per day (quantitative) | Satisfaction separately measured by questionnaire | |
| Subjective cure assessed via comparison between pre‐operative and postoperative Incontinence Impact Questionnaire (IIQ), Urinary Distress Inventory (UDI) (quantitative) | Also separate clinician‐reported outcome | |
| Cure defined as no pad use (quantitative) | ||
| Subjective improvement only; subjective patient evaluations included QoL questionnaire, incontinence diary, pain and global outcome assessments (quantitative) | Also separate clinician‐reported outcome | |
| Objective cure defined as 1‐hour pad test ≤ 2 grams (quantitative) | Also separate clinician‐reported outcome | |
| Women declared objectively cured when they had a postoperative pad test < 8 grams (quantitative) | ||
| Objective assessment via 48‐hour frequency volume chart, 48‐hour pad test, and standardised stress test. Surgery was considered successful when there was no postoperative SUI (patient was dry (quantitative)) | Also separate clinician‐reported outcome | |
| CLINICIAN‐REPORTED | ||
| No leakage of urine during stress test and urodynamic testing (clinician‐reported) | ||
| Cure defined as complete freedom from SUI (clinician‐reported) | ||
| Urine loss during cough‐stress test defined as persistent stress incontinence (clinician‐assessed) | ||
| Objective cure by stress test, voiding dysfunction by urodynamic assessment if incontinence seen (clinician‐reported) | Also separate quantitative outcome | |
| Cure stated as objective (urodynamic diagnosis, pad test (clinician‐reported)) at 3 months | Also woman‐reported outcome at 24 months | |
| Objective cure defined as complete absence of leakage during cough‐stress test with 250 or 300 mL of water in the bladder (clinician‐reported) | Also separate woman‐reported outcome | |
| Objective success: no leakage due to SUI on repeat urodynamic study (clinician‐reported) | Also separate woman‐reported outcome | |
| Objective outcome assessment: urine loss via a provocative pad test (clinician‐reported) | Also separate quantitative outcome (improvement only) | |
| Cure defined as objective (urodynamic: clinician‐reported) | Also separate woman‐reported outcome | |
| Objective cure defined as negative cough‐induced stress test with full bladder (≥ 250 mL filled) in lithotomy and standing positions (clinician‐reported) | Also separate quantitative outcome | |
| Objective assessment via 48‐hour frequency volume chart, 48‐hour pad test, and standardised stress test. Surgery considered successful when stress test was negative (clinician‐reported) and postoperative cystocoele was < grade 2 | Also separate quantitative outcome | |
| COMBINED WOMAN‐ AND CLINICIAN‐REPORTED | ||
| Overall success defined as no self‐reported symptoms of UI, no incontinence on 3‐day diary, negative stress test, no re‐treatment (combined outcome). Failure (self‐reported UI) at 5 years only (woman‐reported) | Also woman‐reported outcome at 5 years | |
| Cure of SUI defined as significant dryness as perceived by the patient, no more use of pads, negative stress test, and acceptable voiding stream (combined primary outcome) | However, no data after first week, so not useable | |
| Cure defined as absence of subjective complaints of leakage and absence of urinary leakage on stress test (combined outcome) | ||
| Cure defined as dry, symptom‐free without objective urine loss during stress with bladder filled to 300 mL or positive urethral‐closure pressure during stress provocation (combined outcome) | ||
| Continence defined as no urinary leakage on a 3‐day voiding diary, no self‐reported stress incontinence symptoms, and no stress incontinence surgical treatment (combined outcome) | ||
| Cure defined as complete freedom from SUI (subjective and objective demonstrations) (combined outcome) | ||
| Patients evaluated by SEAPI score (subjective and objective) after urodynamic examination before and after treatment (combined outcome) | ||
| Cure defined as reported absence of SUI with no urinary loss during effort manoeuvres (combined outcome) | ||
| Cure defined as no leakage reported by the patient or noticed at examination (combined outcome) | ||
| Cure defined as complete dryness with no usage of pad and negative cough‐stress test (combined outcome) | ||
| Trials that did not report cure rates.
| ||
| Comparison 3. Traditional suburethral sling operation versus drugs | |
| Osman 2003 included 75 women with mixed urinary incontinence treated with surgery (either Burch colposuspension (n = 24) or rectus fascia sling (n = 26)) or oxybutynin (an anticholinergic drug treatment for urinary incontinence, overactive bladder, and detrusor overactivity ‐ not for stress incontinence; n = 25) (Osman 2003). The type of surgery was selected according to Valsalva leak point pressure (VLPP) ‐ those with VLPP < 90 cm of water had rectus fascia sling, and those with VLPP > 90 cm of water had Burch colposuspension) Results for the surgically managed group were similar to those of the subgroup having slings. Due to small sample sizes, data were too few to be reliable; we therefore compared only data from oxybutynin versus sling patients provided in tables Primary outcomes Number of continent (dry) women Data suggest that, within the first year, women were significantly more likely to be continent after undergoing surgery with slings than after treatment with oxybutynin (20/24; 83% vs 0/21; OR 195.89, 95% CI 9.91 to 3871.03; n = 45; Analysis 3.1) Number of women who have repeat continence surgery Not reported Secondary outcomes Fewer women had persistent urgency urinary incontinence after traditional sling surgery (3/24; 13% vs 9/21; 43% with oxybutynin; RR 0.29, 95% CI 0.09 to 0.94; n = 45; Analysis 3.2) | |
| Comparison 4. Traditional suburethral sling operation vs injectables | |
| Maher 2005 compared slings (21) vs injectable Macroplastique (22) in 45 women. Due to the small size of the trial, the data were too few to be reliable Primary outcomes Number of continent (dry) women Short‐term: data from 1 small trial were too few to reliably identify evidence of a difference between traditional sling and injectables in the number of continent women within the first year (OR 2.79, 95% CI 0.48 to 16.33; n = 43; Maher 2005; Analysis 4.1) Medium‐term: Maher 2005 found no evidence of a difference between groups in the number of continent women after the first year (13/13; 100% continent with a traditional sling vs 10/14, 71% with the injectable; OR 11.57, 95% CI 0.56 to 239.74; n = 27; very low‐quality evidence; Analysis 4.2;summary of findings Table 4) Number of women who have repeat continence surgery We found no evidence of a difference between groups in the numbers of women having repeat surgery for urinary incontinence (1 after traditional sling vs 2 after injectable: RR 0.52, 95% CI 0.05 to 5.36; n = 43; very low‐quality evidence; Maher 2005; Analysis 4.3;summary of findings Table 4) Secondary outcomes Number of women cured at 1 year or later (women's observations) The trial was too small to reliably identify evidence of a difference between groups in the number of women cured after the first year (OR 11.57, 95% CI 0.56 to 239.74; n = 27; Analysis 4.4) Number of women improved Not reported Number of women satisfied Data from Maher 2005 were too few to identify a difference between groups in satisfaction rates at 6 months (P = 0.41) or at 5 years (RR 2.42, 95% CI 0.98 to 5.98; n = 27; Analysis 4.5) Quantification of symptoms Not reported Clinician's observations Data suggest there were more women with incontinence (clinician‐observed) within the first year with injectables compared with the traditional sling: 4/21 vs 20/22 (RR 0.21, 95% 0.09 to 0.21; n = 43; Maher 2005; Analysis 4.6) Surgical outcome measures Injectables were quicker to perform, involved shorter hospital stay and time to catheter removal, and led to quicker return to normal activity than after traditional sling surgery, but the data were not suitable for meta‐analysis (Maher 2005) Further treatment Not reported Adverse events Perioperative surgical complications Not reported Bladder perforation Not reported Urinary tract infection Maher 2005 reported no evidence of a difference between traditional slings and injectables in the numbers of women with urinary tract infection (RR 1.57, 95% CI 0.29 to 8.49; very low‐quality evidence; Analysis 4.7;summary of findings Table 4) Urinary urgency symptoms, urgency urinary incontinence Not reported Detrusor overactivity (urodynamic overactivity) Maher 2005 reported no evidence of a difference between traditional slings and injectables in the numbers of women with de novo detrusor overactivity (RR 3.14, 95% CI 0.13 to 72.96; Analysis 4.8) Voiding dysfunction (with or without urodynamic confirmation) Maher 2005 reported no evidence of a difference between traditional slings and injectables in the numbers of women with voiding dysfunction (RR 4.19, 95% CI 0.51 to 34.50; Analysis 4.9) Long‐term adverse effects Not reported Quality of life Maher 2005 reported a significant reduction in Incontinence Impact Questionnaire (IIQ) scores compared with baseline (P < 0.01) in both groups, although he provided no data | |
| Comparison 6. Traditional suburethral sling operation vs bladder neck needle suspension (abdominal and vaginal) | |
| Only 1 trial compared porcine dermis sling vs Stamey needle suspension (Hilton 1989). This was a small trial with only 10 women in each arm. The women were unsuitable for abdominal colposuspension (the study author's preferred procedure) because they had vaginal narrowing secondary to previous interventions or atrophic vaginitis. Thus they constitute a population of women with SUI who are not typical of the majority. All women had urodynamic stress incontinence. Groups were comparable for age, parity, previous interventions, and hormonal status. Follow‐up was reported at 3 months and 24 months. Due to the small size of the trial, the data were too few to be reliable Primary outcomes Number of continent (dry) women Short‐term: within the first year after surgery, 1 small trial reported 9/10 and 8/10 continent women in the traditional sling and needle suspension groups, respectively (OR 2.25, 95% CI 0.17 to 29.77; n = 20; Hilton 1989; Analysis 6.1) Medium‐term: very low‐quality evidence from 1 trial comparing slings vs bladder neck needle suspension suggested no evidence of a difference between groups in the likelihood of being continent at 2 years after surgery (OR 3.86, 95% CI 0.33 to 45.57; n = 20; Hilton 1989; Analysis 6.2;summary of findings Table 6) Long‐term: not reported Number of women who have repeat continence surgery Not reported Secondary outcomes Women's observations Number of women cured at 1 year or later (women's observations) Evidence from 1 small trial comparing slings vs bladder neck needle suspension suggests no difference between groups in cure rates at 2 years after surgery (OR 3.86, 95% CI 0.33 to 45.57; n = 20; Hilton 1989) Quantification of symptoms Pad test at 12 months and 24 months stated but not reported (Hilton 1989) Clinician's observations Not reported Surgical outcome measures Duration of operation Not reported Length of hospital stay Sling group needed an indwelling catheter for longer and more adjuvant therapy, resulting in a longer stay in hospital than those with bladder neck needle suspension (MD 13 days longer, 95% CI 5 to 21; n = 20; Hilton 1989; Analysis 6.4) Time to return to normal activity level Not reported Blood loss Not reported Further treatment Not reported Adverse events Perioperative surgical complications Nine of the 10 women who had sling operations had complications, compared with 2/10 who had needle suspension. These included pyrexia, blood loss, wound infection, and pulmonary embolus (RR 4.50, 95% CI 1.28 to 15.81; n = 20; very low‐quality evidence; Hilton 1989; Analysis 6.5;summary of findings Table 6) Bladder perforation Not reported Urinary tract infection Not reported Urinary urgency symptoms, urgency urinary incontinence At 3 months: sling: 5/10, needle suspension: 3/10 (Hilton 1989; Analysis 6.6) Detrusor overactivity (urodynamic overactivity) At 3 months: sling: 2/10, needle suspension: 1/10 (Hilton 1989; Analysis 6.7) Voiding dysfunction (with or without urodynamic confirmation) At 3 months: sling: 4/10, needle suspension: 2/10 (Hilton 1989; Analysis 6.8) Long‐term adverse effects Not reported Quality of life Not reported | |
| Comparison 10. Traditional suburethral sling operation vs a single‐incision sling (mini‐sling) | |
| One small trial compared a rectus fascia pubovaginal traditional sling vs a single‐incision sling (mini‐sling; Ophira) and included women with urodynamically diagnosed stress urinary incontinence (USI) (Sharifiaghdas 2015) Due to the small size of the trial, the data were too few to be reliable Primary outcomes Number of continent (dry) women Short‐term: not reported Medium‐term: exactly the same proportion of women were continent at 1 year after surgery (traditional sling: 31/35; mini‐sling: 31/35; very low‐quality evidence; Sharifiaghdas 2015; Analysis 10.1;summary of findings Table 10) Long‐term: not reported Number of women who have repeat continence surgery Not reported Secondary outcomes Women's observations Cure For self‐report of cure at 1 year after surgery, exactly the same proportion of women were cured (traditional sling: 31/35; mini‐sling: 31/35; Sharifiaghdas 2015; Analysis 10.2) Number of women improved Not reported Number of women satisfied 10/35 women in the traditional sling group and 7/35 in the mini‐sling group reported that they were satisfied with their treatment at 1 year (RR 0.89, 95% CI 0.68 to 1.17; n = 70; Sharifiaghdas 2015; Analysis 10.3) Quantification of symptoms Not reported Clinician's observations The clinician's report of observed stress incontinence concurred with that reported by women ‐ 4 in each group (RR 1.00, 95% CI 0.27 to 3.69; n = 70; Sharifiaghdas 2015) Surgical outcome measures Not reported Further treatment Not reported Adverse effects Perioperative complications Not reported Bladder perforation One woman (of 35) had a bladder perforation in the traditional sling group compared with none (of 35) in the mini‐sling group (very low‐quality evidence; Sharifiaghdas 2008; Analysis 10.5;summary of findings Table 10) Urinary tract infection Not reported Urinary urgency symptoms, urgency urinary incontinence More women in the traditional sling group reported urinary urgency incontinence (5/35) compared with the mini‐sling group (1/35) (RR 5.00, 95% CI 0.62 to 40.64; n = 70; Sharifiaghdas 2015; Analysis 10.6) Detrusor overactivity (urodynamic overactivity) Not reported Voiding dysfunction (with or without urodynamic confirmation) Not reported Long‐term adverse effects Dyspareunia: 3/35 and 4/35 in traditional sling and mini‐sling groups, respectively, reported pain with intercourse (RR 0.75, 95% CI 0.18 to 3.11; n = 70; Sharifiaghdas 2008; Analysis 10.7) Tape or mesh exposure: 1 woman in the traditional sling group and 2 in the mini‐sling group were found to have tape or mesh exposure (RR 0.50, 95% CI 0.05 to 5.27; n = 70; Sharifiaghdas 2008; Analysis 10.8) Quality of life Based on mean IIQ score, quality of life was lower in the traditional sling group compared with the mini‐sling group (MD 7.50, 95% CI 2.23 to 12.77; very low‐quality evidence; Analysis 10.9;summary of findings Table 10) | |
| USI: urodynamically diagnosed stress urinary incontinence VLPP: Valsalva leak point pressure | |
| Outcome or subgroup title | No. of studies | No. of participants | Statistical method | Effect size |
| 1 Number of continent women within 1 year (any definition) Show forest plot | 1 | Odds Ratio (M‐H, Fixed, 95% CI) | Totals not selected | |
| 1.1 urodynamic stress incontinence (only) | 0 | Odds Ratio (M‐H, Fixed, 95% CI) | 0.0 [0.0, 0.0] | |
| 1.2 stress urinary incontinence (symptoms only) | 0 | Odds Ratio (M‐H, Fixed, 95% CI) | 0.0 [0.0, 0.0] | |
| 1.3 mixed incontinence | 1 | Odds Ratio (M‐H, Fixed, 95% CI) | 0.0 [0.0, 0.0] | |
| 2 Urge urinary symptoms, urgency urinary incontinence Show forest plot | 1 | Risk Ratio (M‐H, Fixed, 95% CI) | Totals not selected | |
| 2.1 urodynamic stress incontinence (only) | 0 | Risk Ratio (M‐H, Fixed, 95% CI) | 0.0 [0.0, 0.0] | |
| 2.2 stress urinary incontinence (symptoms only) | 0 | Risk Ratio (M‐H, Fixed, 95% CI) | 0.0 [0.0, 0.0] | |
| 2.3 mixed incontinence | 1 | Risk Ratio (M‐H, Fixed, 95% CI) | 0.0 [0.0, 0.0] | |
| Outcome or subgroup title | No. of studies | No. of participants | Statistical method | Effect size |
| 1 Number of continent women within 1 year (any definition) Show forest plot | 1 | Odds Ratio (M‐H, Fixed, 95% CI) | Totals not selected | |
| 1.1 urodynamic stress incontinence (only) | 1 | Odds Ratio (M‐H, Fixed, 95% CI) | 0.0 [0.0, 0.0] | |
| 1.2 stress urinary incontinence (symptoms only) | 0 | Odds Ratio (M‐H, Fixed, 95% CI) | 0.0 [0.0, 0.0] | |
| 1.3 mixed urinary incontinence | 0 | Odds Ratio (M‐H, Fixed, 95% CI) | 0.0 [0.0, 0.0] | |
| 2 Number of continent women at 1 to 5 years (any definition) Show forest plot | 1 | Odds Ratio (M‐H, Fixed, 95% CI) | Totals not selected | |
| 2.1 urodynamic stress incontinence (only) | 1 | Odds Ratio (M‐H, Fixed, 95% CI) | 0.0 [0.0, 0.0] | |
| 2.2 stress urinary incontinence (symptoms only) | 0 | Odds Ratio (M‐H, Fixed, 95% CI) | 0.0 [0.0, 0.0] | |
| 2.3 mixed urinary incontinence | 0 | Odds Ratio (M‐H, Fixed, 95% CI) | 0.0 [0.0, 0.0] | |
| 3 Repeat surgery for urinary incontinence Show forest plot | 1 | Risk Ratio (M‐H, Fixed, 95% CI) | Totals not selected | |
| 3.1 urodynamic stress incontinence (only) | 1 | Risk Ratio (M‐H, Fixed, 95% CI) | 0.0 [0.0, 0.0] | |
| 3.2 stress urinary incontinence (symptoms only) | 0 | Risk Ratio (M‐H, Fixed, 95% CI) | 0.0 [0.0, 0.0] | |
| 3.3 mixed urinary incontinence | 0 | Risk Ratio (M‐H, Fixed, 95% CI) | 0.0 [0.0, 0.0] | |
| 4 Number of women cured after first year (women's observations) Show forest plot | 1 | Odds Ratio (M‐H, Fixed, 95% CI) | Totals not selected | |
| 4.1 urodynamic stress incontinence (only) | 1 | Odds Ratio (M‐H, Fixed, 95% CI) | 0.0 [0.0, 0.0] | |
| 4.2 stress urinary incontinence (symptoms only) | 0 | Odds Ratio (M‐H, Fixed, 95% CI) | 0.0 [0.0, 0.0] | |
| 4.3 mixed urinary incontinence | 0 | Odds Ratio (M‐H, Fixed, 95% CI) | 0.0 [0.0, 0.0] | |
| 5 Number of women satisfied (women's observations) Show forest plot | 1 | Risk Ratio (M‐H, Fixed, 95% CI) | Totals not selected | |
| 5.1 urodynamic stress incontinence (only) | 1 | Risk Ratio (M‐H, Fixed, 95% CI) | 0.0 [0.0, 0.0] | |
| 5.2 stress urinary incontinence (symptoms only) | 0 | Risk Ratio (M‐H, Fixed, 95% CI) | 0.0 [0.0, 0.0] | |
| 5.3 mixed incontinence | 0 | Risk Ratio (M‐H, Fixed, 95% CI) | 0.0 [0.0, 0.0] | |
| 6 Number of women with urinary incontinence within first year (clinician's observations) Show forest plot | 1 | Risk Ratio (M‐H, Fixed, 95% CI) | Totals not selected | |
| 6.1 urodynamic stress incontinence (only) | 1 | Risk Ratio (M‐H, Fixed, 95% CI) | 0.0 [0.0, 0.0] | |
| 6.2 stress urinary incontinence (symptoms only) | 0 | Risk Ratio (M‐H, Fixed, 95% CI) | 0.0 [0.0, 0.0] | |
| 6.3 mixed urinary incontinence | 0 | Risk Ratio (M‐H, Fixed, 95% CI) | 0.0 [0.0, 0.0] | |
| 7 Urinary tract infection Show forest plot | 1 | Risk Ratio (M‐H, Fixed, 95% CI) | Totals not selected | |
| 7.1 urodynamic stress incontinence (only) | 1 | Risk Ratio (M‐H, Fixed, 95% CI) | 0.0 [0.0, 0.0] | |
| 7.2 stress urinary incontinence (symptoms only) | 0 | Risk Ratio (M‐H, Fixed, 95% CI) | 0.0 [0.0, 0.0] | |
| 7.3 mixed urinary incontinence | 0 | Risk Ratio (M‐H, Fixed, 95% CI) | 0.0 [0.0, 0.0] | |
| 8 De novo detrusor overactivity (urodynamic diagnosis) Show forest plot | 1 | Risk Ratio (M‐H, Fixed, 95% CI) | Totals not selected | |
| 8.1 urodynamic stress incontinence (only) | 1 | Risk Ratio (M‐H, Fixed, 95% CI) | 0.0 [0.0, 0.0] | |
| 8.2 stress urinary incontinence (symptoms only) | 0 | Risk Ratio (M‐H, Fixed, 95% CI) | 0.0 [0.0, 0.0] | |
| 8.3 mixed urinary incontinence | 0 | Risk Ratio (M‐H, Fixed, 95% CI) | 0.0 [0.0, 0.0] | |
| 9 Voiding dysfunction Show forest plot | 1 | Risk Ratio (M‐H, Fixed, 95% CI) | Totals not selected | |
| 9.1 urodynamic stress incontinence (only) | 1 | Risk Ratio (M‐H, Fixed, 95% CI) | 0.0 [0.0, 0.0] | |
| 9.2 stress urinary incontinence (symptoms only) | 0 | Risk Ratio (M‐H, Fixed, 95% CI) | 0.0 [0.0, 0.0] | |
| 9.3 mixed urinary incontinence | 0 | Risk Ratio (M‐H, Fixed, 95% CI) | 0.0 [0.0, 0.0] | |
| Outcome or subgroup title | No. of studies | No. of participants | Statistical method | Effect size |
| 1 Number of continent women within 1 year (any definition) Show forest plot | 1 | Odds Ratio (M‐H, Fixed, 95% CI) | Totals not selected | |
| 1.1 urodynamic stress incontinence (only) | 1 | Odds Ratio (M‐H, Fixed, 95% CI) | 0.0 [0.0, 0.0] | |
| 1.2 stress urinary incontinence (symptoms only) | 0 | Odds Ratio (M‐H, Fixed, 95% CI) | 0.0 [0.0, 0.0] | |
| 1.3 mixed incontinence | 0 | Odds Ratio (M‐H, Fixed, 95% CI) | 0.0 [0.0, 0.0] | |
| 2 Number of continent women at 1 to 5 years (any definition) Show forest plot | 1 | Odds Ratio (M‐H, Fixed, 95% CI) | Totals not selected | |
| 2.1 urodynamic stress incontinence (only) | 1 | Odds Ratio (M‐H, Fixed, 95% CI) | 0.0 [0.0, 0.0] | |
| 2.2 stress urinary incontinence (symptoms only) | 0 | Odds Ratio (M‐H, Fixed, 95% CI) | 0.0 [0.0, 0.0] | |
| 2.3 mixed incontinence | 0 | Odds Ratio (M‐H, Fixed, 95% CI) | 0.0 [0.0, 0.0] | |
| 3 CURE: number of women cured after first year (women's observations) Show forest plot | 1 | Odds Ratio (M‐H, Fixed, 95% CI) | Totals not selected | |
| 3.1 urodynamic stress incontinence (only) | 1 | Odds Ratio (M‐H, Fixed, 95% CI) | 0.0 [0.0, 0.0] | |
| 3.2 stress urinary incontinence (symptoms only) | 0 | Odds Ratio (M‐H, Fixed, 95% CI) | 0.0 [0.0, 0.0] | |
| 3.3 mixed incontinence | 0 | Odds Ratio (M‐H, Fixed, 95% CI) | 0.0 [0.0, 0.0] | |
| 4 Length of hospital stay (hours) Show forest plot | 1 | Mean Difference (IV, Fixed, 95% CI) | Totals not selected | |
| 4.1 urodynamic stress incontinence (only) | 1 | Mean Difference (IV, Fixed, 95% CI) | 0.0 [0.0, 0.0] | |
| 4.2 stress urinary incontinence (symptoms only) | 0 | Mean Difference (IV, Fixed, 95% CI) | 0.0 [0.0, 0.0] | |
| 4.3 mixed incontinence | 0 | Mean Difference (IV, Fixed, 95% CI) | 0.0 [0.0, 0.0] | |
| 5 Perioperative surgical complications Show forest plot | 1 | Risk Ratio (M‐H, Fixed, 95% CI) | Totals not selected | |
| 5.1 urodynamic stress incontinence (only) | 1 | Risk Ratio (M‐H, Fixed, 95% CI) | 0.0 [0.0, 0.0] | |
| 5.2 stress urinary incontinence (symptoms only) | 0 | Risk Ratio (M‐H, Fixed, 95% CI) | 0.0 [0.0, 0.0] | |
| 5.3 mixed incontinence | 0 | Risk Ratio (M‐H, Fixed, 95% CI) | 0.0 [0.0, 0.0] | |
| 6 Urinary urgency symptoms, urgency urinary incontinence Show forest plot | 1 | Risk Ratio (M‐H, Fixed, 95% CI) | Totals not selected | |
| 6.1 urodynamic stress incontinence (only) | 1 | Risk Ratio (M‐H, Fixed, 95% CI) | 0.0 [0.0, 0.0] | |
| 6.2 stress urinary incontinence (symptoms only) | 0 | Risk Ratio (M‐H, Fixed, 95% CI) | 0.0 [0.0, 0.0] | |
| 6.3 mixed incontinence | 0 | Risk Ratio (M‐H, Fixed, 95% CI) | 0.0 [0.0, 0.0] | |
| 7 Detrusor overactivity (urodynamic diagnosis) Show forest plot | 1 | Risk Ratio (M‐H, Fixed, 95% CI) | Totals not selected | |
| 7.1 urodynamic stress incontinence (only) | 1 | Risk Ratio (M‐H, Fixed, 95% CI) | 0.0 [0.0, 0.0] | |
| 7.2 stress urinary incontinence (symptoms only) | 0 | Risk Ratio (M‐H, Fixed, 95% CI) | 0.0 [0.0, 0.0] | |
| 7.3 mixed incontinence | 0 | Risk Ratio (M‐H, Fixed, 95% CI) | 0.0 [0.0, 0.0] | |
| 8 Voiding dysfunction after 3 months Show forest plot | 1 | Risk Ratio (M‐H, Fixed, 95% CI) | Totals not selected | |
| 8.1 urodynamic stress incontinence (only) | 1 | Risk Ratio (M‐H, Fixed, 95% CI) | 0.0 [0.0, 0.0] | |
| 8.2 stress urinary incontinence (symptoms only) | 0 | Risk Ratio (M‐H, Fixed, 95% CI) | 0.0 [0.0, 0.0] | |
| 8.3 mixed incontinence | 0 | Risk Ratio (M‐H, Fixed, 95% CI) | 0.0 [0.0, 0.0] | |
| Outcome or subgroup title | No. of studies | No. of participants | Statistical method | Effect size |
| 1 Number of continent women within 1 year (any definition) Show forest plot | 4 | 147 | Odds Ratio (M‐H, Fixed, 95% CI) | 2.70 [0.69, 10.55] |
| 1.1 urodynamic stress incontinence (only) | 4 | 147 | Odds Ratio (M‐H, Fixed, 95% CI) | 2.70 [0.69, 10.55] |
| 1.2 stress urinary incontinence (symptoms only) | 0 | 0 | Odds Ratio (M‐H, Fixed, 95% CI) | 0.0 [0.0, 0.0] |
| 1.3 mixed incontinence | 0 | 0 | Odds Ratio (M‐H, Fixed, 95% CI) | 0.0 [0.0, 0.0] |
| 2 Number of continent women at 1 to 5 years (any definition) Show forest plot | 4 | 687 | Odds Ratio (M‐H, Fixed, 95% CI) | 1.70 [1.22, 2.37] |
| 2.1 urodynamic stress incontinence (only) | 3 | 167 | Odds Ratio (M‐H, Fixed, 95% CI) | 1.84 [0.65, 5.24] |
| 2.2 stress urinary incontinence (symptoms only) | 1 | 520 | Odds Ratio (M‐H, Fixed, 95% CI) | 1.69 [1.19, 2.39] |
| 2.3 mixed incontinence | 0 | 0 | Odds Ratio (M‐H, Fixed, 95% CI) | 0.0 [0.0, 0.0] |
| 3 Number of continent women after 5 years (any definition) Show forest plot | 2 | 481 | Odds Ratio (M‐H, Fixed, 95% CI) | 1.55 [1.06, 2.27] |
| 3.1 urodynamic stress incontinence (only) | 1 | 28 | Odds Ratio (M‐H, Fixed, 95% CI) | 0.39 [0.03, 4.92] |
| 3.2 stress urinary incontinence (symptoms only) | 1 | 453 | Odds Ratio (M‐H, Fixed, 95% CI) | 1.61 [1.09, 2.37] |
| 3.3 mixed incontinence | 0 | 0 | Odds Ratio (M‐H, Fixed, 95% CI) | 0.0 [0.0, 0.0] |
| 4 Repeat surgery for urinary incontinence Show forest plot | 1 | Risk Ratio (M‐H, Fixed, 95% CI) | Totals not selected | |
| 4.1 urodynamic stress incontinence (only) | 0 | Risk Ratio (M‐H, Fixed, 95% CI) | 0.0 [0.0, 0.0] | |
| 4.2 stress urinary incontinence (symptoms only) | 1 | Risk Ratio (M‐H, Fixed, 95% CI) | 0.0 [0.0, 0.0] | |
| 4.3 mixed incontinence | 0 | Risk Ratio (M‐H, Fixed, 95% CI) | 0.0 [0.0, 0.0] | |
| 5 Number of women cured after first year (women's observations) Show forest plot | 3 | 515 | Odds Ratio (M‐H, Fixed, 95% CI) | 1.56 [1.07, 2.28] |
| 5.1 urodynamic stress incontinence (only) | 2 | 62 | Odds Ratio (M‐H, Fixed, 95% CI) | 0.93 [0.18, 4.89] |
| 5.2 stress urinary incontinence (symptoms only) | 1 | 453 | Odds Ratio (M‐H, Fixed, 95% CI) | 1.61 [1.09, 2.37] |
| 5.3 mixed incontinence | 0 | 0 | Odds Ratio (M‐H, Fixed, 95% CI) | 0.0 [0.0, 0.0] |
| 6 Number of women satisfied (women's observations) Show forest plot | 1 | Risk Ratio (M‐H, Fixed, 95% CI) | Totals not selected | |
| 6.1 urodynamic stress incontinence (only) | 0 | Risk Ratio (M‐H, Fixed, 95% CI) | 0.0 [0.0, 0.0] | |
| 6.2 stress urinary incontinence (symptoms only) | 1 | Risk Ratio (M‐H, Fixed, 95% CI) | 0.0 [0.0, 0.0] | |
| 6.3 mixed incontinence | 0 | Risk Ratio (M‐H, Fixed, 95% CI) | 0.0 [0.0, 0.0] | |
| 7 Number of women with urinary incontinence within first year (clinician's observations) | 0 | 0 | Risk Ratio (M‐H, Fixed, 95% CI) | 0.0 [0.0, 0.0] |
| 7.1 urodynamic stress incontinence (only) | 0 | 0 | Risk Ratio (M‐H, Fixed, 95% CI) | 0.0 [0.0, 0.0] |
| 7.2 stress urinary incontinence (symptoms only) | 0 | 0 | Risk Ratio (M‐H, Fixed, 95% CI) | 0.0 [0.0, 0.0] |
| 7.3 mixed incontinence | 0 | 0 | Risk Ratio (M‐H, Fixed, 95% CI) | 0.0 [0.0, 0.0] |
| 8 Number of women with urinary incontinence at 1 to 5 years (clinician's observations) Show forest plot | 3 | 626 | Risk Ratio (M‐H, Fixed, 95% CI) | 0.88 [0.59, 1.31] |
| 8.1 urodynamic stress incontinence (only) | 2 | 106 | Risk Ratio (M‐H, Fixed, 95% CI) | 0.54 [0.16, 1.86] |
| 8.2 stress urinary incontinence (symptoms only) | 1 | 520 | Risk Ratio (M‐H, Fixed, 95% CI) | 0.94 [0.62, 1.42] |
| 8.3 mixed incontinence | 0 | 0 | Risk Ratio (M‐H, Fixed, 95% CI) | 0.0 [0.0, 0.0] |
| 9 Number of women with urinary incontinence after 5 years (clinician's observations) Show forest plot | 2 | 461 | Risk Ratio (M‐H, Fixed, 95% CI) | 0.90 [0.80, 1.01] |
| 9.1 urodynamic stress incontinence (only) | 1 | 28 | Risk Ratio (M‐H, Fixed, 95% CI) | 0.23 [0.01, 4.37] |
| 9.2 stress urinary incontinence (symptoms only) | 1 | 433 | Risk Ratio (M‐H, Fixed, 95% CI) | 0.91 [0.81, 1.02] |
| 9.3 mixed incontinence | 0 | 0 | Risk Ratio (M‐H, Fixed, 95% CI) | 0.0 [0.0, 0.0] |
| 10 Duration of operation (minutes) Show forest plot | 1 | Mean Difference (IV, Fixed, 95% CI) | Totals not selected | |
| 10.1 urodynamic stress incontinence (only) | 1 | Mean Difference (IV, Fixed, 95% CI) | 0.0 [0.0, 0.0] | |
| 10.2 stress urinary incontinence (symptoms only) | 0 | Mean Difference (IV, Fixed, 95% CI) | 0.0 [0.0, 0.0] | |
| 10.3 mixed incontinence | 0 | Mean Difference (IV, Fixed, 95% CI) | 0.0 [0.0, 0.0] | |
| 11 Length of hospital stay (days) Show forest plot | 3 | 137 | Mean Difference (IV, Fixed, 95% CI) | 2.03 [1.47, 2.59] |
| 11.1 urodynamic stress incontinence (only) | 3 | 137 | Mean Difference (IV, Fixed, 95% CI) | 2.03 [1.47, 2.59] |
| 11.2 stress urinary incontinence (symptoms only) | 0 | 0 | Mean Difference (IV, Fixed, 95% CI) | 0.0 [0.0, 0.0] |
| 11.3 mixed incontinence | 0 | 0 | Mean Difference (IV, Fixed, 95% CI) | 0.0 [0.0, 0.0] |
| 12 Time to catheter removal (days) Show forest plot | 2 | 108 | Mean Difference (IV, Fixed, 95% CI) | 8.01 [6.84, 9.18] |
| 12.1 urodynamic stress incontinence (only) | 2 | 108 | Mean Difference (IV, Fixed, 95% CI) | 8.01 [6.84, 9.18] |
| 12.2 stress urinary incontinence (symptoms only) | 0 | 0 | Mean Difference (IV, Fixed, 95% CI) | 0.0 [0.0, 0.0] |
| 12.3 mixed incontinence | 0 | 0 | Mean Difference (IV, Fixed, 95% CI) | 0.0 [0.0, 0.0] |
| 13 Time to return to normal activity level | 0 | 0 | Mean Difference (IV, Fixed, 95% CI) | 0.0 [0.0, 0.0] |
| 13.1 urodynamic stress incontinence (only) | 0 | 0 | Mean Difference (IV, Fixed, 95% CI) | 0.0 [0.0, 0.0] |
| 13.2 stress urinary incontinence (symptoms only) | 0 | 0 | Mean Difference (IV, Fixed, 95% CI) | 0.0 [0.0, 0.0] |
| 13.3 mixed incontinence | 0 | 0 | Mean Difference (IV, Fixed, 95% CI) | 0.0 [0.0, 0.0] |
| 14 Number of women requiring treatment for pelvic organ prolapse Show forest plot | 3 | 559 | Risk Ratio (M‐H, Fixed, 95% CI) | 0.20 [0.05, 0.77] |
| 14.1 urodynamic stress incontinence (only) | 2 | 106 | Risk Ratio (M‐H, Fixed, 95% CI) | 0.2 [0.04, 1.11] |
| 14.2 stress urinary incontinence (symptoms only) | 1 | 453 | Risk Ratio (M‐H, Fixed, 95% CI) | 0.20 [0.02, 1.74] |
| 14.3 mixed incontinence | 0 | 0 | Risk Ratio (M‐H, Fixed, 95% CI) | 0.0 [0.0, 0.0] |
| 15 Perioperative surgical complications Show forest plot | 4 | 792 | Risk Ratio (M‐H, Fixed, 95% CI) | 1.24 [0.83, 1.86] |
| 15.1 urodynamic stress incontinence (only) | 3 | 137 | Risk Ratio (M‐H, Fixed, 95% CI) | 0.85 [0.28, 2.52] |
| 15.2 stress urinary incontinence (symptoms only) | 1 | 655 | Risk Ratio (M‐H, Fixed, 95% CI) | 1.32 [0.86, 2.04] |
| 15.3 mixed incontinence | 0 | 0 | Risk Ratio (M‐H, Fixed, 95% CI) | 0.0 [0.0, 0.0] |
| 16 Bladder perforation Show forest plot | 1 | Risk Ratio (M‐H, Fixed, 95% CI) | Totals not selected | |
| 16.1 urodynamic stress incontinence (only) | 0 | Risk Ratio (M‐H, Fixed, 95% CI) | 0.0 [0.0, 0.0] | |
| 16.2 stress urinary incontinence (symptoms only) | 1 | Risk Ratio (M‐H, Fixed, 95% CI) | 0.0 [0.0, 0.0] | |
| 16.3 mixed incontinence | 0 | Risk Ratio (M‐H, Fixed, 95% CI) | 0.0 [0.0, 0.0] | |
| 17 Urinary tract infection Show forest plot | 1 | Risk Ratio (M‐H, Fixed, 95% CI) | Totals not selected | |
| 17.1 urodynamic stress incontinence (only) | 0 | Risk Ratio (M‐H, Fixed, 95% CI) | 0.0 [0.0, 0.0] | |
| 17.2 stress urinary incontinence (symptoms only) | 1 | Risk Ratio (M‐H, Fixed, 95% CI) | 0.0 [0.0, 0.0] | |
| 17.3 mixed incontinence | 0 | Risk Ratio (M‐H, Fixed, 95% CI) | 0.0 [0.0, 0.0] | |
| 18 Number of women with recurrent UTIs at > 5 years Show forest plot | 1 | Risk Ratio (M‐H, Fixed, 95% CI) | Totals not selected | |
| 18.1 urodynamic stress incontinence (only) | 0 | Risk Ratio (M‐H, Fixed, 95% CI) | 0.0 [0.0, 0.0] | |
| 18.2 stress urinary incontinence (symptoms only) | 1 | Risk Ratio (M‐H, Fixed, 95% CI) | 0.0 [0.0, 0.0] | |
| 18.3 mixed incontinence | 0 | Risk Ratio (M‐H, Fixed, 95% CI) | 0.0 [0.0, 0.0] | |
| 19 Urinary urgency symptoms, urgency urinary incontinence Show forest plot | 2 | 525 | Risk Ratio (M‐H, Fixed, 95% CI) | 1.10 [0.74, 1.64] |
| 19.1 urodynamic stress incontinence (only) | 1 | 72 | Risk Ratio (M‐H, Fixed, 95% CI) | 2.0 [0.54, 7.39] |
| 19.2 stress urinary incontinence (symptoms only) | 1 | 453 | Risk Ratio (M‐H, Fixed, 95% CI) | 1.02 [0.67, 1.56] |
| 19.3 mixed incontinence | 0 | 0 | Risk Ratio (M‐H, Fixed, 95% CI) | 0.0 [0.0, 0.0] |
| 20 Detrusor overactivity (urodynamic diagnosis) Show forest plot | 4 | 203 | Risk Ratio (M‐H, Fixed, 95% CI) | 1.42 [0.52, 3.87] |
| 20.1 urodynamic stress incontinence (only) | 4 | 203 | Risk Ratio (M‐H, Fixed, 95% CI) | 1.42 [0.52, 3.87] |
| 20.2 stress urinary incontinence (symptoms only) | 0 | 0 | Risk Ratio (M‐H, Fixed, 95% CI) | 0.0 [0.0, 0.0] |
| 20.3 mixed incontinence | 0 | 0 | Risk Ratio (M‐H, Fixed, 95% CI) | 0.0 [0.0, 0.0] |
| 21 Voiding dysfunction after 3 months Show forest plot | 5 | 853 | Risk Ratio (M‐H, Fixed, 95% CI) | 6.08 [3.10, 11.95] |
| 21.1 urodynamic stress incontinence (only) | 4 | 198 | Risk Ratio (M‐H, Fixed, 95% CI) | 4.48 [1.16, 17.36] |
| 21.2 stress urinary incontinence (symptoms only) | 1 | 655 | Risk Ratio (M‐H, Fixed, 95% CI) | 6.63 [3.04, 14.47] |
| 21.3 mixed incontinence | 0 | 0 | Risk Ratio (M‐H, Fixed, 95% CI) | 0.0 [0.0, 0.0] |
| 22 Long‐term voiding dysfunction > 5 years Show forest plot | 1 | Risk Ratio (M‐H, Fixed, 95% CI) | Totals not selected | |
| 22.1 urodynamic stress incontinence (only) | 0 | Risk Ratio (M‐H, Fixed, 95% CI) | 0.0 [0.0, 0.0] | |
| 22.2 stress urinary incontinence (symptoms only) | 1 | Risk Ratio (M‐H, Fixed, 95% CI) | 0.0 [0.0, 0.0] | |
| 22.3 mixed incontinence | 0 | Risk Ratio (M‐H, Fixed, 95% CI) | 0.0 [0.0, 0.0] | |
| 23 Condition‐specific measures to assess quality of life Show forest plot | 1 | Mean Difference (IV, Fixed, 95% CI) | Totals not selected | |
| 23.1 Urinary Distress Index (UDI) | 1 | Mean Difference (IV, Fixed, 95% CI) | 0.0 [0.0, 0.0] | |
| 23.2 Incontinence Impact Questionnaire (IIQ) | 1 | Mean Difference (IV, Fixed, 95% CI) | 0.0 [0.0, 0.0] | |
| Outcome or subgroup title | No. of studies | No. of participants | Statistical method | Effect size |
| 1 Number of continent women within 1 year (any definition) Show forest plot | 11 | 841 | Odds Ratio (M‐H, Fixed, 95% CI) | 0.94 [0.67, 1.32] |
| 1.1 urodynamic stress incontinence (only) | 5 | 427 | Odds Ratio (M‐H, Fixed, 95% CI) | 0.97 [0.60, 1.56] |
| 1.2 stress urinary incontinence (symptoms only) | 1 | 53 | Odds Ratio (M‐H, Fixed, 95% CI) | 0.88 [0.12, 6.79] |
| 1.3 mixed urinary incontinence | 5 | 361 | Odds Ratio (M‐H, Fixed, 95% CI) | 0.91 [0.55, 1.51] |
| 2 Number of continent women at 1 to 5 years (any definition) Show forest plot | 6 | 458 | Odds Ratio (M‐H, Fixed, 95% CI) | 0.67 [0.44, 1.02] |
| 2.1 urodynamic stress incontinence (only) | 4 | 364 | Odds Ratio (M‐H, Fixed, 95% CI) | 0.77 [0.47, 1.25] |
| 2.2 stress urinary incontinence (symptoms only) | 0 | 0 | Odds Ratio (M‐H, Fixed, 95% CI) | 0.0 [0.0, 0.0] |
| 2.3 mixed urinary incontinence | 2 | 94 | Odds Ratio (M‐H, Fixed, 95% CI) | 0.42 [0.17, 1.04] |
| 3 Number of continent women after 5 years (any definition) Show forest plot | 1 | Odds Ratio (M‐H, Fixed, 95% CI) | Totals not selected | |
| 3.1 urodynamic stress incontinence (only) | 1 | Odds Ratio (M‐H, Fixed, 95% CI) | 0.0 [0.0, 0.0] | |
| 3.2 stress urinary incontinence (symptoms only) | 0 | Odds Ratio (M‐H, Fixed, 95% CI) | 0.0 [0.0, 0.0] | |
| 3.3 mixed urinary incontinence | 0 | Odds Ratio (M‐H, Fixed, 95% CI) | 0.0 [0.0, 0.0] | |
| 4 Repeat surgery for urinary incontinence Show forest plot | 1 | Risk Ratio (M‐H, Fixed, 95% CI) | Totals not selected | |
| 4.1 urodynamic stress incontinence (only) | 1 | Risk Ratio (M‐H, Fixed, 95% CI) | 0.0 [0.0, 0.0] | |
| 4.2 stress urinary incontinence (symptoms only) | 1 | Risk Ratio (M‐H, Fixed, 95% CI) | 0.0 [0.0, 0.0] | |
| 4.3 mixed incontinence | 0 | Risk Ratio (M‐H, Fixed, 95% CI) | 0.0 [0.0, 0.0] | |
| 5 Number of women cured after first year (women's observations) Show forest plot | 4 | 337 | Odds Ratio (M‐H, Fixed, 95% CI) | 1.06 [0.65, 1.72] |
| 5.1 urodynamic stress incontinence (only) | 3 | 293 | Odds Ratio (M‐H, Fixed, 95% CI) | 1.21 [0.72, 2.03] |
| 5.2 stress urinary incontinence (symptoms only) | 0 | 0 | Odds Ratio (M‐H, Fixed, 95% CI) | 0.0 [0.0, 0.0] |
| 5.3 mixed urinary incontinence | 1 | 44 | Odds Ratio (M‐H, Fixed, 95% CI) | 0.42 [0.10, 1.72] |
| 6 Number of women improved or cured within 1 year (women's observations) Show forest plot | 3 | 425 | Odds Ratio (M‐H, Fixed, 95% CI) | 1.33 [0.74, 2.39] |
| 6.1 urodynamic stress incontinence (only) | 2 | 286 | Odds Ratio (M‐H, Fixed, 95% CI) | 1.06 [0.43, 2.64] |
| 6.2 stress urinary incontinence (symptoms only) | 0 | 0 | Odds Ratio (M‐H, Fixed, 95% CI) | 0.0 [0.0, 0.0] |
| 6.3 mixed urinary incontinence | 1 | 139 | Odds Ratio (M‐H, Fixed, 95% CI) | 1.56 [0.72, 3.39] |
| 7 Number of women improved or cured at 1 to 5 years (women's observations) Show forest plot | 2 | 264 | Odds Ratio (M‐H, Fixed, 95% CI) | 0.76 [0.31, 1.87] |
| 7.1 urodynamic stress incontinence (only) | 2 | 264 | Odds Ratio (M‐H, Fixed, 95% CI) | 0.76 [0.31, 1.87] |
| 7.2 stress urinary incontinence (symptoms only) | 0 | 0 | Odds Ratio (M‐H, Fixed, 95% CI) | 0.0 [0.0, 0.0] |
| 7.3 mixed urinary incontinence | 0 | 0 | Odds Ratio (M‐H, Fixed, 95% CI) | 0.0 [0.0, 0.0] |
| 8 Number of women improved or cured after 5 years (women's observations) Show forest plot | 1 | Odds Ratio (M‐H, Fixed, 95% CI) | Totals not selected | |
| 8.1 urodynamic stress incontinence (only) | 1 | Odds Ratio (M‐H, Fixed, 95% CI) | 0.0 [0.0, 0.0] | |
| 8.2 stress urinary incontinence (symptoms only) | 0 | Odds Ratio (M‐H, Fixed, 95% CI) | 0.0 [0.0, 0.0] | |
| 8.3 mixed urinary incontinence | 0 | Odds Ratio (M‐H, Fixed, 95% CI) | 0.0 [0.0, 0.0] | |
| 9 Number of women satisfied (women's observations) Show forest plot | 2 | Risk Ratio (M‐H, Fixed, 95% CI) | Subtotals only | |
| 9.1 urodynamic stress incontinence (only) | 2 | 163 | Risk Ratio (M‐H, Fixed, 95% CI) | 1.09 [0.89, 1.33] |
| 9.2 stress urinary incontinence (symptoms only) | 0 | 0 | Risk Ratio (M‐H, Fixed, 95% CI) | 0.0 [0.0, 0.0] |
| 9.3 mixed urinary incontinence | 0 | 0 | Risk Ratio (M‐H, Fixed, 95% CI) | 0.0 [0.0, 0.0] |
| 10 Pad test of quantified leakage (mean weight of urine lost) Show forest plot | 1 | Mean Difference (IV, Fixed, 95% CI) | Totals not selected | |
| 10.1 urodynamic stress incontinence (only) | 1 | Mean Difference (IV, Fixed, 95% CI) | 0.0 [0.0, 0.0] | |
| 10.2 stress urinary incontinence (symptoms only) | 0 | Mean Difference (IV, Fixed, 95% CI) | 0.0 [0.0, 0.0] | |
| 10.3 mixed urinary incontinence | 0 | Mean Difference (IV, Fixed, 95% CI) | 0.0 [0.0, 0.0] | |
| 11 Number of women with urinary incontinence within first year (clinician's observations) Show forest plot | 2 | 105 | Risk Ratio (M‐H, Fixed, 95% CI) | 1.29 [0.45, 3.71] |
| 11.1 urodynamic stress incontinence (only) | 0 | 0 | Risk Ratio (M‐H, Fixed, 95% CI) | 0.0 [0.0, 0.0] |
| 11.2 stress urinary incontinence (symptoms only) | 0 | 0 | Risk Ratio (M‐H, Fixed, 95% CI) | 0.0 [0.0, 0.0] |
| 11.3 mixed urinary incontinence | 2 | 105 | Risk Ratio (M‐H, Fixed, 95% CI) | 1.29 [0.45, 3.71] |
| 12 Number of women with urinary incontinence at 1 to 5 years (any definition) (clinician's observations) Show forest plot | 1 | Risk Ratio (M‐H, Fixed, 95% CI) | Totals not selected | |
| 12.1 urodynamic stress incontinence (only) | 0 | Risk Ratio (M‐H, Fixed, 95% CI) | 0.0 [0.0, 0.0] | |
| 12.2 stress urinary incontinence (symptoms only) | 0 | Risk Ratio (M‐H, Fixed, 95% CI) | 0.0 [0.0, 0.0] | |
| 12.3 mixed urinary incontinence | 1 | Risk Ratio (M‐H, Fixed, 95% CI) | 0.0 [0.0, 0.0] | |
| 13 Duration of operation (minutes) Show forest plot | 7 | 355 | Mean Difference (IV, Fixed, 95% CI) | 57.08 [54.67, 59.49] |
| 13.1 urodynamic stress incontinence (only) | 2 | 61 | Mean Difference (IV, Fixed, 95% CI) | 46.91 [42.31, 51.52] |
| 13.2 stress urinary incontinence (symptoms only) | 1 | 53 | Mean Difference (IV, Fixed, 95% CI) | 20.0 [7.08, 32.92] |
| 13.3 mixed urinary incontinence | 4 | 241 | Mean Difference (IV, Fixed, 95% CI) | 62.96 [60.07, 65.86] |
| 14 Length of hospital stay (days) Show forest plot | 4 | 194 | Mean Difference (IV, Fixed, 95% CI) | 0.74 [0.55, 0.93] |
| 14.1 urodynamic stress incontinence (only) | 1 | 20 | Mean Difference (IV, Fixed, 95% CI) | 0.65 [0.39, 0.91] |
| 14.2 stress urinary incontinence (symptoms only) | 0 | 0 | Mean Difference (IV, Fixed, 95% CI) | 0.0 [0.0, 0.0] |
| 14.3 mixed urinary incontinence | 3 | 174 | Mean Difference (IV, Fixed, 95% CI) | 0.83 [0.56, 1.10] |
| 15 Time to catheter removal (days) Show forest plot | 2 | 113 | Mean Difference (IV, Fixed, 95% CI) | 0.11 [‐0.07, 0.30] |
| 15.1 urodynamic stress incontinence (only) | 0 | 0 | Mean Difference (IV, Fixed, 95% CI) | 0.0 [0.0, 0.0] |
| 15.2 stress urinary incontinence (symptoms only) | 1 | 53 | Mean Difference (IV, Fixed, 95% CI) | 2.3 [0.01, 4.59] |
| 15.3 mixed urinary incontinence | 1 | 60 | Mean Difference (IV, Fixed, 95% CI) | 0.10 [‐0.09, 0.29] |
| 16 Perioperative surgical complications Show forest plot | 4 | 293 | Risk Ratio (M‐H, Fixed, 95% CI) | 1.74 [1.16, 2.60] |
| 16.1 urodynamic stress incontinence (only) | 2 | 183 | Risk Ratio (M‐H, Fixed, 95% CI) | 1.73 [1.01, 2.96] |
| 16.2 stress urinary incontinence (symptoms only) | 0 | 0 | Risk Ratio (M‐H, Fixed, 95% CI) | 0.0 [0.0, 0.0] |
| 16.3 mixed urinary incontinence | 2 | 110 | Risk Ratio (M‐H, Fixed, 95% CI) | 1.74 [0.94, 3.21] |
| 17 Bladder perforations Show forest plot | 10 | 844 | Risk Ratio (M‐H, Fixed, 95% CI) | 0.59 [0.34, 1.01] |
| 17.1 urodynamic stress incontinence (only) | 3 | 334 | Risk Ratio (M‐H, Fixed, 95% CI) | 0.74 [0.19, 2.86] |
| 17.2 stress urinary incontinence (symptoms only) | 1 | 53 | Risk Ratio (M‐H, Fixed, 95% CI) | 0.56 [0.05, 5.81] |
| 17.3 mixed urinary incontinence | 6 | 457 | Risk Ratio (M‐H, Fixed, 95% CI) | 0.56 [0.30, 1.03] |
| 18 Urethral injury Show forest plot | 1 | Risk Ratio (M‐H, Fixed, 95% CI) | Totals not selected | |
| 18.1 urodynamic stress incontinence (only) | 0 | Risk Ratio (M‐H, Fixed, 95% CI) | 0.0 [0.0, 0.0] | |
| 18.2 stress urinary incontinence (symptoms only) | 0 | Risk Ratio (M‐H, Fixed, 95% CI) | 0.0 [0.0, 0.0] | |
| 18.3 mixed urinary incontinence | 1 | Risk Ratio (M‐H, Fixed, 95% CI) | 0.0 [0.0, 0.0] | |
| 19 Vaginal bleeding Show forest plot | 1 | Risk Ratio (M‐H, Fixed, 95% CI) | Totals not selected | |
| 19.1 urodynamic stress incontinence (only) | 0 | Risk Ratio (M‐H, Fixed, 95% CI) | 0.0 [0.0, 0.0] | |
| 19.2 stress urinary incontinence (symptoms only) | 0 | Risk Ratio (M‐H, Fixed, 95% CI) | 0.0 [0.0, 0.0] | |
| 19.3 mixed urinary incontinence | 1 | Risk Ratio (M‐H, Fixed, 95% CI) | 0.0 [0.0, 0.0] | |
| 20 Urinary tract infection Show forest plot | 1 | Risk Ratio (M‐H, Fixed, 95% CI) | Totals not selected | |
| 20.1 urodynamic stress incontinence (only) | 0 | Risk Ratio (M‐H, Fixed, 95% CI) | 0.0 [0.0, 0.0] | |
| 20.2 stress urinary incontinence (symptoms only) | 0 | Risk Ratio (M‐H, Fixed, 95% CI) | 0.0 [0.0, 0.0] | |
| 20.3 mixed urinary incontinence | 1 | Risk Ratio (M‐H, Fixed, 95% CI) | 0.0 [0.0, 0.0] | |
| 21 Voiding dysfunction Show forest plot | 8 | 629 | Risk Ratio (M‐H, Fixed, 95% CI) | 1.34 [0.85, 2.12] |
| 21.1 urodynamic stress incontinence (only) | 3 | 325 | Risk Ratio (M‐H, Fixed, 95% CI) | 1.22 [0.60, 2.46] |
| 21.2 stress urinary incontinence (symptoms only) | 1 | 53 | Risk Ratio (M‐H, Fixed, 95% CI) | 2.61 [0.76, 9.03] |
| 21.3 mixed urinary incontinence | 4 | 251 | Risk Ratio (M‐H, Fixed, 95% CI) | 1.18 [0.58, 2.40] |
| 22 Urinary urgency symptoms, urgency urinary incontinence Show forest plot | 4 | 295 | Risk Ratio (M‐H, Fixed, 95% CI) | 1.50 [0.58, 3.88] |
| 22.1 urodynamic stress incontinence (only) | 1 | 124 | Risk Ratio (M‐H, Fixed, 95% CI) | 0.34 [0.01, 8.29] |
| 22.2 stress urinary incontinence (symptoms only) | 0 | 0 | Risk Ratio (M‐H, Fixed, 95% CI) | 0.0 [0.0, 0.0] |
| 22.3 mixed urinary incontinence | 3 | 171 | Risk Ratio (M‐H, Fixed, 95% CI) | 1.81 [0.65, 5.06] |
| 23 De novo detrusor overactivity (urodynamic diagnosis) Show forest plot | 4 | 325 | Risk Ratio (M‐H, Fixed, 95% CI) | 2.61 [1.17, 5.84] |
| 23.1 urodynamic stress incontinence (only) | 1 | 59 | Risk Ratio (M‐H, Fixed, 95% CI) | 0.0 [0.0, 0.0] |
| 23.2 stress urinary incontinence (symptoms only) | 1 | 47 | Risk Ratio (M‐H, Fixed, 95% CI) | 3.13 [0.13, 73.01] |
| 23.3 mixed urinary incontinence | 2 | 219 | Risk Ratio (M‐H, Fixed, 95% CI) | 2.57 [1.12, 5.92] |
| 24 Long‐term adverse effects (release of sling required) Show forest plot | 3 | 326 | Risk Ratio (M‐H, Fixed, 95% CI) | 2.53 [0.87, 7.35] |
| 24.1 urodynamic stress incontinence (only) | 2 | 266 | Risk Ratio (M‐H, Fixed, 95% CI) | 1.68 [0.50, 5.66] |
| 24.2 stress urinary incontinence (symptoms only) | 0 | 0 | Risk Ratio (M‐H, Fixed, 95% CI) | 0.0 [0.0, 0.0] |
| 24.3 mixed urinary incontinence | 1 | 60 | Risk Ratio (M‐H, Fixed, 95% CI) | 9.6 [0.54, 170.84] |
| 25 Long‐term adverse effects (wound pain at 6 months) Show forest plot | 3 | 257 | Risk Ratio (M‐H, Fixed, 95% CI) | 6.40 [1.94, 21.12] |
| 25.1 urodynamic stress incontinence (only) | 1 | 124 | Risk Ratio (M‐H, Fixed, 95% CI) | 5.16 [0.25, 105.36] |
| 25.2 stress urinary incontinence (symptoms only) | 1 | 53 | Risk Ratio (M‐H, Fixed, 95% CI) | 3.92 [0.90, 17.15] |
| 25.3 mixed urinary incontinence | 1 | 80 | Risk Ratio (M‐H, Fixed, 95% CI) | 17.0 [1.01, 284.96] |
| 26 Long‐term adverse effects (vaginal mesh or graft exposure) Show forest plot | 5 | 348 | Risk Ratio (M‐H, Fixed, 95% CI) | 0.28 [0.05, 1.65] |
| 26.1 urodynamic stress incontinence (only) | 2 | 165 | Risk Ratio (M‐H, Fixed, 95% CI) | 0.35 [0.04, 3.24] |
| 26.2 stress urinary incontinence (symptoms only) | 1 | 53 | Risk Ratio (M‐H, Fixed, 95% CI) | 0.0 [0.0, 0.0] |
| 26.3 mixed urinary incontinence | 2 | 130 | Risk Ratio (M‐H, Fixed, 95% CI) | 0.2 [0.01, 3.97] |
| 27 Condition‐specific measures to assess quality of life: UDI‐6 Show forest plot | 1 | 63 | Mean Difference (IV, Fixed, 95% CI) | 7.30 [‐2.00, 16.60] |
| 27.1 urodynamic stress incontinence (only) | 0 | 0 | Mean Difference (IV, Fixed, 95% CI) | 0.0 [0.0, 0.0] |
| 27.2 stress urinary incontinence (symptoms only) | 1 | 63 | Mean Difference (IV, Fixed, 95% CI) | 7.30 [‐2.00, 16.60] |
| 27.3 mixed urinary incontinence | 0 | 0 | Mean Difference (IV, Fixed, 95% CI) | 0.0 [0.0, 0.0] |
| 28 Condition‐specific measures to assess quality of life: IIQ‐7 Show forest plot | 1 | 63 | Mean Difference (IV, Fixed, 95% CI) | 0.60 [‐10.17, 11.37] |
| 28.1 urodynamic stress incontinence (only) | 0 | 0 | Mean Difference (IV, Fixed, 95% CI) | 0.0 [0.0, 0.0] |
| 28.2 stress urinary incontinence (symptoms only) | 1 | 63 | Mean Difference (IV, Fixed, 95% CI) | 0.60 [‐10.17, 11.37] |
| 28.3 mixed urinary incontinence | 0 | 0 | Mean Difference (IV, Fixed, 95% CI) | 0.0 [0.0, 0.0] |
| Outcome or subgroup title | No. of studies | No. of participants | Statistical method | Effect size |
| 1 Number of continent women at 1 to 5 years (any definition) Show forest plot | 1 | Odds Ratio (M‐H, Fixed, 95% CI) | Totals not selected | |
| 1.1 urodynamic stress incontinence (only) | 1 | Odds Ratio (M‐H, Fixed, 95% CI) | 0.0 [0.0, 0.0] | |
| 1.2 stress urinary incontinence (symptoms only) | 0 | Odds Ratio (M‐H, Fixed, 95% CI) | 0.0 [0.0, 0.0] | |
| 1.3 mixed incontinence | 0 | Odds Ratio (M‐H, Fixed, 95% CI) | 0.0 [0.0, 0.0] | |
| 2 Number of women cured after first year (women's observations) Show forest plot | 1 | Odds Ratio (M‐H, Fixed, 95% CI) | Totals not selected | |
| 2.1 urodynamic stress incontinence (only) | 1 | Odds Ratio (M‐H, Fixed, 95% CI) | 0.0 [0.0, 0.0] | |
| 2.2 stress urinary incontinence (symptoms only) | 0 | Odds Ratio (M‐H, Fixed, 95% CI) | 0.0 [0.0, 0.0] | |
| 2.3 mixed incontinence | 0 | Odds Ratio (M‐H, Fixed, 95% CI) | 0.0 [0.0, 0.0] | |
| 3 Number of women satisfied (women's observations) Show forest plot | 1 | Risk Ratio (M‐H, Fixed, 95% CI) | Totals not selected | |
| 3.1 urodynamic stress incontinence (only) | 1 | Risk Ratio (M‐H, Fixed, 95% CI) | 0.0 [0.0, 0.0] | |
| 3.2 stress urinary incontinence (symptoms only) | 0 | Risk Ratio (M‐H, Fixed, 95% CI) | 0.0 [0.0, 0.0] | |
| 3.3 mixed incontinence | 0 | Risk Ratio (M‐H, Fixed, 95% CI) | 0.0 [0.0, 0.0] | |
| 4 Number of women with urinary incontinence (clinician's observations) within first year Show forest plot | 1 | Risk Ratio (M‐H, Fixed, 95% CI) | Totals not selected | |
| 4.1 urodynamic stress incontinence (only) | 1 | Risk Ratio (M‐H, Fixed, 95% CI) | 0.0 [0.0, 0.0] | |
| 4.2 stress urinary incontinence (symptoms only) | 0 | Risk Ratio (M‐H, Fixed, 95% CI) | 0.0 [0.0, 0.0] | |
| 4.3 mixed incontinence | 0 | Risk Ratio (M‐H, Fixed, 95% CI) | 0.0 [0.0, 0.0] | |
| 5 Bladder perforation Show forest plot | 1 | Risk Ratio (M‐H, Fixed, 95% CI) | Totals not selected | |
| 5.1 urodynamic stress incontinence (only) | 1 | Risk Ratio (M‐H, Fixed, 95% CI) | 0.0 [0.0, 0.0] | |
| 5.2 stress urinary incontinence (symptoms only) | 0 | Risk Ratio (M‐H, Fixed, 95% CI) | 0.0 [0.0, 0.0] | |
| 5.3 mixed incontinence | 0 | Risk Ratio (M‐H, Fixed, 95% CI) | 0.0 [0.0, 0.0] | |
| 6 Urinary urgency symptoms, urgency urinary incontinence Show forest plot | 1 | Risk Ratio (M‐H, Fixed, 95% CI) | Totals not selected | |
| 6.1 urodynamic stress incontinence (only) | 1 | Risk Ratio (M‐H, Fixed, 95% CI) | 0.0 [0.0, 0.0] | |
| 6.2 stress urinary incontinence (symptoms only) | 0 | Risk Ratio (M‐H, Fixed, 95% CI) | 0.0 [0.0, 0.0] | |
| 6.3 mixed incontinence | 0 | Risk Ratio (M‐H, Fixed, 95% CI) | 0.0 [0.0, 0.0] | |
| 7 Pain with intercourse (dyspareunia) Show forest plot | 1 | Risk Ratio (M‐H, Fixed, 95% CI) | Totals not selected | |
| 7.1 urodynamic stress incontinence (only) | 1 | Risk Ratio (M‐H, Fixed, 95% CI) | 0.0 [0.0, 0.0] | |
| 7.2 stress urinary incontinence (symptoms only) | 0 | Risk Ratio (M‐H, Fixed, 95% CI) | 0.0 [0.0, 0.0] | |
| 7.3 mixed incontinence | 0 | Risk Ratio (M‐H, Fixed, 95% CI) | 0.0 [0.0, 0.0] | |
| 8 Long‐term adverse effects (vaginal mesh or graft exposure) Show forest plot | 1 | Risk Ratio (M‐H, Fixed, 95% CI) | Totals not selected | |
| 8.1 urodynamic stress incontinence (only) | 1 | Risk Ratio (M‐H, Fixed, 95% CI) | 0.0 [0.0, 0.0] | |
| 8.2 stress urinary incontinence (symptoms only) | 0 | Risk Ratio (M‐H, Fixed, 95% CI) | 0.0 [0.0, 0.0] | |
| 8.3 mixed incontinence | 0 | Risk Ratio (M‐H, Fixed, 95% CI) | 0.0 [0.0, 0.0] | |
| 9 Condition‐specific measures to assess quality of life: IIQ score Show forest plot | 1 | Mean Difference (IV, Fixed, 95% CI) | Totals not selected | |
| 9.1 urodynamic stress incontinence (only) | 1 | Mean Difference (IV, Fixed, 95% CI) | 0.0 [0.0, 0.0] | |
| 9.2 stress urinary incontinence (symptoms only) | 0 | Mean Difference (IV, Fixed, 95% CI) | 0.0 [0.0, 0.0] | |
| 9.3 mixed urinary incontinence | 0 | Mean Difference (IV, Fixed, 95% CI) | 0.0 [0.0, 0.0] | |
| Outcome or subgroup title | No. of studies | No. of participants | Statistical method | Effect size |
| 1 Number of continent women within 1 year (any definition) Show forest plot | 5 | Odds Ratio (M‐H, Fixed, 95% CI) | Totals not selected | |
| 1.1 fascial sling vs Pelvicol sling | 1 | Odds Ratio (M‐H, Fixed, 95% CI) | 0.0 [0.0, 0.0] | |
| 1.2 standard sling vs short sling | 1 | Odds Ratio (M‐H, Fixed, 95% CI) | 0.0 [0.0, 0.0] | |
| 1.3 autologous fascial sling vs Fortaperm sling | 1 | Odds Ratio (M‐H, Fixed, 95% CI) | 0.0 [0.0, 0.0] | |
| 1.4 Vypro vs Ultrapro | 1 | Odds Ratio (M‐H, Fixed, 95% CI) | 0.0 [0.0, 0.0] | |
| 1.5 Vypro vs Prolene light | 1 | Odds Ratio (M‐H, Fixed, 95% CI) | 0.0 [0.0, 0.0] | |
| 1.6 Ultrapro vs Prolene light | 1 | Odds Ratio (M‐H, Fixed, 95% CI) | 0.0 [0.0, 0.0] | |
| 1.7 fascial sling vs vaginal wall sling | 1 | Odds Ratio (M‐H, Fixed, 95% CI) | 0.0 [0.0, 0.0] | |
| 2 Number of continent women at 1 to 5 years (any definition) Show forest plot | 7 | Odds Ratio (M‐H, Fixed, 95% CI) | Totals not selected | |
| 2.1 fascial sling vs Pelvicol sling | 1 | Odds Ratio (M‐H, Fixed, 95% CI) | 0.0 [0.0, 0.0] | |
| 2.2 standard sling vs short sling | 1 | Odds Ratio (M‐H, Fixed, 95% CI) | 0.0 [0.0, 0.0] | |
| 2.3 autologous dermal graft patch vs cadaveric fascia lata | 1 | Odds Ratio (M‐H, Fixed, 95% CI) | 0.0 [0.0, 0.0] | |
| 2.4 rectus fascia sling vs Goretex sling | 1 | Odds Ratio (M‐H, Fixed, 95% CI) | 0.0 [0.0, 0.0] | |
| 2.5 Vypro vs Ultrapro | 1 | Odds Ratio (M‐H, Fixed, 95% CI) | 0.0 [0.0, 0.0] | |
| 2.6 Vypro vs Prolene light | 1 | Odds Ratio (M‐H, Fixed, 95% CI) | 0.0 [0.0, 0.0] | |
| 2.7 Ultrapro vs Prolene light | 1 | Odds Ratio (M‐H, Fixed, 95% CI) | 0.0 [0.0, 0.0] | |
| 2.8 anterior vaginal wall sling vs biosynthetic mesh sling | 1 | Odds Ratio (M‐H, Fixed, 95% CI) | 0.0 [0.0, 0.0] | |
| 2.9 anterior rectus sheath sling vs Prolene strip | 1 | Odds Ratio (M‐H, Fixed, 95% CI) | 0.0 [0.0, 0.0] | |
| 2.10 anterior rectus sheath sling vs anterior vaginal wall patch | 1 | Odds Ratio (M‐H, Fixed, 95% CI) | 0.0 [0.0, 0.0] | |
| 2.11 Prolene strip vs anterior vaginal wall patch | 1 | Odds Ratio (M‐H, Fixed, 95% CI) | 0.0 [0.0, 0.0] | |
| 3 Number of continent women after 5 years (any definition) Show forest plot | 1 | Odds Ratio (M‐H, Fixed, 95% CI) | Totals not selected | |
| 3.1 standard sling vs short sling | 1 | Odds Ratio (M‐H, Fixed, 95% CI) | 0.0 [0.0, 0.0] | |
| 4 Repeat surgery for urinary incontinence Show forest plot | 1 | Risk Ratio (M‐H, Fixed, 95% CI) | Totals not selected | |
| 4.1 fascial sling vs Pelvicol sling | 1 | Risk Ratio (M‐H, Fixed, 95% CI) | 0.0 [0.0, 0.0] | |
| 5 Number of women cured after first year (women's observations) Show forest plot | 3 | Odds Ratio (M‐H, Fixed, 95% CI) | Totals not selected | |
| 5.1 fascial sling vs Pelvicol sling | 1 | Odds Ratio (M‐H, Fixed, 95% CI) | 0.0 [0.0, 0.0] | |
| 5.2 standard sling vs short sling | 1 | Odds Ratio (M‐H, Fixed, 95% CI) | 0.0 [0.0, 0.0] | |
| 5.3 autologous dermal graft patch vs cadaveric fascia lata | 1 | Odds Ratio (M‐H, Fixed, 95% CI) | 0.0 [0.0, 0.0] | |
| 6 Number of women improved or cured within first year (women's observations) Show forest plot | 3 | Odds Ratio (M‐H, Fixed, 95% CI) | Totals not selected | |
| 6.1 fascial sling vs Pelvicol sling | 1 | Odds Ratio (M‐H, Fixed, 95% CI) | 0.0 [0.0, 0.0] | |
| 6.2 autologous fascial sling vs Fortaperm sling | 1 | Odds Ratio (M‐H, Fixed, 95% CI) | 0.0 [0.0, 0.0] | |
| 6.3 rectus fascia sling vs Goretex sling | 1 | Odds Ratio (M‐H, Fixed, 95% CI) | 0.0 [0.0, 0.0] | |
| 7 Number of women improved or cured at 1 to 5 years (women's observations) Show forest plot | 4 | Risk Ratio (M‐H, Fixed, 95% CI) | Totals not selected | |
| 7.1 fascial sling vs Pelvicol sling | 1 | Risk Ratio (M‐H, Fixed, 95% CI) | 0.0 [0.0, 0.0] | |
| 7.2 autologous dermal graft patch vs cadaveric fascia lata | 1 | Risk Ratio (M‐H, Fixed, 95% CI) | 0.0 [0.0, 0.0] | |
| 7.3 rectus fascia sling vs Goretex sling | 1 | Risk Ratio (M‐H, Fixed, 95% CI) | 0.0 [0.0, 0.0] | |
| 7.4 anterior rectus sheath sling vs Prolene strip | 1 | Risk Ratio (M‐H, Fixed, 95% CI) | 0.0 [0.0, 0.0] | |
| 7.5 anterior rectus sheath sling vs anterior vaginal wall patch | 1 | Risk Ratio (M‐H, Fixed, 95% CI) | 0.0 [0.0, 0.0] | |
| 7.6 Prolene strip vs anterior vaginal wall patch | 1 | Risk Ratio (M‐H, Fixed, 95% CI) | 0.0 [0.0, 0.0] | |
| 8 Number of women satisfied (women's observations) Show forest plot | 3 | Risk Ratio (M‐H, Fixed, 95% CI) | Totals not selected | |
| 8.1 fascial sling vs Pelvicol sling | 1 | Risk Ratio (M‐H, Fixed, 95% CI) | 0.0 [0.0, 0.0] | |
| 8.2 Vypro vs Ultrapro | 1 | Risk Ratio (M‐H, Fixed, 95% CI) | 0.0 [0.0, 0.0] | |
| 8.3 Vypro vs Prolene light | 1 | Risk Ratio (M‐H, Fixed, 95% CI) | 0.0 [0.0, 0.0] | |
| 8.4 Ultrapro vs Prolene light | 1 | Risk Ratio (M‐H, Fixed, 95% CI) | 0.0 [0.0, 0.0] | |
| 8.5 anterior vaginal wall sling vs biosynthetic mesh sling | 1 | Risk Ratio (M‐H, Fixed, 95% CI) | 0.0 [0.0, 0.0] | |
| 9 Pad test of quantified leakage (mean weight of urine lost) within 1 year Show forest plot | 2 | Mean Difference (IV, Fixed, 95% CI) | Totals not selected | |
| 9.1 standard sling vs short sling | 1 | Mean Difference (IV, Fixed, 95% CI) | 0.0 [0.0, 0.0] | |
| 9.2 Vypro vs Ultrapro | 1 | Mean Difference (IV, Fixed, 95% CI) | 0.0 [0.0, 0.0] | |
| 9.3 Vypro vs Prolene light | 1 | Mean Difference (IV, Fixed, 95% CI) | 0.0 [0.0, 0.0] | |
| 9.4 Ultrapro vs Prolene light | 1 | Mean Difference (IV, Fixed, 95% CI) | 0.0 [0.0, 0.0] | |
| 10 Pad test of quantified leakage (mean weight of urine lost) at 1 to 5 years Show forest plot | 1 | Mean Difference (IV, Fixed, 95% CI) | Totals not selected | |
| 10.1 Vypro vs Ultrapro | 1 | Mean Difference (IV, Fixed, 95% CI) | 0.0 [0.0, 0.0] | |
| 10.2 Vypro vs Prolene light | 1 | Mean Difference (IV, Fixed, 95% CI) | 0.0 [0.0, 0.0] | |
| 10.3 Ultrapro vs Prolene light | 1 | Mean Difference (IV, Fixed, 95% CI) | 0.0 [0.0, 0.0] | |
| 11 Duration of operation (minutes) Show forest plot | 2 | Mean Difference (IV, Fixed, 95% CI) | Totals not selected | |
| 11.1 standard sling vs short sling | 1 | Mean Difference (IV, Fixed, 95% CI) | 0.0 [0.0, 0.0] | |
| 11.2 anterior rectus sheath sling vs Prolene strip | 1 | Mean Difference (IV, Fixed, 95% CI) | 0.0 [0.0, 0.0] | |
| 11.3 anterior rectus sheath sling vs anterior vaginal wall patch | 1 | Mean Difference (IV, Fixed, 95% CI) | 0.0 [0.0, 0.0] | |
| 11.4 Prolene strip vs anterior vaginal wall patch | 1 | Mean Difference (IV, Fixed, 95% CI) | 0.0 [0.0, 0.0] | |
| 12 Blood loss (mL) Show forest plot | 1 | Mean Difference (IV, Fixed, 95% CI) | Totals not selected | |
| 12.1 anterior rectus sheath sling vs Prolene strip | 1 | Mean Difference (IV, Fixed, 95% CI) | 0.0 [0.0, 0.0] | |
| 12.2 anterior rectus sheath sling vs anterior vaginal wall patch | 1 | Mean Difference (IV, Fixed, 95% CI) | 0.0 [0.0, 0.0] | |
| 12.3 Prolene strip vs anterior vaginal wall patch | 1 | Mean Difference (IV, Fixed, 95% CI) | 0.0 [0.0, 0.0] | |
| 13 Length of hospital stay (days) Show forest plot | 1 | Mean Difference (IV, Fixed, 95% CI) | Totals not selected | |
| 13.1 anterior rectus sheath sling vs Prolene strip | 1 | Mean Difference (IV, Fixed, 95% CI) | 0.0 [0.0, 0.0] | |
| 13.2 anterior rectus sheath sling vs anterior vaginal wall patch | 1 | Mean Difference (IV, Fixed, 95% CI) | 0.0 [0.0, 0.0] | |
| 13.3 Prolene strip vs anterior vaginal wall patch | 1 | Mean Difference (IV, Fixed, 95% CI) | 0.0 [0.0, 0.0] | |
| 14 Perioperative surgical complications Show forest plot | 3 | Risk Ratio (M‐H, Fixed, 95% CI) | Totals not selected | |
| 14.1 standard sling vs short sling | 1 | Risk Ratio (M‐H, Fixed, 95% CI) | 0.0 [0.0, 0.0] | |
| 14.2 rectus fascia sling vs Goretex sling | 1 | Risk Ratio (M‐H, Fixed, 95% CI) | 0.0 [0.0, 0.0] | |
| 14.3 fascial sling vs vaginal wall sling | 1 | Risk Ratio (M‐H, Fixed, 95% CI) | 0.0 [0.0, 0.0] | |
| 15 Bladder perforation Show forest plot | 3 | Risk Ratio (M‐H, Fixed, 95% CI) | Totals not selected | |
| 15.1 standard sling vs short sling | 1 | Risk Ratio (M‐H, Fixed, 95% CI) | 0.0 [0.0, 0.0] | |
| 15.2 fascial sling vs Pelvicol sling | 1 | Risk Ratio (M‐H, Fixed, 95% CI) | 0.0 [0.0, 0.0] | |
| 15.3 anterior rectus sheath sling vs Prolene strip | 1 | Risk Ratio (M‐H, Fixed, 95% CI) | 0.0 [0.0, 0.0] | |
| 15.4 anterior rectus sheath sling vs anterior vaginal wall patch | 1 | Risk Ratio (M‐H, Fixed, 95% CI) | 0.0 [0.0, 0.0] | |
| 15.5 Prolene strip vs anterior vaginal wall patch | 1 | Risk Ratio (M‐H, Fixed, 95% CI) | 0.0 [0.0, 0.0] | |
| 16 Urinary tract infection Show forest plot | 2 | Risk Ratio (M‐H, Fixed, 95% CI) | Totals not selected | |
| 16.1 standard sling vs short sling | 1 | Risk Ratio (M‐H, Fixed, 95% CI) | 0.0 [0.0, 0.0] | |
| 16.2 anterior vaginal wall sling vs biosynthetic mesh sling | 1 | Risk Ratio (M‐H, Fixed, 95% CI) | 0.0 [0.0, 0.0] | |
| 17 Vaginal bleeding Show forest plot | 1 | Risk Ratio (M‐H, Fixed, 95% CI) | Totals not selected | |
| 17.1 anterior vaginal wall sling vs biosynthetic mesh sling | 1 | Risk Ratio (M‐H, Fixed, 95% CI) | 0.0 [0.0, 0.0] | |
| 18 Long‐term adverse effects (wound pain) Show forest plot | 1 | Risk Ratio (M‐H, Fixed, 95% CI) | Totals not selected | |
| 18.1 fascial sling vs Pelvicol sling | 1 | Risk Ratio (M‐H, Fixed, 95% CI) | 0.0 [0.0, 0.0] | |
| 19 Voiding dysfunction Show forest plot | 6 | Risk Ratio (M‐H, Fixed, 95% CI) | Totals not selected | |
| 19.1 fascial sling vs Pelvicol sling | 1 | Risk Ratio (M‐H, Fixed, 95% CI) | 0.0 [0.0, 0.0] | |
| 19.2 standard sling vs short sling | 1 | Risk Ratio (M‐H, Fixed, 95% CI) | 0.0 [0.0, 0.0] | |
| 19.3 Vypro vs Ultrapro | 1 | Risk Ratio (M‐H, Fixed, 95% CI) | 0.0 [0.0, 0.0] | |
| 19.4 Vypro vs Prolene light | 1 | Risk Ratio (M‐H, Fixed, 95% CI) | 0.0 [0.0, 0.0] | |
| 19.5 Ultrapro vs Prolene light | 1 | Risk Ratio (M‐H, Fixed, 95% CI) | 0.0 [0.0, 0.0] | |
| 19.6 anterior vaginal wall sling vs biosynthetic mesh sling | 1 | Risk Ratio (M‐H, Fixed, 95% CI) | 0.0 [0.0, 0.0] | |
| 19.7 anterior rectus sheath sling vs Prolene strip | 1 | Risk Ratio (M‐H, Fixed, 95% CI) | 0.0 [0.0, 0.0] | |
| 19.8 anterior rectus sheath sling vs anterior vaginal wall patch | 1 | Risk Ratio (M‐H, Fixed, 95% CI) | 0.0 [0.0, 0.0] | |
| 19.9 Prolene strip vs anterior vaginal wall patch | 1 | Risk Ratio (M‐H, Fixed, 95% CI) | 0.0 [0.0, 0.0] | |
| 19.10 fascial sling vs vaginal wall sling | 1 | Risk Ratio (M‐H, Fixed, 95% CI) | 0.0 [0.0, 0.0] | |
| 20 Urinary urgency symptoms, urgency urinary incontinence Show forest plot | 3 | Risk Ratio (M‐H, Fixed, 95% CI) | Totals not selected | |
| 20.1 standard sling vs short sling | 1 | Risk Ratio (M‐H, Fixed, 95% CI) | 0.0 [0.0, 0.0] | |
| 20.2 Vypro vs Ultrapro | 1 | Risk Ratio (M‐H, Fixed, 95% CI) | 0.0 [0.0, 0.0] | |
| 20.3 Vypro vs Prolene light | 1 | Risk Ratio (M‐H, Fixed, 95% CI) | 0.0 [0.0, 0.0] | |
| 20.4 Ultrapro vs Prolene light | 1 | Risk Ratio (M‐H, Fixed, 95% CI) | 0.0 [0.0, 0.0] | |
| 20.5 rectus fascia sling vs Goretex sling | 1 | Risk Ratio (M‐H, Fixed, 95% CI) | 0.0 [0.0, 0.0] | |
| 21 Detrusor overactivity (urodynamic overactivity) Show forest plot | 1 | Risk Ratio (M‐H, Fixed, 95% CI) | Totals not selected | |
| 21.1 autologous dermal graft patch vs cadaveric fascia lata | 1 | Risk Ratio (M‐H, Fixed, 95% CI) | 0.0 [0.0, 0.0] | |
| 22 Long‐term adverse effects (release of sling required) Show forest plot | 1 | Risk Ratio (M‐H, Fixed, 95% CI) | Totals not selected | |
| 22.1 fascial sling vs Pelvicol sling | 1 | Risk Ratio (M‐H, Fixed, 95% CI) | 0.0 [0.0, 0.0] | |
| 23 Long‐term adverse effects (vaginal mesh or graft exposure) Show forest plot | 3 | Risk Ratio (M‐H, Fixed, 95% CI) | Totals not selected | |
| 23.1 fascial sling vs Pelvicol sling | 1 | Risk Ratio (M‐H, Fixed, 95% CI) | 0.0 [0.0, 0.0] | |
| 23.2 Vypro vs Ultrapro | 1 | Risk Ratio (M‐H, Fixed, 95% CI) | 0.0 [0.0, 0.0] | |
| 23.3 Vypro vs Prolene light | 1 | Risk Ratio (M‐H, Fixed, 95% CI) | 0.0 [0.0, 0.0] | |
| 23.4 Ultrapro vs Prolene light | 1 | Risk Ratio (M‐H, Fixed, 95% CI) | 0.0 [0.0, 0.0] | |
| 23.5 anterior vaginal wall sling vs biosynthetic mesh sling | 1 | Risk Ratio (M‐H, Fixed, 95% CI) | 0.0 [0.0, 0.0] | |
| 24 Condition‐specific measures to assess quality of life (ICI‐Q short form UI score at 1 year) Show forest plot | 1 | Mean Difference (IV, Fixed, 95% CI) | Totals not selected | |
| 24.1 Vypro vs Ultrapro | 1 | Mean Difference (IV, Fixed, 95% CI) | 0.0 [0.0, 0.0] | |
| 24.2 Vypro vs Prolene light | 1 | Mean Difference (IV, Fixed, 95% CI) | 0.0 [0.0, 0.0] | |
| 24.3 Ultrapro vs Prolene light | 1 | Mean Difference (IV, Fixed, 95% CI) | 0.0 [0.0, 0.0] | |
| 25 Condition‐specific measures to assess quality of life (ICI‐Q short form UI score at 1 to 5 years) Show forest plot | 1 | Mean Difference (IV, Fixed, 95% CI) | Totals not selected | |
| 25.1 Vypro vs Ultrapro | 1 | Mean Difference (IV, Fixed, 95% CI) | 0.0 [0.0, 0.0] | |
| 25.2 Vypro vs Prolene light | 1 | Mean Difference (IV, Fixed, 95% CI) | 0.0 [0.0, 0.0] | |
| 25.3 Ultrapro vs Prolene light | 1 | Mean Difference (IV, Fixed, 95% CI) | 0.0 [0.0, 0.0] | |
| Outcome or subgroup title | No. of studies | No. of participants | Statistical method | Effect size |
| 1 Number of women with urinary incontinence (worse, unchanged, or improved) within first year (women's observations) Show forest plot | 1 | Risk Ratio (M‐H, Fixed, 95% CI) | Totals not selected | |
| 1.1 urodynamic stress incontinence (only) | 0 | Risk Ratio (M‐H, Fixed, 95% CI) | 0.0 [0.0, 0.0] | |
| 1.2 stress urinary incontinence (symptoms only) | 0 | Risk Ratio (M‐H, Fixed, 95% CI) | 0.0 [0.0, 0.0] | |
| 1.3 mixed incontinence | 1 | Risk Ratio (M‐H, Fixed, 95% CI) | 0.0 [0.0, 0.0] | |
| 2 Urge urinary symptoms, urgency urinary incontinence Show forest plot | 1 | Risk Ratio (M‐H, Fixed, 95% CI) | Totals not selected | |
| 2.1 urodynamic stress incontinence (only) | 0 | Risk Ratio (M‐H, Fixed, 95% CI) | 0.0 [0.0, 0.0] | |
| 2.2 stress urinary incontinence (symptoms only) | 0 | Risk Ratio (M‐H, Fixed, 95% CI) | 0.0 [0.0, 0.0] | |
| 2.3 mixed incontinence | 1 | Risk Ratio (M‐H, Fixed, 95% CI) | 0.0 [0.0, 0.0] | |
| Outcome or subgroup title | No. of studies | No. of participants | Statistical method | Effect size |
| 1 Number of women with urinary incontinence (worse, unchanged, or improved) within first year (women's observations) Show forest plot | 1 | Risk Ratio (M‐H, Fixed, 95% CI) | Totals not selected | |
| 1.1 urodynamic stress incontinence (only) | 1 | Risk Ratio (M‐H, Fixed, 95% CI) | 0.0 [0.0, 0.0] | |
| 1.2 stress urinary incontinence (symptoms only) | 0 | Risk Ratio (M‐H, Fixed, 95% CI) | 0.0 [0.0, 0.0] | |
| 1.3 mixed urinary incontinence | 0 | Risk Ratio (M‐H, Fixed, 95% CI) | 0.0 [0.0, 0.0] | |
| 2 Number of women with urinary incontinence (worse, unchanged, or improved) after first year (women's observations) Show forest plot | 1 | Risk Ratio (M‐H, Fixed, 95% CI) | Totals not selected | |
| 2.1 urodynamic stress incontinence (only) | 1 | Risk Ratio (M‐H, Fixed, 95% CI) | 0.0 [0.0, 0.0] | |
| 2.2 stress urinary incontinence (symptoms only) | 0 | Risk Ratio (M‐H, Fixed, 95% CI) | 0.0 [0.0, 0.0] | |
| 2.3 mixed urinary incontinence | 0 | Risk Ratio (M‐H, Fixed, 95% CI) | 0.0 [0.0, 0.0] | |
| 3 Number of women with urinary incontinence (clinician's observations) within first year Show forest plot | 1 | Risk Ratio (M‐H, Fixed, 95% CI) | Totals not selected | |
| 3.1 urodynamic stress incontinence (only) | 1 | Risk Ratio (M‐H, Fixed, 95% CI) | 0.0 [0.0, 0.0] | |
| 3.2 stress urinary incontinence (symptoms only) | 0 | Risk Ratio (M‐H, Fixed, 95% CI) | 0.0 [0.0, 0.0] | |
| 3.3 mixed urinary incontinence | 0 | Risk Ratio (M‐H, Fixed, 95% CI) | 0.0 [0.0, 0.0] | |
| 4 CURE: number of women cured after first year (women's observations) Show forest plot | 1 | Odds Ratio (M‐H, Fixed, 95% CI) | Totals not selected | |
| 4.1 urodynamic stress incontinence (only) | 1 | Odds Ratio (M‐H, Fixed, 95% CI) | 0.0 [0.0, 0.0] | |
| 4.2 stress urinary incontinence (symptoms only) | 0 | Odds Ratio (M‐H, Fixed, 95% CI) | 0.0 [0.0, 0.0] | |
| 4.3 mixed urinary incontinence | 0 | Odds Ratio (M‐H, Fixed, 95% CI) | 0.0 [0.0, 0.0] | |
| 5 Voiding dysfunction Show forest plot | 1 | Risk Ratio (M‐H, Fixed, 95% CI) | Totals not selected | |
| 5.1 urodynamic stress incontinence (only) | 1 | Risk Ratio (M‐H, Fixed, 95% CI) | 0.0 [0.0, 0.0] | |
| 5.2 stress urinary incontinence (symptoms only) | 0 | Risk Ratio (M‐H, Fixed, 95% CI) | 0.0 [0.0, 0.0] | |
| 5.3 mixed urinary incontinence | 0 | Risk Ratio (M‐H, Fixed, 95% CI) | 0.0 [0.0, 0.0] | |
| 6 De novo detrusor overactivity (urodynamic diagnosis) Show forest plot | 1 | Risk Ratio (M‐H, Fixed, 95% CI) | Totals not selected | |
| 6.1 urodynamic stress incontinence (only) | 1 | Risk Ratio (M‐H, Fixed, 95% CI) | 0.0 [0.0, 0.0] | |
| 6.2 stress urinary incontinence (symptoms only) | 0 | Risk Ratio (M‐H, Fixed, 95% CI) | 0.0 [0.0, 0.0] | |
| 6.3 mixed urinary incontinence | 0 | Risk Ratio (M‐H, Fixed, 95% CI) | 0.0 [0.0, 0.0] | |
| 7 Urinary tract infection Show forest plot | 1 | Risk Ratio (M‐H, Fixed, 95% CI) | Totals not selected | |
| 7.1 urodynamic stress incontinence (only) | 1 | Risk Ratio (M‐H, Fixed, 95% CI) | 0.0 [0.0, 0.0] | |
| 7.2 stress urinary incontinence (symptoms only) | 0 | Risk Ratio (M‐H, Fixed, 95% CI) | 0.0 [0.0, 0.0] | |
| 7.3 mixed urinary incontinence | 0 | Risk Ratio (M‐H, Fixed, 95% CI) | 0.0 [0.0, 0.0] | |
| 8 Repeat surgery for urinary incontinence Show forest plot | 1 | Risk Ratio (M‐H, Fixed, 95% CI) | Totals not selected | |
| 8.1 urodynamic stress incontinence (only) | 1 | Risk Ratio (M‐H, Fixed, 95% CI) | 0.0 [0.0, 0.0] | |
| 8.2 stress urinary incontinence (symptoms only) | 0 | Risk Ratio (M‐H, Fixed, 95% CI) | 0.0 [0.0, 0.0] | |
| 8.3 mixed urinary incontinence | 0 | Risk Ratio (M‐H, Fixed, 95% CI) | 0.0 [0.0, 0.0] | |
| Outcome or subgroup title | No. of studies | No. of participants | Statistical method | Effect size |
| 1 Number with incontinence (worse, unchanged, or improved) within first year (women's observations) Show forest plot | 1 | Risk Ratio (M‐H, Fixed, 95% CI) | Totals not selected | |
| 1.1 urodynamic stress incontinence (only) | 1 | Risk Ratio (M‐H, Fixed, 95% CI) | 0.0 [0.0, 0.0] | |
| 1.2 stress urinary incontinence (symptoms only) | 0 | Risk Ratio (M‐H, Fixed, 95% CI) | 0.0 [0.0, 0.0] | |
| 1.3 mixed incontinence | 0 | Risk Ratio (M‐H, Fixed, 95% CI) | 0.0 [0.0, 0.0] | |
| 2 Number with incontinence (worse, unchanged, or improved) after first year (women's observations) Show forest plot | 1 | Risk Ratio (M‐H, Fixed, 95% CI) | Totals not selected | |
| 2.1 urodynamic stress incontinence (only) | 1 | Risk Ratio (M‐H, Fixed, 95% CI) | 0.0 [0.0, 0.0] | |
| 2.2 stress urinary incontinence (symptoms only) | 0 | Risk Ratio (M‐H, Fixed, 95% CI) | 0.0 [0.0, 0.0] | |
| 2.3 mixed incontinence | 0 | Risk Ratio (M‐H, Fixed, 95% CI) | 0.0 [0.0, 0.0] | |
| 3 CURE: number of women cured after first year (women's observations) Show forest plot | 1 | Odds Ratio (M‐H, Fixed, 95% CI) | Totals not selected | |
| 3.1 urodynamic stress incontinence (only) | 1 | Odds Ratio (M‐H, Fixed, 95% CI) | 0.0 [0.0, 0.0] | |
| 3.2 stress urinary incontinence (symptoms only) | 0 | Odds Ratio (M‐H, Fixed, 95% CI) | 0.0 [0.0, 0.0] | |
| 3.3 mixed incontinence | 0 | Odds Ratio (M‐H, Fixed, 95% CI) | 0.0 [0.0, 0.0] | |
| 4 Length of hospital stay (hours) Show forest plot | 1 | Mean Difference (IV, Fixed, 95% CI) | Totals not selected | |
| 4.1 urodynamic stress incontinence (only) | 1 | Mean Difference (IV, Fixed, 95% CI) | 0.0 [0.0, 0.0] | |
| 4.2 stress urinary incontinence (symptoms only) | 0 | Mean Difference (IV, Fixed, 95% CI) | 0.0 [0.0, 0.0] | |
| 4.3 mixed incontinence | 0 | Mean Difference (IV, Fixed, 95% CI) | 0.0 [0.0, 0.0] | |
| 5 Perioperative surgical complications Show forest plot | 1 | Risk Ratio (M‐H, Fixed, 95% CI) | Totals not selected | |
| 5.1 urodynamic stress incontinence (only) | 1 | Risk Ratio (M‐H, Fixed, 95% CI) | 0.0 [0.0, 0.0] | |
| 5.2 stress urinary incontinence (symptoms only) | 0 | Risk Ratio (M‐H, Fixed, 95% CI) | 0.0 [0.0, 0.0] | |
| 5.3 mixed incontinence | 0 | Risk Ratio (M‐H, Fixed, 95% CI) | 0.0 [0.0, 0.0] | |
| 6 Urge urinary symptoms, urgency urinary incontinence Show forest plot | 1 | Risk Ratio (M‐H, Fixed, 95% CI) | Totals not selected | |
| 6.1 urodynamic stress incontinence (only) | 1 | Risk Ratio (M‐H, Fixed, 95% CI) | 0.0 [0.0, 0.0] | |
| 6.2 stress urinary incontinence (symptoms only) | 0 | Risk Ratio (M‐H, Fixed, 95% CI) | 0.0 [0.0, 0.0] | |
| 6.3 mixed incontinence | 0 | Risk Ratio (M‐H, Fixed, 95% CI) | 0.0 [0.0, 0.0] | |
| 7 Voiding dysfunction after 3 months Show forest plot | 1 | Risk Ratio (M‐H, Fixed, 95% CI) | Totals not selected | |
| 7.1 urodynamic stress incontinence (only) | 1 | Risk Ratio (M‐H, Fixed, 95% CI) | 0.0 [0.0, 0.0] | |
| 7.2 stress urinary incontinence (symptoms only) | 0 | Risk Ratio (M‐H, Fixed, 95% CI) | 0.0 [0.0, 0.0] | |
| 7.3 mixed incontinence | 0 | Risk Ratio (M‐H, Fixed, 95% CI) | 0.0 [0.0, 0.0] | |
| 8 Detrusor overactivity (urodynamic diagnosis) Show forest plot | 1 | Risk Ratio (M‐H, Fixed, 95% CI) | Totals not selected | |
| 8.1 urodynamic stress incontinence (only) | 1 | Risk Ratio (M‐H, Fixed, 95% CI) | 0.0 [0.0, 0.0] | |
| 8.2 stress urinary incontinence (symptoms only) | 0 | Risk Ratio (M‐H, Fixed, 95% CI) | 0.0 [0.0, 0.0] | |
| 8.3 mixed incontinence | 0 | Risk Ratio (M‐H, Fixed, 95% CI) | 0.0 [0.0, 0.0] | |
| Outcome or subgroup title | No. of studies | No. of participants | Statistical method | Effect size |
| 1 Number of women with urinary incontinence (worse, unchanged, or improved) within first year (women's observations) Show forest plot | 4 | 147 | Risk Ratio (M‐H, Fixed, 95% CI) | 0.40 [0.11, 1.41] |
| 1.1 urodynamic stress incontinence (only) | 4 | 147 | Risk Ratio (M‐H, Fixed, 95% CI) | 0.40 [0.11, 1.41] |
| 1.2 stress urinary incontinence (symptoms only) | 0 | 0 | Risk Ratio (M‐H, Fixed, 95% CI) | 0.0 [0.0, 0.0] |
| 1.3 mixed incontinence | 0 | 0 | Risk Ratio (M‐H, Fixed, 95% CI) | 0.0 [0.0, 0.0] |
| 2 Number not improved (worse or unchanged) within first year (women's observations) | 0 | 0 | Risk Ratio (M‐H, Fixed, 95% CI) | 0.0 [0.0, 0.0] |
| 2.1 urodynamic stress incontinence (only) | 0 | 0 | Risk Ratio (M‐H, Fixed, 95% CI) | 0.0 [0.0, 0.0] |
| 2.2 stress urinary incontinence (symptoms only) | 0 | 0 | Risk Ratio (M‐H, Fixed, 95% CI) | 0.0 [0.0, 0.0] |
| 2.3 mixed incontinence | 0 | 0 | Risk Ratio (M‐H, Fixed, 95% CI) | 0.0 [0.0, 0.0] |
| 3 Number of women with urinary incontinence (worse, unchanged, or improved) at 1 to 5 years (women's observations) Show forest plot | 4 | 687 | Risk Ratio (M‐H, Fixed, 95% CI) | 0.73 [0.61, 0.89] |
| 3.1 urodynamic stress incontinence (only) | 3 | 167 | Risk Ratio (M‐H, Fixed, 95% CI) | 0.58 [0.22, 1.49] |
| 3.2 stress urinary incontinence (symptoms only) | 1 | 520 | Risk Ratio (M‐H, Fixed, 95% CI) | 0.75 [0.62, 0.91] |
| 3.3 mixed incontinence | 0 | 0 | Risk Ratio (M‐H, Fixed, 95% CI) | 0.0 [0.0, 0.0] |
| 4 Number not improved (worse or unchanged) at 1 to 5 years (women's observations) | 0 | 0 | Risk Ratio (M‐H, Fixed, 95% CI) | 0.0 [0.0, 0.0] |
| 4.1 urodynamic stress incontinence (only) | 0 | 0 | Risk Ratio (M‐H, Fixed, 95% CI) | 0.0 [0.0, 0.0] |
| 4.2 stress urinary incontinence (symptoms only) | 0 | 0 | Risk Ratio (M‐H, Fixed, 95% CI) | 0.0 [0.0, 0.0] |
| 4.3 mixed incontinence | 0 | 0 | Risk Ratio (M‐H, Fixed, 95% CI) | 0.0 [0.0, 0.0] |
| 5 Number of women with urinary incontinence (worse, unchanged, or improved) at > 5 years (women's observations) Show forest plot | 2 | 481 | Risk Ratio (M‐H, Fixed, 95% CI) | 0.85 [0.74, 0.98] |
| 5.1 urodynamic stress incontinence (only) | 1 | 28 | Risk Ratio (M‐H, Fixed, 95% CI) | 2.31 [0.24, 22.62] |
| 5.2 stress urinary incontinence (symptoms only) | 1 | 453 | Risk Ratio (M‐H, Fixed, 95% CI) | 0.84 [0.73, 0.97] |
| 5.3 mixed incontinence | 0 | 0 | Risk Ratio (M‐H, Fixed, 95% CI) | 0.0 [0.0, 0.0] |
| 6 CURE: number of women cured at > 1 year (women's observations) Show forest plot | 3 | 515 | Odds Ratio (M‐H, Fixed, 95% CI) | 1.56 [1.07, 2.28] |
| 6.1 urodynamic stress incontinence (only) | 2 | 62 | Odds Ratio (M‐H, Fixed, 95% CI) | 0.93 [0.18, 4.89] |
| 6.2 stress urinary incontinence (symptoms only) | 1 | 453 | Odds Ratio (M‐H, Fixed, 95% CI) | 1.61 [1.09, 2.37] |
| 6.3 mixed incontinence | 0 | 0 | Odds Ratio (M‐H, Fixed, 95% CI) | 0.0 [0.0, 0.0] |
| 7 Number of women not satisfied at > 5 years Show forest plot | 1 | Risk Ratio (M‐H, Fixed, 95% CI) | Totals not selected | |
| 7.1 urodynamic stress incontinence (only) | 0 | Risk Ratio (M‐H, Fixed, 95% CI) | 0.0 [0.0, 0.0] | |
| 7.2 stress urinary incontinence (symptoms only) | 1 | Risk Ratio (M‐H, Fixed, 95% CI) | 0.0 [0.0, 0.0] | |
| 7.3 mixed incontinence | 0 | Risk Ratio (M‐H, Fixed, 95% CI) | 0.0 [0.0, 0.0] | |
| 8 Incontinent episodes over 24 hours | 0 | 0 | Mean Difference (IV, Fixed, 95% CI) | 0.0 [0.0, 0.0] |
| 8.1 urodynamic stress incontinence (only) | 0 | 0 | Mean Difference (IV, Fixed, 95% CI) | 0.0 [0.0, 0.0] |
| 8.2 stress urinary incontinence (symptoms only) | 0 | 0 | Mean Difference (IV, Fixed, 95% CI) | 0.0 [0.0, 0.0] |
| 8.3 mixed incontinence | 0 | 0 | Mean Difference (IV, Fixed, 95% CI) | 0.0 [0.0, 0.0] |
| 9 Number of women with urinary incontinence (clinician's observations) within first year | 0 | 0 | Risk Ratio (M‐H, Fixed, 95% CI) | 0.0 [0.0, 0.0] |
| 9.1 urodynamic stress incontinence (only) | 0 | 0 | Risk Ratio (M‐H, Fixed, 95% CI) | 0.0 [0.0, 0.0] |
| 9.2 stress urinary incontinence (symptoms only) | 0 | 0 | Risk Ratio (M‐H, Fixed, 95% CI) | 0.0 [0.0, 0.0] |
| 9.3 mixed incontinence | 0 | 0 | Risk Ratio (M‐H, Fixed, 95% CI) | 0.0 [0.0, 0.0] |
| 10 Number of women with urinary incontinence (clinician's observations) at 1 to 5 years Show forest plot | 2 | 592 | Risk Ratio (M‐H, Fixed, 95% CI) | 0.90 [0.60, 1.34] |
| 10.1 urodynamic stress incontinence (only) | 1 | 72 | Risk Ratio (M‐H, Fixed, 95% CI) | 0.6 [0.15, 2.33] |
| 10.2 stress urinary incontinence (symptoms only) | 1 | 520 | Risk Ratio (M‐H, Fixed, 95% CI) | 0.94 [0.62, 1.42] |
| 10.3 mixed incontinence | 0 | 0 | Risk Ratio (M‐H, Fixed, 95% CI) | 0.0 [0.0, 0.0] |
| 11 Number of women with urinary incontinence (clinician's observations) at > 5 years Show forest plot | 2 | 461 | Risk Ratio (M‐H, Fixed, 95% CI) | 0.90 [0.80, 1.01] |
| 11.1 urodynamic stress incontinence (only) | 1 | 28 | Risk Ratio (M‐H, Fixed, 95% CI) | 0.23 [0.01, 4.37] |
| 11.2 stress urinary incontinence (symptoms only) | 1 | 433 | Risk Ratio (M‐H, Fixed, 95% CI) | 0.91 [0.81, 1.02] |
| 11.3 mixed incontinence | 0 | 0 | Risk Ratio (M‐H, Fixed, 95% CI) | 0.0 [0.0, 0.0] |
| 12 Duration of operation (minutes) Show forest plot | 1 | Mean Difference (IV, Fixed, 95% CI) | Totals not selected | |
| 12.1 urodynamic stress incontinence (only) | 1 | Mean Difference (IV, Fixed, 95% CI) | 0.0 [0.0, 0.0] | |
| 12.2 stress urinary incontinence (symptoms only) | 0 | Mean Difference (IV, Fixed, 95% CI) | 0.0 [0.0, 0.0] | |
| 12.3 mixed incontinence | 0 | Mean Difference (IV, Fixed, 95% CI) | 0.0 [0.0, 0.0] | |
| 13 Time to catheter removal (days) Show forest plot | 2 | 108 | Mean Difference (IV, Fixed, 95% CI) | 8.01 [6.84, 9.18] |
| 13.1 urodynamic stress incontinence (only) | 2 | 108 | Mean Difference (IV, Fixed, 95% CI) | 8.01 [6.84, 9.18] |
| 13.2 stress urinary incontinence (symptoms only) | 0 | 0 | Mean Difference (IV, Fixed, 95% CI) | 0.0 [0.0, 0.0] |
| 13.3 mixed incontinence | 0 | 0 | Mean Difference (IV, Fixed, 95% CI) | 0.0 [0.0, 0.0] |
| 14 Length of hospital stay (days) Show forest plot | 3 | Mean Difference (IV, Fixed, 95% CI) | Totals not selected | |
| 14.1 urodynamic stress incontinence (only) | 3 | Mean Difference (IV, Fixed, 95% CI) | 0.0 [0.0, 0.0] | |
| 14.2 stress urinary incontinence (symptoms only) | 0 | Mean Difference (IV, Fixed, 95% CI) | 0.0 [0.0, 0.0] | |
| 14.3 mixed incontinence | 0 | Mean Difference (IV, Fixed, 95% CI) | 0.0 [0.0, 0.0] | |
| 15 Time to return to normal activity level | 0 | 0 | Mean Difference (IV, Fixed, 95% CI) | 0.0 [0.0, 0.0] |
| 15.1 urodynamic stress incontinence (only) | 0 | 0 | Mean Difference (IV, Fixed, 95% CI) | 0.0 [0.0, 0.0] |
| 15.2 stress urinary incontinence (symptoms only) | 0 | 0 | Mean Difference (IV, Fixed, 95% CI) | 0.0 [0.0, 0.0] |
| 15.3 mixed incontinence | 0 | 0 | Mean Difference (IV, Fixed, 95% CI) | 0.0 [0.0, 0.0] |
| 16 Perioperative surgical complications Show forest plot | 4 | 792 | Risk Ratio (M‐H, Fixed, 95% CI) | 1.24 [0.83, 1.86] |
| 16.1 urodynamic stress incontinence (only) | 3 | 137 | Risk Ratio (M‐H, Fixed, 95% CI) | 0.85 [0.28, 2.52] |
| 16.2 stress urinary incontinence (symptoms only) | 1 | 655 | Risk Ratio (M‐H, Fixed, 95% CI) | 1.32 [0.86, 2.04] |
| 16.3 mixed incontinence | 0 | 0 | Risk Ratio (M‐H, Fixed, 95% CI) | 0.0 [0.0, 0.0] |
| 17 Bladder perforation Show forest plot | 1 | Risk Ratio (M‐H, Fixed, 95% CI) | Totals not selected | |
| 17.1 urodynamic stress incontinence (only) | 0 | Risk Ratio (M‐H, Fixed, 95% CI) | 0.0 [0.0, 0.0] | |
| 17.2 stress urinary incontinence (symptoms only) | 1 | Risk Ratio (M‐H, Fixed, 95% CI) | 0.0 [0.0, 0.0] | |
| 17.3 mixed incontinence | 0 | Risk Ratio (M‐H, Fixed, 95% CI) | 0.0 [0.0, 0.0] | |
| 18 Urinary tract infection Show forest plot | 1 | Risk Ratio (M‐H, Fixed, 95% CI) | Totals not selected | |
| 18.1 urodynamic stress incontinence (only) | 0 | Risk Ratio (M‐H, Fixed, 95% CI) | 0.0 [0.0, 0.0] | |
| 18.2 stress urinary incontinence (symptoms only) | 1 | Risk Ratio (M‐H, Fixed, 95% CI) | 0.0 [0.0, 0.0] | |
| 18.3 mixed incontinence | 0 | Risk Ratio (M‐H, Fixed, 95% CI) | 0.0 [0.0, 0.0] | |
| 19 Number of women with recurrent UTIs at > 5 years Show forest plot | 1 | Risk Ratio (M‐H, Fixed, 95% CI) | Totals not selected | |
| 19.1 urodynamic stress incontinence (only) | 0 | Risk Ratio (M‐H, Fixed, 95% CI) | 0.0 [0.0, 0.0] | |
| 19.2 stress urinary incontinence (symptoms only) | 1 | Risk Ratio (M‐H, Fixed, 95% CI) | 0.0 [0.0, 0.0] | |
| 19.3 mixed incontinence | 0 | Risk Ratio (M‐H, Fixed, 95% CI) | 0.0 [0.0, 0.0] | |
| 20 Urge urinary symptoms, urgency urinary incontinence Show forest plot | 2 | 525 | Risk Ratio (M‐H, Fixed, 95% CI) | 1.10 [0.74, 1.64] |
| 20.1 urodynamic stress incontinence (only) | 1 | 72 | Risk Ratio (M‐H, Fixed, 95% CI) | 2.0 [0.54, 7.39] |
| 20.2 stress urinary incontinence (symptoms only) | 1 | 453 | Risk Ratio (M‐H, Fixed, 95% CI) | 1.02 [0.67, 1.56] |
| 20.3 mixed incontinence | 0 | 0 | Risk Ratio (M‐H, Fixed, 95% CI) | 0.0 [0.0, 0.0] |
| 21 Detrusor overactivity (urodynamic diagnosis) Show forest plot | 4 | 203 | Risk Ratio (M‐H, Fixed, 95% CI) | 1.42 [0.52, 3.87] |
| 21.1 urodynamic stress incontinence (only) | 4 | 203 | Risk Ratio (M‐H, Fixed, 95% CI) | 1.42 [0.52, 3.87] |
| 21.2 stress urinary incontinence (symptoms only) | 0 | 0 | Risk Ratio (M‐H, Fixed, 95% CI) | 0.0 [0.0, 0.0] |
| 21.3 mixed incontinence | 0 | 0 | Risk Ratio (M‐H, Fixed, 95% CI) | 0.0 [0.0, 0.0] |
| 22 Voiding dysfunction after 3 months Show forest plot | 5 | 853 | Risk Ratio (M‐H, Fixed, 95% CI) | 6.08 [3.10, 11.95] |
| 22.1 urodynamic stress incontinence (only) | 4 | 198 | Risk Ratio (M‐H, Fixed, 95% CI) | 4.48 [1.16, 17.36] |
| 22.2 stress urinary incontinence (symptoms only) | 1 | 655 | Risk Ratio (M‐H, Fixed, 95% CI) | 6.63 [3.04, 14.47] |
| 22.3 mixed incontinence | 0 | 0 | Risk Ratio (M‐H, Fixed, 95% CI) | 0.0 [0.0, 0.0] |
| 23 Long‐term voiding dysfunction > 5 years Show forest plot | 1 | Risk Ratio (M‐H, Fixed, 95% CI) | Totals not selected | |
| 23.1 urodynamic stress incontinence (only) | 0 | Risk Ratio (M‐H, Fixed, 95% CI) | 0.0 [0.0, 0.0] | |
| 23.2 stress urinary incontinence (symptoms only) | 1 | Risk Ratio (M‐H, Fixed, 95% CI) | 0.0 [0.0, 0.0] | |
| 23.3 mixed incontinence | 0 | Risk Ratio (M‐H, Fixed, 95% CI) | 0.0 [0.0, 0.0] | |
| 24 Number of women requiring treatment for pelvic organ prolapse Show forest plot | 3 | 559 | Risk Ratio (M‐H, Fixed, 95% CI) | 0.20 [0.05, 0.77] |
| 24.1 urodynamic stress incontinence (only) | 2 | 106 | Risk Ratio (M‐H, Fixed, 95% CI) | 0.2 [0.04, 1.11] |
| 24.2 stress urinary incontinence (symptoms only) | 1 | 453 | Risk Ratio (M‐H, Fixed, 95% CI) | 0.20 [0.02, 1.74] |
| 24.3 mixed incontinence | 0 | 0 | Risk Ratio (M‐H, Fixed, 95% CI) | 0.0 [0.0, 0.0] |
| 25 Repeat surgery for urinary incontinence Show forest plot | 1 | Risk Ratio (M‐H, Fixed, 95% CI) | Totals not selected | |
| 25.1 urodynamic stress incontinence (only) | 0 | Risk Ratio (M‐H, Fixed, 95% CI) | 0.0 [0.0, 0.0] | |
| 25.2 stress urinary incontinence (symptoms only) | 1 | Risk Ratio (M‐H, Fixed, 95% CI) | 0.0 [0.0, 0.0] | |
| 25.3 mixed incontinence | 0 | Risk Ratio (M‐H, Fixed, 95% CI) | 0.0 [0.0, 0.0] | |
| 26 Condition‐specific measures to assess quality of life Show forest plot | 1 | Mean Difference (IV, Fixed, 95% CI) | Totals not selected | |
| 26.1 Urinary Distress Index (UDI) | 1 | Mean Difference (IV, Fixed, 95% CI) | 0.0 [0.0, 0.0] | |
| 26.2 Incontinence Impact Questionnaire (IIQ) | 1 | Mean Difference (IV, Fixed, 95% CI) | 0.0 [0.0, 0.0] | |
| Outcome or subgroup title | No. of studies | No. of participants | Statistical method | Effect size |
| 1 Number of women with urinary incontinence (worse, unchanged, or improved) within first year (women's observations) Show forest plot | 11 | 841 | Risk Ratio (M‐H, Fixed, 95% CI) | 1.04 [0.85, 1.28] |
| 1.1 urodynamic stress incontinence (only) | 5 | 427 | Risk Ratio (M‐H, Fixed, 95% CI) | 1.02 [0.77, 1.36] |
| 1.2 stress urinary incontinence (symptoms only) | 1 | 53 | Risk Ratio (M‐H, Fixed, 95% CI) | 1.12 [0.17, 7.37] |
| 1.3 mixed urinary incontinence | 5 | 361 | Risk Ratio (M‐H, Fixed, 95% CI) | 1.06 [0.78, 1.42] |
| 2 Number not improved (worse or unchanged) within first year (women's observations) Show forest plot | 3 | 425 | Risk Ratio (M‐H, Fixed, 95% CI) | 0.79 [0.49, 1.29] |
| 2.1 urodynamic stress incontinence (only) | 2 | 286 | Risk Ratio (M‐H, Fixed, 95% CI) | 0.95 [0.40, 2.21] |
| 2.2 stress urinary incontinence (symptoms only) | 0 | 0 | Risk Ratio (M‐H, Fixed, 95% CI) | 0.0 [0.0, 0.0] |
| 2.3 mixed urinary incontinence | 1 | 139 | Risk Ratio (M‐H, Fixed, 95% CI) | 0.72 [0.40, 1.29] |
| 3 Number of women with urinary incontinence (worse, unchanged, or improved) at 1 to 5 years (women's observations) Show forest plot | 6 | 458 | Risk Ratio (M‐H, Fixed, 95% CI) | 1.29 [0.98, 1.68] |
| 3.1 urodynamic stress incontinence (only) | 4 | 364 | Risk Ratio (M‐H, Fixed, 95% CI) | 1.18 [0.87, 1.59] |
| 3.2 stress urinary incontinence (symptoms only) | 0 | 0 | Risk Ratio (M‐H, Fixed, 95% CI) | 0.0 [0.0, 0.0] |
| 3.3 mixed urinary incontinence | 2 | 94 | Risk Ratio (M‐H, Fixed, 95% CI) | 1.79 [0.96, 3.31] |
| 4 Number not improved (worse or unchanged) after first year (women's observations) Show forest plot | 2 | 264 | Risk Ratio (M‐H, Fixed, 95% CI) | 1.28 [0.56, 2.94] |
| 4.1 urodynamic stress incontinence (only) | 2 | 264 | Risk Ratio (M‐H, Fixed, 95% CI) | 1.28 [0.56, 2.94] |
| 4.2 stress urinary incontinence (symptoms only) | 0 | 0 | Risk Ratio (M‐H, Fixed, 95% CI) | 0.0 [0.0, 0.0] |
| 4.3 mixed urinary incontinence | 0 | 0 | Risk Ratio (M‐H, Fixed, 95% CI) | 0.0 [0.0, 0.0] |
| 5 Number of women with urinary incontinence after 5 years (women's observations) Show forest plot | 1 | Risk Ratio (M‐H, Fixed, 95% CI) | Totals not selected | |
| 5.1 urodynamic stress incontinence (only) | 1 | Risk Ratio (M‐H, Fixed, 95% CI) | 0.0 [0.0, 0.0] | |
| 5.2 stress urinary incontinence (symptoms only) | 0 | Risk Ratio (M‐H, Fixed, 95% CI) | 0.0 [0.0, 0.0] | |
| 5.3 mixed urinary incontinence | 0 | Risk Ratio (M‐H, Fixed, 95% CI) | 0.0 [0.0, 0.0] | |
| 6 Number with incontinence not improved after 5 years (women's observations) Show forest plot | 1 | Risk Ratio (M‐H, Fixed, 95% CI) | Totals not selected | |
| 6.1 urodynamic stress incontinence (only) | 1 | Risk Ratio (M‐H, Fixed, 95% CI) | 0.0 [0.0, 0.0] | |
| 6.2 stress urinary incontinence (symptoms only) | 0 | Risk Ratio (M‐H, Fixed, 95% CI) | 0.0 [0.0, 0.0] | |
| 6.3 mixed urinary incontinence | 0 | Risk Ratio (M‐H, Fixed, 95% CI) | 0.0 [0.0, 0.0] | |
| 7 CURE: number of women cured at > 1 year (women's observations) Show forest plot | 4 | 337 | Odds Ratio (M‐H, Fixed, 95% CI) | 1.06 [0.65, 1.72] |
| 7.1 urodynamic stress incontinence (only) | 3 | 293 | Odds Ratio (M‐H, Fixed, 95% CI) | 1.21 [0.72, 2.03] |
| 7.2 stress urinary incontinence (symptoms only) | 0 | 0 | Odds Ratio (M‐H, Fixed, 95% CI) | 0.0 [0.0, 0.0] |
| 7.3 mixed urinary incontinence | 1 | 44 | Odds Ratio (M‐H, Fixed, 95% CI) | 0.42 [0.10, 1.72] |
| 8 Repeat surgery for urinary incontinence Show forest plot | 1 | Risk Ratio (M‐H, Fixed, 95% CI) | Totals not selected | |
| 8.1 urodynamic stress incontinence (only) | 1 | Risk Ratio (M‐H, Fixed, 95% CI) | 0.0 [0.0, 0.0] | |
| 8.2 stress urinary incontinence (symptoms only) | 0 | Risk Ratio (M‐H, Fixed, 95% CI) | 0.0 [0.0, 0.0] | |
| 8.3 mixed incontinence | 0 | Risk Ratio (M‐H, Fixed, 95% CI) | 0.0 [0.0, 0.0] | |
| 9 Number of women not satisfied Show forest plot | 2 | Risk Ratio (M‐H, Fixed, 95% CI) | Subtotals only | |
| 9.1 urodynamic stress incontinence (only) | 2 | 163 | Risk Ratio (M‐H, Fixed, 95% CI) | 0.82 [0.51, 1.32] |
| 9.2 stress urinary incontinence (symptoms only) | 0 | 0 | Risk Ratio (M‐H, Fixed, 95% CI) | 0.0 [0.0, 0.0] |
| 9.3 mixed urinary incontinence | 0 | 0 | Risk Ratio (M‐H, Fixed, 95% CI) | 0.0 [0.0, 0.0] |
| 10 Pad test of quantified leakage (mean weight of urine loss) Show forest plot | 1 | Mean Difference (IV, Fixed, 95% CI) | Totals not selected | |
| 10.1 urodynamic stress incontinence (only) | 1 | Mean Difference (IV, Fixed, 95% CI) | 0.0 [0.0, 0.0] | |
| 10.2 stress urinary incontinence (symptoms only) | 0 | Mean Difference (IV, Fixed, 95% CI) | 0.0 [0.0, 0.0] | |
| 10.3 mixed urinary incontinence | 0 | Mean Difference (IV, Fixed, 95% CI) | 0.0 [0.0, 0.0] | |
| 11 Number of women with urinary incontinence (clinician's observations) within first year Show forest plot | 2 | 105 | Risk Ratio (M‐H, Fixed, 95% CI) | 1.29 [0.45, 3.71] |
| 11.1 urodynamic stress incontinence (only) | 0 | 0 | Risk Ratio (M‐H, Fixed, 95% CI) | 0.0 [0.0, 0.0] |
| 11.2 stress urinary incontinence (symptoms only) | 0 | 0 | Risk Ratio (M‐H, Fixed, 95% CI) | 0.0 [0.0, 0.0] |
| 11.3 mixed urinary incontinence | 2 | 105 | Risk Ratio (M‐H, Fixed, 95% CI) | 1.29 [0.45, 3.71] |
| 12 Number of women with urinary incontinence (clinician's observations) after first year Show forest plot | 1 | Risk Ratio (M‐H, Fixed, 95% CI) | Totals not selected | |
| 12.1 urodynamic stress incontinence (only) | 0 | Risk Ratio (M‐H, Fixed, 95% CI) | 0.0 [0.0, 0.0] | |
| 12.2 stress urinary incontinence (symptoms only) | 0 | Risk Ratio (M‐H, Fixed, 95% CI) | 0.0 [0.0, 0.0] | |
| 12.3 mixed urinary incontinence | 1 | Risk Ratio (M‐H, Fixed, 95% CI) | 0.0 [0.0, 0.0] | |
| 13 Duration of operation (minutes) Show forest plot | 7 | 355 | Mean Difference (IV, Fixed, 95% CI) | 57.08 [54.67, 59.49] |
| 13.1 urodynamic stress incontinence (only) | 2 | 61 | Mean Difference (IV, Fixed, 95% CI) | 46.91 [42.31, 51.52] |
| 13.2 stress urinary incontinence (symptoms only) | 1 | 53 | Mean Difference (IV, Fixed, 95% CI) | 20.0 [7.08, 32.92] |
| 13.3 mixed urinary incontinence | 4 | 241 | Mean Difference (IV, Fixed, 95% CI) | 62.96 [60.07, 65.86] |
| 14 Length of hospital stay (days) Show forest plot | 4 | 194 | Mean Difference (IV, Fixed, 95% CI) | 0.74 [0.55, 0.93] |
| 14.1 urodynamic stress incontinence (only) | 1 | 20 | Mean Difference (IV, Fixed, 95% CI) | 0.65 [0.39, 0.91] |
| 14.2 stress urinary incontinence (symptoms only) | 0 | 0 | Mean Difference (IV, Fixed, 95% CI) | 0.0 [0.0, 0.0] |
| 14.3 mixed urinary incontinence | 3 | 174 | Mean Difference (IV, Fixed, 95% CI) | 0.83 [0.56, 1.10] |
| 15 Time to catheter removal (days) Show forest plot | 2 | 113 | Mean Difference (IV, Fixed, 95% CI) | 0.11 [‐0.07, 0.30] |
| 15.1 urodynamic stress incontinence (only) | 0 | 0 | Mean Difference (IV, Fixed, 95% CI) | 0.0 [0.0, 0.0] |
| 15.2 stress urinary incontinence (symptoms only) | 1 | 53 | Mean Difference (IV, Fixed, 95% CI) | 2.3 [0.01, 4.59] |
| 15.3 mixed urinary incontinence | 1 | 60 | Mean Difference (IV, Fixed, 95% CI) | 0.10 [‐0.09, 0.29] |
| 16 Perioperative surgical complications Show forest plot | 4 | 293 | Risk Ratio (M‐H, Fixed, 95% CI) | 1.74 [1.16, 2.60] |
| 16.1 urodynamic stress incontinence (only) | 2 | 183 | Risk Ratio (M‐H, Fixed, 95% CI) | 1.73 [1.01, 2.96] |
| 16.2 stress urinary incontinence (symptoms only) | 0 | 0 | Risk Ratio (M‐H, Fixed, 95% CI) | 0.0 [0.0, 0.0] |
| 16.3 mixed urinary incontinence | 2 | 110 | Risk Ratio (M‐H, Fixed, 95% CI) | 1.74 [0.94, 3.21] |
| 17 Bladder perforations Show forest plot | 10 | 844 | Risk Ratio (M‐H, Fixed, 95% CI) | 0.59 [0.34, 1.01] |
| 17.1 urodynamic stress incontinence (only) | 3 | 334 | Risk Ratio (M‐H, Fixed, 95% CI) | 0.74 [0.19, 2.86] |
| 17.2 stress urinary incontinence (symptoms only) | 1 | 53 | Risk Ratio (M‐H, Fixed, 95% CI) | 0.56 [0.05, 5.81] |
| 17.3 mixed urinary incontinence | 6 | 457 | Risk Ratio (M‐H, Fixed, 95% CI) | 0.56 [0.30, 1.03] |
| 18 Urethral injury Show forest plot | 1 | Risk Ratio (M‐H, Fixed, 95% CI) | Totals not selected | |
| 18.1 urodynamic stress incontinence (only) | 0 | Risk Ratio (M‐H, Fixed, 95% CI) | 0.0 [0.0, 0.0] | |
| 18.2 stress urinary incontinence (symptoms only) | 0 | Risk Ratio (M‐H, Fixed, 95% CI) | 0.0 [0.0, 0.0] | |
| 18.3 mixed urinary incontinence | 1 | Risk Ratio (M‐H, Fixed, 95% CI) | 0.0 [0.0, 0.0] | |
| 19 Vaginal bleeding Show forest plot | 1 | Risk Ratio (M‐H, Fixed, 95% CI) | Totals not selected | |
| 19.1 urodynamic stress incontinence (only) | 0 | Risk Ratio (M‐H, Fixed, 95% CI) | 0.0 [0.0, 0.0] | |
| 19.2 stress urinary incontinence (symptoms only) | 0 | Risk Ratio (M‐H, Fixed, 95% CI) | 0.0 [0.0, 0.0] | |
| 19.3 mixed urinary incontinence | 1 | Risk Ratio (M‐H, Fixed, 95% CI) | 0.0 [0.0, 0.0] | |
| 20 Urinary tract infection Show forest plot | 1 | Risk Ratio (M‐H, Fixed, 95% CI) | Totals not selected | |
| 20.1 urodynamic stress incontinence (only) | 0 | Risk Ratio (M‐H, Fixed, 95% CI) | 0.0 [0.0, 0.0] | |
| 20.2 stress urinary incontinence (symptoms only) | 0 | Risk Ratio (M‐H, Fixed, 95% CI) | 0.0 [0.0, 0.0] | |
| 20.3 mixed urinary incontinence | 1 | Risk Ratio (M‐H, Fixed, 95% CI) | 0.0 [0.0, 0.0] | |
| 21 Voiding dysfunction Show forest plot | 8 | 629 | Risk Ratio (M‐H, Fixed, 95% CI) | 1.34 [0.85, 2.12] |
| 21.1 urodynamic stress incontinence (only) | 3 | 325 | Risk Ratio (M‐H, Fixed, 95% CI) | 1.22 [0.60, 2.46] |
| 21.2 stress urinary incontinence (symptoms only) | 1 | 53 | Risk Ratio (M‐H, Fixed, 95% CI) | 2.61 [0.76, 9.03] |
| 21.3 mixed urinary incontinence | 4 | 251 | Risk Ratio (M‐H, Fixed, 95% CI) | 1.18 [0.58, 2.40] |
| 22 De novo detrusor urgency or urge symptoms Show forest plot | 5 | 348 | Risk Ratio (M‐H, Fixed, 95% CI) | 1.62 [0.66, 3.99] |
| 22.1 urodynamic stress incontinence (only) | 1 | 124 | Risk Ratio (M‐H, Fixed, 95% CI) | 0.34 [0.01, 8.29] |
| 22.2 stress urinary incontinence (symptoms only) | 1 | 53 | Risk Ratio (M‐H, Fixed, 95% CI) | 3.35 [0.14, 78.60] |
| 22.3 mixed urinary incontinence | 3 | 171 | Risk Ratio (M‐H, Fixed, 95% CI) | 1.81 [0.65, 5.06] |
| 23 De novo detrusor overactivity (urodynamic diagnosis) Show forest plot | 4 | 325 | Risk Ratio (M‐H, Fixed, 95% CI) | 2.61 [1.17, 5.84] |
| 23.1 urodynamic stress incontinence (only) | 1 | 59 | Risk Ratio (M‐H, Fixed, 95% CI) | 0.0 [0.0, 0.0] |
| 23.2 stress urinary incontinence (symptoms only) | 1 | 47 | Risk Ratio (M‐H, Fixed, 95% CI) | 3.13 [0.13, 73.01] |
| 23.3 mixed urinary incontinence | 2 | 219 | Risk Ratio (M‐H, Fixed, 95% CI) | 2.57 [1.12, 5.92] |
| 24 Long‐term adverse effects (release of sling required) Show forest plot | 3 | 326 | Risk Ratio (M‐H, Fixed, 95% CI) | 2.53 [0.87, 7.35] |
| 24.1 urodynamic stress incontinence (only) | 2 | 266 | Risk Ratio (M‐H, Fixed, 95% CI) | 1.68 [0.50, 5.66] |
| 24.2 stress urinary incontinence (symptoms only) | 0 | 0 | Risk Ratio (M‐H, Fixed, 95% CI) | 0.0 [0.0, 0.0] |
| 24.3 mixed urinary incontinence | 1 | 60 | Risk Ratio (M‐H, Fixed, 95% CI) | 9.6 [0.54, 170.84] |
| 25 Long‐term adverse effects (wound pain at 6 months) Show forest plot | 3 | 257 | Risk Ratio (M‐H, Fixed, 95% CI) | 6.40 [1.94, 21.12] |
| 25.1 urodynamic stress incontinence (only) | 1 | 124 | Risk Ratio (M‐H, Fixed, 95% CI) | 5.16 [0.25, 105.36] |
| 25.2 stress urinary incontinence (symptoms only) | 1 | 53 | Risk Ratio (M‐H, Fixed, 95% CI) | 3.92 [0.90, 17.15] |
| 25.3 mixed urinary incontinence | 1 | 80 | Risk Ratio (M‐H, Fixed, 95% CI) | 17.0 [1.01, 284.96] |
| 26 Long‐term adverse effects (vaginal mesh or graft exposure) Show forest plot | 5 | 348 | Risk Ratio (M‐H, Fixed, 95% CI) | 0.28 [0.05, 1.65] |
| 26.1 urodynamic stress incontinence (only) | 2 | 165 | Risk Ratio (M‐H, Fixed, 95% CI) | 0.35 [0.04, 3.24] |
| 26.2 stress urinary incontinence (symptoms only) | 1 | 53 | Risk Ratio (M‐H, Fixed, 95% CI) | 0.0 [0.0, 0.0] |
| 26.3 mixed urinary incontinence | 2 | 130 | Risk Ratio (M‐H, Fixed, 95% CI) | 0.2 [0.01, 3.97] |
| 27 Condition‐specific measures to assess quality of life: UDI‐6 Show forest plot | 1 | 63 | Mean Difference (IV, Fixed, 95% CI) | 7.30 [‐2.00, 16.60] |
| 27.1 urodynamic stress incontinence (only) | 0 | 0 | Mean Difference (IV, Fixed, 95% CI) | 0.0 [0.0, 0.0] |
| 27.2 stress urinary incontinence (symptoms only) | 1 | 63 | Mean Difference (IV, Fixed, 95% CI) | 7.30 [‐2.00, 16.60] |
| 27.3 mixed urinary incontinence | 0 | 0 | Mean Difference (IV, Fixed, 95% CI) | 0.0 [0.0, 0.0] |
| 28 Condition‐specific measures to assess quality of life: IIQ‐7 Show forest plot | 1 | 63 | Mean Difference (IV, Fixed, 95% CI) | 0.60 [‐10.17, 11.37] |
| 28.1 urodynamic stress incontinence (only) | 0 | 0 | Mean Difference (IV, Fixed, 95% CI) | 0.0 [0.0, 0.0] |
| 28.2 stress urinary incontinence (symptoms only) | 1 | 63 | Mean Difference (IV, Fixed, 95% CI) | 0.60 [‐10.17, 11.37] |
| 28.3 mixed urinary incontinence | 0 | 0 | Mean Difference (IV, Fixed, 95% CI) | 0.0 [0.0, 0.0] |
| Outcome or subgroup title | No. of studies | No. of participants | Statistical method | Effect size |
| 1 Number of women with urinary incontinence in the medium term (1 to 5 years) Show forest plot | 1 | Risk Ratio (M‐H, Fixed, 95% CI) | Totals not selected | |
| 1.1 urodynamic stress incontinence (only) | 1 | Risk Ratio (M‐H, Fixed, 95% CI) | 0.0 [0.0, 0.0] | |
| 1.2 stress urinary incontinence (symptoms only) | 0 | Risk Ratio (M‐H, Fixed, 95% CI) | 0.0 [0.0, 0.0] | |
| 1.3 mixed incontinence | 0 | Risk Ratio (M‐H, Fixed, 95% CI) | 0.0 [0.0, 0.0] | |
| 2 Number of women not satisfied within first year Show forest plot | 1 | Risk Ratio (M‐H, Fixed, 95% CI) | Totals not selected | |
| 2.1 urodynamic stress incontinence (only) | 1 | Risk Ratio (M‐H, Fixed, 95% CI) | 0.0 [0.0, 0.0] | |
| 2.2 stress urinary incontinence (symptoms only) | 0 | Risk Ratio (M‐H, Fixed, 95% CI) | 0.0 [0.0, 0.0] | |
| 2.3 mixed incontinence | 0 | Risk Ratio (M‐H, Fixed, 95% CI) | 0.0 [0.0, 0.0] | |
| 3 Number of women with urinary incontinence (clinician's observations) within first year Show forest plot | 1 | Risk Ratio (M‐H, Fixed, 95% CI) | Totals not selected | |
| 3.1 urodynamic stress incontinence (only) | 1 | Risk Ratio (M‐H, Fixed, 95% CI) | 0.0 [0.0, 0.0] | |
| 3.2 stress urinary incontinence (symptoms only) | 0 | Risk Ratio (M‐H, Fixed, 95% CI) | 0.0 [0.0, 0.0] | |
| 3.3 mixed incontinence | 0 | Risk Ratio (M‐H, Fixed, 95% CI) | 0.0 [0.0, 0.0] | |
| 4 CURE: number of women cured at > 1 year (women's observations) Show forest plot | 1 | Odds Ratio (M‐H, Fixed, 95% CI) | Totals not selected | |
| 4.1 urodynamic stress incontinence (only) | 1 | Odds Ratio (M‐H, Fixed, 95% CI) | 0.0 [0.0, 0.0] | |
| 4.2 stress urinary incontinence (symptoms only) | 0 | Odds Ratio (M‐H, Fixed, 95% CI) | 0.0 [0.0, 0.0] | |
| 4.3 mixed incontinence | 0 | Odds Ratio (M‐H, Fixed, 95% CI) | 0.0 [0.0, 0.0] | |
| 5 Bladder perforation Show forest plot | 1 | Risk Ratio (M‐H, Fixed, 95% CI) | Totals not selected | |
| 5.1 urodynamic stress incontinence (only) | 1 | Risk Ratio (M‐H, Fixed, 95% CI) | 0.0 [0.0, 0.0] | |
| 5.2 stress urinary incontinence (symptoms only) | 0 | Risk Ratio (M‐H, Fixed, 95% CI) | 0.0 [0.0, 0.0] | |
| 5.3 mixed incontinence | 0 | Risk Ratio (M‐H, Fixed, 95% CI) | 0.0 [0.0, 0.0] | |
| 6 Urge urinary symptoms, urgency urinary incontinence Show forest plot | 1 | Risk Ratio (M‐H, Fixed, 95% CI) | Totals not selected | |
| 6.1 urodynamic stress incontinence (only) | 1 | Risk Ratio (M‐H, Fixed, 95% CI) | 0.0 [0.0, 0.0] | |
| 6.2 stress urinary incontinence (symptoms only) | 0 | Risk Ratio (M‐H, Fixed, 95% CI) | 0.0 [0.0, 0.0] | |
| 6.3 mixed incontinence | 0 | Risk Ratio (M‐H, Fixed, 95% CI) | 0.0 [0.0, 0.0] | |
| 7 Pain with intercourse (dyspareunia) Show forest plot | 1 | Risk Ratio (M‐H, Fixed, 95% CI) | Totals not selected | |
| 7.1 urodynamic stress incontinence (only) | 1 | Risk Ratio (M‐H, Fixed, 95% CI) | 0.0 [0.0, 0.0] | |
| 7.2 stress urinary incontinence (symptoms only) | 0 | Risk Ratio (M‐H, Fixed, 95% CI) | 0.0 [0.0, 0.0] | |
| 7.3 mixed incontinence | 0 | Risk Ratio (M‐H, Fixed, 95% CI) | 0.0 [0.0, 0.0] | |
| 8 Long‐term adverse effects (vaginal mesh or graft exposure) Show forest plot | 1 | Risk Ratio (M‐H, Fixed, 95% CI) | Totals not selected | |
| 8.1 urodynamic stress incontinence (only) | 1 | Risk Ratio (M‐H, Fixed, 95% CI) | 0.0 [0.0, 0.0] | |
| 8.2 stress urinary incontinence (symptoms only) | 0 | Risk Ratio (M‐H, Fixed, 95% CI) | 0.0 [0.0, 0.0] | |
| 8.3 mixed incontinence | 0 | Risk Ratio (M‐H, Fixed, 95% CI) | 0.0 [0.0, 0.0] | |
| 9 Condition‐specific measures to assess quality of life: IIQ score Show forest plot | 1 | Mean Difference (IV, Fixed, 95% CI) | Totals not selected | |
| 9.1 urodynamic stress incontinence (only) | 1 | Mean Difference (IV, Fixed, 95% CI) | 0.0 [0.0, 0.0] | |
| 9.2 stress urinary incontinence (symptoms only) | 0 | Mean Difference (IV, Fixed, 95% CI) | 0.0 [0.0, 0.0] | |
| 9.3 mixed urinary incontinence | 0 | Mean Difference (IV, Fixed, 95% CI) | 0.0 [0.0, 0.0] | |
| Outcome or subgroup title | No. of studies | No. of participants | Statistical method | Effect size |
| 1 Number of women with urinary incontinence (worse, unchanged, or improved) within first year (women's observations) Show forest plot | 5 | Risk Ratio (M‐H, Fixed, 95% CI) | Totals not selected | |
| 1.1 fascial sling vs Pelvicol sling | 1 | Risk Ratio (M‐H, Fixed, 95% CI) | 0.0 [0.0, 0.0] | |
| 1.2 standard sling vs short sling | 1 | Risk Ratio (M‐H, Fixed, 95% CI) | 0.0 [0.0, 0.0] | |
| 1.3 autologous fascial sling vs Fortaperm sling | 1 | Risk Ratio (M‐H, Fixed, 95% CI) | 0.0 [0.0, 0.0] | |
| 1.4 Vypro vs Ultrapro | 1 | Risk Ratio (M‐H, Fixed, 95% CI) | 0.0 [0.0, 0.0] | |
| 1.5 Vypro vs Prolene light | 1 | Risk Ratio (M‐H, Fixed, 95% CI) | 0.0 [0.0, 0.0] | |
| 1.6 Ultrapro vs Prolene light | 1 | Risk Ratio (M‐H, Fixed, 95% CI) | 0.0 [0.0, 0.0] | |
| 1.7 fascial sling vs vaginal wall sling | 1 | Risk Ratio (M‐H, Fixed, 95% CI) | 0.0 [0.0, 0.0] | |
| 2 Number not improved (worse or unchanged) within first year (women's observations) Show forest plot | 3 | Risk Ratio (M‐H, Fixed, 95% CI) | Totals not selected | |
| 2.1 fascial sling vs Pelvicol sling | 1 | Risk Ratio (M‐H, Fixed, 95% CI) | 0.0 [0.0, 0.0] | |
| 2.2 autologous fascial sling vs Fortaperm sling | 1 | Risk Ratio (M‐H, Fixed, 95% CI) | 0.0 [0.0, 0.0] | |
| 2.3 rectus fascia sling vs Goretex sling | 1 | Risk Ratio (M‐H, Fixed, 95% CI) | 0.0 [0.0, 0.0] | |
| 3 Number of women with urinary incontinence (worse, unchanged, or improved) at 1 to 5 years (women's observations) Show forest plot | 7 | Risk Ratio (M‐H, Fixed, 95% CI) | Totals not selected | |
| 3.1 fascial sling vs Pelvicol sling | 1 | Risk Ratio (M‐H, Fixed, 95% CI) | 0.0 [0.0, 0.0] | |
| 3.2 standard sling vs short sling | 1 | Risk Ratio (M‐H, Fixed, 95% CI) | 0.0 [0.0, 0.0] | |
| 3.3 autologous dermal graft patch vs cadaveric fascia lata | 1 | Risk Ratio (M‐H, Fixed, 95% CI) | 0.0 [0.0, 0.0] | |
| 3.4 rectus fascia sling vs Goretex sling | 1 | Risk Ratio (M‐H, Fixed, 95% CI) | 0.0 [0.0, 0.0] | |
| 3.5 Vypro vs Ultrapro | 1 | Risk Ratio (M‐H, Fixed, 95% CI) | 0.0 [0.0, 0.0] | |
| 3.6 Vypro vs Prolene light | 1 | Risk Ratio (M‐H, Fixed, 95% CI) | 0.0 [0.0, 0.0] | |
| 3.7 Ultrapro vs Prolene light | 1 | Risk Ratio (M‐H, Fixed, 95% CI) | 0.0 [0.0, 0.0] | |
| 3.8 anterior vaginal wall sling vs biosynthetic mesh sling | 1 | Risk Ratio (M‐H, Fixed, 95% CI) | 0.0 [0.0, 0.0] | |
| 3.9 anterior rectus sheath sling vs Prolene strip | 1 | Risk Ratio (M‐H, Fixed, 95% CI) | 0.0 [0.0, 0.0] | |
| 3.10 anterior rectus sheath sling vs anterior vaginal wall patch | 1 | Risk Ratio (M‐H, Fixed, 95% CI) | 0.0 [0.0, 0.0] | |
| 3.11 Prolene strip vs anterior vaginal wall patch | 1 | Risk Ratio (M‐H, Fixed, 95% CI) | 0.0 [0.0, 0.0] | |
| 4 Number not improved (worse or unchanged) after first year (women's observations) Show forest plot | 4 | Risk Ratio (M‐H, Fixed, 95% CI) | Totals not selected | |
| 4.1 fascial sling vs Pelvicol sling | 1 | Risk Ratio (M‐H, Fixed, 95% CI) | 0.0 [0.0, 0.0] | |
| 4.2 autologous dermal graft patch vs cadaveric fascia lata | 1 | Risk Ratio (M‐H, Fixed, 95% CI) | 0.0 [0.0, 0.0] | |
| 4.3 rectus fascia sling vs Goretex sling | 1 | Risk Ratio (M‐H, Fixed, 95% CI) | 0.0 [0.0, 0.0] | |
| 4.4 anterior rectus sheath sling vs Prolene strip | 1 | Risk Ratio (M‐H, Fixed, 95% CI) | 0.0 [0.0, 0.0] | |
| 4.5 anterior rectus sheath sling vs anterior vaginal wall patch | 1 | Risk Ratio (M‐H, Fixed, 95% CI) | 0.0 [0.0, 0.0] | |
| 4.6 Prolene strip vs anterior vaginal wall patch | 1 | Risk Ratio (M‐H, Fixed, 95% CI) | 0.0 [0.0, 0.0] | |
| 5 Number of women with urinary incontinence (worse, unchanged, or improved) after 5 years (women's observations) Show forest plot | 1 | Risk Ratio (M‐H, Fixed, 95% CI) | Totals not selected | |
| 5.1 standard sling vs short sling | 1 | Risk Ratio (M‐H, Fixed, 95% CI) | 0.0 [0.0, 0.0] | |
| 6 CURE: number of women with urinary incontinence > 1 year (women's observations) Show forest plot | 3 | Odds Ratio (M‐H, Fixed, 95% CI) | Totals not selected | |
| 6.1 fascial sling vs Pelvicol sling | 1 | Odds Ratio (M‐H, Fixed, 95% CI) | 0.0 [0.0, 0.0] | |
| 6.2 standard sling vs short sling | 1 | Odds Ratio (M‐H, Fixed, 95% CI) | 0.0 [0.0, 0.0] | |
| 6.3 autologous dermal graft patch vs cadaveric fascia lata | 1 | Odds Ratio (M‐H, Fixed, 95% CI) | 0.0 [0.0, 0.0] | |
| 7 Number of women not satisfied Show forest plot | 3 | Risk Ratio (M‐H, Fixed, 95% CI) | Totals not selected | |
| 7.1 fascial sling vs Pelvicol sling | 1 | Risk Ratio (M‐H, Fixed, 95% CI) | 0.0 [0.0, 0.0] | |
| 7.2 Vypro vs Ultrapro | 1 | Risk Ratio (M‐H, Fixed, 95% CI) | 0.0 [0.0, 0.0] | |
| 7.3 Vypro vs Prolene light | 1 | Risk Ratio (M‐H, Fixed, 95% CI) | 0.0 [0.0, 0.0] | |
| 7.4 Ultrapro vs Prolene light | 1 | Risk Ratio (M‐H, Fixed, 95% CI) | 0.0 [0.0, 0.0] | |
| 7.5 anterior vaginal wall sling vs biosynthetic mesh sling | 1 | Risk Ratio (M‐H, Fixed, 95% CI) | 0.0 [0.0, 0.0] | |
| 8 Pad test of quantified leakage (mean weight of urine loss) at 1 year Show forest plot | 2 | Mean Difference (IV, Fixed, 95% CI) | Totals not selected | |
| 8.1 standard sling vs short sling | 1 | Mean Difference (IV, Fixed, 95% CI) | 0.0 [0.0, 0.0] | |
| 8.2 Vypro vs Ultrapro | 1 | Mean Difference (IV, Fixed, 95% CI) | 0.0 [0.0, 0.0] | |
| 8.3 Vypro vs Prolene light | 1 | Mean Difference (IV, Fixed, 95% CI) | 0.0 [0.0, 0.0] | |
| 8.4 Ultrapro vs Prolene light | 1 | Mean Difference (IV, Fixed, 95% CI) | 0.0 [0.0, 0.0] | |
| 9 Pad test of quantified leakage (mean weight of urine loss) at 1 to 5 years Show forest plot | 1 | Mean Difference (IV, Fixed, 95% CI) | Totals not selected | |
| 9.1 Vypro vs Ultrapro | 1 | Mean Difference (IV, Fixed, 95% CI) | 0.0 [0.0, 0.0] | |
| 9.2 Vypro vs Prolene light | 1 | Mean Difference (IV, Fixed, 95% CI) | 0.0 [0.0, 0.0] | |
| 9.3 Ultrapro vs Prolene light | 1 | Mean Difference (IV, Fixed, 95% CI) | 0.0 [0.0, 0.0] | |
| 10 Duration of operation (minutes) Show forest plot | 2 | Mean Difference (IV, Fixed, 95% CI) | Totals not selected | |
| 10.1 standard sling vs short sling | 1 | Mean Difference (IV, Fixed, 95% CI) | 0.0 [0.0, 0.0] | |
| 10.2 anterior rectus sheath sling vs Prolene strip | 1 | Mean Difference (IV, Fixed, 95% CI) | 0.0 [0.0, 0.0] | |
| 10.3 anterior rectus sheath sling vs anterior vaginal wall patch | 1 | Mean Difference (IV, Fixed, 95% CI) | 0.0 [0.0, 0.0] | |
| 10.4 Prolene strip vs anterior vaginal wall patch | 1 | Mean Difference (IV, Fixed, 95% CI) | 0.0 [0.0, 0.0] | |
| 11 Blood loss (mL) Show forest plot | 1 | Mean Difference (IV, Fixed, 95% CI) | Totals not selected | |
| 11.1 anterior rectus sheath sling vs Prolene strip | 1 | Mean Difference (IV, Fixed, 95% CI) | 0.0 [0.0, 0.0] | |
| 11.2 anterior rectus sheath sling vs anterior vaginal wall patch | 1 | Mean Difference (IV, Fixed, 95% CI) | 0.0 [0.0, 0.0] | |
| 11.3 Prolene strip vs anterior vaginal wall patch | 1 | Mean Difference (IV, Fixed, 95% CI) | 0.0 [0.0, 0.0] | |
| 12 Length of hospital stay (days) Show forest plot | 1 | Mean Difference (IV, Fixed, 95% CI) | Totals not selected | |
| 12.1 anterior rectus sheath sling vs Prolene strip | 1 | Mean Difference (IV, Fixed, 95% CI) | 0.0 [0.0, 0.0] | |
| 12.2 anterior rectus sheath sling vs anterior vaginal wall patch | 1 | Mean Difference (IV, Fixed, 95% CI) | 0.0 [0.0, 0.0] | |
| 12.3 Prolene strip vs anterior vaginal wall patch | 1 | Mean Difference (IV, Fixed, 95% CI) | 0.0 [0.0, 0.0] | |
| 13 Perioperative surgical complications Show forest plot | 3 | Risk Ratio (M‐H, Fixed, 95% CI) | Totals not selected | |
| 13.1 standard sling vs short sling | 1 | Risk Ratio (M‐H, Fixed, 95% CI) | 0.0 [0.0, 0.0] | |
| 13.2 rectus fascia sling vs Goretex sling | 1 | Risk Ratio (M‐H, Fixed, 95% CI) | 0.0 [0.0, 0.0] | |
| 13.3 fascial sling vs vaginal wall sling | 1 | Risk Ratio (M‐H, Fixed, 95% CI) | 0.0 [0.0, 0.0] | |
| 14 Bladder perforation Show forest plot | 3 | Risk Ratio (M‐H, Fixed, 95% CI) | Totals not selected | |
| 14.1 standard sling vs short sling | 1 | Risk Ratio (M‐H, Fixed, 95% CI) | 0.0 [0.0, 0.0] | |
| 14.2 fascial sling vs Pelvicol sling | 1 | Risk Ratio (M‐H, Fixed, 95% CI) | 0.0 [0.0, 0.0] | |
| 14.3 anterior rectus sheath sling vs Prolene strip | 1 | Risk Ratio (M‐H, Fixed, 95% CI) | 0.0 [0.0, 0.0] | |
| 14.4 anterior rectus sheath sling vs anterior vaginal wall patch | 1 | Risk Ratio (M‐H, Fixed, 95% CI) | 0.0 [0.0, 0.0] | |
| 14.5 Prolene strip vs anterior vaginal wall patch | 1 | Risk Ratio (M‐H, Fixed, 95% CI) | 0.0 [0.0, 0.0] | |
| 15 Urinary tract infection Show forest plot | 2 | Risk Ratio (M‐H, Fixed, 95% CI) | Totals not selected | |
| 15.1 standard sling vs short sling | 1 | Risk Ratio (M‐H, Fixed, 95% CI) | 0.0 [0.0, 0.0] | |
| 15.2 anterior vaginal wall sling vs biosynthetic mesh sling | 1 | Risk Ratio (M‐H, Fixed, 95% CI) | 0.0 [0.0, 0.0] | |
| 16 Vaginal bleeding Show forest plot | 1 | Risk Ratio (M‐H, Fixed, 95% CI) | Totals not selected | |
| 16.1 anterior vaginal wall sling vs biosynthetic mesh sling | 1 | Risk Ratio (M‐H, Fixed, 95% CI) | 0.0 [0.0, 0.0] | |
| 17 Long‐term adverse effects (wound pain) Show forest plot | 1 | Risk Ratio (M‐H, Fixed, 95% CI) | Totals not selected | |
| 17.1 fascial sling vs Pelvicol sling | 1 | Risk Ratio (M‐H, Fixed, 95% CI) | 0.0 [0.0, 0.0] | |
| 18 Voiding dysfunction Show forest plot | 6 | Risk Ratio (M‐H, Fixed, 95% CI) | Totals not selected | |
| 18.1 fascial sling vs Pelvicol sling | 1 | Risk Ratio (M‐H, Fixed, 95% CI) | 0.0 [0.0, 0.0] | |
| 18.2 standard sling vs short sling | 1 | Risk Ratio (M‐H, Fixed, 95% CI) | 0.0 [0.0, 0.0] | |
| 18.3 Vypro vs Ultrapro | 1 | Risk Ratio (M‐H, Fixed, 95% CI) | 0.0 [0.0, 0.0] | |
| 18.4 Vypro vs Prolene light | 1 | Risk Ratio (M‐H, Fixed, 95% CI) | 0.0 [0.0, 0.0] | |
| 18.5 Ultrapro vs Prolene light | 1 | Risk Ratio (M‐H, Fixed, 95% CI) | 0.0 [0.0, 0.0] | |
| 18.6 anterior vaginal wall sling vs biosynthetic mesh sling | 1 | Risk Ratio (M‐H, Fixed, 95% CI) | 0.0 [0.0, 0.0] | |
| 18.7 anterior rectus sheath sling vs Prolene strip | 1 | Risk Ratio (M‐H, Fixed, 95% CI) | 0.0 [0.0, 0.0] | |
| 18.8 anterior rectus sheath sling vs anterior vaginal wall patch | 1 | Risk Ratio (M‐H, Fixed, 95% CI) | 0.0 [0.0, 0.0] | |
| 18.9 Prolene strip vs anterior vaginal wall patch | 1 | Risk Ratio (M‐H, Fixed, 95% CI) | 0.0 [0.0, 0.0] | |
| 18.10 fascial sling vs vaginal wall sling | 1 | Risk Ratio (M‐H, Fixed, 95% CI) | 0.0 [0.0, 0.0] | |
| 19 Long‐term adverse effects (release of sling required) Show forest plot | 1 | Risk Ratio (M‐H, Fixed, 95% CI) | Totals not selected | |
| 19.1 fascial sling vs Pelvicol sling | 1 | Risk Ratio (M‐H, Fixed, 95% CI) | 0.0 [0.0, 0.0] | |
| 20 De novo detrusor urgency or urge symptoms or detrusor overactivity Show forest plot | 4 | Risk Ratio (M‐H, Fixed, 95% CI) | Totals not selected | |
| 20.1 standard sling vs short sling | 1 | Risk Ratio (M‐H, Fixed, 95% CI) | 0.0 [0.0, 0.0] | |
| 20.2 Vypro vs Ultrapro | 1 | Risk Ratio (M‐H, Fixed, 95% CI) | 0.0 [0.0, 0.0] | |
| 20.3 Vypro vs Prolene light | 1 | Risk Ratio (M‐H, Fixed, 95% CI) | 0.0 [0.0, 0.0] | |
| 20.4 Ultrapro vs Prolene light | 1 | Risk Ratio (M‐H, Fixed, 95% CI) | 0.0 [0.0, 0.0] | |
| 20.5 autologous dermal graft patch vs cadaveric fascia lata | 1 | Risk Ratio (M‐H, Fixed, 95% CI) | 0.0 [0.0, 0.0] | |
| 20.6 rectus fascia sling vs Goretex sling | 1 | Risk Ratio (M‐H, Fixed, 95% CI) | 0.0 [0.0, 0.0] | |
| 21 Repeat surgery for urinary incontinence at first year Show forest plot | 1 | Risk Ratio (M‐H, Fixed, 95% CI) | Totals not selected | |
| 21.1 Fascial sling vs Pelvicol sling | 1 | Risk Ratio (M‐H, Fixed, 95% CI) | 0.0 [0.0, 0.0] | |
| 22 Long‐term adverse effects (vaginal mesh or graft exposure) Show forest plot | 3 | Risk Ratio (M‐H, Fixed, 95% CI) | Totals not selected | |
| 22.1 fascial sling vs Pelvicol sling | 1 | Risk Ratio (M‐H, Fixed, 95% CI) | 0.0 [0.0, 0.0] | |
| 22.2 Vypro vs Ultrapro | 1 | Risk Ratio (M‐H, Fixed, 95% CI) | 0.0 [0.0, 0.0] | |
| 22.3 Vypro vs Prolene light | 1 | Risk Ratio (M‐H, Fixed, 95% CI) | 0.0 [0.0, 0.0] | |
| 22.4 Ultrapro vs Prolene light | 1 | Risk Ratio (M‐H, Fixed, 95% CI) | 0.0 [0.0, 0.0] | |
| 22.5 anterior vaginal wall sling vs biosynthetic mesh sling | 1 | Risk Ratio (M‐H, Fixed, 95% CI) | 0.0 [0.0, 0.0] | |
| 23 Condition‐specific measures to assess quality of life (ICI‐Q short form UI score at 1 year) Show forest plot | 1 | Mean Difference (IV, Fixed, 95% CI) | Totals not selected | |
| 23.1 Vypro vs Ultrapro | 1 | Mean Difference (IV, Fixed, 95% CI) | 0.0 [0.0, 0.0] | |
| 23.2 Vypro vs Prolene light | 1 | Mean Difference (IV, Fixed, 95% CI) | 0.0 [0.0, 0.0] | |
| 23.3 Ultrapro vs Prolene light | 1 | Mean Difference (IV, Fixed, 95% CI) | 0.0 [0.0, 0.0] | |
| 24 Condition‐specific measures to assess quality of life (ICI‐Q short form UI score at 1 to 5 years) Show forest plot | 1 | Mean Difference (IV, Fixed, 95% CI) | Totals not selected | |
| 24.1 Vypro vs Ultrapro | 1 | Mean Difference (IV, Fixed, 95% CI) | 0.0 [0.0, 0.0] | |
| 24.2 Vypro vs Prolene light | 1 | Mean Difference (IV, Fixed, 95% CI) | 0.0 [0.0, 0.0] | |
| 24.3 Ultrapro vs Prolene light | 1 | Mean Difference (IV, Fixed, 95% CI) | 0.0 [0.0, 0.0] | |