Traditional suburethral sling operations for urinary incontinence in women
Información
- DOI:
- https://doi.org/10.1002/14651858.CD001754.pub4Copiar DOI

- Base de datos:
-
- Cochrane Database of Systematic Reviews
- Versión publicada:
-
- 26 julio 2017see what's new
- Tipo:
-
- Intervention
- Etapa:
-
- Review
- Grupo Editorial Cochrane:
-
Grupo Cochrane de Incontinencia
- Copyright:
-
- Copyright © 2017 The Cochrane Collaboration. Published by John Wiley & Sons, Ltd.
Cifras del artículo
Altmetric:
Citado por:
Autores
Contributions of authors
The review was conceived by CB and HB, and updated by HR and DJC. CB co‐ordinated the steps of the review process with the help of DJC. Screening papers, appraising their quality and abstracting data were done by CB, HB and HR separately (published data only). The review was written by CB who extracted, analysed and interpreted data with the help of HB, and updated by HR. DJC assisted in the update for Feb 2003 by appraising, quality assessing, extracting data and assisting with interpretation.
For the July 2017 addition of the brief economic commentaries (BECs) to this review, Patricia Aluko was responsible for the entire BEC‐related work on this review she ran the search for studies, screened the searches, extracted data from relevant studies, revised any existing economics‐related text, added the BEC‐related text, and responded to any peer referee comments. All review authors had the opportunity to comment on the revised review.
Sources of support
Internal sources
-
Federal University of Sao Paulo ‐ Sao Paulo, Brazil.
-
Faculty of Medicine of Foudation of ABC, Brazil.
External sources
-
National Institute for Health Research, UK.
This project was supported by the National Institute for Health Research, via Cochrane Infrastructure funding to Cochrane Incontinence. The views and opinions expressed therein are those of the review authors and do not necessarily reflect those of the Systematic Reviews Programme, NIHR, NHS or the Department of Health. The NIHR is the largest single funder of Cochrane Incontinence.
-
National Institute for Health Research, UK.
This project, to add brief economic commentaries to Cochrane Incontinence's reviews on surgery for urinary incontinence in women, was supported by the National Institute for Health Research (NIHR), via the Cochrane Review Incentive Scheme 2016, to Cochrane Incontinence. The views and opinions expressed therein are those of the review authors and do not necessarily reflect those of the Systematic Reviews Programme, NIHR, NHS or the Department of Health.
Declarations of interest
Haroon Rehman: no interests to declare
Carlos CB Bezerra: no interests to declare
Homero Bruschini: no interests to declare
June D Cody: no interests to declare
Patricia Aluko: July 2017 ‐ this project, to add brief economic commentaries to Cochrane Incontinence's reviews on surgery for urinary incontinence in women was supported by the National Institute for Health Research (NIHR), via the Cochrane Review Incentive Scheme 2016, to Cochrane Incontinence. The views and opinions expressed herein are those of the authors and do not necessarily reflect those of the Systematic Reviews Programme, NIHR, NHS or the Department of Health.
Acknowledgements
We would like to express our thanks to Sheila Wallace who helped us by providing information not found in Brazil. We are also very grateful to Professor Aldemar Araujo Castro from the Brazilian Cochrane Centre who provided a prompt and valuable contribution to the review. Professor Adrian Grant provided advice with interpretation of data and the final form of the first version of the review. Dr Jonathan Cook provided expert statistical advice.
Version history
| Published | Title | Stage | Authors | Version |
| 2020 Jan 28 | Traditional suburethral sling operations for urinary incontinence in women | Review | Lucky Saraswat, Haroon Rehman, Muhammad Imran Omar, June D Cody, Patricia Aluko, Cathryn MA Glazener | |
| 2017 Jul 26 | Traditional suburethral sling operations for urinary incontinence in women | Review | Haroon Rehman, Carlos A Bezerra, Homero Bruschini, June D Cody, Patricia Aluko | |
| 2011 Jan 19 | Traditional suburethral sling operations for urinary incontinence in women | Review | Haroon Rehman, Carlos CB Bezerra, Homero Bruschini, June D Cody | |
| 2005 Jul 20 | Traditional suburethral sling operations for urinary incontinence in women | Review | Carlos CB Bezerra, Homero Bruschini, June D Cody | |
| 2001 Jul 23 | Suburethral sling operations for urinary incontinence in women | Review | Carlos CB Bezerra, Homero Bruschini, D J Cody, June D Cody | |
Differences between protocol and review
July 2017 update – Brief economic commentaries (BECs) have been added to all of Cochrane Incontinence's reviews on surgery for urinary incontinence in women. The economic elements throughout the review have been revised – if incorrect they have been stripped out. New economics‐related text has been added. This involved revisions to the Background section, Methods section (e.g. search section referring to added Appendix), Discussion section, Abstract and Plain language summary. An appendix has been added with details of the economics searches. The conclusions of the review have not changed. The rest of the review has not changed.
Keywords
MeSH
Medical Subject Headings (MeSH) Keywords
Medical Subject Headings Check Words
Female; Humans;
PICO

Comparison 3 Sling versus drugs, Outcome 1 Number with incontinence (worse, unchanged or improved) within the first year (women's observations).
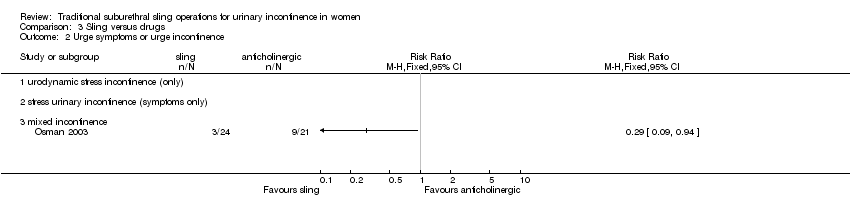
Comparison 3 Sling versus drugs, Outcome 2 Urge symptoms or urge incontinence.

Comparison 4 Sling versus injectable, Outcome 1 Number with incontinence (worse, unchanged or improved) within the first year (women's observations).
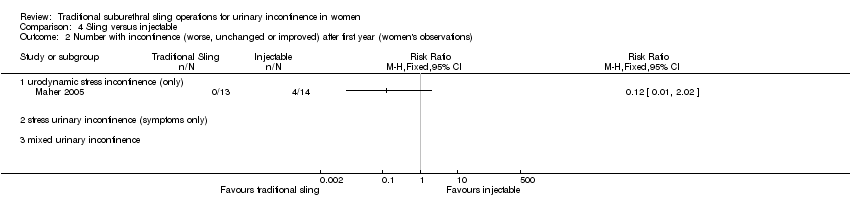
Comparison 4 Sling versus injectable, Outcome 2 Number with incontinence (worse, unchanged or improved) after first year (women's observations).

Comparison 4 Sling versus injectable, Outcome 3 Number with incontinence (clinician's observations) within first year.

Comparison 4 Sling versus injectable, Outcome 4 Voiding dysfunction.

Comparison 4 Sling versus injectable, Outcome 5 De novo detrusor overactivity (urodynamic diagnosis).
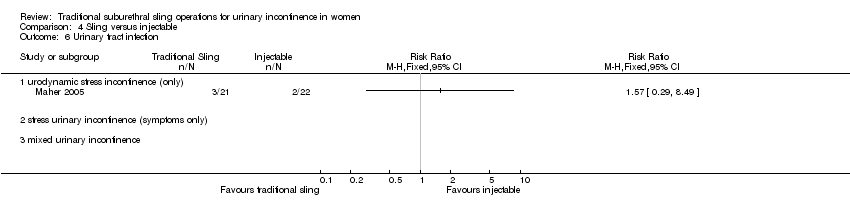
Comparison 4 Sling versus injectable, Outcome 6 Urinary tract infection.

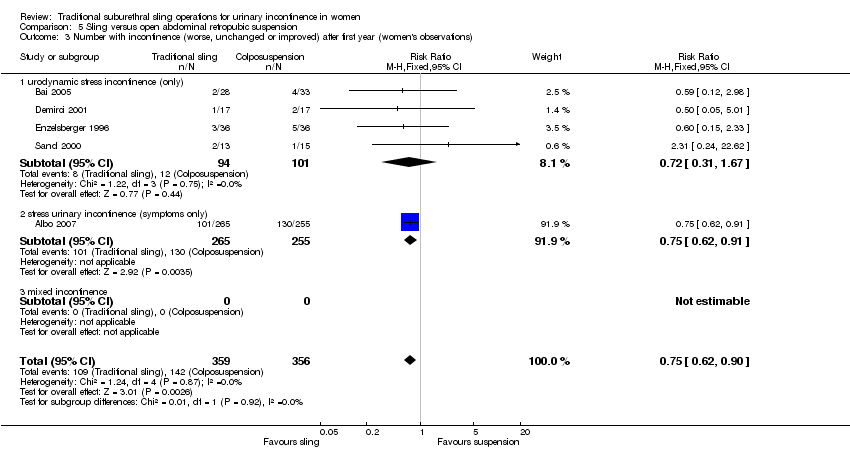
Comparison 5 Sling versus open abdominal retropubic suspension, Outcome 1 Number with incontinence (worse, unchanged or improved) within the first year (women's observations).
Comparison 5 Sling versus open abdominal retropubic suspension, Outcome 3 Number with incontinence (worse, unchanged or improved) after first year (women's observations).
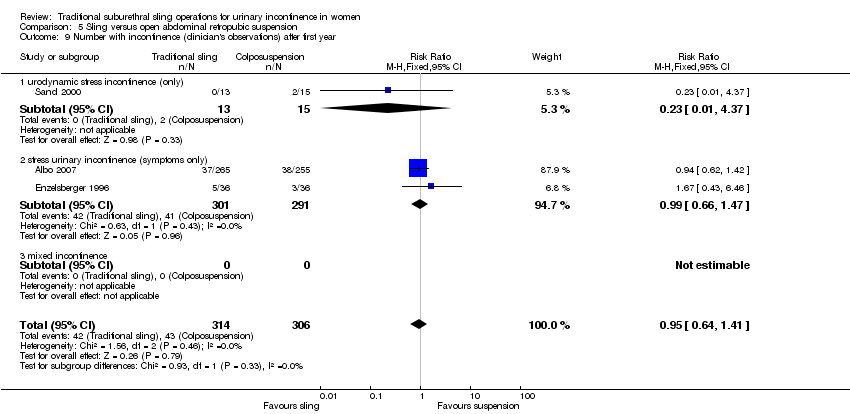
Comparison 5 Sling versus open abdominal retropubic suspension, Outcome 9 Number with incontinence (clinician's observations) after first year.

Comparison 5 Sling versus open abdominal retropubic suspension, Outcome 10 Operative time (minutes).

Comparison 5 Sling versus open abdominal retropubic suspension, Outcome 11 Time to catheter removal (days).
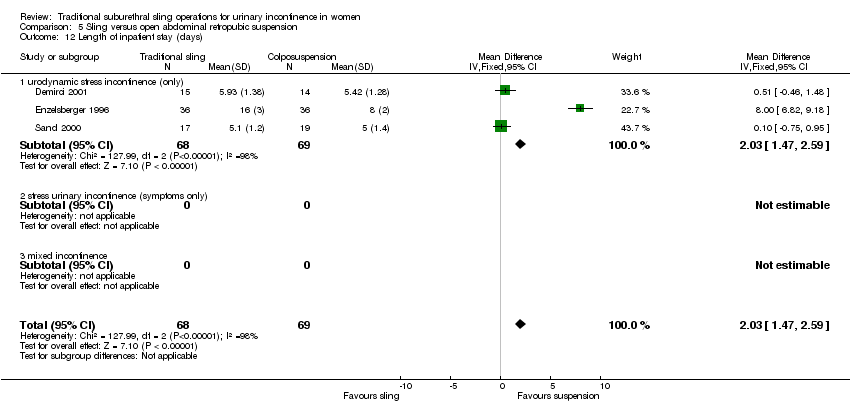
Comparison 5 Sling versus open abdominal retropubic suspension, Outcome 12 Length of inpatient stay (days).
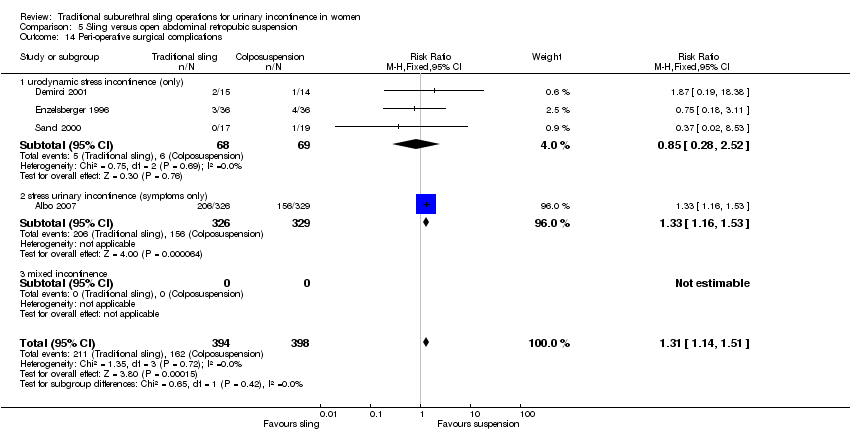
Comparison 5 Sling versus open abdominal retropubic suspension, Outcome 14 Peri‐operative surgical complications.

Comparison 5 Sling versus open abdominal retropubic suspension, Outcome 15 Bladder perforation.
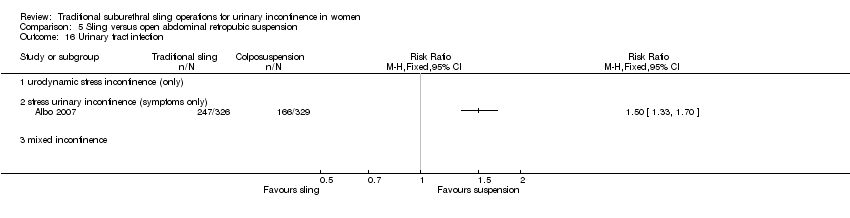
Comparison 5 Sling versus open abdominal retropubic suspension, Outcome 16 Urinary tract infection.

Comparison 5 Sling versus open abdominal retropubic suspension, Outcome 17 Urge symptoms or urge incontinence.

Comparison 5 Sling versus open abdominal retropubic suspension, Outcome 18 Detrusor overactivity (urodynamic diagnosis).

Comparison 5 Sling versus open abdominal retropubic suspension, Outcome 19 Voiding dysfunction after three months.
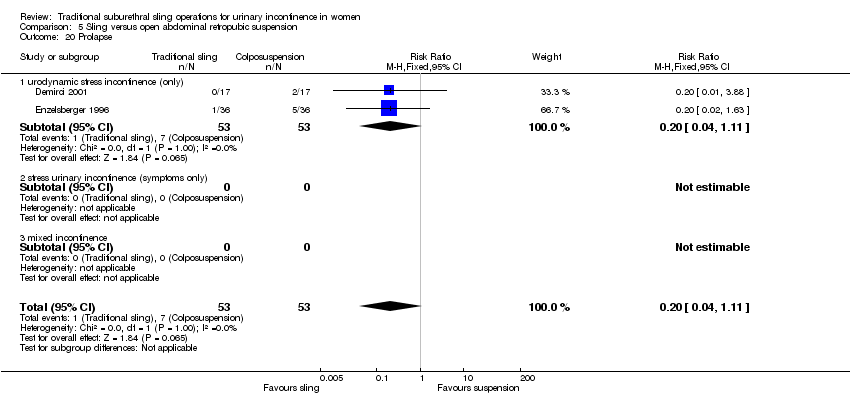
Comparison 5 Sling versus open abdominal retropubic suspension, Outcome 20 Prolapse.

Comparison 6 Sling versus bladder neck (needle) suspension, Outcome 1 Number with incontinence (worse, unchanged or improved) within the first year (women's observations).
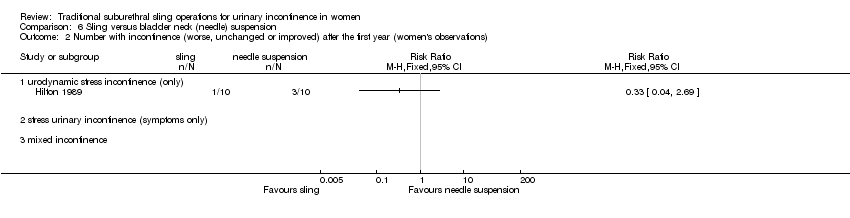
Comparison 6 Sling versus bladder neck (needle) suspension, Outcome 2 Number with incontinence (worse, unchanged or improved) after the first year (women's observations).
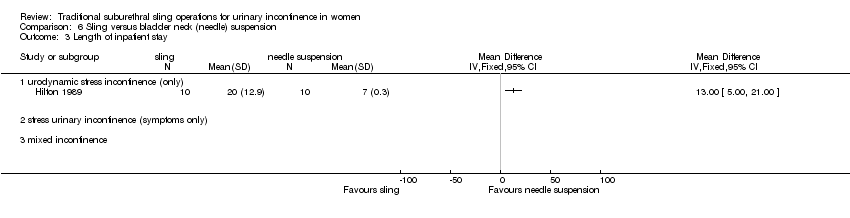
Comparison 6 Sling versus bladder neck (needle) suspension, Outcome 3 Length of inpatient stay.
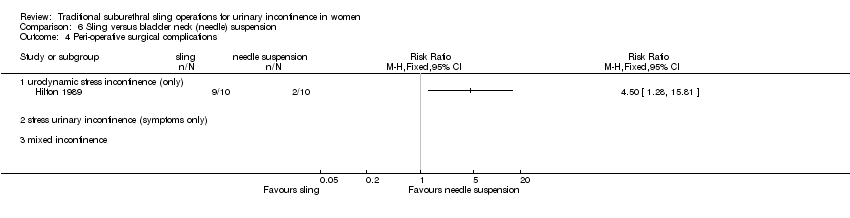
Comparison 6 Sling versus bladder neck (needle) suspension, Outcome 4 Peri‐operative surgical complications.
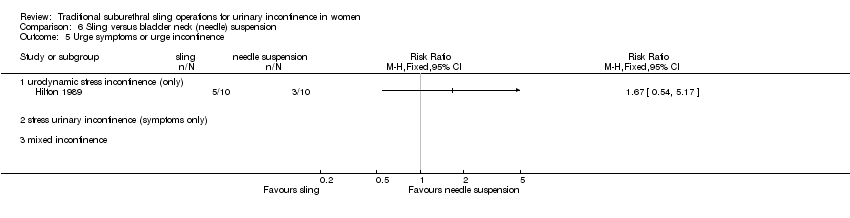
Comparison 6 Sling versus bladder neck (needle) suspension, Outcome 5 Urge symptoms or urge incontinence.

Comparison 6 Sling versus bladder neck (needle) suspension, Outcome 6 Voiding dysfunction after three months.

Comparison 6 Sling versus bladder neck (needle) suspension, Outcome 7 Detrusor overactivity (urodynamic diagnosis).

Comparison 9 Traditional sling versus minimally invasive sling operation, Outcome 1 Number with incontinence (worse, unchanged or improved) within the first year (women's observations).
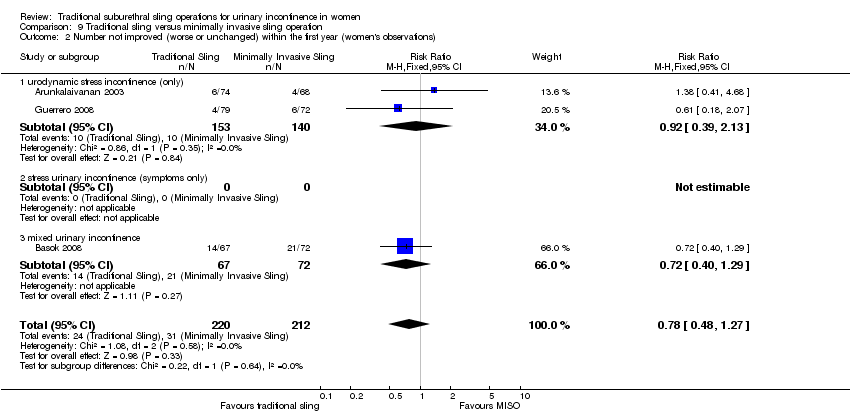
Comparison 9 Traditional sling versus minimally invasive sling operation, Outcome 2 Number not improved (worse or unchanged) within the first year (women's observations).
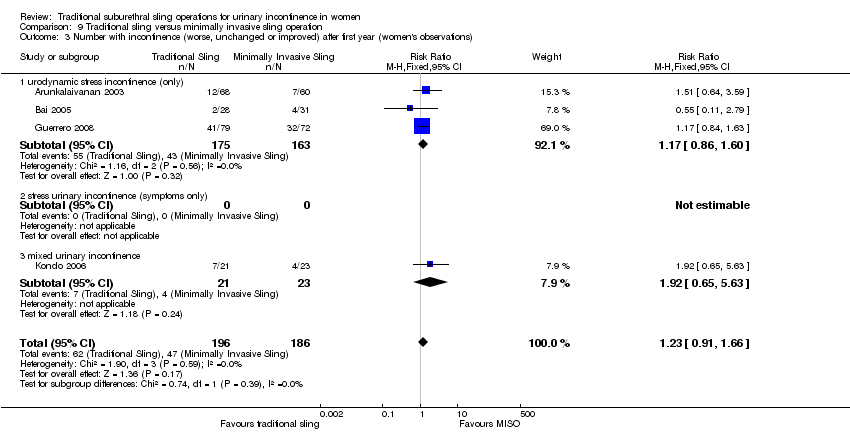
Comparison 9 Traditional sling versus minimally invasive sling operation, Outcome 3 Number with incontinence (worse, unchanged or improved) after first year (women's observations).

Comparison 9 Traditional sling versus minimally invasive sling operation, Outcome 4 Number not improved (worse or unchanged) after the first year (women's observations).

Comparison 9 Traditional sling versus minimally invasive sling operation, Outcome 5 Pad test: mean weight of urine.

Comparison 9 Traditional sling versus minimally invasive sling operation, Outcome 6 Number with incontinence (clinician's observations) within first year.

Comparison 9 Traditional sling versus minimally invasive sling operation, Outcome 7 Number with incontinence (clinician's observations) after first year.

Comparison 9 Traditional sling versus minimally invasive sling operation, Outcome 8 Operative time (mins).

Comparison 9 Traditional sling versus minimally invasive sling operation, Outcome 9 Length of hospital stay (days).

Comparison 9 Traditional sling versus minimally invasive sling operation, Outcome 10 Time to catheter removal (days).
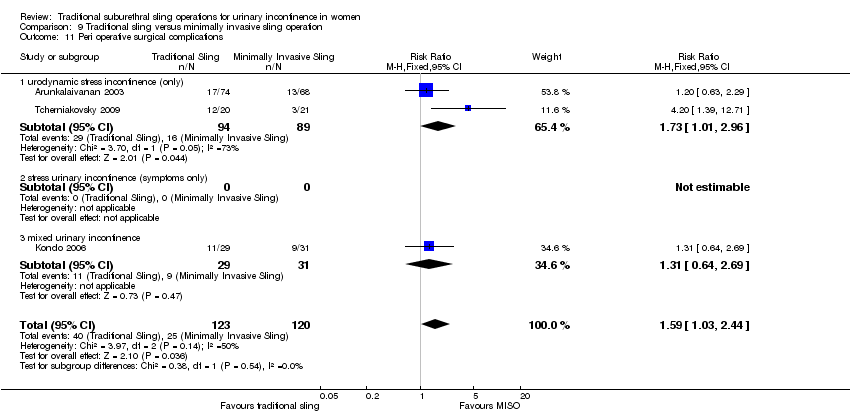
Comparison 9 Traditional sling versus minimally invasive sling operation, Outcome 11 Peri operative surgical complications.

Comparison 9 Traditional sling versus minimally invasive sling operation, Outcome 12 Bladder perforations.

Comparison 9 Traditional sling versus minimally invasive sling operation, Outcome 13 Urethral injury.

Comparison 9 Traditional sling versus minimally invasive sling operation, Outcome 14 De novo detrusor urgency or urge symptoms.

Comparison 9 Traditional sling versus minimally invasive sling operation, Outcome 15 De novo detrusor overactivity (urodynamic diagnosis).

Comparison 9 Traditional sling versus minimally invasive sling operation, Outcome 16 Voiding dysfunction.
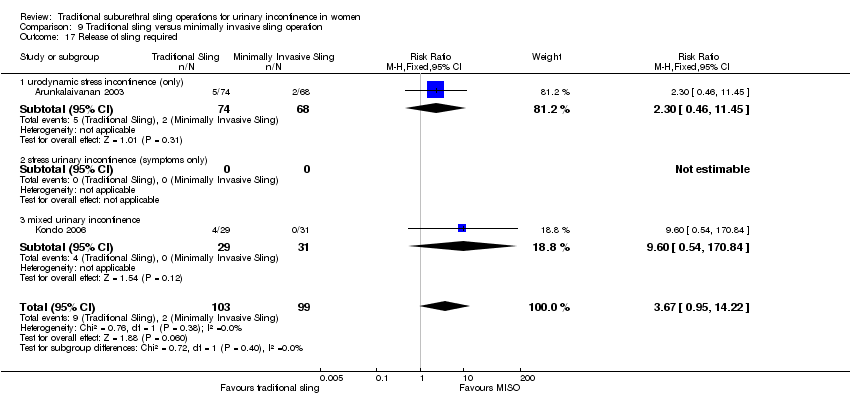
Comparison 9 Traditional sling versus minimally invasive sling operation, Outcome 17 Release of sling required.
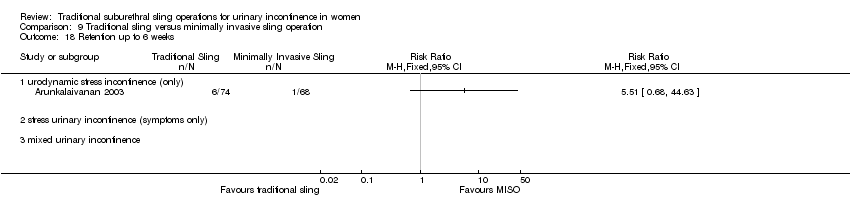
Comparison 9 Traditional sling versus minimally invasive sling operation, Outcome 18 Retention up to 6 weeks.
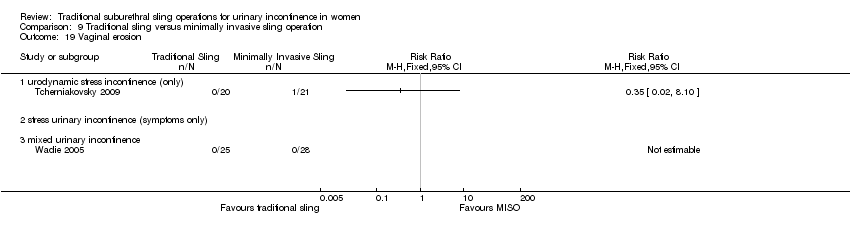
Comparison 9 Traditional sling versus minimally invasive sling operation, Outcome 19 Vaginal erosion.

Comparison 9 Traditional sling versus minimally invasive sling operation, Outcome 20 Wound pain (6 months).
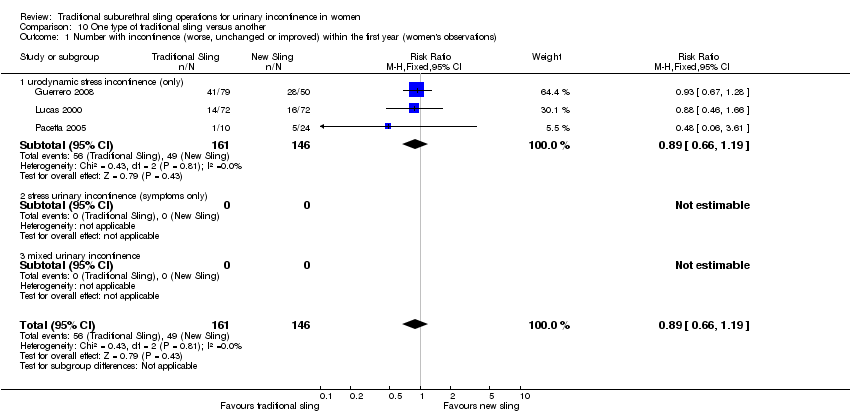
Comparison 10 One type of traditional sling versus another, Outcome 1 Number with incontinence (worse, unchanged or improved) within the first year (women's observations).

Comparison 10 One type of traditional sling versus another, Outcome 2 Number not improved (worse or unchanged) within the first year (women's observations).

Comparison 10 One type of traditional sling versus another, Outcome 3 Number with incontinence (worse, unchanged or improved) after first year (women's observations).

Comparison 10 One type of traditional sling versus another, Outcome 4 Number not improved (worse or unchanged) after the first year (women's observations).

Comparison 10 One type of traditional sling versus another, Outcome 5 Number with incontinence (worse, unchanged or improved) after five years (women's observations).

Comparison 10 One type of traditional sling versus another, Outcome 6 Pad test: mean weight of urine.

Comparison 10 One type of traditional sling versus another, Outcome 7 Operative time (mins).

Comparison 10 One type of traditional sling versus another, Outcome 8 Peri operative surgical complications.

Comparison 10 One type of traditional sling versus another, Outcome 9 Bladder perforation.
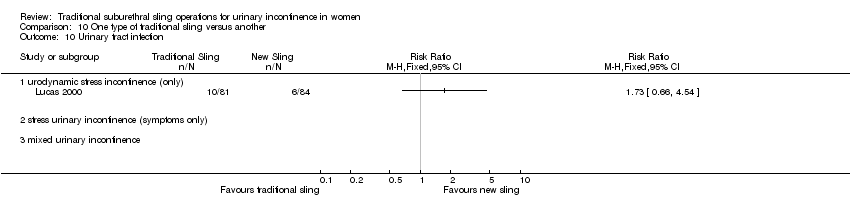
Comparison 10 One type of traditional sling versus another, Outcome 10 Urinary tract infection.

Comparison 10 One type of traditional sling versus another, Outcome 11 De novo detrusor urgency or urge symptoms or detrusor overactivity.

Comparison 10 One type of traditional sling versus another, Outcome 12 Voiding dysfunction.

Comparison 10 One type of traditional sling versus another, Outcome 13 De novo detrusor overactivity (urodynamic diagnosis).
| Traditional suburethral slings compared to injectable treatment for stress urinary incontinence | ||||||
| Patient or population: women with stress urinary incontinence | ||||||
| Outcomes | Illustrative comparative risks* (95% CI) | Relative effect | No of participants | Quality of the evidence | Comments | |
| Assumed risk | Corresponding risk | |||||
| Injectable treatment | Traditional suburethral slings | |||||
| 4.1 Number with incontinence (worse, unchanged or improved) within the first year (women's observations) | 227 per 10001 | 95 per 1000 | RR 0.42 | 43 | ⊕⊝⊝⊝ | Single trial with few participants |
| 4.2 Number with incontinence (worse, unchanged or improved) after first year (women's observations) | 286 per 10001 | 34 per 1000 | RR 0.12 | 27 | ⊕⊕⊝⊝ | Single trial with few participants |
| 4.4 Voiding dysfunction | 45 per 10001 | 189 per 1000 | RR 4.19 | 43 | ⊕⊕⊝⊝ | Single trial with few participants |
| *The basis for the assumed risk (e.g. the median control group risk across studies) is provided in footnotes. The corresponding risk (and its 95% confidence interval) is based on the assumed risk in the comparison group and the relative effect of the intervention (and its 95% CI). | ||||||
| GRADE Working Group grades of evidence | ||||||
| 1Illustrative comparative risks were based upon the mean risk on control intervention in the studies included in the meta‐analysis. | ||||||
| Traditional suburethral sling operation compared to open abdominal retropubic suspension for stress urinary incontinence | ||||||
| Patient or population: women with stress urinary incontinence | ||||||
| Outcomes | Illustrative comparative risks* (95% CI) | Relative effect | No of participants | Quality of the evidence | Comments | |
| Assumed risk | Corresponding risk | |||||
| Open abdominal retropubic suspension | Traditional suburethral sling operation | |||||
| 5.1 Number with incontinence (worse, unchanged or improved) within the first year (women's observations) | 92 per 10001 | 37 per 1000 | RR 0.4 | 147 | ⊕⊕⊝⊝ | Fischer trial did not account for incomplete outcome data |
| 5.3 Number with incontinence (worse, unchanged or improved) after first year (women's observations) | 399 per 10001 | 299 per 1000 | RR 0.75 | 715 | ⊕⊕⊕⊝ | Demirci did not account for incomplete outcome data |
| 5.14 Peri‐operative surgical complications | 407 per 10001 | 533 per 1000 | RR 1.31 | 792 | ⊕⊕⊕⊝ | |
| 5.15 Bladder perforation | 30 per 10001 | 0 per 1000 | RR 0 | 655 | ⊕⊕⊕⊝ | Single study thus no pooled data available |
| 5.18 Voiding dysfunction after three months | 21 per 10001 | 128 per 1000 | RR 6.08 | 853 | ⊕⊕⊕⊝ | |
| 5.21 Repeat incontinence surgery ‐ not reported | See comment | See comment | Not estimable | ‐ | See comment | No data |
| *The basis for the assumed risk (e.g. the median control group risk across studies) is provided in footnotes. The corresponding risk (and its 95% confidence interval) is based on the assumed risk in the comparison group and the relative effect of the intervention (and its 95% CI). | ||||||
| GRADE Working Group grades of evidence | ||||||
| 1Illustrative comparative risks were based upon the mean risk on control intervention in the studies included in the meta‐analysis. | ||||||
| Traditional suburethral sling operation compared to bladder neck (needle) suspension for stress urinary incontinence | ||||||
| Patient or population: women with stress urinary incontinence | ||||||
| Outcomes | Illustrative comparative risks* (95% CI) | Relative effect | No of participants | Quality of the evidence | Comments | |
| Assumed risk | Corresponding risk | |||||
| Bladder neck (needle) suspension | Traditional suburethral sling operation | |||||
| 6.1 Number with incontinence (worse, unchanged or improved) within the first year (women's observations) | 200 per 10001 | 100 per 1000 | RR 0.5 | 20 | ⊕⊝⊝⊝ | |
| 6.2 Number with incontinence (worse, unchanged or improved) after the first year (women's observations) | 300 per 10001 | 99 per 1000 | RR 0.33 | 20 | ⊕⊝⊝⊝ | |
| 6.4 Peri‐operative surgical complications | 200 per 10001 | 900 per 1000 | RR 4.5 | 20 | ⊕⊕⊝⊝ | |
| 6.6 Voiding dysfunction after three months ‐ urodynamic stress incontinence (only) | 200 per 10001 | 400 per 1000 | RR 2 | 20 | ⊕⊝⊝⊝ | |
| *The basis for the assumed risk (e.g. the median control group risk across studies) is provided in footnotes. The corresponding risk (and its 95% confidence interval) is based on the assumed risk in the comparison group and the relative effect of the intervention (and its 95% CI). | ||||||
| GRADE Working Group grades of evidence | ||||||
| 1Illustrative comparative risks were based upon the mean risk on control intervention in the studies included in the meta‐analysis. | ||||||
| Traditional suburethral sling operation compared to minimally invasive synthetic slings for stress urinary incontinence | ||||||
| Patient or population: women with stress urinary incontinence | ||||||
| Outcomes | Illustrative comparative risks* (95% CI) | Relative effect | No of participants | Quality of the evidence | Comments | |
| Assumed risk | Corresponding risk | |||||
| Minimally invasive slings | Traditional suburethral sling operation | |||||
| 9.1 Number with incontinence (worse, unchanged or improved) within the first year (women's observations) | 275 per 10001 | 267 per 1000 | RR 0.97 | 693 | ⊕⊕⊕⊕ | |
| 9.3 Number with incontinence (worse, unchanged or improved) after first year (women's observations) | 253 per 10001 | 311 per 1000 | RR 1.23 | 382 | ⊕⊕⊝⊝ | |
| 9.11 Peri‐operative surgical complications | 208 per 10001 | 331 per 1000 | RR 1.59 | 243 | ⊕⊕⊝⊝ | |
| 9.12 Bladder perforations | 82 per 10001 | 51 per 1000 | RR 0.62 | 563 | ⊕⊕⊕⊝ | |
| 9.16 Voiding dysfunction | 98 per 10001 | 157 per 1000 | RR 1.6 | 375 | ⊕⊕⊕⊝ | |
| *The basis for the assumed risk (e.g. the median control group risk across studies) is provided in footnotes. The corresponding risk (and its 95% confidence interval) is based on the assumed risk in the comparison group and the relative effect of the intervention (and its 95% CI). | ||||||
| GRADE Working Group grades of evidence | ||||||
| 1Illustrative comparative risks were based upon the mean risk on control intervention in the studies included in the meta‐analysis. | ||||||
| Traditional suburethral sling operation compared to another traditional suburethral sling for stress urinary incontinence | ||||||
| Patient or population: women with stress urinary incontinence | ||||||
| Outcomes | Illustrative comparative risks* (95% CI) | Relative effect | No of participants | Quality of the evidence | Comments | |
| Assumed risk | Corresponding risk | |||||
| Another traditional suburethral sling | Traditional suburethral sling operation | |||||
| 10.1 Number with incontinence (worse, unchanged or improved) within the first year (women's observations) | 336 per 10001 | 299 per 1000 | RR 0.89 | 307 | ⊕⊕⊕⊝ | |
| 10.3 Number with incontinence (worse, unchanged or improved) after first year (women's observations) | 467 per 10001 | 416 per 1000 | RR 0.89 | 379 | ⊕⊕⊕⊝ | |
| 10.8 Peri‐operative surgical complications | 360 per 10001 | 335 per 1000 | RR 0.93 | 213 | ⊕⊕⊝⊝ | |
| 10.12 Voiding dysfunction | 202 per 10001 | 234 per 1000 | RR 1.16 | 165 | ⊕⊕⊕⊝ | |
| *The basis for the assumed risk (e.g. the median control group risk across studies) is provided in footnotes. The corresponding risk (and its 95% confidence interval) is based on the assumed risk in the comparison group and the relative effect of the intervention (and its 95% CI). | ||||||
| GRADE Working Group grades of evidence | ||||||
| 1Illustrative comparative risks were based upon the mean risk on control intervention in the studies included in the meta‐analysis. | ||||||
| Outcome or subgroup title | No. of studies | No. of participants | Statistical method | Effect size |
| 1 Number with incontinence (worse, unchanged or improved) within the first year (women's observations) Show forest plot | 1 | Risk Ratio (M‐H, Fixed, 95% CI) | Totals not selected | |
| 1.1 urodynamic stress incontinence (only) | 0 | Risk Ratio (M‐H, Fixed, 95% CI) | 0.0 [0.0, 0.0] | |
| 1.2 stress urinary incontinence (symptoms only) | 0 | Risk Ratio (M‐H, Fixed, 95% CI) | 0.0 [0.0, 0.0] | |
| 1.3 mixed incontinence | 1 | Risk Ratio (M‐H, Fixed, 95% CI) | 0.0 [0.0, 0.0] | |
| 2 Urge symptoms or urge incontinence Show forest plot | 1 | Risk Ratio (M‐H, Fixed, 95% CI) | Totals not selected | |
| 2.1 urodynamic stress incontinence (only) | 0 | Risk Ratio (M‐H, Fixed, 95% CI) | 0.0 [0.0, 0.0] | |
| 2.2 stress urinary incontinence (symptoms only) | 0 | Risk Ratio (M‐H, Fixed, 95% CI) | 0.0 [0.0, 0.0] | |
| 2.3 mixed incontinence | 1 | Risk Ratio (M‐H, Fixed, 95% CI) | 0.0 [0.0, 0.0] | |
| Outcome or subgroup title | No. of studies | No. of participants | Statistical method | Effect size |
| 1 Number with incontinence (worse, unchanged or improved) within the first year (women's observations) Show forest plot | 1 | Risk Ratio (M‐H, Fixed, 95% CI) | Totals not selected | |
| 1.1 urodynamic stress incontinence (only) | 1 | Risk Ratio (M‐H, Fixed, 95% CI) | 0.0 [0.0, 0.0] | |
| 1.2 stress urinary incontinence (symptoms only) | 0 | Risk Ratio (M‐H, Fixed, 95% CI) | 0.0 [0.0, 0.0] | |
| 1.3 mixed urinary incontinence | 0 | Risk Ratio (M‐H, Fixed, 95% CI) | 0.0 [0.0, 0.0] | |
| 2 Number with incontinence (worse, unchanged or improved) after first year (women's observations) Show forest plot | 1 | Risk Ratio (M‐H, Fixed, 95% CI) | Totals not selected | |
| 2.1 urodynamic stress incontinence (only) | 1 | Risk Ratio (M‐H, Fixed, 95% CI) | 0.0 [0.0, 0.0] | |
| 2.2 stress urinary incontinence (symptoms only) | 0 | Risk Ratio (M‐H, Fixed, 95% CI) | 0.0 [0.0, 0.0] | |
| 2.3 mixed urinary incontinence | 0 | Risk Ratio (M‐H, Fixed, 95% CI) | 0.0 [0.0, 0.0] | |
| 3 Number with incontinence (clinician's observations) within first year Show forest plot | 1 | Risk Ratio (M‐H, Fixed, 95% CI) | Totals not selected | |
| 3.1 urodynamic stress incontinence (only) | 1 | Risk Ratio (M‐H, Fixed, 95% CI) | 0.0 [0.0, 0.0] | |
| 3.2 stress urinary incontinence (symptoms only) | 0 | Risk Ratio (M‐H, Fixed, 95% CI) | 0.0 [0.0, 0.0] | |
| 3.3 mixed urinary incontinence | 0 | Risk Ratio (M‐H, Fixed, 95% CI) | 0.0 [0.0, 0.0] | |
| 4 Voiding dysfunction Show forest plot | 1 | Risk Ratio (M‐H, Fixed, 95% CI) | Totals not selected | |
| 4.1 urodynamic stress incontinence (only) | 1 | Risk Ratio (M‐H, Fixed, 95% CI) | 0.0 [0.0, 0.0] | |
| 4.2 stress urinary incontinence (symptoms only) | 0 | Risk Ratio (M‐H, Fixed, 95% CI) | 0.0 [0.0, 0.0] | |
| 4.3 mixed urinary incontinence | 0 | Risk Ratio (M‐H, Fixed, 95% CI) | 0.0 [0.0, 0.0] | |
| 5 De novo detrusor overactivity (urodynamic diagnosis) Show forest plot | 1 | Risk Ratio (M‐H, Fixed, 95% CI) | Totals not selected | |
| 5.1 urodynamic stress incontinence (only) | 1 | Risk Ratio (M‐H, Fixed, 95% CI) | 0.0 [0.0, 0.0] | |
| 5.2 stress urinary incontinence (symptoms only) | 0 | Risk Ratio (M‐H, Fixed, 95% CI) | 0.0 [0.0, 0.0] | |
| 5.3 mixed urinary incontinence | 0 | Risk Ratio (M‐H, Fixed, 95% CI) | 0.0 [0.0, 0.0] | |
| 6 Urinary tract infection Show forest plot | 1 | Risk Ratio (M‐H, Fixed, 95% CI) | Totals not selected | |
| 6.1 urodynamic stress incontinence (only) | 1 | Risk Ratio (M‐H, Fixed, 95% CI) | 0.0 [0.0, 0.0] | |
| 6.2 stress urinary incontinence (symptoms only) | 0 | Risk Ratio (M‐H, Fixed, 95% CI) | 0.0 [0.0, 0.0] | |
| 6.3 mixed urinary incontinence | 0 | Risk Ratio (M‐H, Fixed, 95% CI) | 0.0 [0.0, 0.0] | |
| Outcome or subgroup title | No. of studies | No. of participants | Statistical method | Effect size |
| 1 Number with incontinence (worse, unchanged or improved) within the first year (women's observations) Show forest plot | 4 | 147 | Risk Ratio (M‐H, Fixed, 95% CI) | 0.40 [0.11, 1.41] |
| 1.1 urodynamic stress incontinence (only) | 4 | 147 | Risk Ratio (M‐H, Fixed, 95% CI) | 0.40 [0.11, 1.41] |
| 1.2 stress urinary incontinence (symptoms only) | 0 | 0 | Risk Ratio (M‐H, Fixed, 95% CI) | 0.0 [0.0, 0.0] |
| 1.3 mixed incontinence | 0 | 0 | Risk Ratio (M‐H, Fixed, 95% CI) | 0.0 [0.0, 0.0] |
| 2 Number not improved (worse or unchanged) within the first year (women's observations) | 0 | 0 | Risk Ratio (M‐H, Fixed, 95% CI) | 0.0 [0.0, 0.0] |
| 2.1 urodynamic stress incontinence (only) | 0 | 0 | Risk Ratio (M‐H, Fixed, 95% CI) | 0.0 [0.0, 0.0] |
| 2.2 stress urinary incontinence (symptoms only) | 0 | 0 | Risk Ratio (M‐H, Fixed, 95% CI) | 0.0 [0.0, 0.0] |
| 2.3 mixed incontinence | 0 | 0 | Risk Ratio (M‐H, Fixed, 95% CI) | 0.0 [0.0, 0.0] |
| 3 Number with incontinence (worse, unchanged or improved) after first year (women's observations) Show forest plot | 5 | 715 | Risk Ratio (M‐H, Fixed, 95% CI) | 0.75 [0.62, 0.90] |
| 3.1 urodynamic stress incontinence (only) | 4 | 195 | Risk Ratio (M‐H, Fixed, 95% CI) | 0.72 [0.31, 1.67] |
| 3.2 stress urinary incontinence (symptoms only) | 1 | 520 | Risk Ratio (M‐H, Fixed, 95% CI) | 0.75 [0.62, 0.91] |
| 3.3 mixed incontinence | 0 | 0 | Risk Ratio (M‐H, Fixed, 95% CI) | 0.0 [0.0, 0.0] |
| 4 Number not improved (worse or unchanged) after first year (women's observations) | 0 | 0 | Risk Ratio (M‐H, Fixed, 95% CI) | 0.0 [0.0, 0.0] |
| 4.1 urodynamic stress incontinence (only) | 0 | 0 | Risk Ratio (M‐H, Fixed, 95% CI) | 0.0 [0.0, 0.0] |
| 4.2 stress urinary incontinence (symptoms only) | 0 | 0 | Risk Ratio (M‐H, Fixed, 95% CI) | 0.0 [0.0, 0.0] |
| 4.3 mixed incontinence | 0 | 0 | Risk Ratio (M‐H, Fixed, 95% CI) | 0.0 [0.0, 0.0] |
| 5 Pad changes over 24 hours | 0 | 0 | Mean Difference (IV, Fixed, 95% CI) | 0.0 [0.0, 0.0] |
| 5.1 urodynamic stress incontinence (only) | 0 | 0 | Mean Difference (IV, Fixed, 95% CI) | 0.0 [0.0, 0.0] |
| 5.2 stress urinary incontinence (symptoms only) | 0 | 0 | Mean Difference (IV, Fixed, 95% CI) | 0.0 [0.0, 0.0] |
| 5.3 mixed incontinence | 0 | 0 | Mean Difference (IV, Fixed, 95% CI) | 0.0 [0.0, 0.0] |
| 6 Incontinent episodes over 24 hours | 0 | 0 | Mean Difference (IV, Fixed, 95% CI) | 0.0 [0.0, 0.0] |
| 6.1 urodynamic stress incontinence (only) | 0 | 0 | Mean Difference (IV, Fixed, 95% CI) | 0.0 [0.0, 0.0] |
| 6.2 stress urinary incontinence (symptoms only) | 0 | 0 | Mean Difference (IV, Fixed, 95% CI) | 0.0 [0.0, 0.0] |
| 6.3 mixed incontinence | 0 | 0 | Mean Difference (IV, Fixed, 95% CI) | 0.0 [0.0, 0.0] |
| 7 Pad test weights | 0 | 0 | Mean Difference (IV, Fixed, 95% CI) | 0.0 [0.0, 0.0] |
| 7.1 urodynamic stress incontinence (only) | 0 | 0 | Mean Difference (IV, Fixed, 95% CI) | 0.0 [0.0, 0.0] |
| 7.2 stress urinary incontinence (symptoms only) | 0 | 0 | Mean Difference (IV, Fixed, 95% CI) | 0.0 [0.0, 0.0] |
| 7.3 mixed incontinence | 0 | 0 | Mean Difference (IV, Fixed, 95% CI) | 0.0 [0.0, 0.0] |
| 8 Number with incontinence (clinician's observations) within the first year | 0 | 0 | Risk Ratio (M‐H, Fixed, 95% CI) | 0.0 [0.0, 0.0] |
| 8.1 urodynamic stress incontinence (only) | 0 | 0 | Risk Ratio (M‐H, Fixed, 95% CI) | 0.0 [0.0, 0.0] |
| 8.2 stress urinary incontinence (symptoms only) | 0 | 0 | Risk Ratio (M‐H, Fixed, 95% CI) | 0.0 [0.0, 0.0] |
| 8.3 mixed incontinence | 0 | 0 | Risk Ratio (M‐H, Fixed, 95% CI) | 0.0 [0.0, 0.0] |
| 9 Number with incontinence (clinician's observations) after first year Show forest plot | 3 | 620 | Risk Ratio (M‐H, Fixed, 95% CI) | 0.95 [0.64, 1.41] |
| 9.1 urodynamic stress incontinence (only) | 1 | 28 | Risk Ratio (M‐H, Fixed, 95% CI) | 0.23 [0.01, 4.37] |
| 9.2 stress urinary incontinence (symptoms only) | 2 | 592 | Risk Ratio (M‐H, Fixed, 95% CI) | 0.99 [0.66, 1.47] |
| 9.3 mixed incontinence | 0 | 0 | Risk Ratio (M‐H, Fixed, 95% CI) | 0.0 [0.0, 0.0] |
| 10 Operative time (minutes) Show forest plot | 1 | Mean Difference (IV, Fixed, 95% CI) | Totals not selected | |
| 10.1 urodynamic stress incontinence (only) | 1 | Mean Difference (IV, Fixed, 95% CI) | 0.0 [0.0, 0.0] | |
| 10.2 stress urinary incontinence (symptoms only) | 0 | Mean Difference (IV, Fixed, 95% CI) | 0.0 [0.0, 0.0] | |
| 10.3 mixed incontinence | 0 | Mean Difference (IV, Fixed, 95% CI) | 0.0 [0.0, 0.0] | |
| 11 Time to catheter removal (days) Show forest plot | 2 | 108 | Mean Difference (IV, Fixed, 95% CI) | 8.01 [6.84, 9.18] |
| 11.1 urodynamic stress incontinence (only) | 1 | 36 | Mean Difference (IV, Fixed, 95% CI) | 9.5 [‐4.27, 23.27] |
| 11.2 stress urinary incontinence (symptoms only) | 1 | 72 | Mean Difference (IV, Fixed, 95% CI) | 8.0 [6.82, 9.18] |
| 11.3 mixed incontinence | 0 | 0 | Mean Difference (IV, Fixed, 95% CI) | 0.0 [0.0, 0.0] |
| 12 Length of inpatient stay (days) Show forest plot | 3 | 137 | Mean Difference (IV, Fixed, 95% CI) | 2.03 [1.47, 2.59] |
| 12.1 urodynamic stress incontinence (only) | 3 | 137 | Mean Difference (IV, Fixed, 95% CI) | 2.03 [1.47, 2.59] |
| 12.2 stress urinary incontinence (symptoms only) | 0 | 0 | Mean Difference (IV, Fixed, 95% CI) | 0.0 [0.0, 0.0] |
| 12.3 mixed incontinence | 0 | 0 | Mean Difference (IV, Fixed, 95% CI) | 0.0 [0.0, 0.0] |
| 13 Time to return to normal activity level | 0 | 0 | Mean Difference (IV, Fixed, 95% CI) | 0.0 [0.0, 0.0] |
| 13.1 urodynamic stress incontinence (only) | 0 | 0 | Mean Difference (IV, Fixed, 95% CI) | 0.0 [0.0, 0.0] |
| 13.2 stress urinary incontinence (symptoms only) | 0 | 0 | Mean Difference (IV, Fixed, 95% CI) | 0.0 [0.0, 0.0] |
| 13.3 mixed incontinence | 0 | 0 | Mean Difference (IV, Fixed, 95% CI) | 0.0 [0.0, 0.0] |
| 14 Peri‐operative surgical complications Show forest plot | 4 | 792 | Risk Ratio (M‐H, Fixed, 95% CI) | 1.31 [1.14, 1.51] |
| 14.1 urodynamic stress incontinence (only) | 3 | 137 | Risk Ratio (M‐H, Fixed, 95% CI) | 0.85 [0.28, 2.52] |
| 14.2 stress urinary incontinence (symptoms only) | 1 | 655 | Risk Ratio (M‐H, Fixed, 95% CI) | 1.33 [1.16, 1.53] |
| 14.3 mixed incontinence | 0 | 0 | Risk Ratio (M‐H, Fixed, 95% CI) | 0.0 [0.0, 0.0] |
| 15 Bladder perforation Show forest plot | 1 | Risk Ratio (M‐H, Fixed, 95% CI) | Totals not selected | |
| 15.1 urodynamic stress incontinence (only) | 0 | Risk Ratio (M‐H, Fixed, 95% CI) | 0.0 [0.0, 0.0] | |
| 15.2 stress urinary incontinence (symptoms only) | 1 | Risk Ratio (M‐H, Fixed, 95% CI) | 0.0 [0.0, 0.0] | |
| 15.3 mixed incontinence | 0 | Risk Ratio (M‐H, Fixed, 95% CI) | 0.0 [0.0, 0.0] | |
| 16 Urinary tract infection Show forest plot | 1 | Risk Ratio (M‐H, Fixed, 95% CI) | Totals not selected | |
| 16.1 urodynamic stress incontinence (only) | 0 | Risk Ratio (M‐H, Fixed, 95% CI) | 0.0 [0.0, 0.0] | |
| 16.2 stress urinary incontinence (symptoms only) | 1 | Risk Ratio (M‐H, Fixed, 95% CI) | 0.0 [0.0, 0.0] | |
| 16.3 mixed incontinence | 0 | Risk Ratio (M‐H, Fixed, 95% CI) | 0.0 [0.0, 0.0] | |
| 17 Urge symptoms or urge incontinence Show forest plot | 1 | Risk Ratio (M‐H, Fixed, 95% CI) | Totals not selected | |
| 17.1 urodynamic stress incontinence (only) | 1 | Risk Ratio (M‐H, Fixed, 95% CI) | 0.0 [0.0, 0.0] | |
| 17.2 stress urinary incontinence (symptoms only) | 0 | Risk Ratio (M‐H, Fixed, 95% CI) | 0.0 [0.0, 0.0] | |
| 17.3 mixed incontinence | 0 | Risk Ratio (M‐H, Fixed, 95% CI) | 0.0 [0.0, 0.0] | |
| 18 Detrusor overactivity (urodynamic diagnosis) Show forest plot | 4 | 203 | Risk Ratio (M‐H, Fixed, 95% CI) | 1.42 [0.52, 3.87] |
| 18.1 urodynamic stress incontinence (only) | 4 | 203 | Risk Ratio (M‐H, Fixed, 95% CI) | 1.42 [0.52, 3.87] |
| 18.2 stress urinary incontinence (symptoms only) | 0 | 0 | Risk Ratio (M‐H, Fixed, 95% CI) | 0.0 [0.0, 0.0] |
| 18.3 mixed incontinence | 0 | 0 | Risk Ratio (M‐H, Fixed, 95% CI) | 0.0 [0.0, 0.0] |
| 19 Voiding dysfunction after three months Show forest plot | 5 | 853 | Risk Ratio (M‐H, Fixed, 95% CI) | 6.08 [3.10, 11.95] |
| 19.1 urodynamic stress incontinence (only) | 4 | 198 | Risk Ratio (M‐H, Fixed, 95% CI) | 4.48 [1.16, 17.36] |
| 19.2 stress urinary incontinence (symptoms only) | 1 | 655 | Risk Ratio (M‐H, Fixed, 95% CI) | 6.63 [3.04, 14.47] |
| 19.3 mixed incontinence | 0 | 0 | Risk Ratio (M‐H, Fixed, 95% CI) | 0.0 [0.0, 0.0] |
| 20 Prolapse Show forest plot | 2 | 106 | Risk Ratio (M‐H, Fixed, 95% CI) | 0.2 [0.04, 1.11] |
| 20.1 urodynamic stress incontinence (only) | 2 | 106 | Risk Ratio (M‐H, Fixed, 95% CI) | 0.2 [0.04, 1.11] |
| 20.2 stress urinary incontinence (symptoms only) | 0 | 0 | Risk Ratio (M‐H, Fixed, 95% CI) | 0.0 [0.0, 0.0] |
| 20.3 mixed incontinence | 0 | 0 | Risk Ratio (M‐H, Fixed, 95% CI) | 0.0 [0.0, 0.0] |
| 21 Repeat incontinence surgery | 0 | 0 | Risk Ratio (M‐H, Fixed, 95% CI) | 0.0 [0.0, 0.0] |
| 21.1 urodynamic stress incontinence (only) | 0 | 0 | Risk Ratio (M‐H, Fixed, 95% CI) | 0.0 [0.0, 0.0] |
| 21.2 stress urinary incontinence (symptoms only) | 0 | 0 | Risk Ratio (M‐H, Fixed, 95% CI) | 0.0 [0.0, 0.0] |
| 21.3 mixed incontinence | 0 | 0 | Risk Ratio (M‐H, Fixed, 95% CI) | 0.0 [0.0, 0.0] |
| 22 Health status measures | 0 | 0 | Mean Difference (IV, Fixed, 95% CI) | 0.0 [0.0, 0.0] |
| 22.1 urodynamic stress incontinence (only) | 0 | 0 | Mean Difference (IV, Fixed, 95% CI) | 0.0 [0.0, 0.0] |
| 22.2 stress urinary incontinence (symptoms only) | 0 | 0 | Mean Difference (IV, Fixed, 95% CI) | 0.0 [0.0, 0.0] |
| 22.3 mixed incontinence | 0 | 0 | Mean Difference (IV, Fixed, 95% CI) | 0.0 [0.0, 0.0] |
| Outcome or subgroup title | No. of studies | No. of participants | Statistical method | Effect size |
| 1 Number with incontinence (worse, unchanged or improved) within the first year (women's observations) Show forest plot | 1 | Risk Ratio (M‐H, Fixed, 95% CI) | Totals not selected | |
| 1.1 urodynamic stress incontinence (only) | 1 | Risk Ratio (M‐H, Fixed, 95% CI) | 0.0 [0.0, 0.0] | |
| 1.2 stress urinary incontinence (symptoms only) | 0 | Risk Ratio (M‐H, Fixed, 95% CI) | 0.0 [0.0, 0.0] | |
| 1.3 mixed incontinence | 0 | Risk Ratio (M‐H, Fixed, 95% CI) | 0.0 [0.0, 0.0] | |
| 2 Number with incontinence (worse, unchanged or improved) after the first year (women's observations) Show forest plot | 1 | Risk Ratio (M‐H, Fixed, 95% CI) | Totals not selected | |
| 2.1 urodynamic stress incontinence (only) | 1 | Risk Ratio (M‐H, Fixed, 95% CI) | 0.0 [0.0, 0.0] | |
| 2.2 stress urinary incontinence (symptoms only) | 0 | Risk Ratio (M‐H, Fixed, 95% CI) | 0.0 [0.0, 0.0] | |
| 2.3 mixed incontinence | 0 | Risk Ratio (M‐H, Fixed, 95% CI) | 0.0 [0.0, 0.0] | |
| 3 Length of inpatient stay Show forest plot | 1 | Mean Difference (IV, Fixed, 95% CI) | Totals not selected | |
| 3.1 urodynamic stress incontinence (only) | 1 | Mean Difference (IV, Fixed, 95% CI) | 0.0 [0.0, 0.0] | |
| 3.2 stress urinary incontinence (symptoms only) | 0 | Mean Difference (IV, Fixed, 95% CI) | 0.0 [0.0, 0.0] | |
| 3.3 mixed incontinence | 0 | Mean Difference (IV, Fixed, 95% CI) | 0.0 [0.0, 0.0] | |
| 4 Peri‐operative surgical complications Show forest plot | 1 | Risk Ratio (M‐H, Fixed, 95% CI) | Totals not selected | |
| 4.1 urodynamic stress incontinence (only) | 1 | Risk Ratio (M‐H, Fixed, 95% CI) | 0.0 [0.0, 0.0] | |
| 4.2 stress urinary incontinence (symptoms only) | 0 | Risk Ratio (M‐H, Fixed, 95% CI) | 0.0 [0.0, 0.0] | |
| 4.3 mixed incontinence | 0 | Risk Ratio (M‐H, Fixed, 95% CI) | 0.0 [0.0, 0.0] | |
| 5 Urge symptoms or urge incontinence Show forest plot | 1 | Risk Ratio (M‐H, Fixed, 95% CI) | Totals not selected | |
| 5.1 urodynamic stress incontinence (only) | 1 | Risk Ratio (M‐H, Fixed, 95% CI) | 0.0 [0.0, 0.0] | |
| 5.2 stress urinary incontinence (symptoms only) | 0 | Risk Ratio (M‐H, Fixed, 95% CI) | 0.0 [0.0, 0.0] | |
| 5.3 mixed incontinence | 0 | Risk Ratio (M‐H, Fixed, 95% CI) | 0.0 [0.0, 0.0] | |
| 6 Voiding dysfunction after three months Show forest plot | 1 | Risk Ratio (M‐H, Fixed, 95% CI) | Totals not selected | |
| 6.1 urodynamic stress incontinence (only) | 1 | Risk Ratio (M‐H, Fixed, 95% CI) | 0.0 [0.0, 0.0] | |
| 6.2 stress urinary incontinence (symptoms only) | 0 | Risk Ratio (M‐H, Fixed, 95% CI) | 0.0 [0.0, 0.0] | |
| 6.3 mixed incontinence | 0 | Risk Ratio (M‐H, Fixed, 95% CI) | 0.0 [0.0, 0.0] | |
| 7 Detrusor overactivity (urodynamic diagnosis) Show forest plot | 1 | Risk Ratio (M‐H, Fixed, 95% CI) | Totals not selected | |
| 7.1 urodynamic stress incontinence (only) | 1 | Risk Ratio (M‐H, Fixed, 95% CI) | 0.0 [0.0, 0.0] | |
| 7.2 stress urinary incontinence (symptoms only) | 0 | Risk Ratio (M‐H, Fixed, 95% CI) | 0.0 [0.0, 0.0] | |
| 7.3 mixed incontinence | 0 | Risk Ratio (M‐H, Fixed, 95% CI) | 0.0 [0.0, 0.0] | |
| Outcome or subgroup title | No. of studies | No. of participants | Statistical method | Effect size |
| 1 Number with incontinence (worse, unchanged or improved) within the first year (women's observations) Show forest plot | 8 | 693 | Risk Ratio (M‐H, Fixed, 95% CI) | 0.97 [0.78, 1.20] |
| 1.1 urodynamic stress incontinence (only) | 5 | 434 | Risk Ratio (M‐H, Fixed, 95% CI) | 1.01 [0.76, 1.34] |
| 1.2 stress urinary incontinence (symptoms only) | 0 | 0 | Risk Ratio (M‐H, Fixed, 95% CI) | 0.0 [0.0, 0.0] |
| 1.3 mixed urinary incontinence | 3 | 259 | Risk Ratio (M‐H, Fixed, 95% CI) | 0.91 [0.66, 1.27] |
| 2 Number not improved (worse or unchanged) within the first year (women's observations) Show forest plot | 3 | 432 | Risk Ratio (M‐H, Fixed, 95% CI) | 0.78 [0.48, 1.27] |
| 2.1 urodynamic stress incontinence (only) | 2 | 293 | Risk Ratio (M‐H, Fixed, 95% CI) | 0.92 [0.39, 2.13] |
| 2.2 stress urinary incontinence (symptoms only) | 0 | 0 | Risk Ratio (M‐H, Fixed, 95% CI) | 0.0 [0.0, 0.0] |
| 2.3 mixed urinary incontinence | 1 | 139 | Risk Ratio (M‐H, Fixed, 95% CI) | 0.72 [0.40, 1.29] |
| 3 Number with incontinence (worse, unchanged or improved) after first year (women's observations) Show forest plot | 4 | 382 | Risk Ratio (M‐H, Fixed, 95% CI) | 1.23 [0.91, 1.66] |
| 3.1 urodynamic stress incontinence (only) | 3 | 338 | Risk Ratio (M‐H, Fixed, 95% CI) | 1.17 [0.86, 1.60] |
| 3.2 stress urinary incontinence (symptoms only) | 0 | 0 | Risk Ratio (M‐H, Fixed, 95% CI) | 0.0 [0.0, 0.0] |
| 3.3 mixed urinary incontinence | 1 | 44 | Risk Ratio (M‐H, Fixed, 95% CI) | 1.92 [0.65, 5.63] |
| 4 Number not improved (worse or unchanged) after the first year (women's observations) Show forest plot | 2 | 279 | Risk Ratio (M‐H, Fixed, 95% CI) | 1.30 [0.57, 2.94] |
| 4.1 urodynamic stress incontinence (only) | 2 | 279 | Risk Ratio (M‐H, Fixed, 95% CI) | 1.30 [0.57, 2.94] |
| 4.2 stress urinary incontinence (symptoms only) | 0 | 0 | Risk Ratio (M‐H, Fixed, 95% CI) | 0.0 [0.0, 0.0] |
| 4.3 mixed urinary incontinence | 0 | 0 | Risk Ratio (M‐H, Fixed, 95% CI) | 0.0 [0.0, 0.0] |
| 5 Pad test: mean weight of urine Show forest plot | 1 | 20 | Mean Difference (IV, Fixed, 95% CI) | ‐29.00 [‐57.53, ‐4.47] |
| 5.1 urodynamic stress incontinence (only) | 1 | 20 | Mean Difference (IV, Fixed, 95% CI) | ‐29.00 [‐57.53, ‐4.47] |
| 5.2 stress urinary incontinence (symptoms only) | 0 | 0 | Mean Difference (IV, Fixed, 95% CI) | 0.0 [0.0, 0.0] |
| 5.3 mixed urinary incontinence | 0 | 0 | Mean Difference (IV, Fixed, 95% CI) | 0.0 [0.0, 0.0] |
| 6 Number with incontinence (clinician's observations) within first year Show forest plot | 2 | 105 | Risk Ratio (M‐H, Fixed, 95% CI) | 1.29 [0.45, 3.71] |
| 6.1 urodynamic stress incontinence (only) | 0 | 0 | Risk Ratio (M‐H, Fixed, 95% CI) | 0.0 [0.0, 0.0] |
| 6.2 stress urinary incontinence (symptoms only) | 0 | 0 | Risk Ratio (M‐H, Fixed, 95% CI) | 0.0 [0.0, 0.0] |
| 6.3 mixed urinary incontinence | 2 | 105 | Risk Ratio (M‐H, Fixed, 95% CI) | 1.29 [0.45, 3.71] |
| 7 Number with incontinence (clinician's observations) after first year Show forest plot | 1 | 44 | Risk Ratio (M‐H, Fixed, 95% CI) | 1.72 [0.82, 3.61] |
| 7.1 urodynamic stress incontinence (only) | 0 | 0 | Risk Ratio (M‐H, Fixed, 95% CI) | 0.0 [0.0, 0.0] |
| 7.2 stress urinary incontinence (symptoms only) | 0 | 0 | Risk Ratio (M‐H, Fixed, 95% CI) | 0.0 [0.0, 0.0] |
| 7.3 mixed urinary incontinence | 1 | 44 | Risk Ratio (M‐H, Fixed, 95% CI) | 1.72 [0.82, 3.61] |
| 8 Operative time (mins) Show forest plot | 5 | 225 | Mean Difference (IV, Fixed, 95% CI) | 59.90 [56.62, 63.18] |
| 8.1 urodynamic stress incontinence (only) | 2 | 61 | Mean Difference (IV, Fixed, 95% CI) | 46.91 [42.31, 51.52] |
| 8.2 stress urinary incontinence (symptoms only) | 0 | 0 | Mean Difference (IV, Fixed, 95% CI) | 0.0 [0.0, 0.0] |
| 8.3 mixed urinary incontinence | 3 | 164 | Mean Difference (IV, Fixed, 95% CI) | 73.26 [68.59, 77.94] |
| 9 Length of hospital stay (days) Show forest plot | 2 | 64 | Mean Difference (IV, Fixed, 95% CI) | 0.49 [0.26, 0.72] |
| 9.1 urodynamic stress incontinence (only) | 1 | 20 | Mean Difference (IV, Fixed, 95% CI) | 0.65 [0.39, 0.91] |
| 9.2 stress urinary incontinence (symptoms only) | 0 | 0 | Mean Difference (IV, Fixed, 95% CI) | 0.0 [0.0, 0.0] |
| 9.3 mixed urinary incontinence | 1 | 44 | Mean Difference (IV, Fixed, 95% CI) | 0.0 [‐0.46, 0.46] |
| 10 Time to catheter removal (days) Show forest plot | 2 | 113 | Mean Difference (IV, Fixed, 95% CI) | 0.11 [‐0.07, 0.30] |
| 10.1 urodynamic stress incontinence (only) | 0 | 0 | Mean Difference (IV, Fixed, 95% CI) | 0.0 [0.0, 0.0] |
| 10.2 stress urinary incontinence (symptoms only) | 0 | 0 | Mean Difference (IV, Fixed, 95% CI) | 0.0 [0.0, 0.0] |
| 10.3 mixed urinary incontinence | 2 | 113 | Mean Difference (IV, Fixed, 95% CI) | 0.11 [‐0.07, 0.30] |
| 11 Peri operative surgical complications Show forest plot | 3 | 243 | Risk Ratio (M‐H, Fixed, 95% CI) | 1.59 [1.03, 2.44] |
| 11.1 urodynamic stress incontinence (only) | 2 | 183 | Risk Ratio (M‐H, Fixed, 95% CI) | 1.73 [1.01, 2.96] |
| 11.2 stress urinary incontinence (symptoms only) | 0 | 0 | Risk Ratio (M‐H, Fixed, 95% CI) | 0.0 [0.0, 0.0] |
| 11.3 mixed urinary incontinence | 1 | 60 | Risk Ratio (M‐H, Fixed, 95% CI) | 1.31 [0.64, 2.69] |
| 12 Bladder perforations Show forest plot | 7 | 563 | Risk Ratio (M‐H, Fixed, 95% CI) | 0.62 [0.34, 1.11] |
| 12.1 urodynamic stress incontinence (only) | 2 | 183 | Risk Ratio (M‐H, Fixed, 95% CI) | 3.14 [0.14, 72.92] |
| 12.2 stress urinary incontinence (symptoms only) | 0 | 0 | Risk Ratio (M‐H, Fixed, 95% CI) | 0.0 [0.0, 0.0] |
| 12.3 mixed urinary incontinence | 5 | 380 | Risk Ratio (M‐H, Fixed, 95% CI) | 0.57 [0.31, 1.04] |
| 13 Urethral injury Show forest plot | 1 | Risk Ratio (M‐H, Fixed, 95% CI) | Totals not selected | |
| 13.1 urodynamic stress incontinence (only) | 0 | Risk Ratio (M‐H, Fixed, 95% CI) | 0.0 [0.0, 0.0] | |
| 13.2 stress urinary incontinence (symptoms only) | 0 | Risk Ratio (M‐H, Fixed, 95% CI) | 0.0 [0.0, 0.0] | |
| 13.3 mixed urinary incontinence | 1 | Risk Ratio (M‐H, Fixed, 95% CI) | 0.0 [0.0, 0.0] | |
| 14 De novo detrusor urgency or urge symptoms Show forest plot | 3 | 174 | Risk Ratio (M‐H, Fixed, 95% CI) | 3.13 [0.96, 10.24] |
| 14.1 urodynamic stress incontinence (only) | 0 | 0 | Risk Ratio (M‐H, Fixed, 95% CI) | 0.0 [0.0, 0.0] |
| 14.2 stress urinary incontinence (symptoms only) | 0 | 0 | Risk Ratio (M‐H, Fixed, 95% CI) | 0.0 [0.0, 0.0] |
| 14.3 mixed urinary incontinence | 3 | 174 | Risk Ratio (M‐H, Fixed, 95% CI) | 3.13 [0.96, 10.24] |
| 15 De novo detrusor overactivity (urodynamic diagnosis) Show forest plot | 3 | 245 | Risk Ratio (M‐H, Fixed, 95% CI) | 3.21 [1.29, 8.03] |
| 15.1 urodynamic stress incontinence (only) | 1 | 59 | Risk Ratio (M‐H, Fixed, 95% CI) | 0.0 [0.0, 0.0] |
| 15.2 stress urinary incontinence (symptoms only) | 0 | 0 | Risk Ratio (M‐H, Fixed, 95% CI) | 0.0 [0.0, 0.0] |
| 15.3 mixed urinary incontinence | 2 | 186 | Risk Ratio (M‐H, Fixed, 95% CI) | 3.21 [1.29, 8.03] |
| 16 Voiding dysfunction Show forest plot | 5 | 375 | Risk Ratio (M‐H, Fixed, 95% CI) | 1.60 [0.94, 2.71] |
| 16.1 urodynamic stress incontinence (only) | 2 | 201 | Risk Ratio (M‐H, Fixed, 95% CI) | 0.97 [0.42, 2.25] |
| 16.2 stress urinary incontinence (symptoms only) | 0 | 0 | Risk Ratio (M‐H, Fixed, 95% CI) | 0.0 [0.0, 0.0] |
| 16.3 mixed urinary incontinence | 3 | 174 | Risk Ratio (M‐H, Fixed, 95% CI) | 2.28 [1.13, 4.62] |
| 17 Release of sling required Show forest plot | 2 | 202 | Risk Ratio (M‐H, Fixed, 95% CI) | 3.67 [0.95, 14.22] |
| 17.1 urodynamic stress incontinence (only) | 1 | 142 | Risk Ratio (M‐H, Fixed, 95% CI) | 2.30 [0.46, 11.45] |
| 17.2 stress urinary incontinence (symptoms only) | 0 | 0 | Risk Ratio (M‐H, Fixed, 95% CI) | 0.0 [0.0, 0.0] |
| 17.3 mixed urinary incontinence | 1 | 60 | Risk Ratio (M‐H, Fixed, 95% CI) | 9.6 [0.54, 170.84] |
| 18 Retention up to 6 weeks Show forest plot | 1 | Risk Ratio (M‐H, Fixed, 95% CI) | Totals not selected | |
| 18.1 urodynamic stress incontinence (only) | 1 | Risk Ratio (M‐H, Fixed, 95% CI) | 0.0 [0.0, 0.0] | |
| 18.2 stress urinary incontinence (symptoms only) | 0 | Risk Ratio (M‐H, Fixed, 95% CI) | 0.0 [0.0, 0.0] | |
| 18.3 mixed urinary incontinence | 0 | Risk Ratio (M‐H, Fixed, 95% CI) | 0.0 [0.0, 0.0] | |
| 19 Vaginal erosion Show forest plot | 2 | Risk Ratio (M‐H, Fixed, 95% CI) | Totals not selected | |
| 19.1 urodynamic stress incontinence (only) | 1 | Risk Ratio (M‐H, Fixed, 95% CI) | 0.0 [0.0, 0.0] | |
| 19.2 stress urinary incontinence (symptoms only) | 0 | Risk Ratio (M‐H, Fixed, 95% CI) | 0.0 [0.0, 0.0] | |
| 19.3 mixed urinary incontinence | 1 | Risk Ratio (M‐H, Fixed, 95% CI) | 0.0 [0.0, 0.0] | |
| 20 Wound pain (6 months) Show forest plot | 1 | Risk Ratio (M‐H, Fixed, 95% CI) | Totals not selected | |
| 20.1 urodynamic stress incontinence (only) | 0 | Risk Ratio (M‐H, Fixed, 95% CI) | 0.0 [0.0, 0.0] | |
| 20.2 stress urinary incontinence (symptoms only) | 0 | Risk Ratio (M‐H, Fixed, 95% CI) | 0.0 [0.0, 0.0] | |
| 20.3 mixed urinary incontinence | 1 | Risk Ratio (M‐H, Fixed, 95% CI) | 0.0 [0.0, 0.0] | |
| Outcome or subgroup title | No. of studies | No. of participants | Statistical method | Effect size |
| 1 Number with incontinence (worse, unchanged or improved) within the first year (women's observations) Show forest plot | 3 | 307 | Risk Ratio (M‐H, Fixed, 95% CI) | 0.89 [0.66, 1.19] |
| 1.1 urodynamic stress incontinence (only) | 3 | 307 | Risk Ratio (M‐H, Fixed, 95% CI) | 0.89 [0.66, 1.19] |
| 1.2 stress urinary incontinence (symptoms only) | 0 | 0 | Risk Ratio (M‐H, Fixed, 95% CI) | 0.0 [0.0, 0.0] |
| 1.3 mixed urinary incontinence | 0 | 0 | Risk Ratio (M‐H, Fixed, 95% CI) | 0.0 [0.0, 0.0] |
| 2 Number not improved (worse or unchanged) within the first year (women's observations) Show forest plot | 3 | Risk Ratio (M‐H, Fixed, 95% CI) | Subtotals only | |
| 2.1 urodynamic stress incontinence (only) | 2 | 163 | Risk Ratio (M‐H, Fixed, 95% CI) | 0.22 [0.08, 0.59] |
| 2.2 stress urinary incontinence (symptoms only) | 0 | 0 | Risk Ratio (M‐H, Fixed, 95% CI) | 0.0 [0.0, 0.0] |
| 2.3 mixed urinary incontinence | 1 | 48 | Risk Ratio (M‐H, Fixed, 95% CI) | 6.70 [0.40, 111.94] |
| 3 Number with incontinence (worse, unchanged or improved) after first year (women's observations) Show forest plot | 4 | 379 | Risk Ratio (M‐H, Fixed, 95% CI) | 0.89 [0.72, 1.10] |
| 3.1 urodynamic stress incontinence (only) | 3 | 331 | Risk Ratio (M‐H, Fixed, 95% CI) | 0.83 [0.67, 1.03] |
| 3.2 stress urinary incontinence (symptoms only) | 0 | 0 | Risk Ratio (M‐H, Fixed, 95% CI) | 0.0 [0.0, 0.0] |
| 3.3 mixed urinary incontinence | 1 | 48 | Risk Ratio (M‐H, Fixed, 95% CI) | 2.75 [0.69, 10.95] |
| 4 Number not improved (worse or unchanged) after the first year (women's observations) Show forest plot | 3 | Risk Ratio (M‐H, Fixed, 95% CI) | Subtotals only | |
| 4.1 urodynamic stress incontinence (only) | 2 | 186 | Risk Ratio (M‐H, Fixed, 95% CI) | 0.33 [0.17, 0.64] |
| 4.2 stress urinary incontinence (symptoms only) | 0 | 0 | Risk Ratio (M‐H, Fixed, 95% CI) | 0.0 [0.0, 0.0] |
| 4.3 mixed urinary incontinence | 1 | 48 | Risk Ratio (M‐H, Fixed, 95% CI) | 0.0 [0.0, 0.0] |
| 5 Number with incontinence (worse, unchanged or improved) after five years (women's observations) Show forest plot | 1 | Risk Ratio (M‐H, Fixed, 95% CI) | Totals not selected | |
| 5.1 urodynamic stress incontinence (only) | 1 | Risk Ratio (M‐H, Fixed, 95% CI) | 0.0 [0.0, 0.0] | |
| 5.2 stress urinary incontinence (symptoms only) | 0 | Risk Ratio (M‐H, Fixed, 95% CI) | 0.0 [0.0, 0.0] | |
| 5.3 mixed urinary incontinence | 0 | Risk Ratio (M‐H, Fixed, 95% CI) | 0.0 [0.0, 0.0] | |
| 6 Pad test: mean weight of urine Show forest plot | 1 | Mean Difference (IV, Fixed, 95% CI) | Totals not selected | |
| 6.1 urodynamic stress incontinence (only) | 1 | Mean Difference (IV, Fixed, 95% CI) | 0.0 [0.0, 0.0] | |
| 6.2 stress urinary incontinence (symptoms only) | 0 | Mean Difference (IV, Fixed, 95% CI) | 0.0 [0.0, 0.0] | |
| 6.3 mixed urinary incontinence | 0 | Mean Difference (IV, Fixed, 95% CI) | 0.0 [0.0, 0.0] | |
| 7 Operative time (mins) Show forest plot | 1 | Mean Difference (IV, Fixed, 95% CI) | Totals not selected | |
| 7.1 urodynamic stress incontinence (only) | 1 | Mean Difference (IV, Fixed, 95% CI) | 0.0 [0.0, 0.0] | |
| 7.2 stress urinary incontinence (symptoms only) | 0 | Mean Difference (IV, Fixed, 95% CI) | 0.0 [0.0, 0.0] | |
| 7.3 mixed urinary incontinence | 0 | Mean Difference (IV, Fixed, 95% CI) | 0.0 [0.0, 0.0] | |
| 8 Peri operative surgical complications Show forest plot | 2 | Risk Ratio (M‐H, Fixed, 95% CI) | Totals not selected | |
| 8.1 urodynamic stress incontinence (only) | 1 | Risk Ratio (M‐H, Fixed, 95% CI) | 0.0 [0.0, 0.0] | |
| 8.2 stress urinary incontinence (symptoms only) | 0 | Risk Ratio (M‐H, Fixed, 95% CI) | 0.0 [0.0, 0.0] | |
| 8.3 mixed urinary incontinence | 1 | Risk Ratio (M‐H, Fixed, 95% CI) | 0.0 [0.0, 0.0] | |
| 9 Bladder perforation Show forest plot | 1 | Risk Ratio (M‐H, Fixed, 95% CI) | Totals not selected | |
| 9.1 urodynamic stress incontinence (only) | 1 | Risk Ratio (M‐H, Fixed, 95% CI) | 0.0 [0.0, 0.0] | |
| 9.2 stress urinary incontinence (symptoms only) | 0 | Risk Ratio (M‐H, Fixed, 95% CI) | 0.0 [0.0, 0.0] | |
| 9.3 mixed urinary incontinence | 0 | Risk Ratio (M‐H, Fixed, 95% CI) | 0.0 [0.0, 0.0] | |
| 10 Urinary tract infection Show forest plot | 1 | Risk Ratio (M‐H, Fixed, 95% CI) | Totals not selected | |
| 10.1 urodynamic stress incontinence (only) | 1 | Risk Ratio (M‐H, Fixed, 95% CI) | 0.0 [0.0, 0.0] | |
| 10.2 stress urinary incontinence (symptoms only) | 0 | Risk Ratio (M‐H, Fixed, 95% CI) | 0.0 [0.0, 0.0] | |
| 10.3 mixed urinary incontinence | 0 | Risk Ratio (M‐H, Fixed, 95% CI) | 0.0 [0.0, 0.0] | |
| 11 De novo detrusor urgency or urge symptoms or detrusor overactivity Show forest plot | 1 | Risk Ratio (M‐H, Fixed, 95% CI) | Totals not selected | |
| 11.1 urodynamic stress incontinence (only) | 1 | Risk Ratio (M‐H, Fixed, 95% CI) | 0.0 [0.0, 0.0] | |
| 11.2 stress urinary incontinence (symptoms only) | 0 | Risk Ratio (M‐H, Fixed, 95% CI) | 0.0 [0.0, 0.0] | |
| 11.3 mixed urinary incontinence | 0 | Risk Ratio (M‐H, Fixed, 95% CI) | 0.0 [0.0, 0.0] | |
| 12 Voiding dysfunction Show forest plot | 1 | Risk Ratio (M‐H, Fixed, 95% CI) | Totals not selected | |
| 12.1 urodynamic stress incontinence (only) | 1 | Risk Ratio (M‐H, Fixed, 95% CI) | 0.0 [0.0, 0.0] | |
| 12.2 stress urinary incontinence (symptoms only) | 0 | Risk Ratio (M‐H, Fixed, 95% CI) | 0.0 [0.0, 0.0] | |
| 12.3 mixed urinary incontinence | 0 | Risk Ratio (M‐H, Fixed, 95% CI) | 0.0 [0.0, 0.0] | |
| 13 De novo detrusor overactivity (urodynamic diagnosis) Show forest plot | 2 | Risk Ratio (M‐H, Fixed, 95% CI) | Subtotals only | |
| 13.1 urodynamic stress incontinence (only) | 1 | 57 | Risk Ratio (M‐H, Fixed, 95% CI) | 1.72 [0.52, 5.74] |
| 13.2 stress urinary incontinence (symptoms only) | 0 | 0 | Risk Ratio (M‐H, Fixed, 95% CI) | 0.0 [0.0, 0.0] |
| 13.3 mixed urinary incontinence | 1 | 48 | Risk Ratio (M‐H, Fixed, 95% CI) | 0.67 [0.17, 2.63] |