Traditional suburethral sling operations for urinary incontinence in women
Abstract
Background
Stress urinary incontinence constitutes a significant health and economic burden to society. Traditional suburethral slings are one of the surgical operations used to treat women with symptoms of stress urinary incontinence.
Objectives
To determine the effects of traditional suburethral slings on stress or mixed incontinence in comparison with other management options.
Search methods
We searched the Cochrane Incontinence Group Specialised Register (searched 3 June 2010) and the reference lists of relevant articles.
Selection criteria
Randomised or quasi‐randomised trials that included traditional suburethral slings for the treatment of stress or mixed urinary incontinence.
Data collection and analysis
At least three reviewers independently extracted data from included trials onto a standard form and assessed trial methodological quality. The data abstracted were relevant to predetermined outcome measures. Where appropriate, we calculated a summary statistic: a relative risk for dichotomous data and a weighted mean difference for continuous data.
Main results
We included 26 trials involving 2284 women. The quality of evidence was moderate for most trials and there was generally short follow‐up ranging from 6 to 24 months.
One medium‐sized trial compared traditional suburethral sling operations with oxybutynin in the treatment of women with mixed urinary incontinence. Surgery appeared to be more effective than drugs in treating participant‐reported incontinence (n = 75, risk ratio (RR) 0.18, 95% confidence interval (CI) 0.08 to 0.43).
One trial found that traditional slings were more effective than transurethral injectable treatment (RR for clinician‐assessed incontinence within a year 0.21, 95% CI 0.09 to 0.21)
Seven trials compared slings with open abdominal retropubic colposuspension. Participant‐reported incontinence was lower with the slings after one year (RR 0.75, 95% CI 0.62 to 0.90), but not when assessed by clinicians. Colposuspension, however, was associated with fewer peri‐operative complications, shorter duration of use of indwelling catheter and less long‐term voiding dysfunction. One study showed there was a 20% lower risk of bladder perforation with the sling procedure but a 50% increase in urinary tract infection with the sling procedure compared with colposuspension. Fewer women developed prolapse after slings (compared with after colposuspension) in two small trials but this did not reach statistical significance.
Twelve trials addressed the comparison between traditional sling operations and minimally invasive sling operations. These seemed to be equally effective in the short term (RR for incontinence within first year 0.97, 95% CI 0.78 to 1.20) but minimally invasive slings had a shorter operating time, fewer peri‐operative complications (other than bladder perforation) and some evidence of less post‐operative voiding dysfunction and detrusor symptoms.
Six trials compared one type of traditional sling with another. Materials included porcine dermis, lyophilised dura mater, fascia lata, vaginal wall, autologous dermis and rectus fascia. Participant‐reported improvement rates within the first year favoured the traditional autologous material rectus fascia over other biological materials (RR 0.45, 95% CI 0.21 to 0.98). There were more complications with the use of non‐absorbable Gore‐Tex in one trial.
Data for comparison of bladder neck needle suspension with suburethral slings were inconclusive because they came from a single trial with a small specialised population.
No trials compared traditional suburethral slings with anterior repair, laparoscopic retropubic colposuspension or artificial sphincters. Most trials did not distinguish between women having surgery for primary or recurrent incontinence when reporting participant characteristics.
For most of the comparisons, clinically important differences could not be ruled out.
Authors' conclusions
Traditional slings seem to be as effective as minimally invasive slings, but had higher rates of adverse effects. This should be interpreted with some caution however, as the quality of evidence for the studies was variable, follow‐up short and populations small, particularly for identifying complication rates. Tradional sling procedures appeared to confer a similar cure rate in comparison to open retropubic colposuspension, but the long‐term adverse event profile is still unclear. A brief economic commentary (BEC) identified two studies suggesting that traditional slings may be more cost‐effective compared with collagen injection but not cost‐effective when compared with minimally invasive sling operations. Reliable evidence to clarify whether or not traditional suburethral slings may be better or worse than other surgical or conservative management options is lacking.
PICOs
Plain language summary
Traditional sling operations for urinary incontinence in women
Traditional sling operations are used to treat women with stress urinary incontinence. This is loss of urine when coughing, laughing, sneezing or exercising due to damage to the muscles that hold up the bladder, and injuries to the nerves that may occur during childbirth. A significant amount of the woman's and her family's income can be spent on managing the symptoms. Sometimes stress incontinence occurs together with 'urge incontinence' ‐ known as 'mixed incontinence'. The sling operation aims to hold up the bladder with a strip of material which may be biological or synthetic. The results showed that there is not enough information on which to judge whether traditional sling operations are better or worse than any other treatments. Long‐term results are awaited. In terms of costs, a brief review of economic studies, which considered the overall costs and effects, suggested that traditional slings are less costly when compared with collagen injection but expensive when compared with minimally invasive slings. In this review there were few trials, of high quality, comparing slings with other forms of surgery and only one study comparing sling operations with non‐surgical treatment.
Authors' conclusions
Summary of findings
| Traditional suburethral slings compared to injectable treatment for stress urinary incontinence | ||||||
| Patient or population: women with stress urinary incontinence | ||||||
| Outcomes | Illustrative comparative risks* (95% CI) | Relative effect | No of participants | Quality of the evidence | Comments | |
| Assumed risk | Corresponding risk | |||||
| Injectable treatment | Traditional suburethral slings | |||||
| 4.1 Number with incontinence (worse, unchanged or improved) within the first year (women's observations) | 227 per 10001 | 95 per 1000 | RR 0.42 | 43 | ⊕⊝⊝⊝ | Single trial with few participants |
| 4.2 Number with incontinence (worse, unchanged or improved) after first year (women's observations) | 286 per 10001 | 34 per 1000 | RR 0.12 | 27 | ⊕⊕⊝⊝ | Single trial with few participants |
| 4.4 Voiding dysfunction | 45 per 10001 | 189 per 1000 | RR 4.19 | 43 | ⊕⊕⊝⊝ | Single trial with few participants |
| *The basis for the assumed risk (e.g. the median control group risk across studies) is provided in footnotes. The corresponding risk (and its 95% confidence interval) is based on the assumed risk in the comparison group and the relative effect of the intervention (and its 95% CI). | ||||||
| GRADE Working Group grades of evidence | ||||||
| 1Illustrative comparative risks were based upon the mean risk on control intervention in the studies included in the meta‐analysis. | ||||||
| Traditional suburethral sling operation compared to open abdominal retropubic suspension for stress urinary incontinence | ||||||
| Patient or population: women with stress urinary incontinence | ||||||
| Outcomes | Illustrative comparative risks* (95% CI) | Relative effect | No of participants | Quality of the evidence | Comments | |
| Assumed risk | Corresponding risk | |||||
| Open abdominal retropubic suspension | Traditional suburethral sling operation | |||||
| 5.1 Number with incontinence (worse, unchanged or improved) within the first year (women's observations) | 92 per 10001 | 37 per 1000 | RR 0.4 | 147 | ⊕⊕⊝⊝ | Fischer trial did not account for incomplete outcome data |
| 5.3 Number with incontinence (worse, unchanged or improved) after first year (women's observations) | 399 per 10001 | 299 per 1000 | RR 0.75 | 715 | ⊕⊕⊕⊝ | Demirci did not account for incomplete outcome data |
| 5.14 Peri‐operative surgical complications | 407 per 10001 | 533 per 1000 | RR 1.31 | 792 | ⊕⊕⊕⊝ | |
| 5.15 Bladder perforation | 30 per 10001 | 0 per 1000 | RR 0 | 655 | ⊕⊕⊕⊝ | Single study thus no pooled data available |
| 5.18 Voiding dysfunction after three months | 21 per 10001 | 128 per 1000 | RR 6.08 | 853 | ⊕⊕⊕⊝ | |
| 5.21 Repeat incontinence surgery ‐ not reported | See comment | See comment | Not estimable | ‐ | See comment | No data |
| *The basis for the assumed risk (e.g. the median control group risk across studies) is provided in footnotes. The corresponding risk (and its 95% confidence interval) is based on the assumed risk in the comparison group and the relative effect of the intervention (and its 95% CI). | ||||||
| GRADE Working Group grades of evidence | ||||||
| 1Illustrative comparative risks were based upon the mean risk on control intervention in the studies included in the meta‐analysis. | ||||||
| Traditional suburethral sling operation compared to bladder neck (needle) suspension for stress urinary incontinence | ||||||
| Patient or population: women with stress urinary incontinence | ||||||
| Outcomes | Illustrative comparative risks* (95% CI) | Relative effect | No of participants | Quality of the evidence | Comments | |
| Assumed risk | Corresponding risk | |||||
| Bladder neck (needle) suspension | Traditional suburethral sling operation | |||||
| 6.1 Number with incontinence (worse, unchanged or improved) within the first year (women's observations) | 200 per 10001 | 100 per 1000 | RR 0.5 | 20 | ⊕⊝⊝⊝ | |
| 6.2 Number with incontinence (worse, unchanged or improved) after the first year (women's observations) | 300 per 10001 | 99 per 1000 | RR 0.33 | 20 | ⊕⊝⊝⊝ | |
| 6.4 Peri‐operative surgical complications | 200 per 10001 | 900 per 1000 | RR 4.5 | 20 | ⊕⊕⊝⊝ | |
| 6.6 Voiding dysfunction after three months ‐ urodynamic stress incontinence (only) | 200 per 10001 | 400 per 1000 | RR 2 | 20 | ⊕⊝⊝⊝ | |
| *The basis for the assumed risk (e.g. the median control group risk across studies) is provided in footnotes. The corresponding risk (and its 95% confidence interval) is based on the assumed risk in the comparison group and the relative effect of the intervention (and its 95% CI). | ||||||
| GRADE Working Group grades of evidence | ||||||
| 1Illustrative comparative risks were based upon the mean risk on control intervention in the studies included in the meta‐analysis. | ||||||
| Traditional suburethral sling operation compared to minimally invasive synthetic slings for stress urinary incontinence | ||||||
| Patient or population: women with stress urinary incontinence | ||||||
| Outcomes | Illustrative comparative risks* (95% CI) | Relative effect | No of participants | Quality of the evidence | Comments | |
| Assumed risk | Corresponding risk | |||||
| Minimally invasive slings | Traditional suburethral sling operation | |||||
| 9.1 Number with incontinence (worse, unchanged or improved) within the first year (women's observations) | 275 per 10001 | 267 per 1000 | RR 0.97 | 693 | ⊕⊕⊕⊕ | |
| 9.3 Number with incontinence (worse, unchanged or improved) after first year (women's observations) | 253 per 10001 | 311 per 1000 | RR 1.23 | 382 | ⊕⊕⊝⊝ | |
| 9.11 Peri‐operative surgical complications | 208 per 10001 | 331 per 1000 | RR 1.59 | 243 | ⊕⊕⊝⊝ | |
| 9.12 Bladder perforations | 82 per 10001 | 51 per 1000 | RR 0.62 | 563 | ⊕⊕⊕⊝ | |
| 9.16 Voiding dysfunction | 98 per 10001 | 157 per 1000 | RR 1.6 | 375 | ⊕⊕⊕⊝ | |
| *The basis for the assumed risk (e.g. the median control group risk across studies) is provided in footnotes. The corresponding risk (and its 95% confidence interval) is based on the assumed risk in the comparison group and the relative effect of the intervention (and its 95% CI). | ||||||
| GRADE Working Group grades of evidence | ||||||
| 1Illustrative comparative risks were based upon the mean risk on control intervention in the studies included in the meta‐analysis. | ||||||
| Traditional suburethral sling operation compared to another traditional suburethral sling for stress urinary incontinence | ||||||
| Patient or population: women with stress urinary incontinence | ||||||
| Outcomes | Illustrative comparative risks* (95% CI) | Relative effect | No of participants | Quality of the evidence | Comments | |
| Assumed risk | Corresponding risk | |||||
| Another traditional suburethral sling | Traditional suburethral sling operation | |||||
| 10.1 Number with incontinence (worse, unchanged or improved) within the first year (women's observations) | 336 per 10001 | 299 per 1000 | RR 0.89 | 307 | ⊕⊕⊕⊝ | |
| 10.3 Number with incontinence (worse, unchanged or improved) after first year (women's observations) | 467 per 10001 | 416 per 1000 | RR 0.89 | 379 | ⊕⊕⊕⊝ | |
| 10.8 Peri‐operative surgical complications | 360 per 10001 | 335 per 1000 | RR 0.93 | 213 | ⊕⊕⊝⊝ | |
| 10.12 Voiding dysfunction | 202 per 10001 | 234 per 1000 | RR 1.16 | 165 | ⊕⊕⊕⊝ | |
| *The basis for the assumed risk (e.g. the median control group risk across studies) is provided in footnotes. The corresponding risk (and its 95% confidence interval) is based on the assumed risk in the comparison group and the relative effect of the intervention (and its 95% CI). | ||||||
| GRADE Working Group grades of evidence | ||||||
| 1Illustrative comparative risks were based upon the mean risk on control intervention in the studies included in the meta‐analysis. | ||||||
Background
The prevalence of urinary incontinence in adult women has been estimated to be between 10% to 40%, and is considered severe in about 3% to 17% (Hunskaar 2002). This is a potentially debilitating social problem which leads to high health care costs (Fantl 1996). In the USA, the annual total direct costs of urinary incontinence in both men and women is over USD 16 billion (1995 USD) (Chong 2011) with societal costs of USD 26.2 billion (1995 USD) (Wagner 1998). Approximately, USD 13.12 billion (1995 USD) of the total direct costs of urinary incontinence is spent on stress urinary incontinence (SUI) (Kunkle 2015; Chong 2011). About 70% of this USD 13.12 billion (1995 USD) is borne by people with SUI, mainly through routine care (purchasing pads and disposable underwear (diapers), laundry and dry cleaning). This constitutes a significant individual financial burden. Of the remaining 30%, 14% is spent on nursing home admission, 9% on treatment, 6% on addressing complications and 1% on diagnosis (Chong 2011). A study reported that about 1% of median annual household income (USD 50,000 to USD 59,999 in 2006) was spent by women on incontinence management. This study estimated that women spent an annual mean amount of USD 751 to USD 1277 (2006 USD) on incontinence. This increases based on the severity of the symptoms (Subak 2008). The indirect cost associated exerts social and psychological burden which is unquantifiable. (Chong 2011; Kilonzo 2004). Nevertheless, Birnbaum 2004 estimated that the annual average direct medical costs of SUI for one year (1998) was USD 5642 and USD 4208 for indirect workplace costs. The cost of management and treatment of SUI appears to have increased over time due to increasing prevalence and increased desire for improved quality of life. This in turn has resulted from improved recognition of the condition, as well as increased use of surgical and non‐surgical managements.
Description of the condition
Continence is achieved through an interplay of the normal anatomical and physiological properties of the bladder, urethra and sphincter, pelvic floor and the nervous system co‐ordinating these organs. The active relaxation of the bladder, coupled with the ability of the urethra and sphincter to contain urine within the bladder by acting as a closure mechanism during filling, allow storage of urine until an appropriate time and place to void is reached. The role of the pelvic floor in providing support to the bladder and urethra, and allowing normal abdominal pressure transmission to the proximal urethra is also considered essential in the maintenance of continence. Crucial to the healthy functioning of the bladder, urethra, sphincter and pelvic floor is co‐ordination between them, facilitated by an intact nervous system control.
Incontinence occurs when this normal relationship between the lower urinary tract components is disrupted, resulting from nerve damage or direct mechanical trauma to the pelvic organs. Advancing age, higher parity, vaginal delivery, obesity and menopause are associated with an increase in risk (Wilson 1996).
There are different types of urinary incontinence. Stress urinary incontinence is the most common type (Wilson 1996). The symptom of 'stress incontinence' is the involuntary loss of urine from the urethra during physical activities that increase abdominal pressure, in the absence of a detrusor (bladder wall muscle) contraction or an over‐distended bladder (Blaivas 1997a). Two mechanisms for stress incontinence are recognised: hyper‐mobility or significant displacement of the urethra and bladder neck during exertion, and intrinsic urethral sphincter deficiency (Blaivas 1988). In women, these mechanisms may co‐exist (O'Donnell 1994). Few clinical trials have distinguished between the two conditions, probably because there is no standardised and validated test available to date (Blaivas 1988; McGuire 1993). Women whose incontinence may be due to either of these two mechanisms were considered together in this review.
The diagnosis of 'urodynamic stress incontinence' requires urodynamic investigation to exclude detrusor overactivity, in addition to history‐taking, physical examination, frequency/volume charts and urine analysis. Some authors have described women with only the symptom of stress incontinence (diagnosis made on clinical evaluation without urodynamics). Women with stress incontinence, both with and without urodynamic investigation,were eligible for inclusion in this review.
'Urge incontinence' is the symptom of involuntary loss of urine associated with a sudden, strong desire (urgency) to void. 'Detrusor overactivity' is a diagnosis that denotes involuntary detrusor contractions which are not due to neurological disorders, and diagnosis must be made using urodynamic techniques (Blaivas 1997a). Women with both the symptom and the urodynamic diagnosis of detrusor overactivity were eligible for inclusion in the review only if they had co‐existing stress incontinence ('mixed' incontinence).
Women with mixed incontinence included in this review either had symptoms of stress plus urge incontinence or other urinary symptoms (diagnosed clinically), or urodynamic stress incontinence plus detrusor overactivity (diagnosed using urodynamics).
Description of the intervention
Treatments for stress urinary incontinence include conservative, mechanical, pharmacological and surgical interventions.
-
Conservative treatment centres on physical methods, including pelvic floor muscle training, electrical stimulation, biofeedback and weighted cones.
-
Mechanical devices, which prevent or reduce urinary leakage are available, such as meatal plugs/patches and urethral and vaginal inserts.
-
Drug therapies, principally oestrogens and, less often, alpha adrenergic agents, can be used. A trial of conservative therapy is generally undertaken before resorting to surgery.
These interventions are the subject of separate Cochrane Reviews.
Surgical procedures to remedy stress incontinence generally aim to lift and support the urethro‐vesical junction. There is disagreement, however, regarding the precise mechanism by which continence is achieved. Choice of procedures is often influenced by coexistent problems, surgeon's preference and the physical features of the person affected.
Numerous surgical methods have been described, but essentially they fall into eight categories.
-
Open abdominal retropubic suspension (e.g. colposuspension (Burch), Marshall‐Marchetti‐Krantz (MMK), (Lapitan 2009)
-
Laparoscopic retropubic suspension (Dean 2006)
-
Vaginal anterior repair (anterior colporrhaphy) (Glazener 2001)
-
Traditional suburethral slings
-
Minimally invasive suburethral slings (Ogah 2010)
-
Bladder neck needle suspensions (Glazener 2004)
-
Peri‐urethral injections (Keegan 2007)
-
Artificial sphincters
In this review we concentrated on traditional suburethral sling operations.
How the intervention might work
The aim is to restore or enhance the woman’s urethral support during a sudden movement, such as a cough or sneeze. This is achieved by lifting and supporting the urethro‐vesical junction with autologous or synthetic material.
A traditional suburethral sling operation requires a combined abdominal and vaginal approach. Strips of material are tunnelled under the urethra and are attached either to the rectus muscle or the ileopectineal ligaments. The materials that have been used for slings may be biological or synthetic. Autologous biological materials include: rectus fascia, fascia lata, pubococcygeal muscle, vaginal wall, aponeurosis and pyramidalis fascia. Exogenous biological materials include: ox fascia and porcine dermis (Pelvicol). Synthetic materials include: Teflon, Mersilene tape in a silicon tube, Lyodura, polytetrafluoroethylene (Gore‐Tex), Marlex mesh and silastic.
A modification of the suburethral sling procedure is the 'minimally invasive' polypropylene mesh applied through a minimally invasive technique (e.g. tension‐free vaginal tape (TVT), suprapubic arc (SPARC)) in which a prolene tape covered by a plastic sheath is inserted around the mid‐urethra without fixation and in some centres under local anaesthesia (Smith 2002). These have been considered in a separate Cochrane Review (Ogah 2010).
We included only traditional sling operations, using an open abdominal approach and fixed with sutures, in this review.
Why it is important to do this review
The wide variety of surgical treatments for urinary incontinence indicates the lack of consensus as to which procedure is the best. Provided that a sufficient number of trials of adequate quality have been conducted, the most reliable evidence is likely to come from consideration of all well‐designed randomised controlled trials. Hence, there is a need for an easily accessible, periodically updated, comprehensive systematic review of such trials, which will not only help to identify optimal practice, but also highlight gaps in the evidence base.
Objectives
To assess the effects of traditional suburethral sling procedures for treatment of urodynamic stress urinary incontinence (urodynamic diagnosis), or for symptoms of stress or mixed incontinence (clinical diagnosis) in women.
We made the following comparisons for traditional suburethral sling procedures (abdominal and vaginal).
-
Traditional suburethral sling operation versus no treatment or sham operation
-
Traditional suburethral sling operation versus conservative management (e.g. pelvic floor muscle training, electrical stimulation, cones, biofeedback)
-
Traditional suburethral sling operation versus drugs
-
Traditional suburethral sling operation versus injectables
-
Traditional suburethral sling operation versus colposuspension
-
Traditional suburethral sling operation versus bladder neck needle suspension (abdominal and vaginal)
-
Traditional suburethral sling operation versus anterior repair
-
Traditional suburethral sling operation versus laparoscopic procedures
-
Traditional suburethral sling operation versus a minimally invasive sling
-
One type of traditional sling operations versus another traditional sling operation
Methods
Criteria for considering studies for this review
Types of studies
Randomised or quasi‐randomised controlled trials of women with urodynamic stress incontinence (urodynamic diagnosis), or symptoms of stress or mixed urinary incontinence (clinical diagnosis), in which at least one trial arm involved traditional suburethral sling procedures.
Types of participants
Adult women with stress urinary incontinence due to hyper‐mobility or intrinsic sphincter deficiency, or both, diagnosed clinically or with urodynamics, or with mixed incontinence. We accepted classification of diagnoses as defined by the trial authors.
Types of interventions
At least one arm of a study had to involve traditional suburethral sling procedures to treat stress or mixed incontinence. Comparison interventions could include other surgical techniques and non‐surgical interventions.
Types of outcome measures
We selected outcome measures used in this review on the basis of their relevance to the clinical cure or improvement of incontinence. We regarded the principal measures of effectiveness as the proportion of women cured (continent or dry) following surgery, and the proportion of women whose incontinence was improved.
1. Women's observations
-
Perception of cure and improvement in the short term (less than 12 months) and longer term (more than 12 months)
-
Urgency symptoms or urgency incontinence
2. Quantification of symptoms
-
Pad changes over 24 hours (from self‐reported number of pads used)
-
Incontinent episodes over 24 hours (from self completed bladder chart)
-
Pad tests of quantified leakage (mean volume or weight of urine loss)
3. Clinician's observations
-
Cure and improvement in the short term (less than 12 months) and longer term (more than 12 months)
4. Surgical outcome measures
-
Duration of operation
-
Length of inpatient stay
-
Time to return to normal activity level
5. Adverse events
-
Peri‐operative surgical complications (e.g. infection, bacteriuria, haemorrhage, bladder perforation)
-
De novo urge symptoms or urge incontinence (clinical diagnosis without urodynamics)
-
Voiding dysfunction/difficulty after three months (with or without urodynamic confirmation)
-
Detrusor overactivity (urodynamic diagnosis)
-
Entero‐rectocele
-
Repeat incontinence surgery
-
Later prolapse surgery
-
Surgical complications and other types of adverse event
6. Quality of life
-
General health status measures (e.g. Short Form 36 (Ware 1993)), or specific instruments designed to assess incontinence e.g. the Bristol Female Lower Urinary Tract Symptoms questionnaire (BFLUTS) (Jackson 1996)
7. Other outcomes
-
Non‐prespecified outcomes judged important when performing the review
Search methods for identification of studies
We did not impose language or other restrictions on any of these searches.
Electronic searches
This review has drawn on the search strategy developed for the Cochrane Incontinence Group. We identified relevant trials from the Cochrane Incontinence Group Specialised Register of controlled trials, which is described under Group's details in the Cochrane Library (for more details please see the Specialized Register section of the Group's module in the Cochrane Library). The Register contains trials identified from the Cochrane Central Register of Controlled Trials (CENTRAL), MEDLINE, CINAHL, and handsearching of journals and conference proceedings. The date of the most recent search of the Register for this review was 3 June 2010.
The trials in the Cochrane Incontinence Specialised Register are also contained in CENTRAL. The terms used to search the Cochrane Incontinence Specialised Register are given below:
(TOPIC.URINE.INCON*)
AND
({DESIGN.CCT*} OR {DESIGN.RCT*})
AND
({INTVENT.SURG.SLIN*} OR {INTVENT.SURG.SUBURETHRAL SLING.} OR {INTVENT.SURG.ABDO.SLING.})
(All searches were of the keyword field of Reference Manager 2012).
For previous versions of this review one of the review authors performed extra literature searches ‐ these are described in Appendix 1.
On 6 April 2017 we performed additional searches for the brief economic commentary (BEC), conducted in MEDLINE (1 January 1946 to March 2017), Embase (1 January 1980 to 2017 Week 12) and NHS EED (1st Quarter 2016). Details of the searches run and the search terms used can be found in Appendix 2.
Searching other resources
We searched the reference lists of relevant articles for other possibly relevant trials.
Data collection and analysis
We excluded studies from the review if they were not randomised or quasi‐randomised controlled trials for incontinent women or if they made comparisons other than those pre‐specified. Excluded studies are listed in the Characteristics of excluded studies tables, with the reasons for their exclusion.
We processed included trial data as described in the Cochrane Handbook for Systematic Reviews of Interventions (Higgins 2008).
Selection of studies
The review authors evaluated the reports of all possibly eligible studies for appropriateness for inclusion without prior consideration of the results and we retrieved in full any reports of potentially eligible trials.
We resolved any differences of opinion related to study inclusion, methodological quality or data extraction by discussion.
Data extraction and management
At least three review authors independently undertook data extraction using a standard form containing pre‐specified outcomes. Where data may have been collected but not reported, we sought clarification from the trial authors.
The review authors resolved any differences of opinion related to study inclusion, methodological quality or data extraction by discussion, and when necessary, we referred to a fourth reviewer for arbitration.
We conducted the review using the standard Cochrane software, Review Manager 5 (RevMan 5) (RevMan 2014) and processed included trial data as described in the Cochrane Handbook for Systematic Reviews of Interventions (Higgins 2008).
Assessment of risk of bias in included studies
Each review author independently undertook 'Risk of bias' assessment. The system for classifying methodological quality of controlled trials was based on an assessment of the three principal potential sources of bias. These are:
-
selection bias from insecure random allocation of treatments;
-
attrition bias from dropouts or losses to follow‐up, particularly if there is a differential dropout rate between groups;
-
biased ascertainment (detection bias) of outcome where knowledge of the allocation might have influenced the measurement of outcome.
Measures of treatment effect
Where appropriate, we calculated a combined estimate of treatment effect across similar studies for each pre‐specified outcome, using risk ratios (RR) for dichotomous outcomes or mean differences for continuous outcomes, with 95% confidence intervals where possible. For categorical (dichotomous) outcomes the numbers reporting an outcome were related to the numbers at risk in each group to derive a RR. For continuous variables we used means and standard deviations to derive a mean difference (MD). We used a fixed‐effect approach to the analysis unless there was evidence of heterogeneity across studies.
Dealing with missing data
Where statistical synthesis of data from more than one study was not possible or considered not appropriate, we undertook a narrative review of eligible studies. We sought data on the number of participants with each outcome event, by allocated treated group, irrespective of compliance and whether or not the participant was later thought to be ineligible or otherwise excluded from treatment or follow‐up to allow an intention‐to‐treat analysis when possible.
We defined an intention‐to‐treat analysis to mean that all participants were analysed in their randomised groups whether or not they received the allocated intervention. We included data as they were reported and did not impute missing values.
Assessment of heterogeneity
We investigated differences between trials when apparent from either visual inspection of the results or when statistically significant heterogeneity was demonstrated by using the Chi2 test at the 10% probability level or assessment of the I2 statistic (Higgins 2003). If there was no obvious reason for the heterogeneity (after consideration of populations, interventions, outcomes and settings of the individual trials) or it persisted despite the removal of outlying trials, we used a random‐effects model.
Data synthesis
We used the Mantel‐Haenszel statistical method for meta‐analysis. We used a fixed‐effect approach to the analysis unless there was evidence of heterogeneity across studies.
Subgroup analysis and investigation of heterogeneity
We grouped trial data by type of incontinence ‐ either urodynamic stress incontinence, based on a urodynamic diagnosis, or stress or mixed incontinence, based on a symptom classification. We carried out quantitative synthesis when we identified more than one eligible study.
Results
Description of studies
This is the second update of the review of traditional suburethral sling operations for urinary incontinence in women. We have added data from 16 RCTs, of which 13 are new RCTs (Albo 2007; Amaro 2007; Bai 2005; Basok 2008; Guerrero 2008; Maher 2005; Pacetta 2005; Sharifiaghdas 2008; Silva Filho 2006; Song 2004; Tcherniakovsky 2009; Teixeira 2008; Wadie 2005) and three are updates of previously included trials (Arunkalaivanan 2003; Kondo 2006; Lucas 2000).
Results of the search
Altogether we reviewed 128 reports of 61 studies, of which we included 26 and excluded 35.
Included studies
We identified 26 randomised or quasi randomised trials that met the inclusion criteria. These trials included 2284 women (1287 with traditional slings), and sample sizes ranging from 20 to 655 participants.
With the exception of the Albo 2007 and Sand 2000 trials, in general, included trials were small with short follow‐up.
One trial (Osman 2003) compared traditional suburethral sling operations with oxybutynin in the treatment of women with mixed urinary incontinence, another (Maher 2005) with suburethral injectable treatment and another (Hilton 1989) with bladder neck needle suspension.
Seven trials compared slings with open abdominal retropubic colposuspension (Albo 2007; Bai 2005; Demirci 2001; Enzelsberger 1996; Fischer 2001; Henriksson 1978; Sand 2000).
Twelve trials addressed the comparison between traditional sling operations and minimally invasive sling operations (Amaro 2007; Arunkalaivanan 2003; Bai 2005; Basok 2008; Kondo 2006; Guerrero 2008; Sharifiaghdas 2008; Silva Filho 2006; Song 2004; Tcherniakovsky 2009; Teixeira 2008; Wadie 2005).
Six trials compared one type of traditional sling with another (Barbalias 1997; Guerrero 2008; Lucas 2000; Pacetta 2005; Shin 2001; Viseshsindh 2003).
There were no trials comparing suburethral slings with anterior repair, laparoscopic retropubic colposuspension or artificial sphincters.
Interventions
The 26 studies used 10 materials for the sling procedure.
Autologous biological materials
-
Autologous dermal graft patch (Shin 2001)
-
Autologous fascia lata (Song 2004)
-
Autologous rectus fascia (Albo 2007; Amaro 2007; Bai 2005; Barbalias 1997; Demirci 2001; Guerrero 2008; Kondo 2006; Lucas 2000; Maher 2005; Osman 2003; Pacetta 2005; Sharifiaghdas 2008; Silva Filho 2006; Tcherniakovsky 2009; Viseshsindh 2003; Wadie 2005)
-
Autologous rectus fascia of smaller length (Lucas 2000)
Other biological materials
-
Cadaveric fascia lata (Basok 2008, Shin 2001)
-
FortaPerm (Pacetta 2005)
-
Lyphohilised dura matter (Enzelsberger 1996)
-
Porcine dermis also known as Pelvicol (Arunkalaivanan 2003; Guerrero 2008; Hilton 1989, Teixeira 2008)
-
Vaginal wall sling ‐ slings made of tissue harvested from the woman's own vaginal wall (Viseshsindh 2003)
Synthetic non‐absorbable materials
-
Gore‐Tex sling (Barbalias 1997)
-
Polytetrafluoroethylene ‐ PTFE (Sand 2000)
-
Teflon Sling (Henriksson 1978)
One trial (Fischer 2001), reported in abstract form, did not mention the type of material used for the suburethral sling.
Comparators
There were seven comparators across 23 studies.
-
Anticholinergic (Osman 2003)
-
Intravaginal slingplasty (Basok 2008)
-
Minimally invasive sling (Amaro 2007; Arunkalaivanan 2003; Bai 2005, Guerrero 2008; Kondo 2006; Sharifiaghdas 2008; Silva Filho 2006; Song 2004; Tcherniakovsky 2009; Teixeira 2008; Wadie 2005)
-
Retropubic colposuspension: Burch colposuspension (Albo 2007; Bai 2005; Demirci 2001; Enzelsberger 1996; Fischer 2001; Osman 2003; Sand 2000); Marshall‐Marchetti‐Krantz (Henriksson 1978)
-
Stamey bladder neck (needle) suspension (Hilton 1989)
-
Transurethral Macroplastique (injectable material, Maher 2005)
One trial was designed to study an anticholinergic agent (oxybutynin) in comparison with surgery (Burch or sling) for women with mixed urinary incontinence (Osman 2003). It was possible to abstract only the data from sling surgery in comparison with medical treatment to include in the analysis.
Participants
Inclusion criteria were not always clearly defined. Seven trials included women with mixed urinary incontinence (MUI, both stress and urgency) (Barbalias 1997; Basok 2008; Kondo 2006; Osman 2003; Sand 2000; Song 2004; Wadie 2005). One large trial involved women with self‐reported stress urinary incontinence (SUI), (Albo 2007). All others were restricted to women with a urodynamic diagnosis of stress incontinence (USI, previously known as genuine stress incontinence). All trials included both pre‐ and post‐menopausal women, but none were treated with hormone replacement therapy. One study was restricted to women with vaginal narrowing due to atrophic vaginitis or previous surgical scars (Hilton 1989).
Previous continence surgery status
Two trials (Henriksson 1978; Silva Filho 2006) only included women without previous interventions for incontinence and another (Enzelsberger 1996) only included women who had had recurrent incontinence after a previous vaginal hysterectomy and at least one anterior repair. The others included women with both primary and recurrent stress incontinence but did not report outcome data separately according to previous continence surgery.
Outcome measures
The included studies did not report outcome measures in a standardised fashion.
Seventeen trials used women's observations to report urinary incontinence outcomes with clinical history or questionnaire about urinary incontinence on effort (SUI) or use of pads (Albo 2007; Amaro 2007; Arunkalaivanan 2003; Bai 2005; Fischer 2001; Kondo 2006; Lucas 2000; Maher 2005; Osman 2003; Pacetta 2005; Sand 2000; Sharifiaghdas 2008; Shin 2001; Song 2004; Tcherniakovsky 2009; Wadie 2005).
Nine trials used clinician's observations of SUI using stress testing or urodynamics (Albo 2007; Barbalias 1997; Demirci 2001; Enzelsberger 1996; Hilton 1989; Kondo 2006; Maher 2005; Osman 2003; Pacetta 2005; Sand 2000; Sharifiaghdas 2008)
Two trials did not adequately describe the parameters on which they based their outcomes (Guerrero 2008; Henriksson 1978). We therefore assumed that data from Guerrero 2008 were patient‐reported.
Three trials (Arunkalaivanan 2003; Basok 2008; Guerrero 2008) assessed woman‐reported improvement of incontinence within 12 months. Arunkalaivanan 2003 assessed improvement using a urinary symptom questionnaire; Basok 2008 considered the use of one or fewer than one incontinence pad per day as subjective improvement; and one trial reported as an abstract did not specify outcome measures (Guerrero 2008).
Follow‐up
Not all studies reported initial and long‐term follow‐up. Seven authors (Bai 2005; Fischer 2001; Henriksson 1978; Silva Filho 2006; Sand 2000; Osman 2003; Viseshsindh 2003; Wadie 2005) presented their results at three‐ and/or six‐ and/or nine‐month assessment. Ten of the studies presented an intermediate follow‐up at around one year (Arunkalaivanan 2003; Basok 2008; Demirci 2001; Guerrero 2008; Lucas 2000; Maher 2005; Pacetta 2005; Sharifiaghdas 2008; Shin 2001; Tcherniakovsky 2009). Seven studies described longer but not ideal, follow‐up of one to five years (Albo 2007; Amaro 2007Barbalias 1997; Enzelsberger 1996; Hilton 1989; Kondo 2006; Teixeira 2008). One trial provided full information in two reports of short‐ and long‐term (more than five years) follow‐up (Sand 2000).
Further characteristics of the trials are reported in the Characteristics of included studies table.
Excluded studies
We excluded 35 studies. Fifteen trials compared minimally invasive or variant sling procedures with each other, or other operations: (Amat 2007; Choe 2000; Chong 2003; Darai 2007; Debodinance 1993; Halaska 2001; Han 2001; Kocjancic 2008; Liapis 2002; Lim 2005; Naumann 2006; O'Sullivan 2000; Seo 2007; Ward 2002a; Yoo 2007). Minimally invasive sling and open colposuspension procedures are considered in other Cochrane Reviews (Ogah 2010; Lapitan 2009). Lemieux 1991 compared clamping and non‐clamping of catheters after incontinence surgery.
Twelve studies were not randomised (Atherton 2000; Bruschini 2005; Corcos 2001; Debodinance 1994; Giri 2004; Giri 2006; Hung 2001; Ishenko 1999; Kuo 2001; Obrink 1978; Schostak 2001; Wang 1999). Choe 2001 did not adequately perform a final analysis.
There was uncertainty regarding the population used in two trials (Aurunkalaivanan 2001; Barrington 2003). Four trials (Goldberg 2001; Kwon 2002; Meschia 2001; Trezza 2001) dealt with a diagnosis other than SUI.
Further details are provided in the Characteristics of excluded studies table.
Risk of bias in included studies
We have summarised our 'Risk of bias' findings in the included trials in Figure 1 and Figure 2.

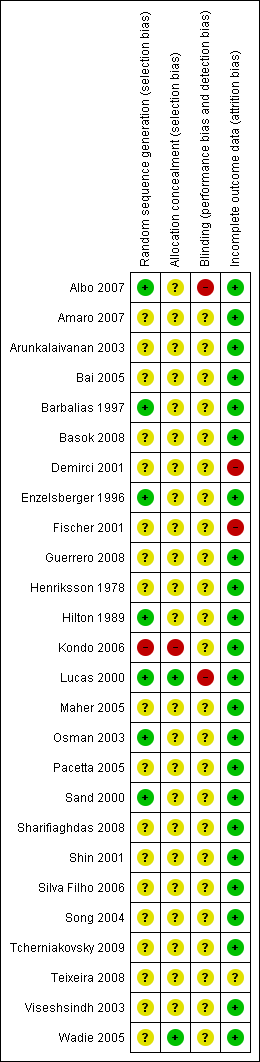
Allocation
Adequate sequence generation
Three trials used an adequate method of sequence generation (Albo 2007; Osman 2003; Sand 2000). Three trials used randomisation charts to generate the randomisation sequence, without providing further information about the process (Barbalias 1997; Enzelsberger 1996; Hilton 1989): nevertheless these were judged to be adequate. Nineteen trials just stated that women were randomised, without any other detail of the process (Amaro 2007; Arunkalaivanan 2003; Bai 2005; Basok 2008; Demirci 2001; Fischer 2001; Guerrero 2008; Henriksson 1978; Maher 2005; Pacetta 2005; Osman 2003; Sharifiaghdas 2008; Shin 2001; Silva Filho 2006; Song 2004; Tcherniakovsky 2009; Teixeira 2008; Viseshsindh 2003; Wadie 2005). There was inadequate sequence generation in one trial (Kondo 2006), which used the date‐of‐birth method, where even dates were assigned to one group and odd to the other. In one trial, one woman was randomised to one arm of the study in comparison with two randomised to the other intervention (Barbalias 1997).
Allocation concealment
The reported method of concealment of randomisation was secure in two trials (Lucas 2000; Wadie 2005). Allocation concealment was unknown for most of the remaining trials as the trial authors did not record it. Inadequate allocation concealment was present in one trial (Kondo 2006) where the date‐of‐birth method was used to randomise participants. Another trial (Sharifiaghdas 2008) mentioned sealed, opaque envelopes, but no mention of numbering, and thus we judged it unclear for allocation concealment.
Blinding
Masking of women or surgeons was not reported in most trials, but is difficult to achieve in surgical trials.
Incomplete outcome data
Most trials had complete outcome data at follow‐up, or losses were evenly distributed between the randomised groups, and thus were unlikely to have had a significant effect on the final analysis. Two trials (Demirci 2001; Fischer 2001) did not account for losses at follow‐up, which might potentially have been a source of bias.
Other potential sources of bias
Comparability of groups at baseline
Baseline comparisons were given in ten trials (Albo 2007; Arunkalaivanan 2003; Bai 2005; Basok 2008; Demirci 2001; Enzelsberger 1996; Hilton 1989; Kondo 2006; Lucas 2000; Maher 2005; Sand 2000; Sharifiaghdas 2008; Song 2004; Tcherniakovsky 2009; Wadie 2005). One author stated that the two groups were comparable without supplying data (Henriksson 1978), and the others did not mention baseline comparisons between the groups (Barbalias 1997; Fischer 2001; Osman 2003; Shin 2001; Viseshsindh 2003). Third party outcome assessment was not performed in any of the trials.
Definition of cure
We calculated the number of incontinent women from the cure rate provided in the reports of trials. The definition of cure was not uniform in the identified studies. For example, although Barbalias 1997 considered only the 'dry' participants as cured, he included the improved ones in the success rates, without reporting what 'improvement' meant. Others only considered 'dry' participants to be cured (Enzelsberger 1996). The most detailed description of results were reported by Albo 2007; Sand 2000 and Lucas 2000, with data describing both objective (pad tests and urodynamics) and subjective (self‐reported, voiding diaries) cure rates. Reporting of other outcomes was variable and incomplete.
Effects of interventions
See: Summary of findings for the main comparison Traditional suburethral slings compared to injectable treatment for stress urinary incontinence; Summary of findings 2 Traditional suburethral sling operation compared to open abdominal retropubic suspension for stress urinary incontinence; Summary of findings 3 Traditional suburethral sling operation compared to bladder neck (needle) suspension for stress urinary incontinence; Summary of findings 4 Traditional suburethral sling operation compared to minimally invasive synthetic slings for stress urinary incontinence; Summary of findings 5 Traditional suburethral sling operation compared to another traditional suburethral sling for stress urinary incontinence
Outcome measures used in this review were not consistently reported in the trials.
Comparison 1. Traditional suburethral sling operation versus no treatment or sham operation
No trials identified.
Comparison 2. Traditional suburethral sling operation versus conservative management (e.g. pelvic floor muscle training, electrical stimulation, cones, biofeedback)
No trials identified.
Comparison 3. Traditional suburethral sling operation versus drugs
One trial studied women with mixed urinary incontinence treated with oxybutynin or surgery (Osman 2003). Oxybutinin is a drug treatment for urgency urinary incontinence, overactive bladder and detrusor overactivity, not for stress incontinence. The type of surgery was selected according to Valsalva leak point pressure (VLPP) (those with VLPP less than 90 cm of water had rectus fascia sling and those with VLPP more than 90 cm of water had Burch colposuspension). The results for the total surgically managed group were similar to those for the subgroup having slings. We therefore included in tables only data from women with oxybutynin and sling.
The study suggested that slings are significantly better for treating mixed urinary incontinence than oxybutynin. Results were analysed in terms of participant‐reported incontinence within one year (RR 0.18, 95% CI 0.08 to 0.43) (Analysis 3.1). Fewer women had persistent urgency urinary incontinence after the sling surgery (RR 0.29, 95% CI 0.09 to 0.94) (Analysis 3.2).
Comparison 4. Traditional suburethral sling versus injectables
We identified one small trial that compared slings (21) with injectable Macroplastique (22) in 45 women (Maher 2005).
The only statistically significant outcome was number with incontinence (clinician‐observed) within the first year, essentially the number not cured, which favours the traditional sling: 4/21 versus 20/22, (RR 0.21, 95% 0.09 to 0.21) (Analysis 4.3).
There were no statistically significant differences between groups but we found wide confidence intervals for the following outcomes.
-
Number of women with incontinence (participant‐reported) within the first year (RR 0.42, 95% CI 0.09 to 1.93) (Analysis 4.1)
-
Number of women with incontinence (participant‐reported) after the first year (RR 0.12, 95% CI 0.01 to 2.02) (Analysis 4.2)
-
Voiding dysfunction (RR 4.19, 95% CI 0.51 to 34.50) (Analysis 4.4)
-
De novo detrusor overactivity (urodynamic diagnosis) (RR 3.14, 95% CI 0.13 to 72.96) (Analysis 4.5)
-
Urinary tract infection (RR 1.57, 95% CI 0.29 to 8.49) (Analysis 4.6)
Maher 2005 reported a significant reduction in incontinence impact questionnaire scores compared with baseline (P less than 0.01) in both groups, though he provided no data.
Comparison 5. Traditional suburethral sling versus open abdominal retropubic colposuspension
Seven trials compared slings with open abdominal retropubic colposuspension (Albo 2007; Bai 2005; Demirci 2001; Enzelsberger 1996; Fischer 2001; Henriksson 1978; Sand 2000). The extent to which we could consider the trials together was limited because of differences in the procedures compared, the populations studied, the outcomes assessed, and the length of follow‐up. Two trials involved the pubovaginal sling technique using autologous rectus fascia (Albo 2007; Demirci 2001). Enzelsberger 1996 used a Lyodura sling, Henriksson 1978 used the Zoedler sling, and Sand 2000 used the Gore‐Tex‐type. Fischer (Fischer 2001) did not specify the sling material.
Only one of these trials (Sand 2000) reported follow‐up for more than five years and presented both short‐ and long‐term data in two full reports.
5.1 Women's observations (outcomes 5.1 to 5.4)
Short‐term incontinence or improvement
Evidence from four trials (Bai 2005; Fischer 2001; Henriksson 1978; Sand 2000) showed no statistically significant difference in the number of women reporting incontinence within one year of treatment between the two treatment groups (RR 0.40, 95% CI 0.11 to 1.41) (Analysis 5.1) but the confidence interval was wide and from the data we could not rule out a difference favouring either group.
Medium‐/long‐term incontinence or improvement
Data for failure rates at one to five year follow‐up were available from five trials (Albo 2007; Bai 2005; Demirci 2001; Enzelsberger 1996; Sand 2000). The summary statistic, combining urodynamic and symptom‐only diagnosis, showed a lower incontinence rate with sling procedures (RR 0.75, 95% CI 0.62 to 0.90) (Analysis 5.3). This reflects the results of the Albo 2007 trial, which had the largest population sample. The data from the trials in which women all had urodynamic stress incontinence showed no significant difference in urinary incontinence after one year (RR 0.72, 95% CI 0.31 to 1.67) (Analysis 5.3.1).
Long‐term cure
Only one trial provided data beyond five years (Sand 2000, included in the outcome woman‐reported incontinence after one year): there was no statistically significant difference between the groups, but with very wide confidence intervals (RR 2.31, 95% CI 0.24 to 22.62) (Analysis 5.3).
5.2 Quantification of symptoms (outcomes 5.5 to 5.7)
There were no data from any of the trials for these outcomes and thus we could not perform meta‐analysis.
5.3 Clinician's observations (outcomes 5.8 to 5.9)
No data were available for objective cure within one year of treatment.
Consistent with the results in the woman‐reported assessment of incontinence, there were no statistically significant differences in clinically‐assessed incontinence rates at one year (RR 0.95, 95% CI 0.64 to 1.41) (Analysis 5.9). Again, wide confidence intervals mean that we cannot rule out a difference between slings or open colposuspension in either direction. This was based on data from three studies with data on assessment after one year (Albo 2007; Enzelsberger 1996; Sand 2000).
5.4 Surgical outcome measures (outcomes 5.10 to 5.12)
Data on surgical parameters came from four trials (Albo 2007; Demirci 2001; Enzelsberger 1996; Sand 2000).
One trial (Demirci 2001) compared operative times between groups. There was no statistically significant difference between the groups but the confidence interval was wide (MD 6 minutes, 95% CI ‐0.5 to 13) (Analysis 5.10).
Meta‐analysis of data from two trials (Enzelsberger 1996; Sand 2000) showed that women in the colposuspension group had their catheters removed earlier (MD 8 days, 95% CI 6.8 to 9.2) (Analysis 5.11). However, it is unclear if this was due to the procedures themselves or differences in hospital policies.
Three trials reported length of inpatient stay. Two trials showed similar lengths of stay for both treatment groups (Demirci 2001; Sand 2000). One trial (Enzelsberger 1996) reported that women stayed eight days less after colposuspension compared to after a traditional sling procedure, which is reflected in the statistically significant summary total, (MD 2 days, 95% CI 1.5 to 2.6) (Analysis 5.12). There was statistically significant heterogeneity, which was removed when Enzelsberger 1996 was excluded from the analysis, but it was unclear why this trial reported such a large difference in hospital stay: this may also have been due to differences in hospital policies.
5.5 Adverse events (outcomes 5.14 to 5.21)
In four trials (Albo 2007; Demirci 2001; Enzelsberger 1996; Sand 2000) there were statistically significantly fewer perioperative complications in the open colposuspension group (RR 1.31, 95% CI 1.14 to 1.51) (Analysis 5.14). This finding was mostly due to data from only one, large, trial (Albo 2007), which included data on bladder perforation and urinary tract infection (there was a 20% lower risk of bladder perforation with the sling procedure (RR 0.20, 95% CI 0.04 to 0.91) (Analysis 5.15), and a 50% increase in urinary tract infection with the sling procedure (RR 1.50, 95% CI 1.33 to 1.70) (Analysis 5.16) as compared with colposuspension).
One small trial (Enzelsberger 1996) reported data on de novo urge symptoms or incontinence: there were no statistically significant differences between the groups but the confidence interval was wide (RR 2.00, 95% CI 0.54 to 7.39) (Analysis 5.17). Evidence from four small trials (Bai 2005; Demirci 2001; Enzelsberger 1996; Sand 2000) demonstrated no statistically significant difference in detrusor overactivity between the groups (RR 1.42, 95% CI 0.52 to 3.87) (Analysis 5.18).
Pooled data from five trials (Albo 2007; Bai 2005; Demirci 2001; Enzelsberger 1996; Sand 2000) showed that significantly more women had voiding dysfunction after sling (13% versus 2% after open colposuspension, RR 6.08, 95% CI 3.10 to 11.95) (Analysis 5.19).
Two trials (Demirci 2001; Enzelsberger 1996) reported that more women had new or recurrent prolapse after open colposuspension (7/53) compared to after a sling procedure (1/53, RR 0.20, 95% CI 0.04 to 1.11) (Analysis 5.20), but this did not reach statistical significance. However there was no information about subsequent surgery for either urinary incontinence or prolapse in any trial.
5.6 Quality of life (outcomes 5.22)
Data were reported in different formats, thus meta‐analysis was not possible.
Albo 2007 reported a significantly greater improvement in quality of life for those receiving the Burch procedure compared to the sling procedure, stating their P value was 0.033. Fischer 2001 reported no significant difference in the Incontinence Impact Questionnaire and Urogenital Distress Inventory scores between the colposuspension group and the sling group, although actual numbers were not reported.
Comparison 6. Traditional suburethral sling versus bladder neck needle suspension (abdominal and vaginal)
Only one small trial compared porcine dermis sling with Stamey needle suspension (Hilton 1989). This was a small trial with only 10 women in each arm. The women were unsuitable for abdominal colposuspension (the trial author's preferred procedure) because they had vaginal narrowing secondary to either previous interventions or atrophic vaginitis. All women had urodynamic stress incontinence. Groups were comparable for age, parity, previous interventions and hormonal status. Follow‐up was reported at three and 24 months.
6.1 Women's observations (outcomes 6.1 and 6.2)
Although there were no significant differences in participant‐reported incontinence rates between the groups in the short or longer term, numbers were too small to address such differences (Analysis 6.1; Analysis 6.2).
6.4 Surgical outcome measures (outcomes 6.3)
The sling group needed an indwelling catheter for longer, and more adjuvant therapy, resulting in a longer stay in hospital (MD 13 days longer, 95% CI 5 to 21) (Analysis 6.3).
6.5 Adverse events (outcomes 6.4 to 6.7)
Nine of the 10 women who had sling operations had complications, compared with two of the 10 who had needle suspension. These included: pyrexia, blood loss, wound infection and pulmonary embolus (RR 4.50, 95% CI 1.28 to 15.81) (Analysis 6.4). Data reported for urge incontinence, late voiding dysfunction and detrusor overactivity showed no statistically significant differences, and confidence intervals were wide.
Comparison 7. Traditional suburethral sling operation versus anterior repair
No trials identified.
Comparison 8. Traditional suburethral sling operation versus laparoscopic procedures
No trials identified.
Comparison 9. Traditional suburethral sling operation versus a minimally invasive sling
Twelve trials addressed this comparison (Amaro 2007; Arunkalaivanan 2003; Bai 2005; Basok 2008; Kondo 2006; Guerrero 2008; Sharifiaghdas 2008; Silva Filho 2006; Song 2004; Tcherniakovsky 2009; Teixeira 2008; Wadie 2005).
9.1 Women's observations (outcomes 9.1 to 9.4)
Short‐term incontinence
Incontinence within 12 months of operation was investigated by eight RCTs with a total of 693 participants. Assessment of failure was self‐reported by participants and by responses to symptom‐based questionnaires. There was no significant difference between participant‐reported incontinence rate (RR 0.97, 95% CI 0.78 to 1.20) (Analysis 9.1). This translates to 267 per 1000 women being incontinent after a traditional sling compared with 275 per 1000 after a minimally invasive sling (summary of findings Table 4, 9.1).
Out of a total of 432 women, 11% of women who had traditional sling operations and 15% of those with minimally invasive sling operations reported no improvement. This was not a statistically significant difference and the confidence intervals were wide (RR 0.78, 95% CI 0.48 to 1.27) (Analysis 9.2).
Medium‐/long‐term incontinence
Data on incontinence after the first year was available from four RCTs (Arunkalaivanan 2003; Bai 2005; Guerrero 2008; Kondo 2006). Incontinence was reported by 31.6% of those women in the traditional sling and 25.3% of those in the minimally invasive slings groups. This was not statistically significant (RR 1.23, 95% CI 0.91 to 1.66) (Analysis 9.3). This translates to 311 per 1000 women being incontinent after a traditional sling compared with 253 per 1000 after a minimally invasive sling (summary of findings Table 4, 9.3).
Improvement after a year was addressed by two trials (Arunkalaivanan 2003; Guerrero 2008) and there was no statistically significant difference between the two types of sling (RR 1.30, 95% CI 0.57 to 2.94) (Analysis 9.4).
9.2 Quantification of symptoms (outcome 9.5)
One small trial reported the mean weight of urine on pad test (Silva Filho 2006). The pooled data showed no statistically significant difference in groups (MD 31.00 g, 95% CI ‐57.53 to ‐4.47) (Analysis 9.5).
9.3 Clinician's observations (outcomes 9.6 and 9.7)
Clinician‐reported incontinence within one year, defined as complete absence of urinary leakage during cough stress test, was assessed in two small trials (Kondo 2006; Sharifiaghdas 2008). There was no statistically significant difference between the two groups (RR 1.29, 95% CI 0.45 to 3.71) (Analysis 9.6). Kondo 2006 further addressed objective cure after the first year but again the findings were not statistically significant and the confidence interval was wide (RR 1.72, 95% CI 0.82 to 3.61) (Analysis 9.7).
9.4 Surgical outcome measures (outcomes 9.8 to 9.10)
Traditional suburethral sling operations took significantly longer to complete with a mean operating time of 102 minutes compared to 42 minutes for minimally invasive synthetic suburethral sling operations (MD 60 minutes, 95% CI 57 to 63) (Analysis 9.8). There was statistically significant heterogeneity that could not be explained by differences in either the populations, interventions or settings of the individual trials. This heterogeneity persisted even after we performed sensitivity analysis excluding Song 2004, the largest trial, which showed a much longer operating time for the traditional sling operation than the other trials. However, a random‐effects model still showed that traditional suburethral slings took significantly longer to perform (MD 52 minutes, 95% CI 23 to 81) (analysis not shown).
In two small studies (Kondo 2006; Silva Filho 2006), length of hospital stay was also shorter after minimally invasive synthetic suburethral sling operations (RR 0.49 days, 95% CI 0.26 to 0.72) (Analysis 9.9). Kondo 2006 and Wadie 2005 reported that the time to catheter removal was longer after a traditional sling procedure, but this was not statistically significant (MD 0.11 days, 95% ‐0.07 to 0.30) (Analysis 9.10).
9.5 Adverse events (outcomes 9.11 to 9.20)
Pooled data from three trials (Arunkalaivanan 2003; Kondo 2006; Tcherniakovsky 2009) showed a statistically significant higher risk of perioperative complications after traditional sling operations (RR 1.59, 95% CI 1.03 to 2.44) (Analysis 9.11).
Seven RCTs (Arunkalaivanan 2003; Bai 2005; Kondo 2006; Sharifiaghdas 2008; Song 2004; Tcherniakovsky 2009; Wadie 2005) reported bladder perforation: there were more perforations after minimally invasive slings but this did not reach statistical significance (RR 0.62, 95% CI 0.34 to 1.11) (Analysis 9.12), and the confidence interval was wide. Kondo 2006 further reported urethral injury alone (RR 0.36, 95% CI 0.02 to 8.39) (Analysis 9.13), which again was not statistically significant.
The combined results from three trials showed less de novo urgency symptoms or urgency after minimally invasive synthetic suburethral sling operations (RR 3.13, 95% CI 0.96 to 10.24) (Analysis 9.14) but this did not reach statistical significance and the confidence interval was wide. However, three trials showed that de novo detrusor overactivity was significantly less after minimally invasive synthetic suburethral sling operations (RR 3.21, 95% CI 1.29 to 8.03) (Analysis 9.15). This was principally due to the higher weighting given to the largest trial (Basok 2008).
The combined results from five trials showed that more women had postoperative voiding dysfunction after traditional slings than after minimally invasive sling operations (RR 1.60, 95% CI 0.94 to 2.71) (Analysis 9.16) but this did not quite reach statistical significance and the confidence interval was wide.
More women in the traditional sling group required release of sling (9% versus 2%), reported in two trials (RR 3.67, 95% CI 0.95 to 14.22) (Analysis 9.17) but again this was not statistically significant.
There was no statistically significant difference in:
-
urinary retention up to 6 weeks (RR 5.51, 95% CI 0.68 to 44.63) (Analysis 9.18) reported in one trial;
-
vaginal erosion (RR 0.35, 95% CI 0.02 to 8.10) (Analysis 9.19) based on one trial.
9.6 Quality of life
Seven studies assessed quality of life. Four of these studies used a number of validated questionnaires, and two studies (Arunkalaivanan 2003; Basok 2008) used invalidated questionnaires. The data were reported in different ways, thus meta‐analysis was not possible and the individual results are reported below .
-
Amaro 2007 used the Portuguese version of King's Health Questionnaire (KHQ). There were no statistically significant differences between groups in: general health condition; impact of incontinence; role, physical and social limitations; personal relationships; emotions; sleep and severity perception of urinary incontinence at 36 months.
-
Silva Filho 2006 also used the KHQ, showing a significantly greater improvement in those who underwent the traditional suburethral sling operation in the following domains: general health perception, physical, social and role limitations; and in emotions and severity measures. There were no significant differences in the incontinence impact, personal relationships, sleep or energy domains.
-
There was statistically significant improvement postoperatively in the Incontinence Impact Questionnaires (IIQ‐7) and Urogenital Distress Inventories (UDI‐6) within both groups but there was no significant difference in the degree of improvement between the groups (Kondo 2006).
-
IIQ score was also used by Sharifiaghdas 2008 to determine subjective cure. The means were reported 44.3 (range 35.2 to 61.5) in the minimally invasive procedure and 48.5 (range 38.5 to 69.7) in the sling group (P = 0.46). A score less than 50 represents a good quality of life, between 50 and 70 moderate quality of life, and greater than 70 poor quality of life. There was no significant difference in quality of life between groups. Fifteen (72%) of the minimally invasive group and 20 (55%) of the sling group were satisfied with the operation (P value reported by trial authors = 0.3)
-
There was no significant difference in any of the domains of the Bristol female lower urinary tract symptom score (BFLUTS) assessed in Guerrero 2008.
-
A subjective 10‐point patient satisfaction questionnaire was used by Basok 2008: there was no evidence of difference between the groups with satisfaction rates of 82% and 87.5% in the traditional sling and minimally invasive sling respectively.
-
A 10‐point questionnaire‐based assessment was used by Arunkalaivanan 2003: the mean score was 8.03 for minimally invasive synthetic suburethral slings and 8.05 for traditional sling, with a median of nine for both groups.
Comparison 10. One type of traditional sling operations versus another traditional sling operation
Six trials addressed this comparison (Barbalias 1997; Guerrero 2008; Lucas 2000; Pacetta 2005; Shin 2001; Viseshsindh 2003). Traditional sling in this comparison refers to autologous rectus fascial slings, except for one trial, which used autologous dermal graft patch (Shin 2001). New sling refers to Pelvicol (Guerrero 2008), FortaPerm (Pacetta 2005), Gore‐Tex (Barbalias 1997), cadaveric fascia lata (Shin 2001) and a sling made out of vaginal wall (Viseshsindh 2003). The majority of the trials compared different biological materials with each other, except for Barbalias 1997, in which rectus fascia was compared with Gore‐Tex.
10.1 Women's observations (outcomes 10.1 to 10.5)
Three trials (Guerrero 2008; Lucas 2000; Pacetta 2005) reported this outcome.
Short‐term incontinence
A total of 307 women studied within the first 12 months after surgery showed similar incontinence rates between traditional sling operations using autologous materials (35%, 56/161), and traditional sling operations using Pelvicol, FortaPerm and autologous material of shorter length (34%, 49/146). However, the confidence intervals were wide (RR 0.89, 95% CI 0.66 to 1.19) (Analysis 10.1). Two trials using a biological sling (Pelvicol, Guerrero 2008 and FortaPerm, Pacetta 2005) also reported improvement rates that significantly favoured the traditional autologous sling material rectus fascia (RR 0.22, 95% CI 0.08 to 0.59) (Analysis 10.2.1). However, when the comparator was the synthetic non‐absorbable material Gore‐Tex, the trial was too small to be conclusive (Barbalias 1997).
Medium‐/long‐term incontinence rate
A total of 379 women studied after 12 months also showed no statistically significant difference in incontinence rates (RR 0.89, 95% CI 0.72 to 1.10) (Analysis 10.3). However, results once more reported improvement after one year in favour of the traditional autologous sling material rectus fascia (RR 0.33, 95% CI 0.17 to 0.64) (Analysis 10.4).
Long‐term incontinence rate
Only one trial reported the incontinence rate after five years (Lucas 2000), and showed no statistically significant difference between different lengths of the autologous material used (RR 1.17, 95% CI 0.86 to 1.59) (Analysis 10.5).
10.2 Quantification of symptoms (outcome 10.6)
Only one trial (Lucas 2000) reported data on mean weight of urine on a pad test (RR 3.10, 95% CI ‐7.30 to 13.50) (Analysis 10.6): this result was not statistically significant.
10.3 Clinician's observations
Number of women with incontinence, as assessed by the clinician, was not reported in any of the trials.
10.4 Surgical outcome measures (outcome 10.7)
The duration of operation for the traditional, long length sling procedure was significantly longer (MD 8.00, 95% CI 3.32 to 12.68) (Analysis 10.7), in one trial (Lucas 2000), which compared long and short lengths of autologous fascia. Length of hospital stay was not reported in any trial.
10.5 Adverse events (outcomes 10.8 to 10.13)
There was significant heterogeneity in the incidence of adverse effects (perioperative complications) between groups in two trials, which was attributed to more complications with the use of synthetic non‐absorbable Gore‐Tex in one trial (RR 0.05, 95% CI 0.00 to 0.80) (Analysis 10.8.3; Barbalias 1997); in the other trial there was no statistically significant difference between two biological slings (RR 1.14, 95% CI 0.78 to 1.66) (Analysis 10.8.1; Lucas 2000).
No statistically significant difference was found in assessment of the following adverse events, reported in only one trial (Lucas 2000):
-
bladder perforation (RR 0.69, 95% CI 0.12 to 4.03) (Analysis 10.9);
-
urinary tract infection (RR 1.73, 95% CI 0.66 to 4.54) (Analysis 10.10);
-
de novo detrusor urgency or urge symptoms (RR 3.11, 95% CI 0.65 to 14.97) (Analysis 10.11);
-
voiding dysfunction (RR 1.16, 95% CI 0.65 to 2.07) (Analysis 10.12).
Two trials reported de novo detrusor overactivity (Barbalias 1997; Shin 2001), once more showing no statistically significant difference between the groups (Analysis 10.13).
10.6 Quality of life
Data were reported in different ways, thus meta‐analysis was not possible.
-
Lucas 2000 showed significant improvement in the average scores for both the UDI‐6, reported P value = 0.007, and the IIQ‐7, P = 0.002 when compared with baseline. The scores between groups were similar.
-
Pacetta 2005 evaluated participants using Incontinence Quality of Life (I‐QOL), reporting an improvement from 45 at baseline to 97 at one year in the autologous fascia group and from 39 to 92 for the FortaPerm group.
Discussion
To supplement the main systematic review of effects, we sought to identify economic evaluations that have compared traditional suburethral sling operations with any of the other main categories of surgical methods listed in the background section. A supplementary search in Ovid NHS EED, MEDLINE and Embase identified two such economic evaluations. Details of the search strategies are given in Appendix 2.
Summary of main results
Traditional suburethral sling operation versus no treatment or sham operation
To date, there still remains no RCT comparing traditional sling procedures with laparoscopic procedures for stress urinary incontinence. No related economic evidence was identified for the brief economic commentary.
Traditional suburethral sling operation versus conservative management (e.g. pelvic floor muscle training, electrical stimulation, cones, biofeedback)
We did not find trials comparing suburethral slings with conservative management such as pelvic exercises or vaginal cones, or with some other surgical operations (anterior repair, laparoscopic retropubic suspension, injections or artificial sphincters). No related economic evidence was identified for the brief economic commentary.
Traditional suburethral sling operation versus drugs
One trial compared surgery (Burch or traditional sling procedure) with oxybutynin drug therapy for women with mixed incontinence symptoms (Osman 2003). Oxybutinin is an anticholinergic drug which is usually used to treat urgency urinary incontinence and not stress urinary incontinence. The trial showed significantly better results in the group managed surgically with a traditional sling procedure to treat mixed urinary incontinence than oxybutynin, with a cure rate of 83% for stress urinary incontinence and 88% for urgency incontinence in comparison to 0% and 57%, respectively (Analysis 3.1; Analysis 3.2).
However, post‐operative morbidity was not reported well and the results of a single, medium‐sized trial in determining the effects in either group should be considered cautiously and requires replication.
No related economic evidence was identified for the brief economic commentary.
Traditional suburethral sling versus injectable
Only one small trial assessed this comparison (Maher 2005), showing a clear difference in clinician‐assessed incontinence rate at six months favouring pubovaginal sling (19%; 4/21) versus transurethral Macroplastique (91%; 20/22). Incontinence rate was taken as those women not 'cured'. Cure was defined as no urinary leakage due to stress urinary incontinence on repeat urodynamics.
Advantages to injection therapy were lower morbidity rates: there were equivalent incontinence and participant‐satisfaction rates at six months' follow‐up between groups. At five years 69% (9/13) of women were satisfied with sling surgery versus 29% (4/14) of those who received Macroplastique. There was, however, only a 60% long‐term follow‐up rate in this study, therefore this result must be interpreted with caution.
In a comparative cost analysis of a retrospective observational study conducted by Berman 1997 in the USA, traditional suburethral retropubic sling procedures were compared with transurethral collagen injections in women with SUI. Women were followed up for 15 months post surgery and 71% of the traditional sling arm were symptom free compared with 27% in the collagen injection arm (P = 0.05). The average cost per woman treated with the traditional sling procedure was USD 10,382 (1995 USD), while the collagen injection was USD 4996 (1995 USD) (P < 0.001). Although the cost of the traditional sling is double that of the collagen injection, the study authors argued that traditional suburethral retropubic sling procedure is more cost‐effective than collagen injection due to its higher effectiveness.
Traditional suburethral sling versus open abdominal retropubic colposuspension
The inclusion of the large trial on traditional slings (Albo 2007) strengthened the trend towards a better performance of the traditional slings in terms of participant‐reported incontinence rates, but higher post‐operative voiding dysfunction rates compared to open colposuspension.
The limited data available suggest that the overall rates of peri‐operative and late surgical complications are similar after sling and colposuspension operations. However, the pattern of complications varies.
A cost‐effectiveness analysis (Kilonzo 2004) compared minimally invasive slings with open abdominal retropubic colposuspension, laparoscopic colposuspension, traditional suburethral retropubic sling procedure, and injectables. The data utilised in this study were based on a Technology Assessment Review conducted for the National Institute for Clinical Excellence (NICE), UK (Cody 2003). The study utilised clinical data from a systematic review of RCTs conducted up to mid‐2003 (Lapitan 2003; Moehrer 2002; Ward 2002b) and results based upon economic modelling for a time horizon of up to 10 years. The analysis of costs and resources used was based on the UK payer’s perspective (UK National Health Service). Based on clinical evidence, this study assumed that traditional sling effectiveness was equivalent to open abdominal retropubic colposuspension. The cost of open colposuspension was reported as GBP 1301 per woman (2001) with an operation time of 52.4 minutes and average hospital stay of 7.1 days, while traditional slings cost GBP 1340 per woman (2001 GBP) with an operation time of 45.6 minutes and average hospital stay of 7.2 days.
Traditional suburethral sling versus bladder neck needle suspension (abdominal and vaginal)
The one small trial that compared needle operations with slings included an atypical population who were unsuitable for colposuspension (Hilton 1989). The procedures were restricted to women with vaginal narrowing deemed unsuitable for open abdominal retropubic colposuspension. There were too few women to provide reliable data about cure rates. Although the sling operations were associated with more post‐operative morbidity, the results could not be generalised to the whole population having surgery because of the atypical nature of the women involved in the trial, such that complications may have been caused by surgical difficulties due to vaginal narrowing. However, the group managed by needle suspensions did not seem to have the same complications.
No related economic evidence was identified for the brief economic commentary.
Traditional suburethral sling operation versus anterior repair.
To date, there still remains no RCTs comparing traditional sling procedures with anterior repair for stress urinary incontinence.
No related economic evidence was identified for the brief economic commentary.
Traditional suburethral sling operation versus laparoscopic procedures
To date, there still remains no RCT comparing traditional sling procedures with laparoscopic procedures for stress urinary incontinence.
For the economic evidence, Kilonzo 2004 also assumed that the effectiveness of laparoscopic colposuspension was equivalent or possibly worse than open colposuspension, while the effectiveness of open colposuspension was equivalent to traditional sling. The study reported the cost of laparoscopic colposuspension to be GBP 1317 (2001 GBP) with an operation time of 60 minutes and an average hospital stay of 4.6 days, compared with traditional sling, which costs GBP 1340 (2001 GBP) with an operation time of 45.6 minutes and average hospital stay of 7.2 days.
Traditional suburethral sling operation versus a minimally invasive sling
Historically, traditional suburethral sling procedures were used for women who had recurrent stress incontinence (after a previous failed continence operation). However, the current review includes women with new or recurrent incontinence, without reporting the results separately. They were designed to restore normal urethrovesical junction support by mechanically compressing or kinking the proximal urethra.
Minimally invasive synthetic suburethral sling operations appeared to be as effective as traditional suburethral slings in the short term (RR 0.97, 95% CI 0.78 to 1.20), although the confidence interval was compatible with minimally invasive slings, being 20% better or 12% worse. The operating time and length of stay were also significantly shorter with minimally invasive synthetic suburethral sling operations, and women had fewer perioperative complications and less detrusor overactivity. The main perioperative complication of minimally invasive sling procedures was bladder perforation, although this did not appear to have longer‐term implications. However, because the information was not available, it was not possible to determine if either type of sling was more effective in women who had had previous failed continence surgery.
. More data on the advantages and disadvantages of the different types of biological and synthetic sling materials would be useful to aid decision making. Materials may vary in the degree of discomfort or erosion they cause.
Kilonzo 2004 also reported on this comparison. The study reported the cost in 2001 in GBP to be GBP 1058 (2001 GBP) per woman with an average of 2.9 days hospital stay and 30 minutes operation time for minimally invasive slings, compared with traditional slings, which cost GBP 1340 (2001 GBP) per woman, with an average hospital stay of 7.2 days and operation of time of 45.6 minutes. There was an 86% probability that minimally invasive sling was cost‐effective compared to open colposuspension, with a willingness‐to‐pay of GBP 30,000 (2001 GBP). Minimally invasive sling was found to be slightly less effective than open colposuspension in terms of Quality Adjusted Life Years (QALYs) for the first four years. Beyond five years, minimally invasive sling was more effective. The study concluded that minimally invasive slings were likely to be more cost‐effective than open colposuspensions. Based on the assumption in Kilonzo 2004 that the effectiveness of traditional sling was taken to be equivalent to open colposuspension, therefore the cost‐effectiveness results for the comparison of minimally invasive slings with traditional slings would be similar to the cost‐effectiveness of minimally invasive slings versus open colposuspension.
One type of traditional sling operation versus another traditional sling operation
Some synthetic slings may have a higher incidence of erosion, infections and urge symptoms. There was some evidence that these were more common after Gore‐Tex.
Meta‐analysis showed a significantly greater improvement of symptoms (participant‐reported) both within and after one year, using autologous materials. There was no evidence of a difference in peri‐operative complications or post‐operative morbidity between autologous and other materials. Trials, however, were few in number, with short follow‐up and small populations.
More evidence is needed to compare slings made of autologous materials (e.g. rectus fascia, vaginal wall) with synthetic or exogenous biological materials (e.g. Teflon, polytetrafluoroethylene, porcine dermis, dura mater). Some materials may be inappropriate in particular groups of women, such as those with religious beliefs which preclude the use of animal tissues.
No related economic evidence was identified for the brief economic commentary.
Overall completeness and applicability of evidence
Evidence relating to primary outcome was available, but limited in determining the effectiveness of traditional suburethral sling operations in the treatment of urinary incontinence. The limited evidence suggests that traditional slings may be equally as effective as other surgical treatments currently available, but variability in the quality of trials is a major limiting factor.
None of the trials reviewed contained all relevant participant‐reported outcomes. More data on pain after different procedures (both post‐operative and long term) and time to return to 'normal' daily living following surgery would have been useful.
The review may not be applicable to clinicians everywhere. High‐income countries are increasingly using minimally invasive procedures and synthetic materials as the first‐line treatment for stress urinary incontinence. The use of traditional suburethral operations, which appear to be just as effective, might be reserved for countries where new technology is not available or too expensive.
Where possible, we analysed data in subgroups according to clinical characteristics of the type of incontinence (urodynamic stress incontinence, stress incontinence symptoms or mixed urinary incontinence). Further analysis according to clinical characteristics of women such as: primary versus recurrent SUI, intrinsic urethral sphincter deficiency versus urethral hypermobility, obesity, ethnicity, vaginal delivery versus caesarean‐section, presence or absence of prolapse, anaesthesia used, or experience of the surgeon might make the findings of the review more generalisable. The majority of trials, however, did not report these characteristics.
.Quality of life, emotional well‐being, and social implications were poorly reported, or reported using a variety of instruments, thus precluding meta‐analysis. These outcomes are of great importance to women and decision makers.
For the economic evidence, we did not subject the two identified economic evaluations to critical appraisal and we do not attempt to draw any firm or general conclusions regarding the relative costs or efficiency of traditional suburethral retropubic slings in treatment of stress urinary incontinence. However, based on the economic evidence available, it can be suggested that traditional suburethral retropubic sling procedure is cost‐effective compared to collagen injection but not cost‐effective when compared with minimally invasive slings.
Quality of the evidence
In general, the scientific quality of the trials was low or moderate. Although the trial authors stated that their trials were randomised, most of the reports did not give sufficient detail about the method of sequence generation or concealment of allocation. Only two trials used an adequate randomisation method. Blinding surgeons or women was generally not possible, but none reported external, third‐party, blinded assessment at follow‐up. The total number of women enrolled was 2284, but some trials only recruited 10 women per arm. In addition, several types of slings were compared with different interventions, meaning that different materials had to be grouped together for comparisons. This meant that the numbers in each comparison were small and the confidence intervals wide.
The populations varied, including women with and without previous surgery, and one study included only women who were deemed not suitable for another procedure (Hilton 1989). Although the majority had urodynamic stress incontinence, some trials included women with mixed urinary incontinence. Baseline comparability of the groups was not reported in all trials. Several trials assessed different types of sling in comparison with autologous rectus fascia, suggesting that the latter was considered as the 'standard' comparator. Although seven trials used open abdominal retropubic colposuspension as the comparator, each used a different type of sling, and three followed up the women for only six months. Rather more trials used a minimally invasive sling as the comparator, as this has arguably become the gold standard procedure for continence surgery, at least in high‐income countries.
In general, most trials reported different outcome measures, often poorly. The principal measure of effectiveness used in most studies was the proportion of women with incontinence following surgery. Few researchers have considered other outcomes, such as activities of daily living and quality of life. Few addressed general health status, repeat incontinence surgery, later prolapse surgery and time to return to normal activity level. Satisfaction with, and acceptability of, the treatment were also seldom addressed but are also important factors in choice of management.

Comparison 3 Sling versus drugs, Outcome 1 Number with incontinence (worse, unchanged or improved) within the first year (women's observations).

Comparison 3 Sling versus drugs, Outcome 2 Urge symptoms or urge incontinence.
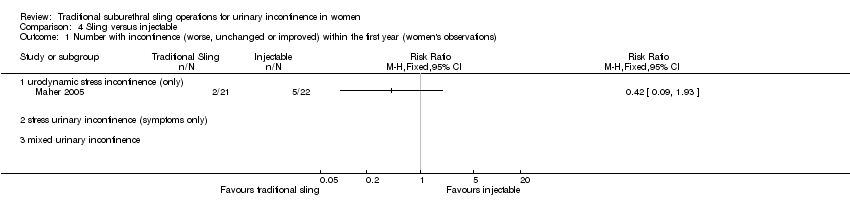
Comparison 4 Sling versus injectable, Outcome 1 Number with incontinence (worse, unchanged or improved) within the first year (women's observations).

Comparison 4 Sling versus injectable, Outcome 2 Number with incontinence (worse, unchanged or improved) after first year (women's observations).

Comparison 4 Sling versus injectable, Outcome 3 Number with incontinence (clinician's observations) within first year.

Comparison 4 Sling versus injectable, Outcome 4 Voiding dysfunction.

Comparison 4 Sling versus injectable, Outcome 5 De novo detrusor overactivity (urodynamic diagnosis).
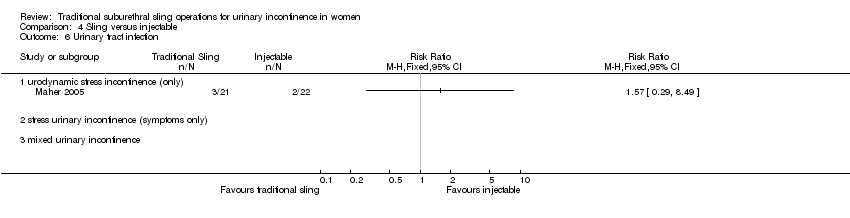
Comparison 4 Sling versus injectable, Outcome 6 Urinary tract infection.

Comparison 5 Sling versus open abdominal retropubic suspension, Outcome 1 Number with incontinence (worse, unchanged or improved) within the first year (women's observations).

Comparison 5 Sling versus open abdominal retropubic suspension, Outcome 3 Number with incontinence (worse, unchanged or improved) after first year (women's observations).

Comparison 5 Sling versus open abdominal retropubic suspension, Outcome 9 Number with incontinence (clinician's observations) after first year.

Comparison 5 Sling versus open abdominal retropubic suspension, Outcome 10 Operative time (minutes).

Comparison 5 Sling versus open abdominal retropubic suspension, Outcome 11 Time to catheter removal (days).

Comparison 5 Sling versus open abdominal retropubic suspension, Outcome 12 Length of inpatient stay (days).
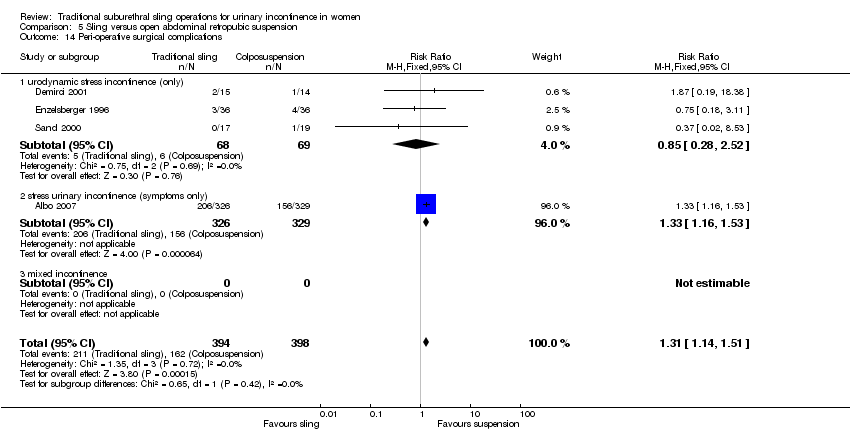
Comparison 5 Sling versus open abdominal retropubic suspension, Outcome 14 Peri‐operative surgical complications.

Comparison 5 Sling versus open abdominal retropubic suspension, Outcome 15 Bladder perforation.

Comparison 5 Sling versus open abdominal retropubic suspension, Outcome 16 Urinary tract infection.
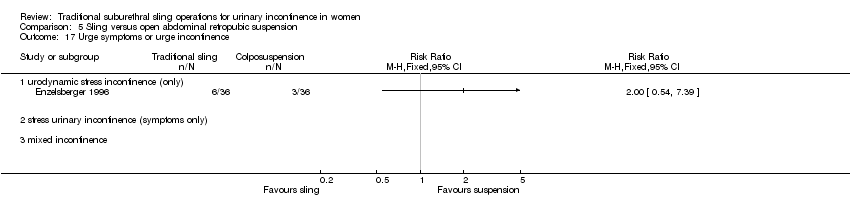
Comparison 5 Sling versus open abdominal retropubic suspension, Outcome 17 Urge symptoms or urge incontinence.

Comparison 5 Sling versus open abdominal retropubic suspension, Outcome 18 Detrusor overactivity (urodynamic diagnosis).

Comparison 5 Sling versus open abdominal retropubic suspension, Outcome 19 Voiding dysfunction after three months.

Comparison 5 Sling versus open abdominal retropubic suspension, Outcome 20 Prolapse.
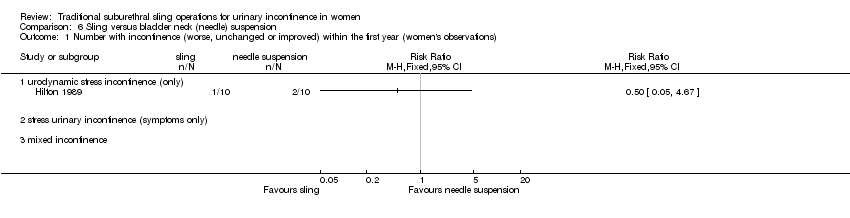
Comparison 6 Sling versus bladder neck (needle) suspension, Outcome 1 Number with incontinence (worse, unchanged or improved) within the first year (women's observations).

Comparison 6 Sling versus bladder neck (needle) suspension, Outcome 2 Number with incontinence (worse, unchanged or improved) after the first year (women's observations).
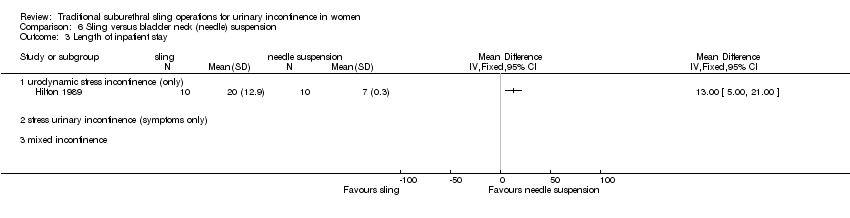
Comparison 6 Sling versus bladder neck (needle) suspension, Outcome 3 Length of inpatient stay.

Comparison 6 Sling versus bladder neck (needle) suspension, Outcome 4 Peri‐operative surgical complications.

Comparison 6 Sling versus bladder neck (needle) suspension, Outcome 5 Urge symptoms or urge incontinence.

Comparison 6 Sling versus bladder neck (needle) suspension, Outcome 6 Voiding dysfunction after three months.
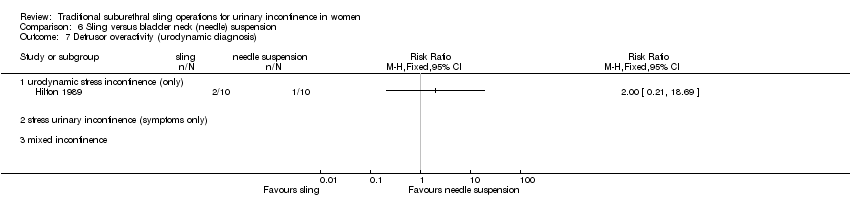
Comparison 6 Sling versus bladder neck (needle) suspension, Outcome 7 Detrusor overactivity (urodynamic diagnosis).
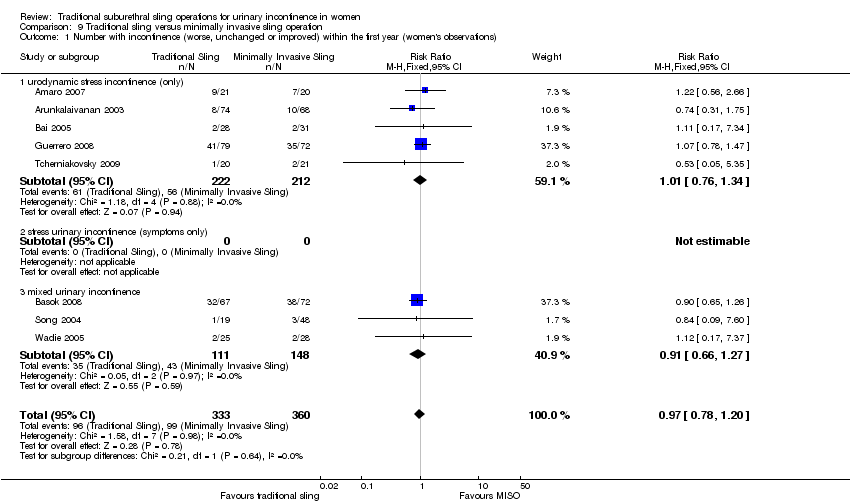
Comparison 9 Traditional sling versus minimally invasive sling operation, Outcome 1 Number with incontinence (worse, unchanged or improved) within the first year (women's observations).
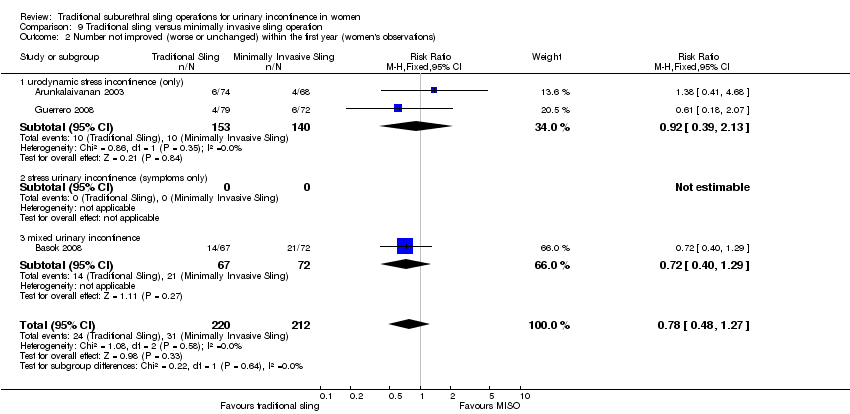
Comparison 9 Traditional sling versus minimally invasive sling operation, Outcome 2 Number not improved (worse or unchanged) within the first year (women's observations).
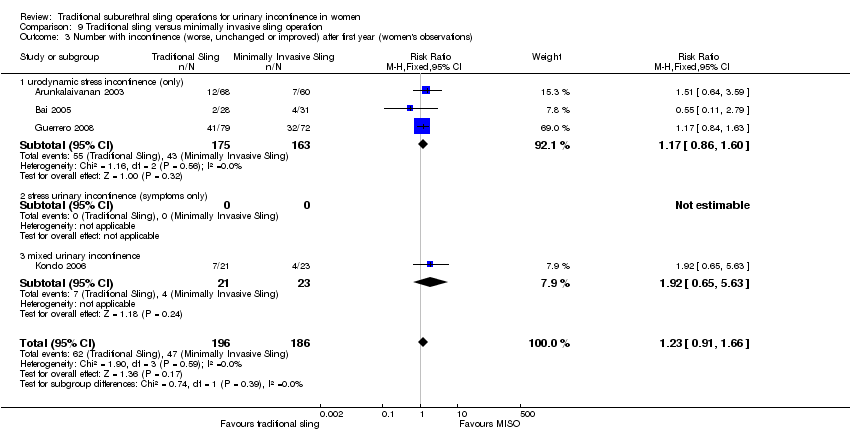
Comparison 9 Traditional sling versus minimally invasive sling operation, Outcome 3 Number with incontinence (worse, unchanged or improved) after first year (women's observations).

Comparison 9 Traditional sling versus minimally invasive sling operation, Outcome 4 Number not improved (worse or unchanged) after the first year (women's observations).
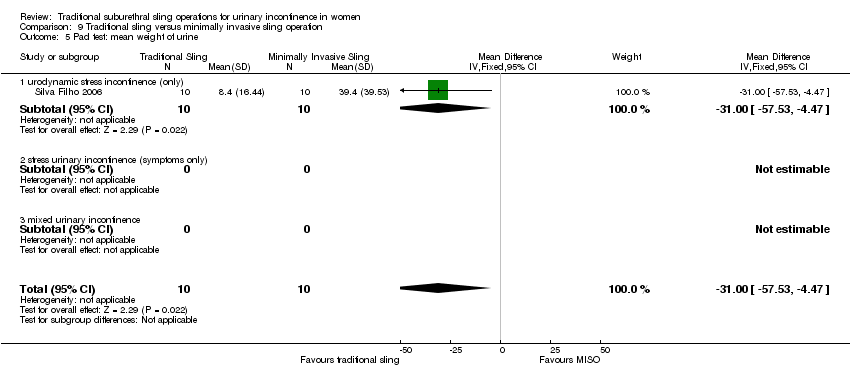
Comparison 9 Traditional sling versus minimally invasive sling operation, Outcome 5 Pad test: mean weight of urine.

Comparison 9 Traditional sling versus minimally invasive sling operation, Outcome 6 Number with incontinence (clinician's observations) within first year.

Comparison 9 Traditional sling versus minimally invasive sling operation, Outcome 7 Number with incontinence (clinician's observations) after first year.

Comparison 9 Traditional sling versus minimally invasive sling operation, Outcome 8 Operative time (mins).
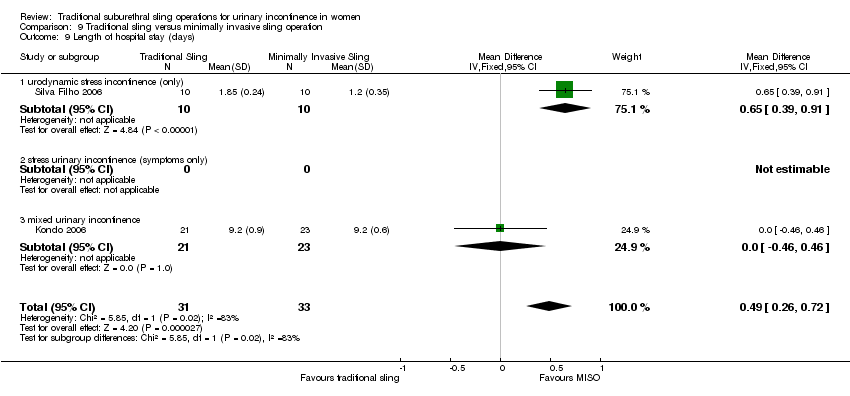
Comparison 9 Traditional sling versus minimally invasive sling operation, Outcome 9 Length of hospital stay (days).

Comparison 9 Traditional sling versus minimally invasive sling operation, Outcome 10 Time to catheter removal (days).

Comparison 9 Traditional sling versus minimally invasive sling operation, Outcome 11 Peri operative surgical complications.
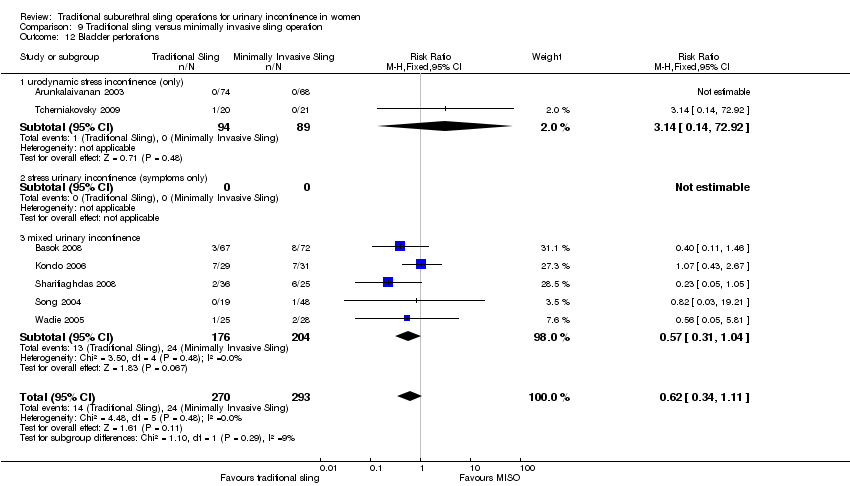
Comparison 9 Traditional sling versus minimally invasive sling operation, Outcome 12 Bladder perforations.

Comparison 9 Traditional sling versus minimally invasive sling operation, Outcome 13 Urethral injury.

Comparison 9 Traditional sling versus minimally invasive sling operation, Outcome 14 De novo detrusor urgency or urge symptoms.
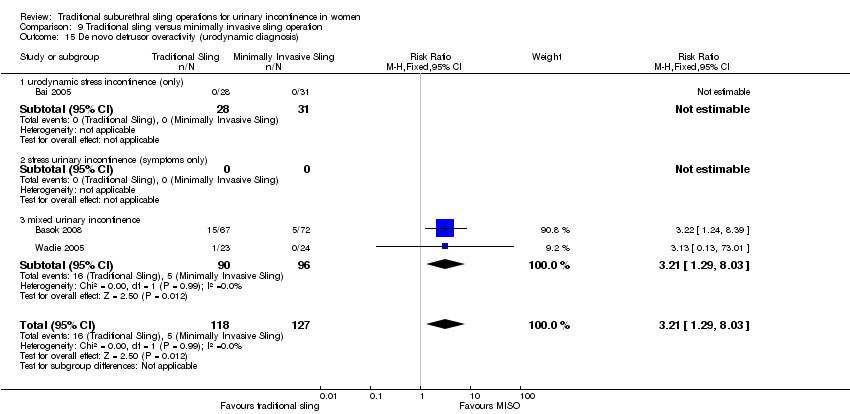
Comparison 9 Traditional sling versus minimally invasive sling operation, Outcome 15 De novo detrusor overactivity (urodynamic diagnosis).

Comparison 9 Traditional sling versus minimally invasive sling operation, Outcome 16 Voiding dysfunction.
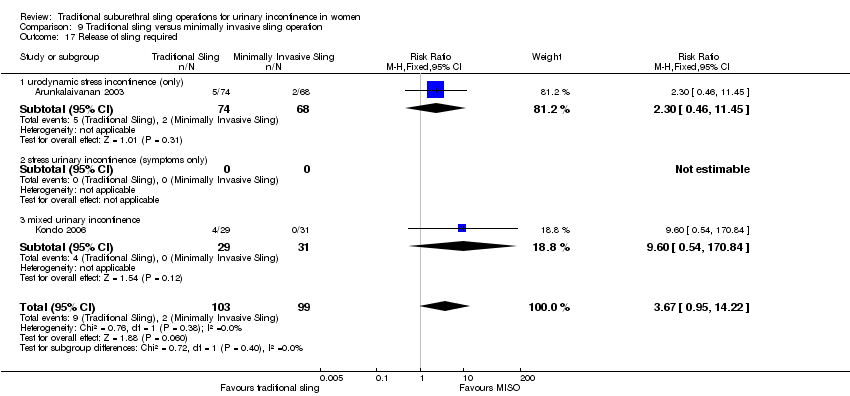
Comparison 9 Traditional sling versus minimally invasive sling operation, Outcome 17 Release of sling required.

Comparison 9 Traditional sling versus minimally invasive sling operation, Outcome 18 Retention up to 6 weeks.

Comparison 9 Traditional sling versus minimally invasive sling operation, Outcome 19 Vaginal erosion.
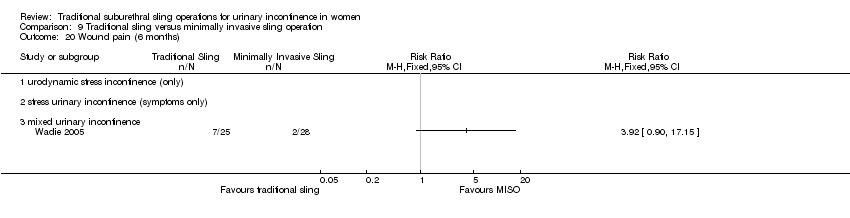
Comparison 9 Traditional sling versus minimally invasive sling operation, Outcome 20 Wound pain (6 months).

Comparison 10 One type of traditional sling versus another, Outcome 1 Number with incontinence (worse, unchanged or improved) within the first year (women's observations).

Comparison 10 One type of traditional sling versus another, Outcome 2 Number not improved (worse or unchanged) within the first year (women's observations).
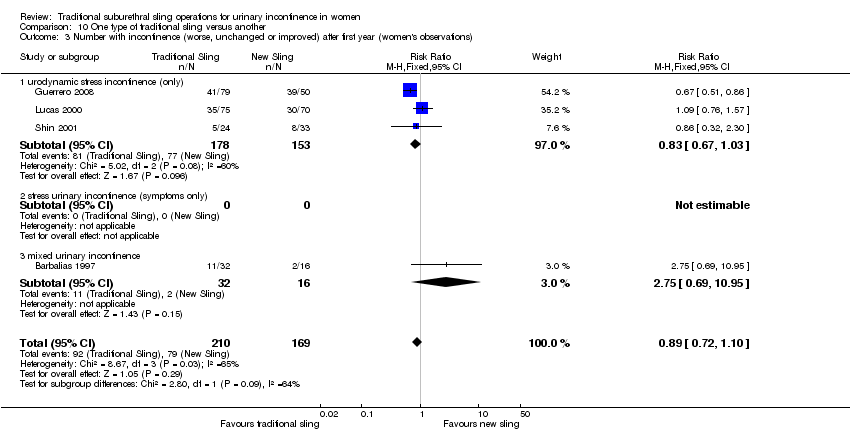
Comparison 10 One type of traditional sling versus another, Outcome 3 Number with incontinence (worse, unchanged or improved) after first year (women's observations).

Comparison 10 One type of traditional sling versus another, Outcome 4 Number not improved (worse or unchanged) after the first year (women's observations).

Comparison 10 One type of traditional sling versus another, Outcome 5 Number with incontinence (worse, unchanged or improved) after five years (women's observations).

Comparison 10 One type of traditional sling versus another, Outcome 6 Pad test: mean weight of urine.

Comparison 10 One type of traditional sling versus another, Outcome 7 Operative time (mins).

Comparison 10 One type of traditional sling versus another, Outcome 8 Peri operative surgical complications.

Comparison 10 One type of traditional sling versus another, Outcome 9 Bladder perforation.

Comparison 10 One type of traditional sling versus another, Outcome 10 Urinary tract infection.
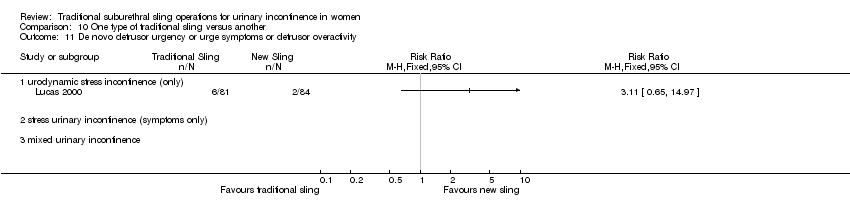
Comparison 10 One type of traditional sling versus another, Outcome 11 De novo detrusor urgency or urge symptoms or detrusor overactivity.

Comparison 10 One type of traditional sling versus another, Outcome 12 Voiding dysfunction.

Comparison 10 One type of traditional sling versus another, Outcome 13 De novo detrusor overactivity (urodynamic diagnosis).
| Traditional suburethral slings compared to injectable treatment for stress urinary incontinence | ||||||
| Patient or population: women with stress urinary incontinence | ||||||
| Outcomes | Illustrative comparative risks* (95% CI) | Relative effect | No of participants | Quality of the evidence | Comments | |
| Assumed risk | Corresponding risk | |||||
| Injectable treatment | Traditional suburethral slings | |||||
| 4.1 Number with incontinence (worse, unchanged or improved) within the first year (women's observations) | 227 per 10001 | 95 per 1000 | RR 0.42 | 43 | ⊕⊝⊝⊝ | Single trial with few participants |
| 4.2 Number with incontinence (worse, unchanged or improved) after first year (women's observations) | 286 per 10001 | 34 per 1000 | RR 0.12 | 27 | ⊕⊕⊝⊝ | Single trial with few participants |
| 4.4 Voiding dysfunction | 45 per 10001 | 189 per 1000 | RR 4.19 | 43 | ⊕⊕⊝⊝ | Single trial with few participants |
| *The basis for the assumed risk (e.g. the median control group risk across studies) is provided in footnotes. The corresponding risk (and its 95% confidence interval) is based on the assumed risk in the comparison group and the relative effect of the intervention (and its 95% CI). | ||||||
| GRADE Working Group grades of evidence | ||||||
| 1Illustrative comparative risks were based upon the mean risk on control intervention in the studies included in the meta‐analysis. | ||||||
| Traditional suburethral sling operation compared to open abdominal retropubic suspension for stress urinary incontinence | ||||||
| Patient or population: women with stress urinary incontinence | ||||||
| Outcomes | Illustrative comparative risks* (95% CI) | Relative effect | No of participants | Quality of the evidence | Comments | |
| Assumed risk | Corresponding risk | |||||
| Open abdominal retropubic suspension | Traditional suburethral sling operation | |||||
| 5.1 Number with incontinence (worse, unchanged or improved) within the first year (women's observations) | 92 per 10001 | 37 per 1000 | RR 0.4 | 147 | ⊕⊕⊝⊝ | Fischer trial did not account for incomplete outcome data |
| 5.3 Number with incontinence (worse, unchanged or improved) after first year (women's observations) | 399 per 10001 | 299 per 1000 | RR 0.75 | 715 | ⊕⊕⊕⊝ | Demirci did not account for incomplete outcome data |
| 5.14 Peri‐operative surgical complications | 407 per 10001 | 533 per 1000 | RR 1.31 | 792 | ⊕⊕⊕⊝ | |
| 5.15 Bladder perforation | 30 per 10001 | 0 per 1000 | RR 0 | 655 | ⊕⊕⊕⊝ | Single study thus no pooled data available |
| 5.18 Voiding dysfunction after three months | 21 per 10001 | 128 per 1000 | RR 6.08 | 853 | ⊕⊕⊕⊝ | |
| 5.21 Repeat incontinence surgery ‐ not reported | See comment | See comment | Not estimable | ‐ | See comment | No data |
| *The basis for the assumed risk (e.g. the median control group risk across studies) is provided in footnotes. The corresponding risk (and its 95% confidence interval) is based on the assumed risk in the comparison group and the relative effect of the intervention (and its 95% CI). | ||||||
| GRADE Working Group grades of evidence | ||||||
| 1Illustrative comparative risks were based upon the mean risk on control intervention in the studies included in the meta‐analysis. | ||||||
| Traditional suburethral sling operation compared to bladder neck (needle) suspension for stress urinary incontinence | ||||||
| Patient or population: women with stress urinary incontinence | ||||||
| Outcomes | Illustrative comparative risks* (95% CI) | Relative effect | No of participants | Quality of the evidence | Comments | |
| Assumed risk | Corresponding risk | |||||
| Bladder neck (needle) suspension | Traditional suburethral sling operation | |||||
| 6.1 Number with incontinence (worse, unchanged or improved) within the first year (women's observations) | 200 per 10001 | 100 per 1000 | RR 0.5 | 20 | ⊕⊝⊝⊝ | |
| 6.2 Number with incontinence (worse, unchanged or improved) after the first year (women's observations) | 300 per 10001 | 99 per 1000 | RR 0.33 | 20 | ⊕⊝⊝⊝ | |
| 6.4 Peri‐operative surgical complications | 200 per 10001 | 900 per 1000 | RR 4.5 | 20 | ⊕⊕⊝⊝ | |
| 6.6 Voiding dysfunction after three months ‐ urodynamic stress incontinence (only) | 200 per 10001 | 400 per 1000 | RR 2 | 20 | ⊕⊝⊝⊝ | |
| *The basis for the assumed risk (e.g. the median control group risk across studies) is provided in footnotes. The corresponding risk (and its 95% confidence interval) is based on the assumed risk in the comparison group and the relative effect of the intervention (and its 95% CI). | ||||||
| GRADE Working Group grades of evidence | ||||||
| 1Illustrative comparative risks were based upon the mean risk on control intervention in the studies included in the meta‐analysis. | ||||||
| Traditional suburethral sling operation compared to minimally invasive synthetic slings for stress urinary incontinence | ||||||
| Patient or population: women with stress urinary incontinence | ||||||
| Outcomes | Illustrative comparative risks* (95% CI) | Relative effect | No of participants | Quality of the evidence | Comments | |
| Assumed risk | Corresponding risk | |||||
| Minimally invasive slings | Traditional suburethral sling operation | |||||
| 9.1 Number with incontinence (worse, unchanged or improved) within the first year (women's observations) | 275 per 10001 | 267 per 1000 | RR 0.97 | 693 | ⊕⊕⊕⊕ | |
| 9.3 Number with incontinence (worse, unchanged or improved) after first year (women's observations) | 253 per 10001 | 311 per 1000 | RR 1.23 | 382 | ⊕⊕⊝⊝ | |
| 9.11 Peri‐operative surgical complications | 208 per 10001 | 331 per 1000 | RR 1.59 | 243 | ⊕⊕⊝⊝ | |
| 9.12 Bladder perforations | 82 per 10001 | 51 per 1000 | RR 0.62 | 563 | ⊕⊕⊕⊝ | |
| 9.16 Voiding dysfunction | 98 per 10001 | 157 per 1000 | RR 1.6 | 375 | ⊕⊕⊕⊝ | |
| *The basis for the assumed risk (e.g. the median control group risk across studies) is provided in footnotes. The corresponding risk (and its 95% confidence interval) is based on the assumed risk in the comparison group and the relative effect of the intervention (and its 95% CI). | ||||||
| GRADE Working Group grades of evidence | ||||||
| 1Illustrative comparative risks were based upon the mean risk on control intervention in the studies included in the meta‐analysis. | ||||||
| Traditional suburethral sling operation compared to another traditional suburethral sling for stress urinary incontinence | ||||||
| Patient or population: women with stress urinary incontinence | ||||||
| Outcomes | Illustrative comparative risks* (95% CI) | Relative effect | No of participants | Quality of the evidence | Comments | |
| Assumed risk | Corresponding risk | |||||
| Another traditional suburethral sling | Traditional suburethral sling operation | |||||
| 10.1 Number with incontinence (worse, unchanged or improved) within the first year (women's observations) | 336 per 10001 | 299 per 1000 | RR 0.89 | 307 | ⊕⊕⊕⊝ | |
| 10.3 Number with incontinence (worse, unchanged or improved) after first year (women's observations) | 467 per 10001 | 416 per 1000 | RR 0.89 | 379 | ⊕⊕⊕⊝ | |
| 10.8 Peri‐operative surgical complications | 360 per 10001 | 335 per 1000 | RR 0.93 | 213 | ⊕⊕⊝⊝ | |
| 10.12 Voiding dysfunction | 202 per 10001 | 234 per 1000 | RR 1.16 | 165 | ⊕⊕⊕⊝ | |
| *The basis for the assumed risk (e.g. the median control group risk across studies) is provided in footnotes. The corresponding risk (and its 95% confidence interval) is based on the assumed risk in the comparison group and the relative effect of the intervention (and its 95% CI). | ||||||
| GRADE Working Group grades of evidence | ||||||
| 1Illustrative comparative risks were based upon the mean risk on control intervention in the studies included in the meta‐analysis. | ||||||
| Outcome or subgroup title | No. of studies | No. of participants | Statistical method | Effect size |
| 1 Number with incontinence (worse, unchanged or improved) within the first year (women's observations) Show forest plot | 1 | Risk Ratio (M‐H, Fixed, 95% CI) | Totals not selected | |
| 1.1 urodynamic stress incontinence (only) | 0 | Risk Ratio (M‐H, Fixed, 95% CI) | 0.0 [0.0, 0.0] | |
| 1.2 stress urinary incontinence (symptoms only) | 0 | Risk Ratio (M‐H, Fixed, 95% CI) | 0.0 [0.0, 0.0] | |
| 1.3 mixed incontinence | 1 | Risk Ratio (M‐H, Fixed, 95% CI) | 0.0 [0.0, 0.0] | |
| 2 Urge symptoms or urge incontinence Show forest plot | 1 | Risk Ratio (M‐H, Fixed, 95% CI) | Totals not selected | |
| 2.1 urodynamic stress incontinence (only) | 0 | Risk Ratio (M‐H, Fixed, 95% CI) | 0.0 [0.0, 0.0] | |
| 2.2 stress urinary incontinence (symptoms only) | 0 | Risk Ratio (M‐H, Fixed, 95% CI) | 0.0 [0.0, 0.0] | |
| 2.3 mixed incontinence | 1 | Risk Ratio (M‐H, Fixed, 95% CI) | 0.0 [0.0, 0.0] | |
| Outcome or subgroup title | No. of studies | No. of participants | Statistical method | Effect size |
| 1 Number with incontinence (worse, unchanged or improved) within the first year (women's observations) Show forest plot | 1 | Risk Ratio (M‐H, Fixed, 95% CI) | Totals not selected | |
| 1.1 urodynamic stress incontinence (only) | 1 | Risk Ratio (M‐H, Fixed, 95% CI) | 0.0 [0.0, 0.0] | |
| 1.2 stress urinary incontinence (symptoms only) | 0 | Risk Ratio (M‐H, Fixed, 95% CI) | 0.0 [0.0, 0.0] | |
| 1.3 mixed urinary incontinence | 0 | Risk Ratio (M‐H, Fixed, 95% CI) | 0.0 [0.0, 0.0] | |
| 2 Number with incontinence (worse, unchanged or improved) after first year (women's observations) Show forest plot | 1 | Risk Ratio (M‐H, Fixed, 95% CI) | Totals not selected | |
| 2.1 urodynamic stress incontinence (only) | 1 | Risk Ratio (M‐H, Fixed, 95% CI) | 0.0 [0.0, 0.0] | |
| 2.2 stress urinary incontinence (symptoms only) | 0 | Risk Ratio (M‐H, Fixed, 95% CI) | 0.0 [0.0, 0.0] | |
| 2.3 mixed urinary incontinence | 0 | Risk Ratio (M‐H, Fixed, 95% CI) | 0.0 [0.0, 0.0] | |
| 3 Number with incontinence (clinician's observations) within first year Show forest plot | 1 | Risk Ratio (M‐H, Fixed, 95% CI) | Totals not selected | |
| 3.1 urodynamic stress incontinence (only) | 1 | Risk Ratio (M‐H, Fixed, 95% CI) | 0.0 [0.0, 0.0] | |
| 3.2 stress urinary incontinence (symptoms only) | 0 | Risk Ratio (M‐H, Fixed, 95% CI) | 0.0 [0.0, 0.0] | |
| 3.3 mixed urinary incontinence | 0 | Risk Ratio (M‐H, Fixed, 95% CI) | 0.0 [0.0, 0.0] | |
| 4 Voiding dysfunction Show forest plot | 1 | Risk Ratio (M‐H, Fixed, 95% CI) | Totals not selected | |
| 4.1 urodynamic stress incontinence (only) | 1 | Risk Ratio (M‐H, Fixed, 95% CI) | 0.0 [0.0, 0.0] | |
| 4.2 stress urinary incontinence (symptoms only) | 0 | Risk Ratio (M‐H, Fixed, 95% CI) | 0.0 [0.0, 0.0] | |
| 4.3 mixed urinary incontinence | 0 | Risk Ratio (M‐H, Fixed, 95% CI) | 0.0 [0.0, 0.0] | |
| 5 De novo detrusor overactivity (urodynamic diagnosis) Show forest plot | 1 | Risk Ratio (M‐H, Fixed, 95% CI) | Totals not selected | |
| 5.1 urodynamic stress incontinence (only) | 1 | Risk Ratio (M‐H, Fixed, 95% CI) | 0.0 [0.0, 0.0] | |
| 5.2 stress urinary incontinence (symptoms only) | 0 | Risk Ratio (M‐H, Fixed, 95% CI) | 0.0 [0.0, 0.0] | |
| 5.3 mixed urinary incontinence | 0 | Risk Ratio (M‐H, Fixed, 95% CI) | 0.0 [0.0, 0.0] | |
| 6 Urinary tract infection Show forest plot | 1 | Risk Ratio (M‐H, Fixed, 95% CI) | Totals not selected | |
| 6.1 urodynamic stress incontinence (only) | 1 | Risk Ratio (M‐H, Fixed, 95% CI) | 0.0 [0.0, 0.0] | |
| 6.2 stress urinary incontinence (symptoms only) | 0 | Risk Ratio (M‐H, Fixed, 95% CI) | 0.0 [0.0, 0.0] | |
| 6.3 mixed urinary incontinence | 0 | Risk Ratio (M‐H, Fixed, 95% CI) | 0.0 [0.0, 0.0] | |
| Outcome or subgroup title | No. of studies | No. of participants | Statistical method | Effect size |
| 1 Number with incontinence (worse, unchanged or improved) within the first year (women's observations) Show forest plot | 4 | 147 | Risk Ratio (M‐H, Fixed, 95% CI) | 0.40 [0.11, 1.41] |
| 1.1 urodynamic stress incontinence (only) | 4 | 147 | Risk Ratio (M‐H, Fixed, 95% CI) | 0.40 [0.11, 1.41] |
| 1.2 stress urinary incontinence (symptoms only) | 0 | 0 | Risk Ratio (M‐H, Fixed, 95% CI) | 0.0 [0.0, 0.0] |
| 1.3 mixed incontinence | 0 | 0 | Risk Ratio (M‐H, Fixed, 95% CI) | 0.0 [0.0, 0.0] |
| 2 Number not improved (worse or unchanged) within the first year (women's observations) | 0 | 0 | Risk Ratio (M‐H, Fixed, 95% CI) | 0.0 [0.0, 0.0] |
| 2.1 urodynamic stress incontinence (only) | 0 | 0 | Risk Ratio (M‐H, Fixed, 95% CI) | 0.0 [0.0, 0.0] |
| 2.2 stress urinary incontinence (symptoms only) | 0 | 0 | Risk Ratio (M‐H, Fixed, 95% CI) | 0.0 [0.0, 0.0] |
| 2.3 mixed incontinence | 0 | 0 | Risk Ratio (M‐H, Fixed, 95% CI) | 0.0 [0.0, 0.0] |
| 3 Number with incontinence (worse, unchanged or improved) after first year (women's observations) Show forest plot | 5 | 715 | Risk Ratio (M‐H, Fixed, 95% CI) | 0.75 [0.62, 0.90] |
| 3.1 urodynamic stress incontinence (only) | 4 | 195 | Risk Ratio (M‐H, Fixed, 95% CI) | 0.72 [0.31, 1.67] |
| 3.2 stress urinary incontinence (symptoms only) | 1 | 520 | Risk Ratio (M‐H, Fixed, 95% CI) | 0.75 [0.62, 0.91] |
| 3.3 mixed incontinence | 0 | 0 | Risk Ratio (M‐H, Fixed, 95% CI) | 0.0 [0.0, 0.0] |
| 4 Number not improved (worse or unchanged) after first year (women's observations) | 0 | 0 | Risk Ratio (M‐H, Fixed, 95% CI) | 0.0 [0.0, 0.0] |
| 4.1 urodynamic stress incontinence (only) | 0 | 0 | Risk Ratio (M‐H, Fixed, 95% CI) | 0.0 [0.0, 0.0] |
| 4.2 stress urinary incontinence (symptoms only) | 0 | 0 | Risk Ratio (M‐H, Fixed, 95% CI) | 0.0 [0.0, 0.0] |
| 4.3 mixed incontinence | 0 | 0 | Risk Ratio (M‐H, Fixed, 95% CI) | 0.0 [0.0, 0.0] |
| 5 Pad changes over 24 hours | 0 | 0 | Mean Difference (IV, Fixed, 95% CI) | 0.0 [0.0, 0.0] |
| 5.1 urodynamic stress incontinence (only) | 0 | 0 | Mean Difference (IV, Fixed, 95% CI) | 0.0 [0.0, 0.0] |
| 5.2 stress urinary incontinence (symptoms only) | 0 | 0 | Mean Difference (IV, Fixed, 95% CI) | 0.0 [0.0, 0.0] |
| 5.3 mixed incontinence | 0 | 0 | Mean Difference (IV, Fixed, 95% CI) | 0.0 [0.0, 0.0] |
| 6 Incontinent episodes over 24 hours | 0 | 0 | Mean Difference (IV, Fixed, 95% CI) | 0.0 [0.0, 0.0] |
| 6.1 urodynamic stress incontinence (only) | 0 | 0 | Mean Difference (IV, Fixed, 95% CI) | 0.0 [0.0, 0.0] |
| 6.2 stress urinary incontinence (symptoms only) | 0 | 0 | Mean Difference (IV, Fixed, 95% CI) | 0.0 [0.0, 0.0] |
| 6.3 mixed incontinence | 0 | 0 | Mean Difference (IV, Fixed, 95% CI) | 0.0 [0.0, 0.0] |
| 7 Pad test weights | 0 | 0 | Mean Difference (IV, Fixed, 95% CI) | 0.0 [0.0, 0.0] |
| 7.1 urodynamic stress incontinence (only) | 0 | 0 | Mean Difference (IV, Fixed, 95% CI) | 0.0 [0.0, 0.0] |
| 7.2 stress urinary incontinence (symptoms only) | 0 | 0 | Mean Difference (IV, Fixed, 95% CI) | 0.0 [0.0, 0.0] |
| 7.3 mixed incontinence | 0 | 0 | Mean Difference (IV, Fixed, 95% CI) | 0.0 [0.0, 0.0] |
| 8 Number with incontinence (clinician's observations) within the first year | 0 | 0 | Risk Ratio (M‐H, Fixed, 95% CI) | 0.0 [0.0, 0.0] |
| 8.1 urodynamic stress incontinence (only) | 0 | 0 | Risk Ratio (M‐H, Fixed, 95% CI) | 0.0 [0.0, 0.0] |
| 8.2 stress urinary incontinence (symptoms only) | 0 | 0 | Risk Ratio (M‐H, Fixed, 95% CI) | 0.0 [0.0, 0.0] |
| 8.3 mixed incontinence | 0 | 0 | Risk Ratio (M‐H, Fixed, 95% CI) | 0.0 [0.0, 0.0] |
| 9 Number with incontinence (clinician's observations) after first year Show forest plot | 3 | 620 | Risk Ratio (M‐H, Fixed, 95% CI) | 0.95 [0.64, 1.41] |
| 9.1 urodynamic stress incontinence (only) | 1 | 28 | Risk Ratio (M‐H, Fixed, 95% CI) | 0.23 [0.01, 4.37] |
| 9.2 stress urinary incontinence (symptoms only) | 2 | 592 | Risk Ratio (M‐H, Fixed, 95% CI) | 0.99 [0.66, 1.47] |
| 9.3 mixed incontinence | 0 | 0 | Risk Ratio (M‐H, Fixed, 95% CI) | 0.0 [0.0, 0.0] |
| 10 Operative time (minutes) Show forest plot | 1 | Mean Difference (IV, Fixed, 95% CI) | Totals not selected | |
| 10.1 urodynamic stress incontinence (only) | 1 | Mean Difference (IV, Fixed, 95% CI) | 0.0 [0.0, 0.0] | |
| 10.2 stress urinary incontinence (symptoms only) | 0 | Mean Difference (IV, Fixed, 95% CI) | 0.0 [0.0, 0.0] | |
| 10.3 mixed incontinence | 0 | Mean Difference (IV, Fixed, 95% CI) | 0.0 [0.0, 0.0] | |
| 11 Time to catheter removal (days) Show forest plot | 2 | 108 | Mean Difference (IV, Fixed, 95% CI) | 8.01 [6.84, 9.18] |
| 11.1 urodynamic stress incontinence (only) | 1 | 36 | Mean Difference (IV, Fixed, 95% CI) | 9.5 [‐4.27, 23.27] |
| 11.2 stress urinary incontinence (symptoms only) | 1 | 72 | Mean Difference (IV, Fixed, 95% CI) | 8.0 [6.82, 9.18] |
| 11.3 mixed incontinence | 0 | 0 | Mean Difference (IV, Fixed, 95% CI) | 0.0 [0.0, 0.0] |
| 12 Length of inpatient stay (days) Show forest plot | 3 | 137 | Mean Difference (IV, Fixed, 95% CI) | 2.03 [1.47, 2.59] |
| 12.1 urodynamic stress incontinence (only) | 3 | 137 | Mean Difference (IV, Fixed, 95% CI) | 2.03 [1.47, 2.59] |
| 12.2 stress urinary incontinence (symptoms only) | 0 | 0 | Mean Difference (IV, Fixed, 95% CI) | 0.0 [0.0, 0.0] |
| 12.3 mixed incontinence | 0 | 0 | Mean Difference (IV, Fixed, 95% CI) | 0.0 [0.0, 0.0] |
| 13 Time to return to normal activity level | 0 | 0 | Mean Difference (IV, Fixed, 95% CI) | 0.0 [0.0, 0.0] |
| 13.1 urodynamic stress incontinence (only) | 0 | 0 | Mean Difference (IV, Fixed, 95% CI) | 0.0 [0.0, 0.0] |
| 13.2 stress urinary incontinence (symptoms only) | 0 | 0 | Mean Difference (IV, Fixed, 95% CI) | 0.0 [0.0, 0.0] |
| 13.3 mixed incontinence | 0 | 0 | Mean Difference (IV, Fixed, 95% CI) | 0.0 [0.0, 0.0] |
| 14 Peri‐operative surgical complications Show forest plot | 4 | 792 | Risk Ratio (M‐H, Fixed, 95% CI) | 1.31 [1.14, 1.51] |
| 14.1 urodynamic stress incontinence (only) | 3 | 137 | Risk Ratio (M‐H, Fixed, 95% CI) | 0.85 [0.28, 2.52] |
| 14.2 stress urinary incontinence (symptoms only) | 1 | 655 | Risk Ratio (M‐H, Fixed, 95% CI) | 1.33 [1.16, 1.53] |
| 14.3 mixed incontinence | 0 | 0 | Risk Ratio (M‐H, Fixed, 95% CI) | 0.0 [0.0, 0.0] |
| 15 Bladder perforation Show forest plot | 1 | Risk Ratio (M‐H, Fixed, 95% CI) | Totals not selected | |
| 15.1 urodynamic stress incontinence (only) | 0 | Risk Ratio (M‐H, Fixed, 95% CI) | 0.0 [0.0, 0.0] | |
| 15.2 stress urinary incontinence (symptoms only) | 1 | Risk Ratio (M‐H, Fixed, 95% CI) | 0.0 [0.0, 0.0] | |
| 15.3 mixed incontinence | 0 | Risk Ratio (M‐H, Fixed, 95% CI) | 0.0 [0.0, 0.0] | |
| 16 Urinary tract infection Show forest plot | 1 | Risk Ratio (M‐H, Fixed, 95% CI) | Totals not selected | |
| 16.1 urodynamic stress incontinence (only) | 0 | Risk Ratio (M‐H, Fixed, 95% CI) | 0.0 [0.0, 0.0] | |
| 16.2 stress urinary incontinence (symptoms only) | 1 | Risk Ratio (M‐H, Fixed, 95% CI) | 0.0 [0.0, 0.0] | |
| 16.3 mixed incontinence | 0 | Risk Ratio (M‐H, Fixed, 95% CI) | 0.0 [0.0, 0.0] | |
| 17 Urge symptoms or urge incontinence Show forest plot | 1 | Risk Ratio (M‐H, Fixed, 95% CI) | Totals not selected | |
| 17.1 urodynamic stress incontinence (only) | 1 | Risk Ratio (M‐H, Fixed, 95% CI) | 0.0 [0.0, 0.0] | |
| 17.2 stress urinary incontinence (symptoms only) | 0 | Risk Ratio (M‐H, Fixed, 95% CI) | 0.0 [0.0, 0.0] | |
| 17.3 mixed incontinence | 0 | Risk Ratio (M‐H, Fixed, 95% CI) | 0.0 [0.0, 0.0] | |
| 18 Detrusor overactivity (urodynamic diagnosis) Show forest plot | 4 | 203 | Risk Ratio (M‐H, Fixed, 95% CI) | 1.42 [0.52, 3.87] |
| 18.1 urodynamic stress incontinence (only) | 4 | 203 | Risk Ratio (M‐H, Fixed, 95% CI) | 1.42 [0.52, 3.87] |
| 18.2 stress urinary incontinence (symptoms only) | 0 | 0 | Risk Ratio (M‐H, Fixed, 95% CI) | 0.0 [0.0, 0.0] |
| 18.3 mixed incontinence | 0 | 0 | Risk Ratio (M‐H, Fixed, 95% CI) | 0.0 [0.0, 0.0] |
| 19 Voiding dysfunction after three months Show forest plot | 5 | 853 | Risk Ratio (M‐H, Fixed, 95% CI) | 6.08 [3.10, 11.95] |
| 19.1 urodynamic stress incontinence (only) | 4 | 198 | Risk Ratio (M‐H, Fixed, 95% CI) | 4.48 [1.16, 17.36] |
| 19.2 stress urinary incontinence (symptoms only) | 1 | 655 | Risk Ratio (M‐H, Fixed, 95% CI) | 6.63 [3.04, 14.47] |
| 19.3 mixed incontinence | 0 | 0 | Risk Ratio (M‐H, Fixed, 95% CI) | 0.0 [0.0, 0.0] |
| 20 Prolapse Show forest plot | 2 | 106 | Risk Ratio (M‐H, Fixed, 95% CI) | 0.2 [0.04, 1.11] |
| 20.1 urodynamic stress incontinence (only) | 2 | 106 | Risk Ratio (M‐H, Fixed, 95% CI) | 0.2 [0.04, 1.11] |
| 20.2 stress urinary incontinence (symptoms only) | 0 | 0 | Risk Ratio (M‐H, Fixed, 95% CI) | 0.0 [0.0, 0.0] |
| 20.3 mixed incontinence | 0 | 0 | Risk Ratio (M‐H, Fixed, 95% CI) | 0.0 [0.0, 0.0] |
| 21 Repeat incontinence surgery | 0 | 0 | Risk Ratio (M‐H, Fixed, 95% CI) | 0.0 [0.0, 0.0] |
| 21.1 urodynamic stress incontinence (only) | 0 | 0 | Risk Ratio (M‐H, Fixed, 95% CI) | 0.0 [0.0, 0.0] |
| 21.2 stress urinary incontinence (symptoms only) | 0 | 0 | Risk Ratio (M‐H, Fixed, 95% CI) | 0.0 [0.0, 0.0] |
| 21.3 mixed incontinence | 0 | 0 | Risk Ratio (M‐H, Fixed, 95% CI) | 0.0 [0.0, 0.0] |
| 22 Health status measures | 0 | 0 | Mean Difference (IV, Fixed, 95% CI) | 0.0 [0.0, 0.0] |
| 22.1 urodynamic stress incontinence (only) | 0 | 0 | Mean Difference (IV, Fixed, 95% CI) | 0.0 [0.0, 0.0] |
| 22.2 stress urinary incontinence (symptoms only) | 0 | 0 | Mean Difference (IV, Fixed, 95% CI) | 0.0 [0.0, 0.0] |
| 22.3 mixed incontinence | 0 | 0 | Mean Difference (IV, Fixed, 95% CI) | 0.0 [0.0, 0.0] |
| Outcome or subgroup title | No. of studies | No. of participants | Statistical method | Effect size |
| 1 Number with incontinence (worse, unchanged or improved) within the first year (women's observations) Show forest plot | 1 | Risk Ratio (M‐H, Fixed, 95% CI) | Totals not selected | |
| 1.1 urodynamic stress incontinence (only) | 1 | Risk Ratio (M‐H, Fixed, 95% CI) | 0.0 [0.0, 0.0] | |
| 1.2 stress urinary incontinence (symptoms only) | 0 | Risk Ratio (M‐H, Fixed, 95% CI) | 0.0 [0.0, 0.0] | |
| 1.3 mixed incontinence | 0 | Risk Ratio (M‐H, Fixed, 95% CI) | 0.0 [0.0, 0.0] | |
| 2 Number with incontinence (worse, unchanged or improved) after the first year (women's observations) Show forest plot | 1 | Risk Ratio (M‐H, Fixed, 95% CI) | Totals not selected | |
| 2.1 urodynamic stress incontinence (only) | 1 | Risk Ratio (M‐H, Fixed, 95% CI) | 0.0 [0.0, 0.0] | |
| 2.2 stress urinary incontinence (symptoms only) | 0 | Risk Ratio (M‐H, Fixed, 95% CI) | 0.0 [0.0, 0.0] | |
| 2.3 mixed incontinence | 0 | Risk Ratio (M‐H, Fixed, 95% CI) | 0.0 [0.0, 0.0] | |
| 3 Length of inpatient stay Show forest plot | 1 | Mean Difference (IV, Fixed, 95% CI) | Totals not selected | |
| 3.1 urodynamic stress incontinence (only) | 1 | Mean Difference (IV, Fixed, 95% CI) | 0.0 [0.0, 0.0] | |
| 3.2 stress urinary incontinence (symptoms only) | 0 | Mean Difference (IV, Fixed, 95% CI) | 0.0 [0.0, 0.0] | |
| 3.3 mixed incontinence | 0 | Mean Difference (IV, Fixed, 95% CI) | 0.0 [0.0, 0.0] | |
| 4 Peri‐operative surgical complications Show forest plot | 1 | Risk Ratio (M‐H, Fixed, 95% CI) | Totals not selected | |
| 4.1 urodynamic stress incontinence (only) | 1 | Risk Ratio (M‐H, Fixed, 95% CI) | 0.0 [0.0, 0.0] | |
| 4.2 stress urinary incontinence (symptoms only) | 0 | Risk Ratio (M‐H, Fixed, 95% CI) | 0.0 [0.0, 0.0] | |
| 4.3 mixed incontinence | 0 | Risk Ratio (M‐H, Fixed, 95% CI) | 0.0 [0.0, 0.0] | |
| 5 Urge symptoms or urge incontinence Show forest plot | 1 | Risk Ratio (M‐H, Fixed, 95% CI) | Totals not selected | |
| 5.1 urodynamic stress incontinence (only) | 1 | Risk Ratio (M‐H, Fixed, 95% CI) | 0.0 [0.0, 0.0] | |
| 5.2 stress urinary incontinence (symptoms only) | 0 | Risk Ratio (M‐H, Fixed, 95% CI) | 0.0 [0.0, 0.0] | |
| 5.3 mixed incontinence | 0 | Risk Ratio (M‐H, Fixed, 95% CI) | 0.0 [0.0, 0.0] | |
| 6 Voiding dysfunction after three months Show forest plot | 1 | Risk Ratio (M‐H, Fixed, 95% CI) | Totals not selected | |
| 6.1 urodynamic stress incontinence (only) | 1 | Risk Ratio (M‐H, Fixed, 95% CI) | 0.0 [0.0, 0.0] | |
| 6.2 stress urinary incontinence (symptoms only) | 0 | Risk Ratio (M‐H, Fixed, 95% CI) | 0.0 [0.0, 0.0] | |
| 6.3 mixed incontinence | 0 | Risk Ratio (M‐H, Fixed, 95% CI) | 0.0 [0.0, 0.0] | |
| 7 Detrusor overactivity (urodynamic diagnosis) Show forest plot | 1 | Risk Ratio (M‐H, Fixed, 95% CI) | Totals not selected | |
| 7.1 urodynamic stress incontinence (only) | 1 | Risk Ratio (M‐H, Fixed, 95% CI) | 0.0 [0.0, 0.0] | |
| 7.2 stress urinary incontinence (symptoms only) | 0 | Risk Ratio (M‐H, Fixed, 95% CI) | 0.0 [0.0, 0.0] | |
| 7.3 mixed incontinence | 0 | Risk Ratio (M‐H, Fixed, 95% CI) | 0.0 [0.0, 0.0] | |
| Outcome or subgroup title | No. of studies | No. of participants | Statistical method | Effect size |
| 1 Number with incontinence (worse, unchanged or improved) within the first year (women's observations) Show forest plot | 8 | 693 | Risk Ratio (M‐H, Fixed, 95% CI) | 0.97 [0.78, 1.20] |
| 1.1 urodynamic stress incontinence (only) | 5 | 434 | Risk Ratio (M‐H, Fixed, 95% CI) | 1.01 [0.76, 1.34] |
| 1.2 stress urinary incontinence (symptoms only) | 0 | 0 | Risk Ratio (M‐H, Fixed, 95% CI) | 0.0 [0.0, 0.0] |
| 1.3 mixed urinary incontinence | 3 | 259 | Risk Ratio (M‐H, Fixed, 95% CI) | 0.91 [0.66, 1.27] |
| 2 Number not improved (worse or unchanged) within the first year (women's observations) Show forest plot | 3 | 432 | Risk Ratio (M‐H, Fixed, 95% CI) | 0.78 [0.48, 1.27] |
| 2.1 urodynamic stress incontinence (only) | 2 | 293 | Risk Ratio (M‐H, Fixed, 95% CI) | 0.92 [0.39, 2.13] |
| 2.2 stress urinary incontinence (symptoms only) | 0 | 0 | Risk Ratio (M‐H, Fixed, 95% CI) | 0.0 [0.0, 0.0] |
| 2.3 mixed urinary incontinence | 1 | 139 | Risk Ratio (M‐H, Fixed, 95% CI) | 0.72 [0.40, 1.29] |
| 3 Number with incontinence (worse, unchanged or improved) after first year (women's observations) Show forest plot | 4 | 382 | Risk Ratio (M‐H, Fixed, 95% CI) | 1.23 [0.91, 1.66] |
| 3.1 urodynamic stress incontinence (only) | 3 | 338 | Risk Ratio (M‐H, Fixed, 95% CI) | 1.17 [0.86, 1.60] |
| 3.2 stress urinary incontinence (symptoms only) | 0 | 0 | Risk Ratio (M‐H, Fixed, 95% CI) | 0.0 [0.0, 0.0] |
| 3.3 mixed urinary incontinence | 1 | 44 | Risk Ratio (M‐H, Fixed, 95% CI) | 1.92 [0.65, 5.63] |
| 4 Number not improved (worse or unchanged) after the first year (women's observations) Show forest plot | 2 | 279 | Risk Ratio (M‐H, Fixed, 95% CI) | 1.30 [0.57, 2.94] |
| 4.1 urodynamic stress incontinence (only) | 2 | 279 | Risk Ratio (M‐H, Fixed, 95% CI) | 1.30 [0.57, 2.94] |
| 4.2 stress urinary incontinence (symptoms only) | 0 | 0 | Risk Ratio (M‐H, Fixed, 95% CI) | 0.0 [0.0, 0.0] |
| 4.3 mixed urinary incontinence | 0 | 0 | Risk Ratio (M‐H, Fixed, 95% CI) | 0.0 [0.0, 0.0] |
| 5 Pad test: mean weight of urine Show forest plot | 1 | 20 | Mean Difference (IV, Fixed, 95% CI) | ‐29.00 [‐57.53, ‐4.47] |
| 5.1 urodynamic stress incontinence (only) | 1 | 20 | Mean Difference (IV, Fixed, 95% CI) | ‐29.00 [‐57.53, ‐4.47] |
| 5.2 stress urinary incontinence (symptoms only) | 0 | 0 | Mean Difference (IV, Fixed, 95% CI) | 0.0 [0.0, 0.0] |
| 5.3 mixed urinary incontinence | 0 | 0 | Mean Difference (IV, Fixed, 95% CI) | 0.0 [0.0, 0.0] |
| 6 Number with incontinence (clinician's observations) within first year Show forest plot | 2 | 105 | Risk Ratio (M‐H, Fixed, 95% CI) | 1.29 [0.45, 3.71] |
| 6.1 urodynamic stress incontinence (only) | 0 | 0 | Risk Ratio (M‐H, Fixed, 95% CI) | 0.0 [0.0, 0.0] |
| 6.2 stress urinary incontinence (symptoms only) | 0 | 0 | Risk Ratio (M‐H, Fixed, 95% CI) | 0.0 [0.0, 0.0] |
| 6.3 mixed urinary incontinence | 2 | 105 | Risk Ratio (M‐H, Fixed, 95% CI) | 1.29 [0.45, 3.71] |
| 7 Number with incontinence (clinician's observations) after first year Show forest plot | 1 | 44 | Risk Ratio (M‐H, Fixed, 95% CI) | 1.72 [0.82, 3.61] |
| 7.1 urodynamic stress incontinence (only) | 0 | 0 | Risk Ratio (M‐H, Fixed, 95% CI) | 0.0 [0.0, 0.0] |
| 7.2 stress urinary incontinence (symptoms only) | 0 | 0 | Risk Ratio (M‐H, Fixed, 95% CI) | 0.0 [0.0, 0.0] |
| 7.3 mixed urinary incontinence | 1 | 44 | Risk Ratio (M‐H, Fixed, 95% CI) | 1.72 [0.82, 3.61] |
| 8 Operative time (mins) Show forest plot | 5 | 225 | Mean Difference (IV, Fixed, 95% CI) | 59.90 [56.62, 63.18] |
| 8.1 urodynamic stress incontinence (only) | 2 | 61 | Mean Difference (IV, Fixed, 95% CI) | 46.91 [42.31, 51.52] |
| 8.2 stress urinary incontinence (symptoms only) | 0 | 0 | Mean Difference (IV, Fixed, 95% CI) | 0.0 [0.0, 0.0] |
| 8.3 mixed urinary incontinence | 3 | 164 | Mean Difference (IV, Fixed, 95% CI) | 73.26 [68.59, 77.94] |
| 9 Length of hospital stay (days) Show forest plot | 2 | 64 | Mean Difference (IV, Fixed, 95% CI) | 0.49 [0.26, 0.72] |
| 9.1 urodynamic stress incontinence (only) | 1 | 20 | Mean Difference (IV, Fixed, 95% CI) | 0.65 [0.39, 0.91] |
| 9.2 stress urinary incontinence (symptoms only) | 0 | 0 | Mean Difference (IV, Fixed, 95% CI) | 0.0 [0.0, 0.0] |
| 9.3 mixed urinary incontinence | 1 | 44 | Mean Difference (IV, Fixed, 95% CI) | 0.0 [‐0.46, 0.46] |
| 10 Time to catheter removal (days) Show forest plot | 2 | 113 | Mean Difference (IV, Fixed, 95% CI) | 0.11 [‐0.07, 0.30] |
| 10.1 urodynamic stress incontinence (only) | 0 | 0 | Mean Difference (IV, Fixed, 95% CI) | 0.0 [0.0, 0.0] |
| 10.2 stress urinary incontinence (symptoms only) | 0 | 0 | Mean Difference (IV, Fixed, 95% CI) | 0.0 [0.0, 0.0] |
| 10.3 mixed urinary incontinence | 2 | 113 | Mean Difference (IV, Fixed, 95% CI) | 0.11 [‐0.07, 0.30] |
| 11 Peri operative surgical complications Show forest plot | 3 | 243 | Risk Ratio (M‐H, Fixed, 95% CI) | 1.59 [1.03, 2.44] |
| 11.1 urodynamic stress incontinence (only) | 2 | 183 | Risk Ratio (M‐H, Fixed, 95% CI) | 1.73 [1.01, 2.96] |
| 11.2 stress urinary incontinence (symptoms only) | 0 | 0 | Risk Ratio (M‐H, Fixed, 95% CI) | 0.0 [0.0, 0.0] |
| 11.3 mixed urinary incontinence | 1 | 60 | Risk Ratio (M‐H, Fixed, 95% CI) | 1.31 [0.64, 2.69] |
| 12 Bladder perforations Show forest plot | 7 | 563 | Risk Ratio (M‐H, Fixed, 95% CI) | 0.62 [0.34, 1.11] |
| 12.1 urodynamic stress incontinence (only) | 2 | 183 | Risk Ratio (M‐H, Fixed, 95% CI) | 3.14 [0.14, 72.92] |
| 12.2 stress urinary incontinence (symptoms only) | 0 | 0 | Risk Ratio (M‐H, Fixed, 95% CI) | 0.0 [0.0, 0.0] |
| 12.3 mixed urinary incontinence | 5 | 380 | Risk Ratio (M‐H, Fixed, 95% CI) | 0.57 [0.31, 1.04] |
| 13 Urethral injury Show forest plot | 1 | Risk Ratio (M‐H, Fixed, 95% CI) | Totals not selected | |
| 13.1 urodynamic stress incontinence (only) | 0 | Risk Ratio (M‐H, Fixed, 95% CI) | 0.0 [0.0, 0.0] | |
| 13.2 stress urinary incontinence (symptoms only) | 0 | Risk Ratio (M‐H, Fixed, 95% CI) | 0.0 [0.0, 0.0] | |
| 13.3 mixed urinary incontinence | 1 | Risk Ratio (M‐H, Fixed, 95% CI) | 0.0 [0.0, 0.0] | |
| 14 De novo detrusor urgency or urge symptoms Show forest plot | 3 | 174 | Risk Ratio (M‐H, Fixed, 95% CI) | 3.13 [0.96, 10.24] |
| 14.1 urodynamic stress incontinence (only) | 0 | 0 | Risk Ratio (M‐H, Fixed, 95% CI) | 0.0 [0.0, 0.0] |
| 14.2 stress urinary incontinence (symptoms only) | 0 | 0 | Risk Ratio (M‐H, Fixed, 95% CI) | 0.0 [0.0, 0.0] |
| 14.3 mixed urinary incontinence | 3 | 174 | Risk Ratio (M‐H, Fixed, 95% CI) | 3.13 [0.96, 10.24] |
| 15 De novo detrusor overactivity (urodynamic diagnosis) Show forest plot | 3 | 245 | Risk Ratio (M‐H, Fixed, 95% CI) | 3.21 [1.29, 8.03] |
| 15.1 urodynamic stress incontinence (only) | 1 | 59 | Risk Ratio (M‐H, Fixed, 95% CI) | 0.0 [0.0, 0.0] |
| 15.2 stress urinary incontinence (symptoms only) | 0 | 0 | Risk Ratio (M‐H, Fixed, 95% CI) | 0.0 [0.0, 0.0] |
| 15.3 mixed urinary incontinence | 2 | 186 | Risk Ratio (M‐H, Fixed, 95% CI) | 3.21 [1.29, 8.03] |
| 16 Voiding dysfunction Show forest plot | 5 | 375 | Risk Ratio (M‐H, Fixed, 95% CI) | 1.60 [0.94, 2.71] |
| 16.1 urodynamic stress incontinence (only) | 2 | 201 | Risk Ratio (M‐H, Fixed, 95% CI) | 0.97 [0.42, 2.25] |
| 16.2 stress urinary incontinence (symptoms only) | 0 | 0 | Risk Ratio (M‐H, Fixed, 95% CI) | 0.0 [0.0, 0.0] |
| 16.3 mixed urinary incontinence | 3 | 174 | Risk Ratio (M‐H, Fixed, 95% CI) | 2.28 [1.13, 4.62] |
| 17 Release of sling required Show forest plot | 2 | 202 | Risk Ratio (M‐H, Fixed, 95% CI) | 3.67 [0.95, 14.22] |
| 17.1 urodynamic stress incontinence (only) | 1 | 142 | Risk Ratio (M‐H, Fixed, 95% CI) | 2.30 [0.46, 11.45] |
| 17.2 stress urinary incontinence (symptoms only) | 0 | 0 | Risk Ratio (M‐H, Fixed, 95% CI) | 0.0 [0.0, 0.0] |
| 17.3 mixed urinary incontinence | 1 | 60 | Risk Ratio (M‐H, Fixed, 95% CI) | 9.6 [0.54, 170.84] |
| 18 Retention up to 6 weeks Show forest plot | 1 | Risk Ratio (M‐H, Fixed, 95% CI) | Totals not selected | |
| 18.1 urodynamic stress incontinence (only) | 1 | Risk Ratio (M‐H, Fixed, 95% CI) | 0.0 [0.0, 0.0] | |
| 18.2 stress urinary incontinence (symptoms only) | 0 | Risk Ratio (M‐H, Fixed, 95% CI) | 0.0 [0.0, 0.0] | |
| 18.3 mixed urinary incontinence | 0 | Risk Ratio (M‐H, Fixed, 95% CI) | 0.0 [0.0, 0.0] | |
| 19 Vaginal erosion Show forest plot | 2 | Risk Ratio (M‐H, Fixed, 95% CI) | Totals not selected | |
| 19.1 urodynamic stress incontinence (only) | 1 | Risk Ratio (M‐H, Fixed, 95% CI) | 0.0 [0.0, 0.0] | |
| 19.2 stress urinary incontinence (symptoms only) | 0 | Risk Ratio (M‐H, Fixed, 95% CI) | 0.0 [0.0, 0.0] | |
| 19.3 mixed urinary incontinence | 1 | Risk Ratio (M‐H, Fixed, 95% CI) | 0.0 [0.0, 0.0] | |
| 20 Wound pain (6 months) Show forest plot | 1 | Risk Ratio (M‐H, Fixed, 95% CI) | Totals not selected | |
| 20.1 urodynamic stress incontinence (only) | 0 | Risk Ratio (M‐H, Fixed, 95% CI) | 0.0 [0.0, 0.0] | |
| 20.2 stress urinary incontinence (symptoms only) | 0 | Risk Ratio (M‐H, Fixed, 95% CI) | 0.0 [0.0, 0.0] | |
| 20.3 mixed urinary incontinence | 1 | Risk Ratio (M‐H, Fixed, 95% CI) | 0.0 [0.0, 0.0] | |
| Outcome or subgroup title | No. of studies | No. of participants | Statistical method | Effect size |
| 1 Number with incontinence (worse, unchanged or improved) within the first year (women's observations) Show forest plot | 3 | 307 | Risk Ratio (M‐H, Fixed, 95% CI) | 0.89 [0.66, 1.19] |
| 1.1 urodynamic stress incontinence (only) | 3 | 307 | Risk Ratio (M‐H, Fixed, 95% CI) | 0.89 [0.66, 1.19] |
| 1.2 stress urinary incontinence (symptoms only) | 0 | 0 | Risk Ratio (M‐H, Fixed, 95% CI) | 0.0 [0.0, 0.0] |
| 1.3 mixed urinary incontinence | 0 | 0 | Risk Ratio (M‐H, Fixed, 95% CI) | 0.0 [0.0, 0.0] |
| 2 Number not improved (worse or unchanged) within the first year (women's observations) Show forest plot | 3 | Risk Ratio (M‐H, Fixed, 95% CI) | Subtotals only | |
| 2.1 urodynamic stress incontinence (only) | 2 | 163 | Risk Ratio (M‐H, Fixed, 95% CI) | 0.22 [0.08, 0.59] |
| 2.2 stress urinary incontinence (symptoms only) | 0 | 0 | Risk Ratio (M‐H, Fixed, 95% CI) | 0.0 [0.0, 0.0] |
| 2.3 mixed urinary incontinence | 1 | 48 | Risk Ratio (M‐H, Fixed, 95% CI) | 6.70 [0.40, 111.94] |
| 3 Number with incontinence (worse, unchanged or improved) after first year (women's observations) Show forest plot | 4 | 379 | Risk Ratio (M‐H, Fixed, 95% CI) | 0.89 [0.72, 1.10] |
| 3.1 urodynamic stress incontinence (only) | 3 | 331 | Risk Ratio (M‐H, Fixed, 95% CI) | 0.83 [0.67, 1.03] |
| 3.2 stress urinary incontinence (symptoms only) | 0 | 0 | Risk Ratio (M‐H, Fixed, 95% CI) | 0.0 [0.0, 0.0] |
| 3.3 mixed urinary incontinence | 1 | 48 | Risk Ratio (M‐H, Fixed, 95% CI) | 2.75 [0.69, 10.95] |
| 4 Number not improved (worse or unchanged) after the first year (women's observations) Show forest plot | 3 | Risk Ratio (M‐H, Fixed, 95% CI) | Subtotals only | |
| 4.1 urodynamic stress incontinence (only) | 2 | 186 | Risk Ratio (M‐H, Fixed, 95% CI) | 0.33 [0.17, 0.64] |
| 4.2 stress urinary incontinence (symptoms only) | 0 | 0 | Risk Ratio (M‐H, Fixed, 95% CI) | 0.0 [0.0, 0.0] |
| 4.3 mixed urinary incontinence | 1 | 48 | Risk Ratio (M‐H, Fixed, 95% CI) | 0.0 [0.0, 0.0] |
| 5 Number with incontinence (worse, unchanged or improved) after five years (women's observations) Show forest plot | 1 | Risk Ratio (M‐H, Fixed, 95% CI) | Totals not selected | |
| 5.1 urodynamic stress incontinence (only) | 1 | Risk Ratio (M‐H, Fixed, 95% CI) | 0.0 [0.0, 0.0] | |
| 5.2 stress urinary incontinence (symptoms only) | 0 | Risk Ratio (M‐H, Fixed, 95% CI) | 0.0 [0.0, 0.0] | |
| 5.3 mixed urinary incontinence | 0 | Risk Ratio (M‐H, Fixed, 95% CI) | 0.0 [0.0, 0.0] | |
| 6 Pad test: mean weight of urine Show forest plot | 1 | Mean Difference (IV, Fixed, 95% CI) | Totals not selected | |
| 6.1 urodynamic stress incontinence (only) | 1 | Mean Difference (IV, Fixed, 95% CI) | 0.0 [0.0, 0.0] | |
| 6.2 stress urinary incontinence (symptoms only) | 0 | Mean Difference (IV, Fixed, 95% CI) | 0.0 [0.0, 0.0] | |
| 6.3 mixed urinary incontinence | 0 | Mean Difference (IV, Fixed, 95% CI) | 0.0 [0.0, 0.0] | |
| 7 Operative time (mins) Show forest plot | 1 | Mean Difference (IV, Fixed, 95% CI) | Totals not selected | |
| 7.1 urodynamic stress incontinence (only) | 1 | Mean Difference (IV, Fixed, 95% CI) | 0.0 [0.0, 0.0] | |
| 7.2 stress urinary incontinence (symptoms only) | 0 | Mean Difference (IV, Fixed, 95% CI) | 0.0 [0.0, 0.0] | |
| 7.3 mixed urinary incontinence | 0 | Mean Difference (IV, Fixed, 95% CI) | 0.0 [0.0, 0.0] | |
| 8 Peri operative surgical complications Show forest plot | 2 | Risk Ratio (M‐H, Fixed, 95% CI) | Totals not selected | |
| 8.1 urodynamic stress incontinence (only) | 1 | Risk Ratio (M‐H, Fixed, 95% CI) | 0.0 [0.0, 0.0] | |
| 8.2 stress urinary incontinence (symptoms only) | 0 | Risk Ratio (M‐H, Fixed, 95% CI) | 0.0 [0.0, 0.0] | |
| 8.3 mixed urinary incontinence | 1 | Risk Ratio (M‐H, Fixed, 95% CI) | 0.0 [0.0, 0.0] | |
| 9 Bladder perforation Show forest plot | 1 | Risk Ratio (M‐H, Fixed, 95% CI) | Totals not selected | |
| 9.1 urodynamic stress incontinence (only) | 1 | Risk Ratio (M‐H, Fixed, 95% CI) | 0.0 [0.0, 0.0] | |
| 9.2 stress urinary incontinence (symptoms only) | 0 | Risk Ratio (M‐H, Fixed, 95% CI) | 0.0 [0.0, 0.0] | |
| 9.3 mixed urinary incontinence | 0 | Risk Ratio (M‐H, Fixed, 95% CI) | 0.0 [0.0, 0.0] | |
| 10 Urinary tract infection Show forest plot | 1 | Risk Ratio (M‐H, Fixed, 95% CI) | Totals not selected | |
| 10.1 urodynamic stress incontinence (only) | 1 | Risk Ratio (M‐H, Fixed, 95% CI) | 0.0 [0.0, 0.0] | |
| 10.2 stress urinary incontinence (symptoms only) | 0 | Risk Ratio (M‐H, Fixed, 95% CI) | 0.0 [0.0, 0.0] | |
| 10.3 mixed urinary incontinence | 0 | Risk Ratio (M‐H, Fixed, 95% CI) | 0.0 [0.0, 0.0] | |
| 11 De novo detrusor urgency or urge symptoms or detrusor overactivity Show forest plot | 1 | Risk Ratio (M‐H, Fixed, 95% CI) | Totals not selected | |
| 11.1 urodynamic stress incontinence (only) | 1 | Risk Ratio (M‐H, Fixed, 95% CI) | 0.0 [0.0, 0.0] | |
| 11.2 stress urinary incontinence (symptoms only) | 0 | Risk Ratio (M‐H, Fixed, 95% CI) | 0.0 [0.0, 0.0] | |
| 11.3 mixed urinary incontinence | 0 | Risk Ratio (M‐H, Fixed, 95% CI) | 0.0 [0.0, 0.0] | |
| 12 Voiding dysfunction Show forest plot | 1 | Risk Ratio (M‐H, Fixed, 95% CI) | Totals not selected | |
| 12.1 urodynamic stress incontinence (only) | 1 | Risk Ratio (M‐H, Fixed, 95% CI) | 0.0 [0.0, 0.0] | |
| 12.2 stress urinary incontinence (symptoms only) | 0 | Risk Ratio (M‐H, Fixed, 95% CI) | 0.0 [0.0, 0.0] | |
| 12.3 mixed urinary incontinence | 0 | Risk Ratio (M‐H, Fixed, 95% CI) | 0.0 [0.0, 0.0] | |
| 13 De novo detrusor overactivity (urodynamic diagnosis) Show forest plot | 2 | Risk Ratio (M‐H, Fixed, 95% CI) | Subtotals only | |
| 13.1 urodynamic stress incontinence (only) | 1 | 57 | Risk Ratio (M‐H, Fixed, 95% CI) | 1.72 [0.52, 5.74] |
| 13.2 stress urinary incontinence (symptoms only) | 0 | 0 | Risk Ratio (M‐H, Fixed, 95% CI) | 0.0 [0.0, 0.0] |
| 13.3 mixed urinary incontinence | 1 | 48 | Risk Ratio (M‐H, Fixed, 95% CI) | 0.67 [0.17, 2.63] |