Vacunas acelulares para prevenir la tos ferina en niños
Información
- DOI:
- https://doi.org/10.1002/14651858.CD001478.pub6Copiar DOI

- Base de datos:
-
- Cochrane Database of Systematic Reviews
- Versión publicada:
-
- 17 septiembre 2014see what's new
- Tipo:
-
- Intervention
- Etapa:
-
- Review
- Grupo Editorial Cochrane:
-
Grupo Cochrane de Infecciones respiratorias agudas
- Copyright:
-
- Copyright © 2014 The Cochrane Collaboration. Published by John Wiley & Sons, Ltd.
Cifras del artículo
Altmetric:
Citado por:
Autores
Contributions of authors
Inge Axelsson (IA) contributed to updating the Background section and the section "Agreements and disagreements with other studies or reviews" in the Discussion section.
Silvio Prietsch (SP) was responsible for updating the Background section. He participated in study selection, quality assessment and data collection for the updated review. He also provided input to updating the section Risk of bias in included studies.
Linjie Zhang (LZ) was responsible for study selection, quality assessment, data collection and data analysis for the updated review. He was also responsible for updating the Abstract, Methods, Results, Discussion and References. He contributed to updating the Background section.
Scott Halperin (SH) performed a critical review of the manuscript and provided input to updating the Discussion section.
The final version of the updated review was approved by all review authors.
Sources of support
Internal sources
-
No sources of support supplied
External sources
-
UK Department of Health Cochrane Incentive Scheme 2008, UK.
This updated review received an award from the UK Department of Health Cochrane Incentive Scheme 2008
Declarations of interest
Inge Axelsson was in part paid by the Research and Development Unit, Jämtland County Council, Östersund, Sweden. "In the last 10 years, I have been a Clinical Investigator in a trial of an infant combination vaccine containing acellular pertussis (aP) vaccine from Sanofi Pasteur MSD but I have not received any fee from any pharmaceutical company".
Scott A Halperin has undertaken clinical trials of acellular pertussis vaccines for most manufacturers of these products including GlaxoSmithKline, Sanofi Pasteur, Novartis and Wyeth. He has given Continuing Medical Education talks (not as part of a manufacturers' speakers bureau) for which an honorarium has been paid. He has served on occasional ad hoc advisory boards of vaccine manufacturers but does not have any ongoing consultancies.
Linjie Zhang: none known.
Sílvio OM Prietsch: none known.
Acknowledgements
Thanks to Sarah Thorning, Trials Search Co‐ordinator of the Cochrane Acute Respiratory Infections (ARI) Group, for performing the updated search and to Elizabeth Dooley, Managing Editor of the Cochrane ARI Group, for continuous support. Owen Tinnion and Mark Hanlon were responsible for the first published version of this review.
Version history
| Published | Title | Stage | Authors | Version |
| 2014 Sep 17 | Acellular vaccines for preventing whooping cough in children | Review | Linjie Zhang, Sílvio OM Prietsch, Inge Axelsson, Scott A Halperin | |
| 2012 Mar 14 | Acellular vaccines for preventing whooping cough in children | Review | Linjie Zhang, Sílvio OM Prietsch, Inge Axelsson, Scott A Halperin | |
| 2011 Jan 19 | Acellular vaccines for preventing whooping cough in children | Review | Linjie Zhang, Sílvio OM Prietsch, Inge Axelsson, Scott A Halperin | |
| 2009 Jul 08 | Acellular vaccines for preventing whooping cough in children | Review | Owen Tinnion, Mark Hanlon | |
| 2008 Apr 23 | Acellular vaccines for preventing whooping cough in children | Review | Linjie Zhang, Sílvio OM Prietsch, Inge Axelsson, Scott A Halperin | |
| 1999 Apr 26 | Acellular vaccines for preventing whooping cough in children | Review | Owen Tinnion, Mark Hanlon | |
Notes
This review was previously withdrawn from The Cochrane Library in Issue 3, 2006. The electronic searches had been conducted in 1998 and the lead author was unable to update the review. In May 2008 this review was taken over and updated by a new team of review authors.
Keywords
MeSH
Medical Subject Headings (MeSH) Keywords
Medical Subject Headings Check Words
Child; Child, Preschool; Humans; Infant;
PICO

'Risk of bias' graph: review authors' judgements about each risk of bias item presented as percentages across all included studies.
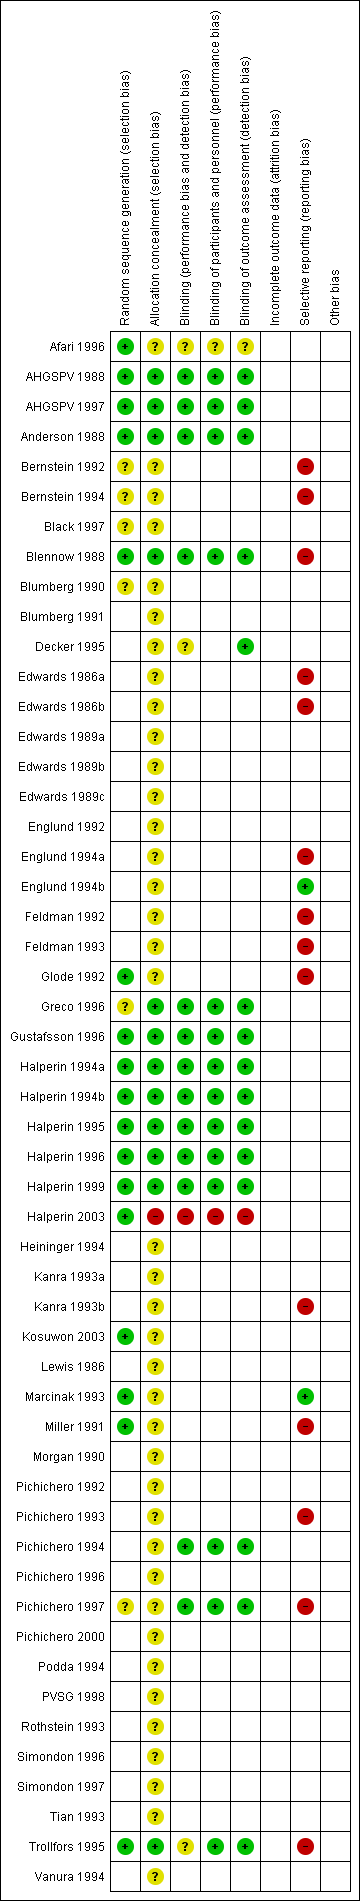
'Risk of bias' summary: review authors' judgements about each risk of bias item for each included study.

Comparison 1 Safety: acellular versus whole‐cell pertussis vaccines, Outcome 1 Primary series non‐completion due to adverse events.

Comparison 1 Safety: acellular versus whole‐cell pertussis vaccines, Outcome 2 Death (all causes).
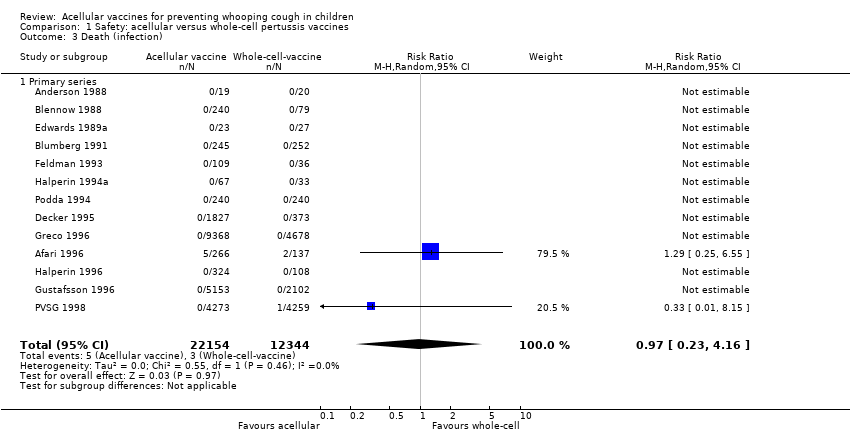
Comparison 1 Safety: acellular versus whole‐cell pertussis vaccines, Outcome 3 Death (infection).
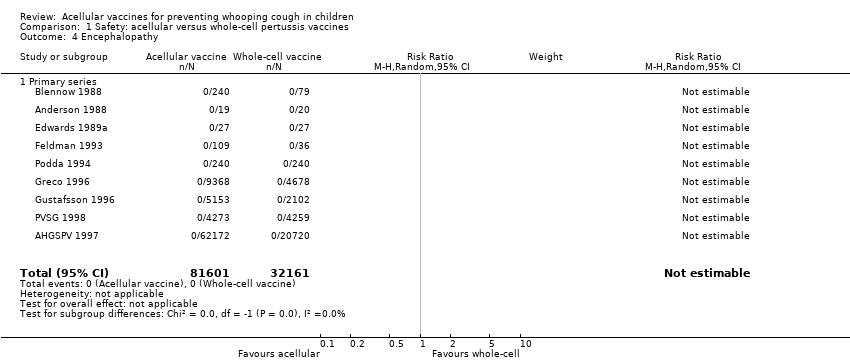
Comparison 1 Safety: acellular versus whole‐cell pertussis vaccines, Outcome 4 Encephalopathy.
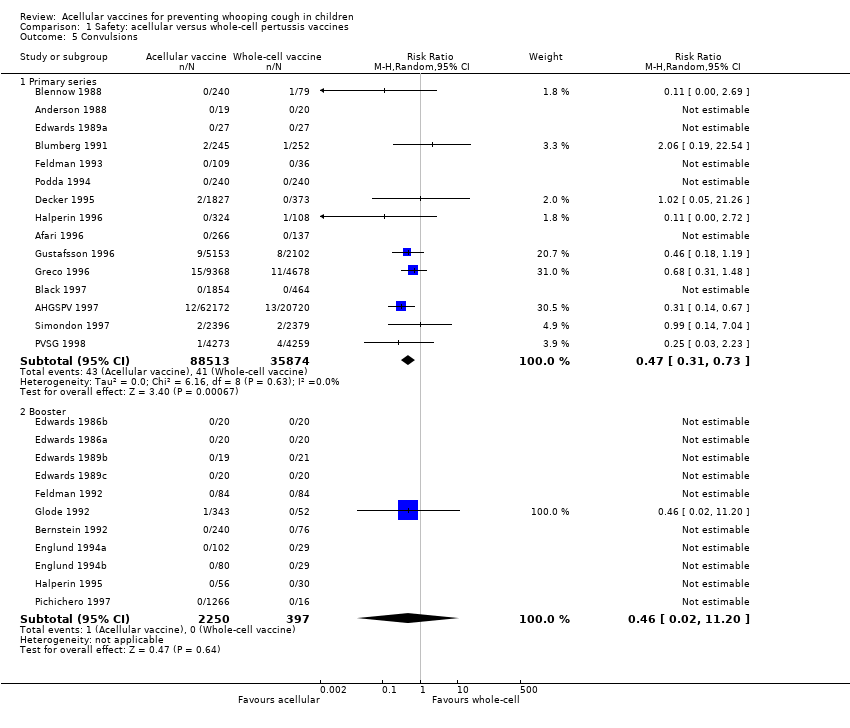
Comparison 1 Safety: acellular versus whole‐cell pertussis vaccines, Outcome 5 Convulsions.

Comparison 1 Safety: acellular versus whole‐cell pertussis vaccines, Outcome 6 Hypotonic hyporesponsive episodes.

Comparison 1 Safety: acellular versus whole‐cell pertussis vaccines, Outcome 7 Anorexia.
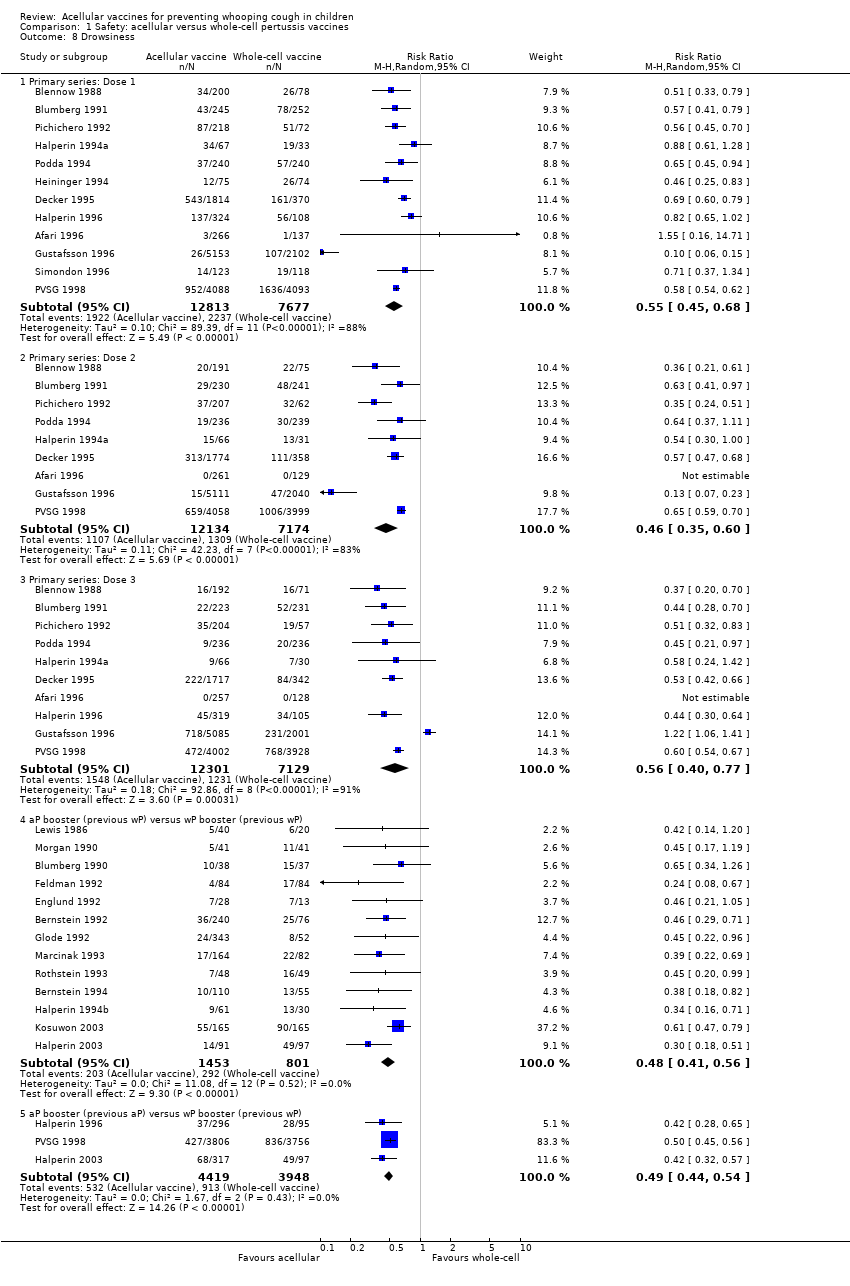
Comparison 1 Safety: acellular versus whole‐cell pertussis vaccines, Outcome 8 Drowsiness.

Comparison 1 Safety: acellular versus whole‐cell pertussis vaccines, Outcome 9 Fever.
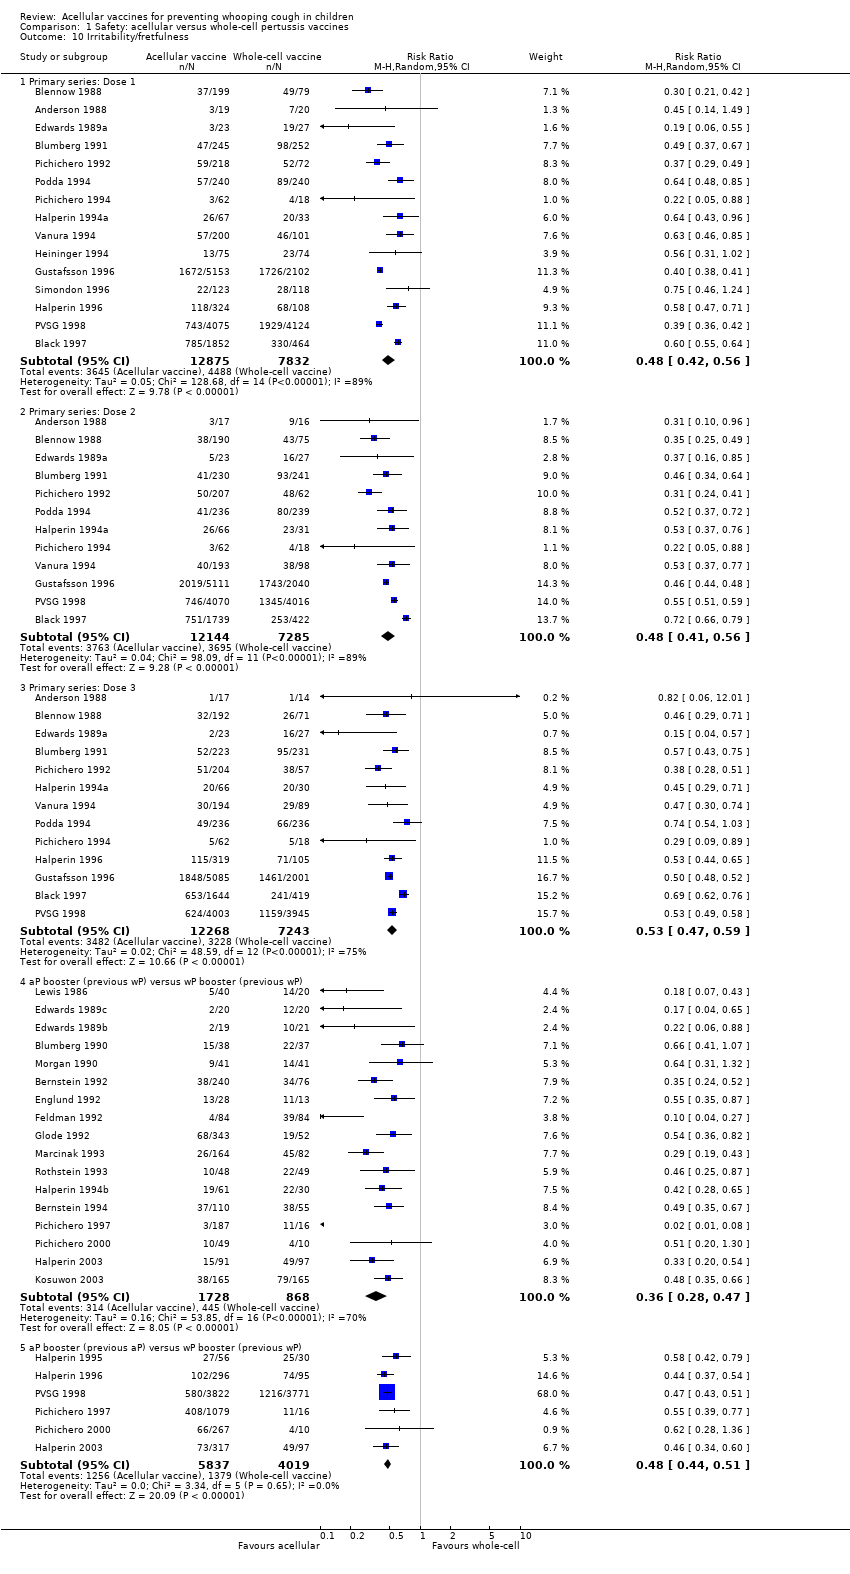
Comparison 1 Safety: acellular versus whole‐cell pertussis vaccines, Outcome 10 Irritability/fretfulness.
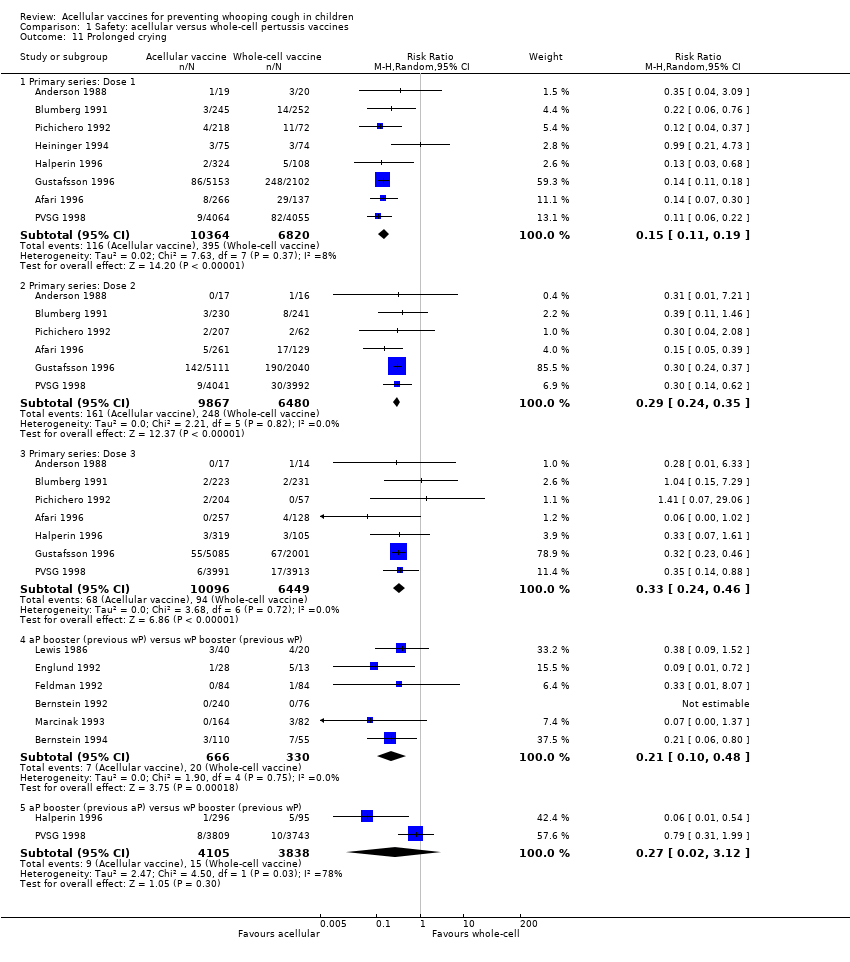
Comparison 1 Safety: acellular versus whole‐cell pertussis vaccines, Outcome 11 Prolonged crying.

Comparison 1 Safety: acellular versus whole‐cell pertussis vaccines, Outcome 12 Vomiting.

Comparison 1 Safety: acellular versus whole‐cell pertussis vaccines, Outcome 13 Pain/tenderness.
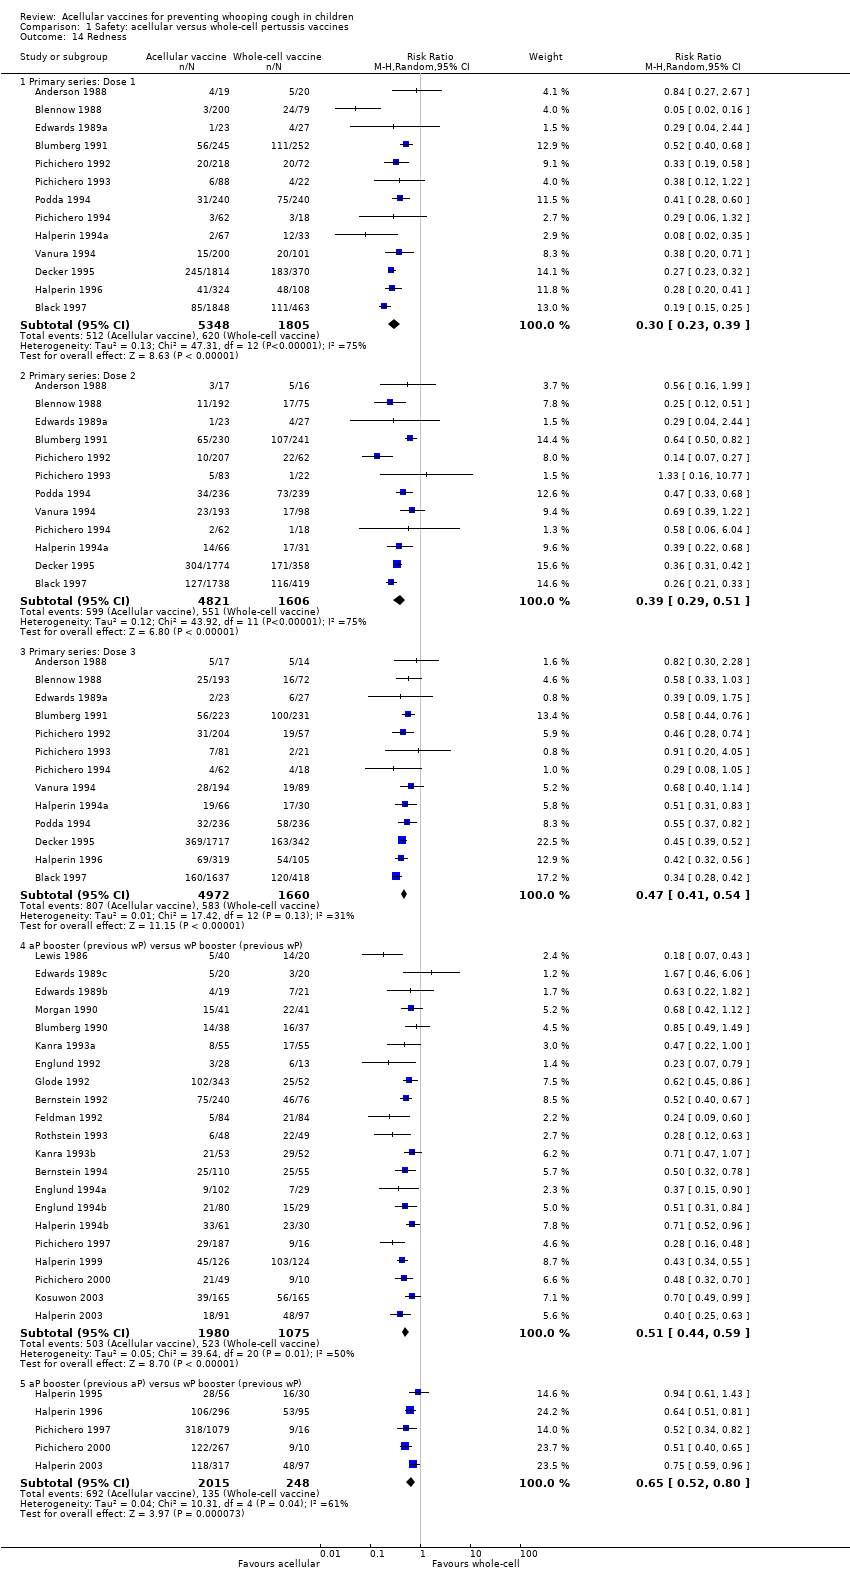
Comparison 1 Safety: acellular versus whole‐cell pertussis vaccines, Outcome 14 Redness.
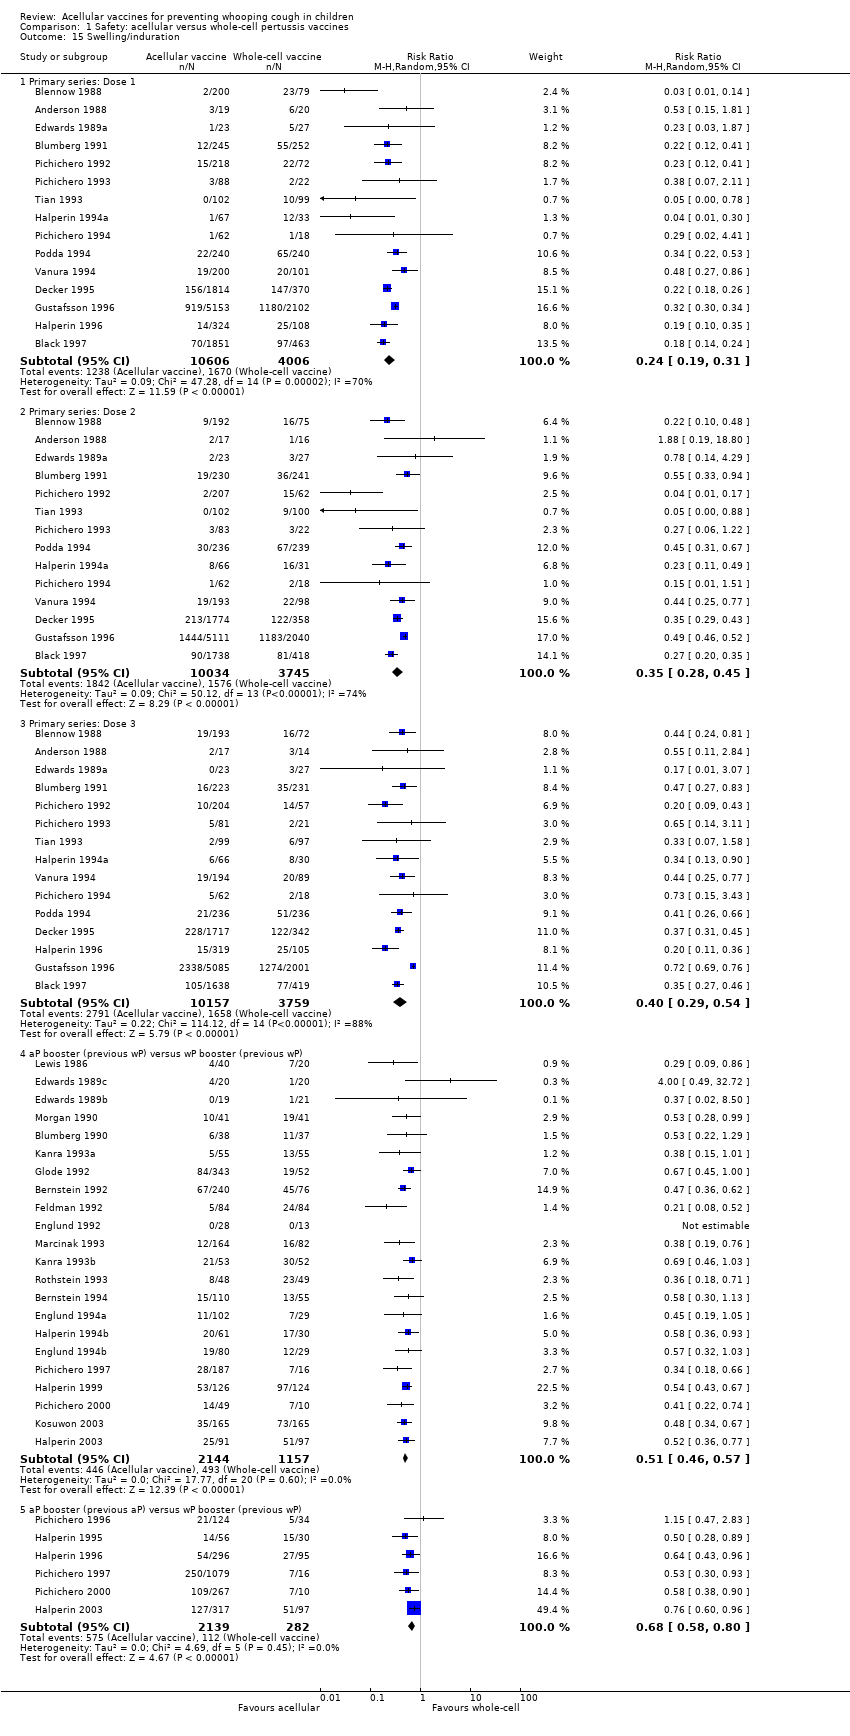
Comparison 1 Safety: acellular versus whole‐cell pertussis vaccines, Outcome 15 Swelling/induration.

Comparison 2 Safety: acellular vaccines versus placebo/DT, Outcome 1 Primary series non‐completion due to adverse events.

Comparison 2 Safety: acellular vaccines versus placebo/DT, Outcome 2 Death (all causes).

Comparison 2 Safety: acellular vaccines versus placebo/DT, Outcome 3 Death (infection).

Comparison 2 Safety: acellular vaccines versus placebo/DT, Outcome 4 Encephalopathy.
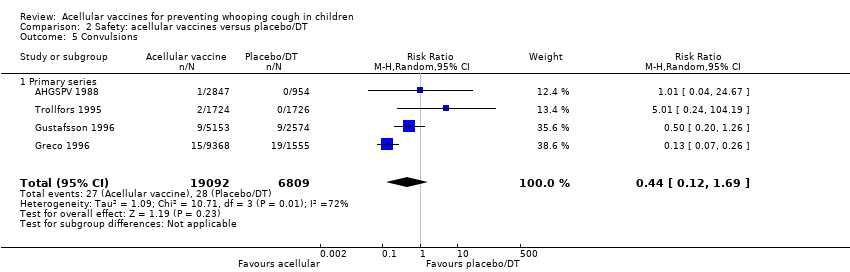
Comparison 2 Safety: acellular vaccines versus placebo/DT, Outcome 5 Convulsions.

Comparison 2 Safety: acellular vaccines versus placebo/DT, Outcome 6 Hypotonic hyporesponsive episodes.

Comparison 2 Safety: acellular vaccines versus placebo/DT, Outcome 7 Anorexia.
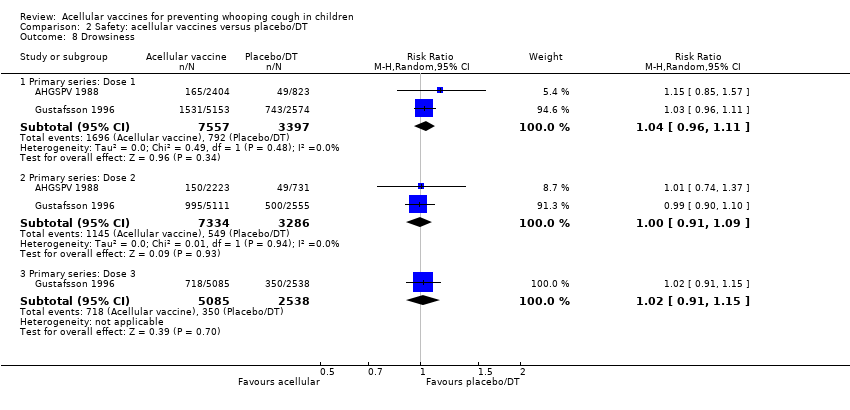
Comparison 2 Safety: acellular vaccines versus placebo/DT, Outcome 8 Drowsiness.
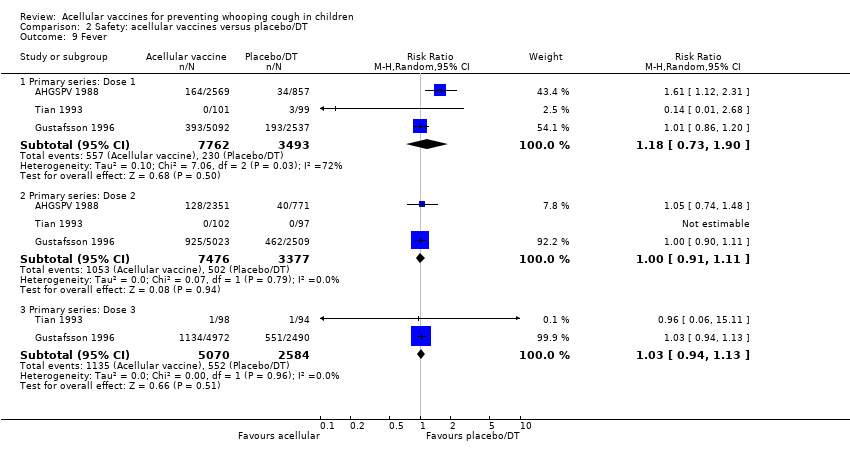
Comparison 2 Safety: acellular vaccines versus placebo/DT, Outcome 9 Fever.
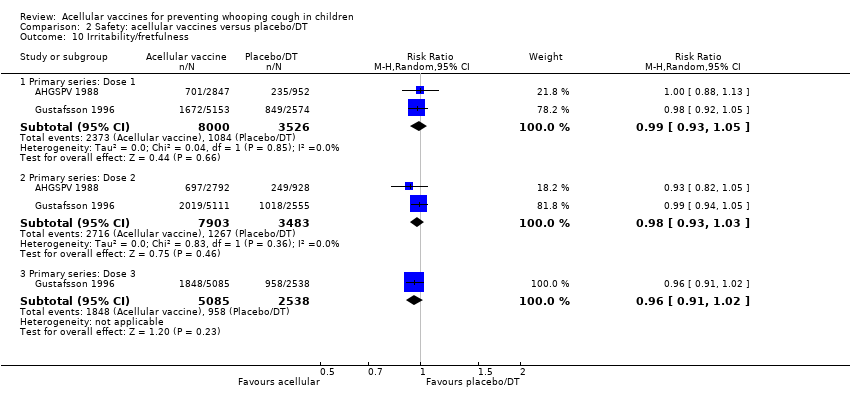
Comparison 2 Safety: acellular vaccines versus placebo/DT, Outcome 10 Irritability/fretfulness.

Comparison 2 Safety: acellular vaccines versus placebo/DT, Outcome 11 Prolonged crying.
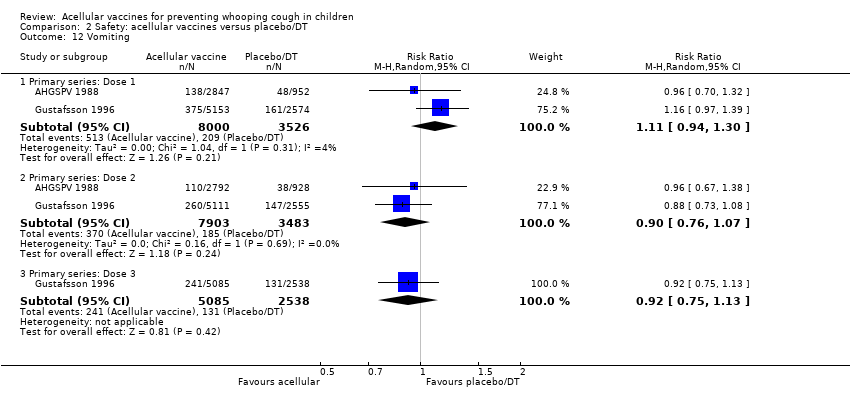
Comparison 2 Safety: acellular vaccines versus placebo/DT, Outcome 12 Vomiting.
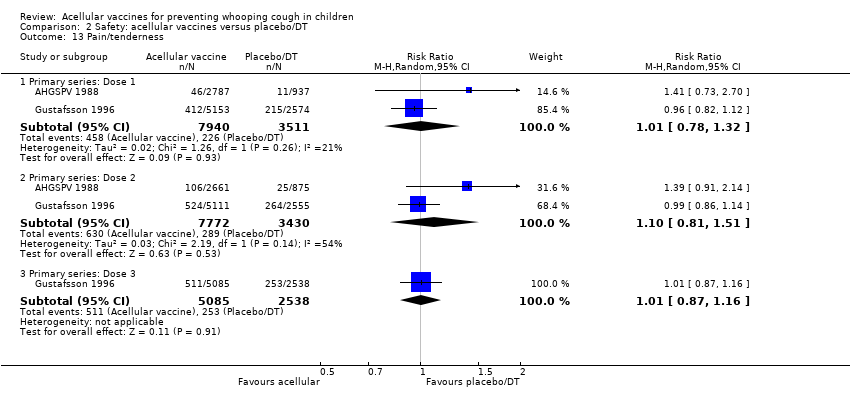
Comparison 2 Safety: acellular vaccines versus placebo/DT, Outcome 13 Pain/tenderness.

Comparison 2 Safety: acellular vaccines versus placebo/DT, Outcome 14 Swelling/induration.
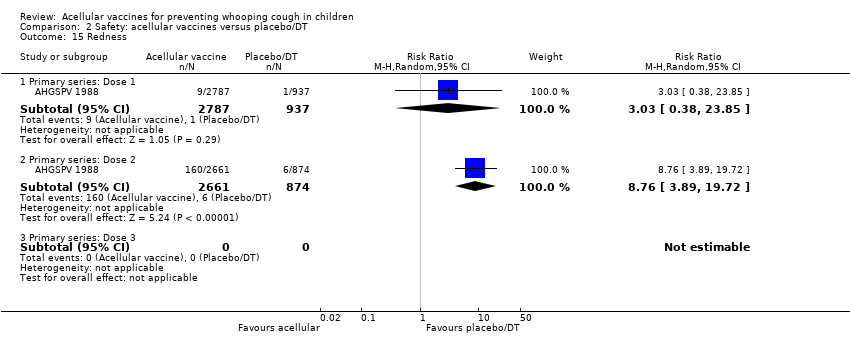
Comparison 2 Safety: acellular vaccines versus placebo/DT, Outcome 15 Redness.
| Outcome or subgroup title | No. of studies | No. of participants | Statistical method | Effect size |
| 1 Primary series non‐completion due to adverse events Show forest plot | 14 | 108909 | Risk Ratio (M‐H, Random, 95% CI) | 0.23 [0.12, 0.43] |
| 2 Death (all causes) Show forest plot | 16 | 122451 | Risk Ratio (M‐H, Random, 95% CI) | 0.87 [0.62, 1.22] |
| 2.1 Primary series | 16 | 122451 | Risk Ratio (M‐H, Random, 95% CI) | 0.87 [0.62, 1.22] |
| 3 Death (infection) Show forest plot | 13 | 34498 | Risk Ratio (M‐H, Random, 95% CI) | 0.97 [0.23, 4.16] |
| 3.1 Primary series | 13 | 34498 | Risk Ratio (M‐H, Random, 95% CI) | 0.97 [0.23, 4.16] |
| 4 Encephalopathy Show forest plot | 9 | 113762 | Risk Ratio (M‐H, Random, 95% CI) | 0.0 [0.0, 0.0] |
| 4.1 Primary series | 9 | 113762 | Risk Ratio (M‐H, Random, 95% CI) | 0.0 [0.0, 0.0] |
| 5 Convulsions Show forest plot | 26 | Risk Ratio (M‐H, Random, 95% CI) | Subtotals only | |
| 5.1 Primary series | 15 | 124387 | Risk Ratio (M‐H, Random, 95% CI) | 0.47 [0.31, 0.73] |
| 5.2 Booster | 11 | 2647 | Risk Ratio (M‐H, Random, 95% CI) | 0.46 [0.02, 11.20] |
| 6 Hypotonic hyporesponsive episodes Show forest plot | 18 | Risk Ratio (M‐H, Random, 95% CI) | Subtotals only | |
| 6.1 Primary series | 11 | 121573 | Risk Ratio (M‐H, Random, 95% CI) | 0.26 [0.08, 0.81] |
| 6.2 Booster | 7 | 2487 | Risk Ratio (M‐H, Random, 95% CI) | 0.0 [0.0, 0.0] |
| 7 Anorexia Show forest plot | 26 | Risk Ratio (M‐H, Random, 95% CI) | Subtotals only | |
| 7.1 Primary series: Dose 1 | 11 | 19632 | Risk Ratio (M‐H, Random, 95% CI) | 0.43 [0.32, 0.57] |
| 7.2 Primary series: Dose 2 | 8 | 18501 | Risk Ratio (M‐H, Random, 95% CI) | 0.45 [0.33, 0.60] |
| 7.3 Primary series: Dose 3 | 9 | 18646 | Risk Ratio (M‐H, Random, 95% CI) | 0.50 [0.43, 0.60] |
| 7.4 aP booster (previous wP) versus wP booster (previous wP) | 14 | 1939 | Risk Ratio (M‐H, Random, 95% CI) | 0.40 [0.30, 0.54] |
| 7.5 aP booster (previous aP) versus wP booster (previous wP) | 4 | 8447 | Risk Ratio (M‐H, Random, 95% CI) | 0.42 [0.31, 0.58] |
| 8 Drowsiness Show forest plot | 25 | Risk Ratio (M‐H, Random, 95% CI) | Subtotals only | |
| 8.1 Primary series: Dose 1 | 12 | 20490 | Risk Ratio (M‐H, Random, 95% CI) | 0.55 [0.45, 0.68] |
| 8.2 Primary series: Dose 2 | 9 | 19308 | Risk Ratio (M‐H, Random, 95% CI) | 0.46 [0.35, 0.60] |
| 8.3 Primary series: Dose 3 | 10 | 19430 | Risk Ratio (M‐H, Random, 95% CI) | 0.56 [0.40, 0.77] |
| 8.4 aP booster (previous wP) versus wP booster (previous wP) | 13 | 2254 | Risk Ratio (M‐H, Random, 95% CI) | 0.48 [0.41, 0.56] |
| 8.5 aP booster (previous aP) versus wP booster (previous wP) | 3 | 8367 | Risk Ratio (M‐H, Random, 95% CI) | 0.49 [0.44, 0.54] |
| 9 Fever Show forest plot | 46 | Risk Ratio (M‐H, Random, 95% CI) | Subtotals only | |
| 9.1 Primary series: Dose 1 | 19 | 23267 | Risk Ratio (M‐H, Random, 95% CI) | 0.17 [0.13, 0.20] |
| 9.2 Primary series: Dose 2 | 17 | 22001 | Risk Ratio (M‐H, Random, 95% CI) | 0.31 [0.26, 0.37] |
| 9.3 Primary series: Dose 3 | 17 | 21731 | Risk Ratio (M‐H, Random, 95% CI) | 0.34 [0.30, 0.38] |
| 9.4 aP booster (previous wP) versus wP booster (previous wP) | 24 | 3381 | Risk Ratio (M‐H, Random, 95% CI) | 0.33 [0.26, 0.43] |
| 9.5 aP booster (previous aP) versus wP booster (previous wP) | 8 | 9879 | Risk Ratio (M‐H, Random, 95% CI) | 0.35 [0.22, 0.55] |
| 10 Irritability/fretfulness Show forest plot | 33 | Risk Ratio (M‐H, Random, 95% CI) | Subtotals only | |
| 10.1 Primary series: Dose 1 | 15 | 20707 | Risk Ratio (M‐H, Random, 95% CI) | 0.48 [0.42, 0.56] |
| 10.2 Primary series: Dose 2 | 12 | 19429 | Risk Ratio (M‐H, Random, 95% CI) | 0.48 [0.41, 0.56] |
| 10.3 Primary series: Dose 3 | 13 | 19511 | Risk Ratio (M‐H, Random, 95% CI) | 0.53 [0.47, 0.59] |
| 10.4 aP booster (previous wP) versus wP booster (previous wP) | 17 | 2596 | Risk Ratio (M‐H, Random, 95% CI) | 0.36 [0.28, 0.47] |
| 10.5 aP booster (previous aP) versus wP booster (previous wP) | 6 | 9856 | Risk Ratio (M‐H, Random, 95% CI) | 0.48 [0.44, 0.51] |
| 11 Prolonged crying Show forest plot | 14 | Risk Ratio (M‐H, Random, 95% CI) | Subtotals only | |
| 11.1 Primary series: Dose 1 | 8 | 17184 | Risk Ratio (M‐H, Random, 95% CI) | 0.15 [0.11, 0.19] |
| 11.2 Primary series: Dose 2 | 6 | 16347 | Risk Ratio (M‐H, Random, 95% CI) | 0.29 [0.24, 0.35] |
| 11.3 Primary series: Dose 3 | 7 | 16545 | Risk Ratio (M‐H, Random, 95% CI) | 0.33 [0.24, 0.46] |
| 11.4 aP booster (previous wP) versus wP booster (previous wP) | 6 | 996 | Risk Ratio (M‐H, Random, 95% CI) | 0.21 [0.10, 0.48] |
| 11.5 aP booster (previous aP) versus wP booster (previous wP) | 2 | 7943 | Risk Ratio (M‐H, Random, 95% CI) | 0.27 [0.02, 3.12] |
| 12 Vomiting Show forest plot | 15 | Risk Ratio (M‐H, Random, 95% CI) | Subtotals only | |
| 12.1 Primary series: Dose 1 | 8 | 11450 | Risk Ratio (M‐H, Random, 95% CI) | 0.77 [0.66, 0.88] |
| 12.2 Primary series: Dose 2 | 7 | 10985 | Risk Ratio (M‐H, Random, 95% CI) | 0.62 [0.45, 0.86] |
| 12.3 Primary series: Dose 3 | 7 | 10813 | Risk Ratio (M‐H, Random, 95% CI) | 0.69 [0.46, 1.04] |
| 12.4 aP booster (previous wP) versus wP booster (previous wP) | 6 | 744 | Risk Ratio (M‐H, Random, 95% CI) | 0.50 [0.22, 1.11] |
| 12.5 aP booster (previous aP) versus wP booster (previous wP) | 1 | 86 | Risk Ratio (M‐H, Random, 95% CI) | 1.07 [0.10, 11.34] |
| 13 Pain/tenderness Show forest plot | 35 | Risk Ratio (M‐H, Random, 95% CI) | Subtotals only | |
| 13.1 Primary series: Dose 1 | 13 | 14180 | Risk Ratio (M‐H, Random, 95% CI) | 0.20 [0.16, 0.25] |
| 13.2 Primary series: Dose 2 | 11 | 13186 | Risk Ratio (M‐H, Random, 95% CI) | 0.18 [0.15, 0.22] |
| 13.3 Primary series: Dose 3 | 12 | 13333 | Risk Ratio (M‐H, Random, 95% CI) | 0.20 [0.17, 0.24] |
| 13.4 aP booster (previous wP) versus wP booster (previous wP) | 21 | 3051 | Risk Ratio (M‐H, Random, 95% CI) | 0.43 [0.36, 0.53] |
| 13.5 aP booster (previous aP) versus wP booster (previous wP) | 5 | 2263 | Risk Ratio (M‐H, Random, 95% CI) | 0.43 [0.32, 0.58] |
| 14 Redness Show forest plot | 35 | Risk Ratio (M‐H, Random, 95% CI) | Subtotals only | |
| 14.1 Primary series: Dose 1 | 13 | 7153 | Risk Ratio (M‐H, Random, 95% CI) | 0.30 [0.23, 0.39] |
| 14.2 Primary series: Dose 2 | 12 | 6427 | Risk Ratio (M‐H, Random, 95% CI) | 0.39 [0.29, 0.51] |
| 14.3 Primary series: Dose 3 | 13 | 6632 | Risk Ratio (M‐H, Random, 95% CI) | 0.47 [0.41, 0.54] |
| 14.4 aP booster (previous wP) versus wP booster (previous wP) | 21 | 3055 | Risk Ratio (M‐H, Random, 95% CI) | 0.51 [0.44, 0.59] |
| 14.5 aP booster (previous aP) versus wP booster (previous wP) | 5 | 2263 | Risk Ratio (M‐H, Random, 95% CI) | 0.65 [0.52, 0.80] |
| 15 Swelling/induration Show forest plot | 39 | Risk Ratio (M‐H, Random, 95% CI) | Subtotals only | |
| 15.1 Primary series: Dose 1 | 15 | 14612 | Risk Ratio (M‐H, Random, 95% CI) | 0.24 [0.19, 0.31] |
| 15.2 Primary series: Dose 2 | 14 | 13779 | Risk Ratio (M‐H, Random, 95% CI) | 0.35 [0.28, 0.45] |
| 15.3 Primary series: Dose 3 | 15 | 13916 | Risk Ratio (M‐H, Random, 95% CI) | 0.40 [0.29, 0.54] |
| 15.4 aP booster (previous wP) versus wP booster (previous wP) | 22 | 3301 | Risk Ratio (M‐H, Random, 95% CI) | 0.51 [0.46, 0.57] |
| 15.5 aP booster (previous aP) versus wP booster (previous wP) | 6 | 2421 | Risk Ratio (M‐H, Random, 95% CI) | 0.68 [0.58, 0.80] |
| Outcome or subgroup title | No. of studies | No. of participants | Statistical method | Effect size |
| 1 Primary series non‐completion due to adverse events Show forest plot | 4 | 25901 | Risk Ratio (M‐H, Random, 95% CI) | 0.70 [0.38, 1.29] |
| 2 Death (all causes) Show forest plot | 4 | 25901 | Risk Ratio (M‐H, Random, 95% CI) | 1.08 [0.26, 4.42] |
| 2.1 Primary series | 4 | 25901 | Risk Ratio (M‐H, Random, 95% CI) | 1.08 [0.26, 4.42] |
| 3 Death (infection) Show forest plot | 4 | 25902 | Risk Ratio (M‐H, Random, 95% CI) | 1.21 [0.19, 7.80] |
| 3.1 Primary series | 4 | 25902 | Risk Ratio (M‐H, Random, 95% CI) | 1.21 [0.19, 7.80] |
| 4 Encephalopathy Show forest plot | 2 | 18650 | Risk Ratio (M‐H, Random, 95% CI) | 0.0 [0.0, 0.0] |
| 4.1 Primary series | 2 | 18650 | Risk Ratio (M‐H, Random, 95% CI) | 0.0 [0.0, 0.0] |
| 5 Convulsions Show forest plot | 4 | 25901 | Risk Ratio (M‐H, Random, 95% CI) | 0.44 [0.12, 1.69] |
| 5.1 Primary series | 4 | 25901 | Risk Ratio (M‐H, Random, 95% CI) | 0.44 [0.12, 1.69] |
| 6 Hypotonic hyporesponsive episodes Show forest plot | 4 | 25901 | Risk Ratio (M‐H, Random, 95% CI) | 0.29 [0.02, 5.13] |
| 6.1 Primary series | 4 | 25901 | Risk Ratio (M‐H, Random, 95% CI) | 0.29 [0.02, 5.13] |
| 7 Anorexia Show forest plot | 2 | Risk Ratio (M‐H, Random, 95% CI) | Subtotals only | |
| 7.1 Primary series: Dose 1 | 2 | 11526 | Risk Ratio (M‐H, Random, 95% CI) | 1.06 [0.93, 1.20] |
| 7.2 Primary series: Dose 2 | 2 | 11386 | Risk Ratio (M‐H, Random, 95% CI) | 0.99 [0.66, 1.46] |
| 7.3 Primary series: Dose 3 | 1 | 7623 | Risk Ratio (M‐H, Random, 95% CI) | 1.07 [0.91, 1.26] |
| 8 Drowsiness Show forest plot | 2 | Risk Ratio (M‐H, Random, 95% CI) | Subtotals only | |
| 8.1 Primary series: Dose 1 | 2 | 10954 | Risk Ratio (M‐H, Random, 95% CI) | 1.04 [0.96, 1.11] |
| 8.2 Primary series: Dose 2 | 2 | 10620 | Risk Ratio (M‐H, Random, 95% CI) | 1.00 [0.91, 1.09] |
| 8.3 Primary series: Dose 3 | 1 | 7623 | Risk Ratio (M‐H, Random, 95% CI) | 1.02 [0.91, 1.15] |
| 9 Fever Show forest plot | 3 | Risk Ratio (M‐H, Random, 95% CI) | Subtotals only | |
| 9.1 Primary series: Dose 1 | 3 | 11255 | Risk Ratio (M‐H, Random, 95% CI) | 1.18 [0.73, 1.90] |
| 9.2 Primary series: Dose 2 | 3 | 10853 | Risk Ratio (M‐H, Random, 95% CI) | 1.00 [0.91, 1.11] |
| 9.3 Primary series: Dose 3 | 2 | 7654 | Risk Ratio (M‐H, Random, 95% CI) | 1.03 [0.94, 1.13] |
| 10 Irritability/fretfulness Show forest plot | 2 | Risk Ratio (M‐H, Random, 95% CI) | Subtotals only | |
| 10.1 Primary series: Dose 1 | 2 | 11526 | Risk Ratio (M‐H, Random, 95% CI) | 0.99 [0.93, 1.05] |
| 10.2 Primary series: Dose 2 | 2 | 11386 | Risk Ratio (M‐H, Random, 95% CI) | 0.98 [0.93, 1.03] |
| 10.3 Primary series: Dose 3 | 1 | 7623 | Risk Ratio (M‐H, Random, 95% CI) | 0.96 [0.91, 1.02] |
| 11 Prolonged crying Show forest plot | 2 | Risk Ratio (M‐H, Random, 95% CI) | Subtotals only | |
| 11.1 Primary series: Dose 1 | 2 | 11525 | Risk Ratio (M‐H, Random, 95% CI) | 1.29 [0.71, 2.34] |
| 11.2 Primary series: Dose 2 | 2 | 11386 | Risk Ratio (M‐H, Random, 95% CI) | 1.08 [0.83, 1.40] |
| 11.3 Primary series: Dose 3 | 1 | 7623 | Risk Ratio (M‐H, Random, 95% CI) | 1.06 [0.66, 1.68] |
| 12 Vomiting Show forest plot | 2 | Risk Ratio (M‐H, Random, 95% CI) | Subtotals only | |
| 12.1 Primary series: Dose 1 | 2 | 11526 | Risk Ratio (M‐H, Random, 95% CI) | 1.11 [0.94, 1.30] |
| 12.2 Primary series: Dose 2 | 2 | 11386 | Risk Ratio (M‐H, Random, 95% CI) | 0.90 [0.76, 1.07] |
| 12.3 Primary series: Dose 3 | 1 | 7623 | Risk Ratio (M‐H, Random, 95% CI) | 0.92 [0.75, 1.13] |
| 13 Pain/tenderness Show forest plot | 2 | Risk Ratio (M‐H, Random, 95% CI) | Subtotals only | |
| 13.1 Primary series: Dose 1 | 2 | 11451 | Risk Ratio (M‐H, Random, 95% CI) | 1.01 [0.78, 1.32] |
| 13.2 Primary series: Dose 2 | 2 | 11202 | Risk Ratio (M‐H, Random, 95% CI) | 1.10 [0.81, 1.51] |
| 13.3 Primary series: Dose 3 | 1 | 7623 | Risk Ratio (M‐H, Random, 95% CI) | 1.01 [0.87, 1.16] |
| 14 Swelling/induration Show forest plot | 3 | Risk Ratio (M‐H, Random, 95% CI) | Subtotals only | |
| 14.1 Primary series: Dose 1 | 3 | 11652 | Risk Ratio (M‐H, Random, 95% CI) | 1.29 [0.62, 2.68] |
| 14.2 Primary series: Dose 2 | 3 | 11401 | Risk Ratio (M‐H, Random, 95% CI) | 2.08 [0.54, 8.01] |
| 14.3 Primary series: Dose 3 | 2 | 7816 | Risk Ratio (M‐H, Random, 95% CI) | 1.13 [1.07, 1.20] |
| 15 Redness Show forest plot | 1 | Risk Ratio (M‐H, Random, 95% CI) | Subtotals only | |
| 15.1 Primary series: Dose 1 | 1 | 3724 | Risk Ratio (M‐H, Random, 95% CI) | 3.03 [0.38, 23.85] |
| 15.2 Primary series: Dose 2 | 1 | 3535 | Risk Ratio (M‐H, Random, 95% CI) | 8.76 [3.89, 19.72] |
| 15.3 Primary series: Dose 3 | 0 | 0 | Risk Ratio (M‐H, Random, 95% CI) | 0.0 [0.0, 0.0] |