Vacunas acelulares para prevenir la tos ferina en niños
Appendices
Appendix 1. Initial search 1997 and 1998
The initial search was carried out in March 1997 and updated in March 1998, covering the period up to and including January 1998. The databases used were MEDLINE (Medline SilverPlatter CD‐ROM) and the Cochrane Central Register of Controlled Trials (CENTRAL). We searched CENTRAL using the term 'pertus* OR whoop*'. We searched MEDLINE using the following strategy:
1. explode PERTUSSIS‐VACCINE / all subheadings
2. explode BORDETELLA‐PERTUSSIS / all subheadings
3. explode WHOOPING‐COUGH / all subheadings
4. PERTUS*
5. WHOOP*
6. #1 or #2 or #3 or #4 or #5
The files downloaded from MEDLINE SilverPlatter were screened for randomised controlled trials using the RCT FILTER.
Appendix 2. April 2009 updated search strategies
In the 2009 updated review we searched the Cochrane Central Register of Controlled Trials (CENTRAL) (The Cochrane Library 2009, Issue 2), which contains the Cochrane Acute Respiratory Infections Group's Specialised Register, MEDLINE (1950 to April week 2 2009) and EMBASE.com (1974 to April 2009).
We used the following search strategy to search MEDLINE and CENTRAL. The MEDLINE search was combined with the Cochrane Highly Sensitive Search Strategy for identifying randomized trials in MEDLINE: sensitivity‐ and precision‐ maximising version (2008 revision); Ovid format (Lefebvre 2011). We modified the search strategy to search Embase.com (see below).
MEDLINE (Ovid)
1 exp Pertussis Vaccine/
2 pertussis vaccin*.tw.
3 Whooping Cough/
4 whoop*.tw.
5 Bordetella pertussis/
6 pertuss*.tw.
7 1 or 2 or 3 or 4 or 5 or 6
8 exp Vaccines, Acellular/
9 (acellular adj5 vaccin*).tw.
10 8 or 9
11 7 and 10
EMBASE.com
1. 'pertussis vaccine'/de
2. 'diphtheria pertussis tetanus vaccine'/de
3. 'diphtheria pertussis poliomyelitis tetanus vaccine'/de
4. 'diphtheria pertussis tetanus haemophilus influenzae type b hepatitis b vaccine'/de
5. 'diphtheria pertussis tetanus haemophilus influenzae type b vaccine'/de
6. 'bordetella pertussis'/de
7. 'pertussis'/de
8. 'dpt vaccine':ti,ab
9. pertuss*:ti,ab
10. whoop*:ti,ab
11. #1 OR #2 OR #3 OR #4 OR #5 OR #6 OR #7 OR #8 OR #9 OR #10
12. 'acellular vaccine'/de
13. (acellular:ti,ab AND vaccin*:ti,ab)
14. #12 OR #13
15. #11 AND #14
16. 'randomized controlled trial'/de
17. 'controlled clinical trial'/de
18. 'single blind procedure'/de
19. 'double blind procedure'/de
20. 'phase 3 clinical trial'/de
21. random*:ti,ab
22. placebo*:ti,ab
23. 'clinical trial':it
24. 'randomized controlled trial':it
25. (singl*:ti,ab OR doubl*:ti,ab OR trebl*:ti,ab OR tripl*:ti,ab) AND (mask*:ti,ab OR blind*:ti,ab)
26. 'controlled clinical trial':ti,ab
27. 'controlled clinical trials':ti,ab
28. #16 OR #17 OR #18 OR #19 OR #20 OR #21 OR #22 OR #23 OR #24 OR #25 OR #26 OR #27
29. ('nonhuman'/exp OR 'animal'/exp) NOT 'human'/exp
30. #28 NOT #29
31. #15 AND #30
Appendix 3. MEDLINE search strategy
1 exp Pertussis Vaccine/
2 pertussis vaccin*.tw.
3 Whooping Cough/
4 whoop*.tw.
5 Bordetella pertussis/
6 pertuss*.tw.
7 1 or 2 or 3 or 4 or 5 or 6
8 exp Vaccines, Acellular/
9 (acellular adj5 vaccin*).tw.
10 8 or 9
11 7 and 10
Appendix 4. EMBASE search strategy
#14. #10 AND #13 269 17 May 2011
#13. #11 OR #12 861,917 17 May 2011
#12. random*:ab,ti OR placebo*:ab,ti OR factorial*:ab,ti OR crossover*:ab,ti OR 'cross over':ab,ti OR 'cross‐over':ab,ti OR volunteer*:ab,ti OR assign*:ab,ti OR allocat*:ab,ti OR ((singl* OR doubl*) NEAR/1
blind*):ab,ti AND [embase]/lim 822,212 17 May 2011
#11. 'randomized controlled trial'/exp OR 'single blind procedure'/exp OR 'double blind procedure'/exp OR 'crossover procedure'/exp AND [embase]/lim 241,991 17 May 2011
#10. #6 AND #9 1,393 17 May 2011
#9. #7 OR #8 1,451 17 May 2011
#8. (acellular NEAR/5 vaccin*):ab,ti AND [embase]/lim 1,321 17 May 2011
#7. 'acellular vaccine'/de AND [embase]/lim 271 17 May 2011
#6. #1 OR #2 OR #3 OR #4 OR #5 25,318 17 May 2011
#5. pertuss*:ab,ti OR whoop*:ab,ti AND [embase]/lim 19,626 17 May 2011
#4. 'bordetella pertussis'/de AND [embase]/lim 4,046 17 May 2011
#3. 'pertussis'/de AND [embase]/lim 5,903 17 May 2011
#2. 'diphtheria pertussis tetanus vaccine'/de OR 'diphtheria pertussis tetanus hepatitis b vaccine'/de OR 'diphtheria pertussis tetanus haemophilus influenzae type b vaccine'/de OR
'diphtheria pertussis tetanus haemophilus influenzae type b hepatitis b vaccine'/de OR 'diphtheria pertussis poliomyelitis tetanus vaccine'/de OR 'diphtheria pertussis poliomyelitis tetanus hepatitis b vaccine'/de OR 'diphtheria pertussis poliomyelitis tetanus haemophilus influenzae type b hepatitis b vaccine'/de AND [embase]/lim 5,402 17 May 2011
#1. 'pertussis vaccine'/de AND [embase]/lim 4,338 17 May 2011
Appendix 5. Biosis Previews (Thomson ISI)
Topic=(pertuss* or whoop* or bordetella*) AND Topic=(acellular vaccin*)
Refined by: Topic=(random* or placebo* or clinical trial* or singl* blind* or doubl* blind*)
Appendix 6. CINAHL (Ebsco)
S18 S7 and S16
S17 S7 and S16
S16 S8 or S9 or S10 or S11 or S12 or S13 or S14 or S15
S15 (MH "Quantitative Studies")
S14 (MH "Placebos")
S13 TI placebo* or AB placebo*
S12 TI random* or AB random*
S11 TI ( singl* blind* or doubl* blind* or tripl* blind* or trebl* blind* or singl* mask* or doubl* mask* or tripl* mask* or trebl* mask* ) or AB (singl* blind* or doubl* blind* or tripl* blind* or trebl* blind* or singl*
mask* or doubl* mask* or tripl* mask* or trebl* mask* )
S10 TI clinic* trial* or AB clinic* trial*
S9 PT clinical trial
S8 (MH "Clinical Trials+")
S7 S5 and S6 Search modes
S6 TI acellular N5 vaccin* or AB acellular N5 vaccin*
S5 S1 or S2 or S3 or S4
S4 TI ( whoop* or pertuss* ) or AB ( whoop* or pertuss* )
S3 (MH "Bordetella Pertussis")
S2 (MH "Whooping Cough")
S1 (MH "Pertussis Vaccine+")
Appendix 7. Comparison of results between the first published (primary) review and the updated reviews
Minor adverse events: acellular vaccines versus whole‐cell vaccines
| Outcomes | Number of trials
Primary Update | Sample size (n)
Primary Update | Effect size ‐ RR (95% CI)
Primary Update |
| Anorexia Primary dose 1 Primary dose 2 Primary dose 3 aP booster (pre wP) aP booster (pre aP) | 10 11 7 8 8 9 11 14 3 4 |
13,942 19,632 18,232 18,501 18,385 18,646 1380 1939 8033 8447 |
0.47 (0.35 to 0.64) 0.43 (0.32 to 0.57) 0.50 (0.37 to 0.67) 0.45 (0.33 to 0.60) 0.52 (0.45 to 0.61) 0.50 (0.43 to 0.60) 0.35 (0.24 to 0.51) 0.40 (0.30 to 0.54) 0.41 (0.26 to 0.64) 0.42 (0.31 to 0.58) |
| Drowsiness Primary dose 1 Primary dose 2 Primary dose 3 aP booster (pre wP) aP booster (pre aP) |
11 12 7 8 8 9 10 14 2 3 |
20,200 20,490 19,039 19,308 19,169 19,430 1695 2254 7953 8367 |
0.74 (0.50 to 1.09) 0.72 (0.50 to 1.03) 0.67 (0.43 to 1.03) 0.61 (0.41 to 0.93) 0.56 (0.40 to 0.79) 0.56 (0.40 to 0.77) 0.43 (0.34 to 0.53) 0.48 (0.41 to 0.56) 0.50 (0.45 to 0.55) 0.49 (0.44 to 0.54) |
| Fever Primary dose 1 Primary dose 2 Primary dose 3 aP booster (pre wP) aP booster (pre aP) |
18 19 15 17 15 17 19 25 5 8 |
22,977 23,267 21,652 22,001 21,390 21,731 2513 3381 9012 9879 |
0.17 (0.13 to 0.21) 0.17 (0.13 to 0.20) 0.31(0.25 to 0.37) 0.31 (0.26 to 0.37) 0.34 (0.29 to 0.38) 0.34 (0.30 to 0.38) 0.33 (0.24 to 0.45) 0.33 (0.26 to 0.43) 0.38 (0.21 to 0.68) 0.35 (0.22 to 0.55) |
| Irritability/fretfulness Primary dose 1 Primary dose 2 Primary dose 3 aP booster (pre wP) aP booster (pre aP) |
13 15 10 12 11 13 13 16 4 6 |
20,337 20,707 19,080 19,429 19,170 19,511 1978 2596 9165 9856 |
0.50 (0.43 to 0.58) 0.48 (0.42 to 0.56) 0.51 (0.43 to 0.60) 0.48 (0.41 to 0.56) 0.55 (0.49 to 0.62) 0.53 (0.47 to 0.59) 0.32 (0.23 to 0.45) 0.36 (0.28 to 0.47) 0.48 (0.44 to 0.51) 0.48 (0.44 to 0.51) |
| Prolonged crying Primary dose 1 Primary dose 2 Primary dose 3 aP booster (pre wP) aP booster (pre aP) |
7 8 5 6 6 7 4 7 2 2 |
16,849 17,184 16,078 16,347 16,248 16,545 955 996 7943 7943 |
0.14 (0.12 to 0.18) 0.15 (0.11 to 0.19) 0.29 (0.24 to 0.35) 0.29 (0.24 to 0.35) 0.32 (0.24 to 0.44) 0.33 (0.24 to 0.46) 0.23 (0.10 to 0.55) 0.21 (0.10 to 0.48) 0.48 (0.22 to 1.02) 0.27 (0.02 to 3.12) |
| Vomiting Primary dose 1 Primary dose 2 Primary dose 3 aP booster (pre wP) aP booster (pre aP) |
7 8 6 7 5 6 5 6 1 1 |
11,160 11,450 10,716 10,985 10,552 10,813 703 744 86 86 |
0.78 (0.67 to 0.90) 0.77 (0.66 to 0.88) 0.71 (0.60 to 0.85) 0.62 (0.45 to 0.86) 0.80 (0.66 to 0.97) 0.69 (0.46 to 1.04) 0.35 (0.15 to 0.82) 0.50 (0.22 to 1.11) 1.07 (0.10 to 11.34) 1.07 (0.10 to 11.34) |
| Pain/tenderness Primary dose 1 Primary dose 2 Primary dose 3 aP booster (pre wP) aP booster (pre aP) |
10 13 8 11 9 12 16 21 3 5 |
11,683 14,180 10,710 13,186 10,938 13,333 2433 3051 1572 2263 |
0.21 (0.16 to 0.28) 0.20 (0.16 to 0.25) 0.19 (0.16 to 0.22) 0.18 (0.15 to 0.22) 0.21 (0.19 to 0.25) 0.20 (0.17 to 0.24) 0.40 (0.31 to 0.51) 0.43 (0.36 to 0.53) 0.36 (0.26 to 0.49) 0.43 (0.32 to 0.58) |
| Redness Primary dose 1 Primary dose 2 Primary dose 3 aP booster (pre wP) aP booster (pre aP) |
11 13 10 12 11 13 16 22 3 5 |
6783 7253 6078 6427 6291 6632 2187 3055 1572 2263 |
0.30 (0.22 to 0.40) 0.30 (0.23 to 0.39) 0.42 (0.32 to 0.55) 0.39 (0.29 to 0.51) 0.48 (0.41 to 0.56) 0.47 (0.41 to 0.54) 0.52 (0.43 to 0.63) 0.51 (0.44 to 0.59) 0.67 (0.51 to 0.89) 0.65 (0.52 to 0.80) |
| Swelling/induration Primary dose 1 Primary dose 2 Primary dose 3 aP booster (pre wP) aP booster (pre aP) |
13 15 12 14 13 15 17 22 4 6 |
14,242 14,612 13,430 13,779 13,575 13,916 2433 3301 1730 2421 |
0.24 (0.19 to 0.31) 0.24 (0.19 to 0.31) 0.38 (0.30 to 0.47) 0.35 (0.28 to 0.45) 0.41 (0.30 to 0.57) 0.40 (0.29 to 0.54) 0.51 (0.44 to 0.59) 0.51 (0.46 to 0.57) 0.61 (0.47 to 0.80) 0.68 (0.58 to 0.80) |
CI: confidence interval
RR: risk ratio
Appendix 8. Incidence of severe adverse events: acellular vaccines versus whole‐cell vaccines
| Outcomes | Number of trials | Acellular vaccines n/N* Incidence # | Whole‐cell vaccines n/N Incidence | RR 95% CI |
| Primary series non‐completion due to adverse events | 11 | 248/80,060 3.09 | 338/28,849 11.72 | 0.23 (0.12 to 0.43) |
| Death (infection) Primary series |
13 |
5/22,154 0.23 |
3/12,344 0.24 |
0.97 (0.23 to 4.16) |
| Death (all causes) Primary series |
16 |
81/86,863 0.93 |
61/35,588 1.71 |
0.87 (0.62 to 1.22) |
| Encephalopathy Primary series |
9 |
0/81,601 0.0 |
0/32,161 0.0 |
‐ |
| Convulsions Primary series Booster |
15 11 |
43/88,513 0.49 1/2250 0.44 |
41/35,874 1.14 0/397 0.0 |
0.47 (0.31 to 0.73) 0.46 (0.02 to 11.2) |
| Hypotonic hyporesponsive episodes Primary series Booster |
11 7 |
70/86,347 0.81 0/2171 0.0 |
51/35,226 1.45 0/316 0.0 |
0.26 (0.08 to 0.81) ‐ |
*n/N: number of events/number of recipients
# Incidence: number of events per 1000 recipients
CI: confidence interval
RR: risk ratio
Appendix 9. Incidence of minor adverse events over the primary series: acellular vaccines versus whole‐cell vaccines
| Outcomes | Dose 1 Acellular Whole‐cell n/N* n/N Incidence# Incidence Number of trials | Dose 2 Acellular Whole‐cell n/N n/N Incidence Incidence Number of trials | Dose 3 Acellular Whole‐cell n/N n/N Incidence Incidence Number of trials |
| Anorexia | 1275/12,310 1896/7322 103.57 258.95 11 | 1047/11,653 1208/6848 89.85 176.40 8 | 941/11,840 966/6806 79.48 141.93 9 |
| Drowsiness | 3427/12,813 2435/7677 267.46 317.18 11 | 2087/12,134 1500/7174 171.99 209.09 9 | 1548/12,301 1231/7129 125.84 172.67 10 |
| Fever | 898/14,910 3900/8357 60.23 466.67 19 | 1809/14,167 3427/7834 127.69 437.45 17 | 2270/14,024 3439/7707 161.87 446.22 17 |
| Irritability/fretfulness | 3645/12,875 4488/7832 283.11 573.03 15 | 3763/12,144 3695/7285 309.86 507.21 12 | 3482/12,268 3228/7243 283.83 445.67 13 |
| Prolonged crying | 116/10,364 395/6820 11.19 57.92 8 | 161/9867 248/6480 16.32 38.27 6 | 68/10,096 94/6449 6.74 14.58 7 |
| Vomiting | 530/8126 269/3324 65.22 80.93 8 | 356/7885 189/3100 45.15 60.97 7 | 322/7788 148/3025 41.35 48.93 7 |
| Pain/tenderness | 733/10,279 1840/3901 71.31 471.67 13 | 710/9642 1606/3544 73.64 453.16 11 | 712/9769 1358/3564 72.88 381.03 12 |
| Redness | 512/5348 620/1805 95.74 343.49 13 | 599/4821 551/1606 124.25 343.09 12 | 807/4972 583/1660 162.31 351.20 13 |
| Swelling/induration | 1238/10,606 1670/4006 116.73 416.87 15 | 1842/10,034 1576/3745 183.58 420.83 14 | 2791/10,157 1658/3759 274.79 441.07 15 |
*n/N: number of events/number of recipients
# Incidence: number of events per 1000 recipients
Appendix 10. Incidence of minor adverse events in boosters: acellular vaccines versus whole‐cell vaccines
| Outcomes | aP booster (previous wP) versus wP booster (previous wP) Acellular Whole‐cell n/N* n/N Incidence# Incidence Number of trials | aP booster (previous aP) versus wP booster (previous wP) Acellular Whole‐cell n/N n/N Incidence Incidence Number of trials |
| Anorexia | 129/1149 244/790 112.27 308.86 14 | 457/4474 735/3973 102.15 184.99 4 |
| Drowsiness | 203/1453 292/801 139.71 364.54 13 | 532/4419 913/3948 120.39 231.26 3 |
| Fever | 191/2184 305/1197 87.45 254.80 24 | 1320/5838 2058/4041 226.10 509.28 8 |
| Irritability/fretfulness | 314/1728 445/868 181.71 512.67 17 | 1256/5837 1379/4019 215.18 343.12 6 |
| Prolonged crying | 7/666 20/330 10.51 60.61 6 | 9/4105 15/3838 2.19 3.91 2 |
| Vomiting | 18/551 13/193 32.67 67.36 6 | 2/56 1/30 35.71 33.33 1 |
| Pain/tenderness | 620/2018 661/1033 307.23 639.88 21 | 691/2015 203/248 342.93 818.55 5 |
| Redness | 503/1980 523/1075 254.04 486.51 21 | 692/2015 135/248 343.42 544.35 5 |
| Swelling/induration | 446/2144 493/1157 208.02 426.10 22 | 575/2139 112/282 268.82 397.16 6 |
*n/N: number of events/number of recipients
# Incidence: number of events per 1000 recipients
Appendix 11. Incidence of severe adverse events: acellular vaccines versus placebo/DT
| Outcomes | Number of trials | Acellular vaccine n/N* Incidence# | Placebo/DT n/N Incidence | RR 95% CI |
| Primary series non‐completion due to adverse events | 4 | 65/19,092 3.40 | 28/6809 4.11 | 0.70 (0.38 to 1.29) |
| Death (infection) Primary series |
4 |
5/19,093 0.26 |
1/6809 0.15 |
1.21 (0.19 to 7.80) |
| Death (all causes) Primary series |
4 |
10/19,092 0.52 |
2/6809 0.29 |
1.08 (0.26 to 4.42) |
| Encephalopathy Primary series |
2 |
0/14,521 0.0 |
0/4129 0.0 |
‐ |
| Convulsions Primary series |
4 |
27/19,092 1.41 |
28/6809 4.11 |
0.44 (0.12 to 1.69) |
| Hypotonic hyporesponsive episodes Primary series |
4 |
2/19,092 0.10 |
2/6809 0.29 |
0.29 (0.02 to 5.13) |
*n/N: number of events/number of recipients
# Incidence: number of events per 1000 recipients
CI: confidence interval
RR: risk ratio
Appendix 12. Incidence of minor adverse events over the primary series: acellular vaccines versus placebo/DT
| Outcomes | Dose 1 Acellular Placebo/DT n/N* n/N Incidence# Incidence Number of trials | Dose 2 Acellular Placebo/DT n/N n/N Incidence Incidence Number of trials | Dose 3 Acellular Placebo/DT n/N n/N Incidence Incidence Number of trials |
| Anorexia | 750/8000 325/3526 93.75 92.17 2 | 656/7903 276/3483 83.00 79.24 2 | 418/5085 195/2538 82.20 76.83 1 |
| Drowsiness | 1696/7557 792/3397 224.43 233.15 2 | 1145/7334 549/3286 156.12 167.07 2 | 718/5085 350/2538 141.20 137.90 1 |
| Fever | 557/7762 230/3493 71.76 65.85 3 | 1053/7476 502/3377 140.85 148.65 3 | 1135/5070 552/2584 223.87 213.63 2 |
| Irritability/fretfulness | 2373/8000 1084/3526 296.63 307.43 2 | 2716/7903 1267/3483 343.67 368.53 2 | 1848/5085 958/2538 363.42 377.46 1 |
| Prolonged crying | 132/7999 50/3526 16.50 14.18 2 | 181/7903 78/3483 22.90 22.39 2 | 55/5085 26/2538 10.82 10.24 1 |
| Vomiting | 513/8000 209/3526 64.13 59.27 2 | 370/7903 185/3483 46.82 53.12 2 | 241/5085 131/2538 47.39 51.62 1 |
| Pain/tenderness | 458/7940 226/3511 57.68 64.37 2 | 630/7772 289/3430 81.06 84.26 2 | 511/5085 253/2538 100.49 99.68 1 |
| Redness | 9/2787 1/937 3.23 1.07 1 | 160/2661 6/874 60.13 6.86 1 | ‐ ‐ |
| Swelling/induration | 933/8042 391/3610 116.02 108.31 3 | 1549/7874 663/3527 196.72 187.98 3 | 2340/5184 1030/2632 451.39 391.34 2 |
*n/N: number of events/number of recipients
# Incidence: number of events per 1000 recipients

'Risk of bias' graph: review authors' judgements about each risk of bias item presented as percentages across all included studies.
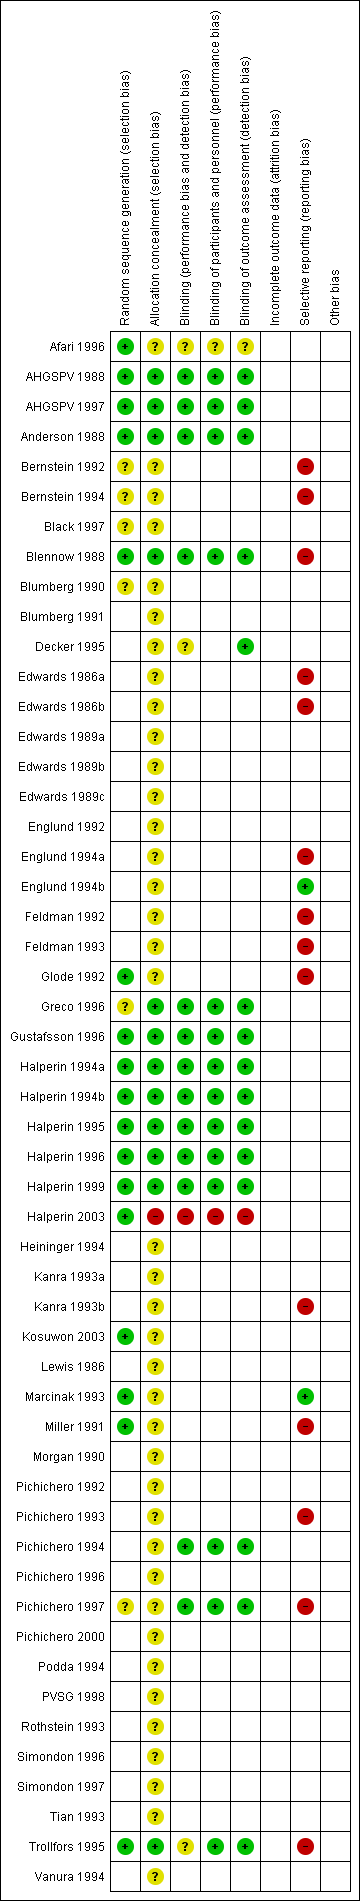
'Risk of bias' summary: review authors' judgements about each risk of bias item for each included study.

Comparison 1 Safety: acellular versus whole‐cell pertussis vaccines, Outcome 1 Primary series non‐completion due to adverse events.

Comparison 1 Safety: acellular versus whole‐cell pertussis vaccines, Outcome 2 Death (all causes).
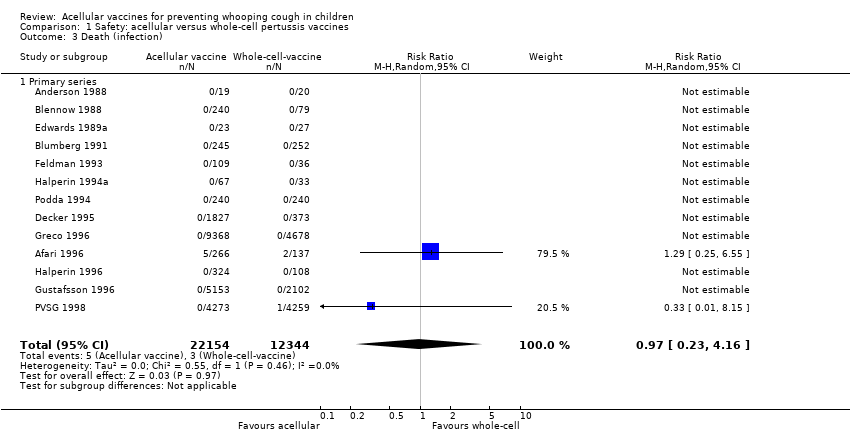
Comparison 1 Safety: acellular versus whole‐cell pertussis vaccines, Outcome 3 Death (infection).
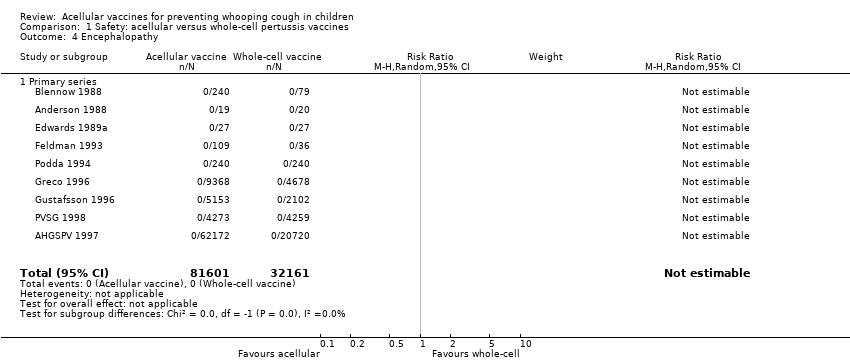
Comparison 1 Safety: acellular versus whole‐cell pertussis vaccines, Outcome 4 Encephalopathy.
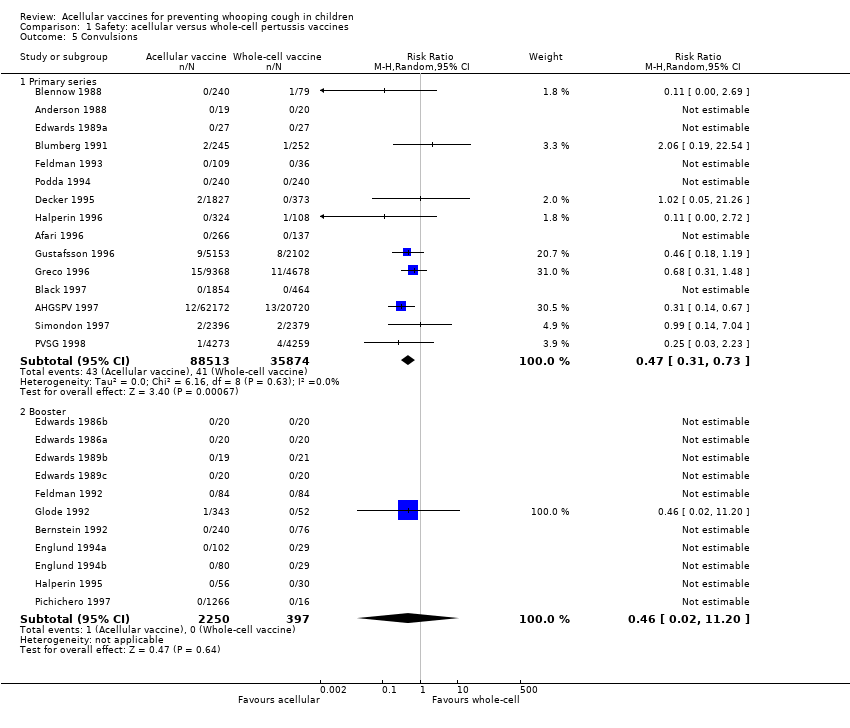
Comparison 1 Safety: acellular versus whole‐cell pertussis vaccines, Outcome 5 Convulsions.

Comparison 1 Safety: acellular versus whole‐cell pertussis vaccines, Outcome 6 Hypotonic hyporesponsive episodes.

Comparison 1 Safety: acellular versus whole‐cell pertussis vaccines, Outcome 7 Anorexia.
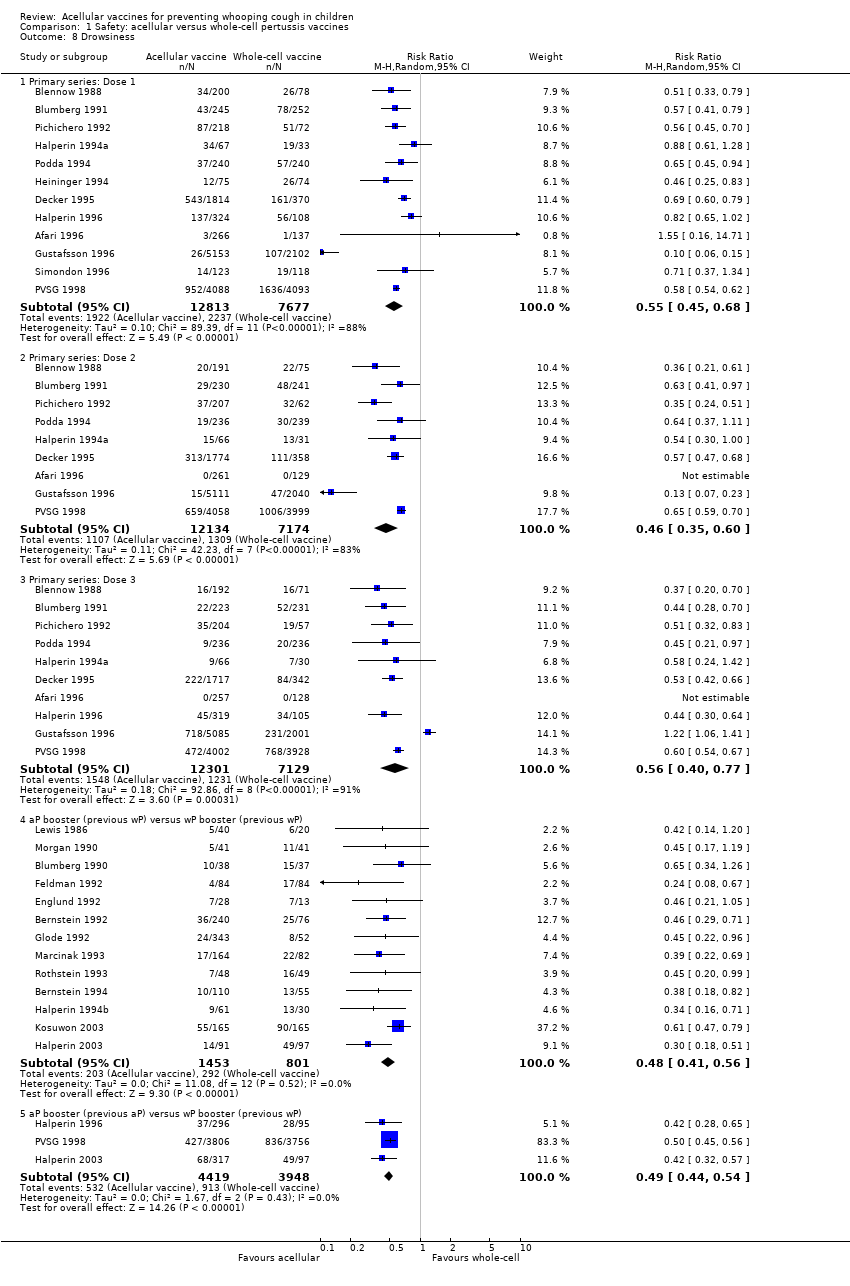
Comparison 1 Safety: acellular versus whole‐cell pertussis vaccines, Outcome 8 Drowsiness.

Comparison 1 Safety: acellular versus whole‐cell pertussis vaccines, Outcome 9 Fever.
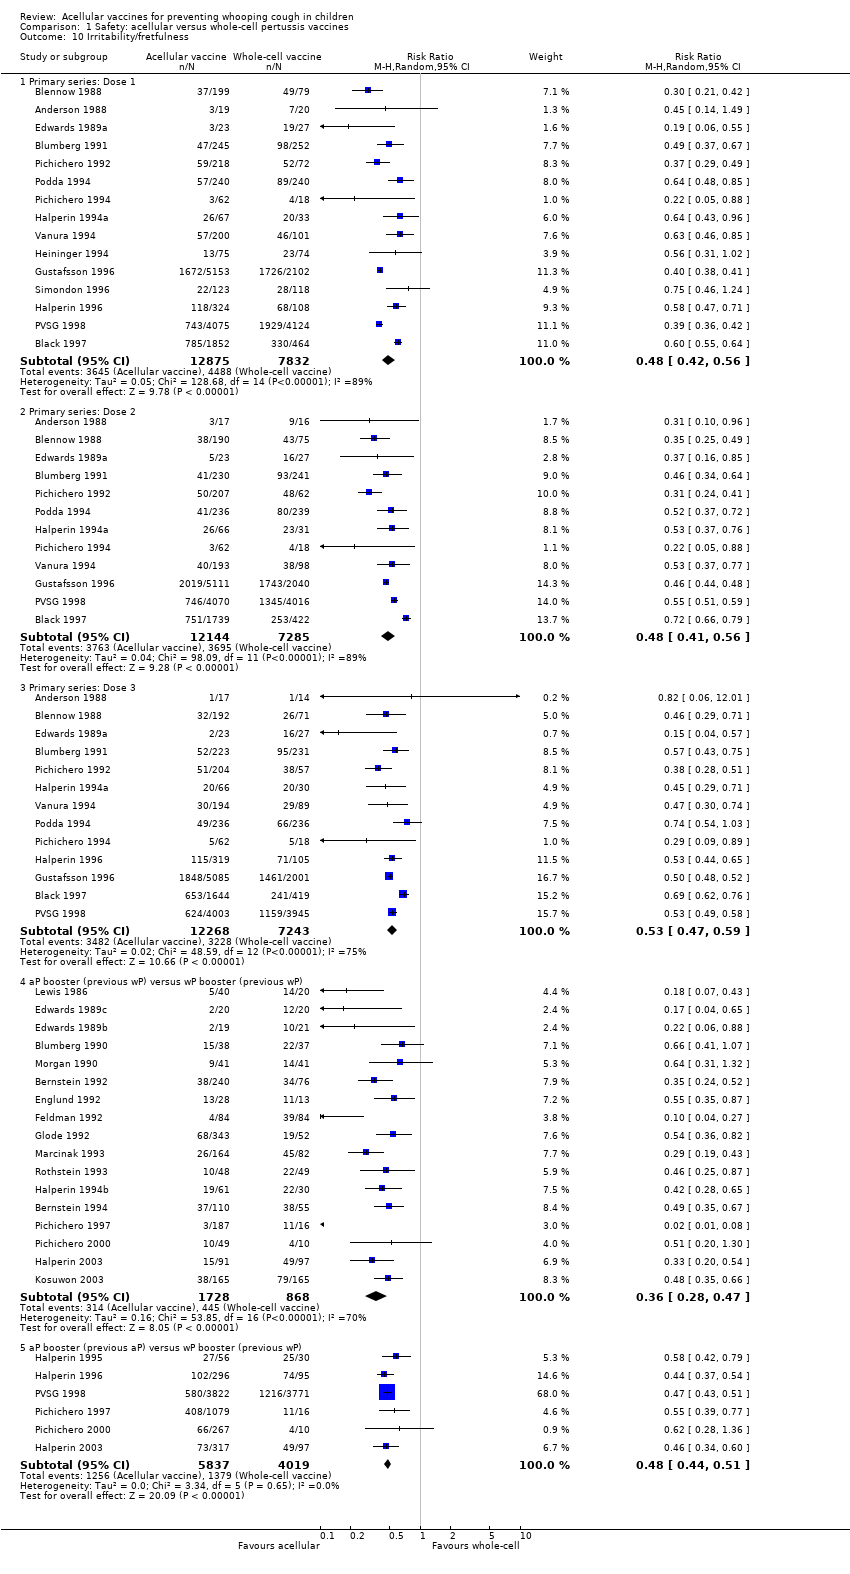
Comparison 1 Safety: acellular versus whole‐cell pertussis vaccines, Outcome 10 Irritability/fretfulness.
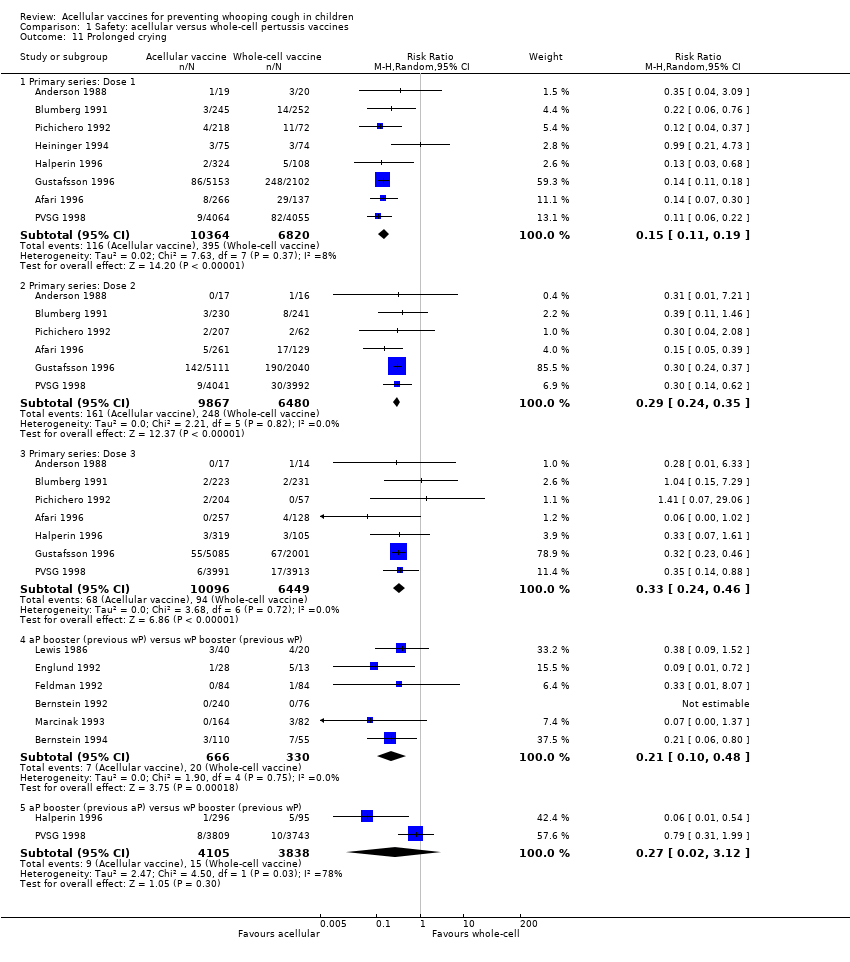
Comparison 1 Safety: acellular versus whole‐cell pertussis vaccines, Outcome 11 Prolonged crying.

Comparison 1 Safety: acellular versus whole‐cell pertussis vaccines, Outcome 12 Vomiting.

Comparison 1 Safety: acellular versus whole‐cell pertussis vaccines, Outcome 13 Pain/tenderness.
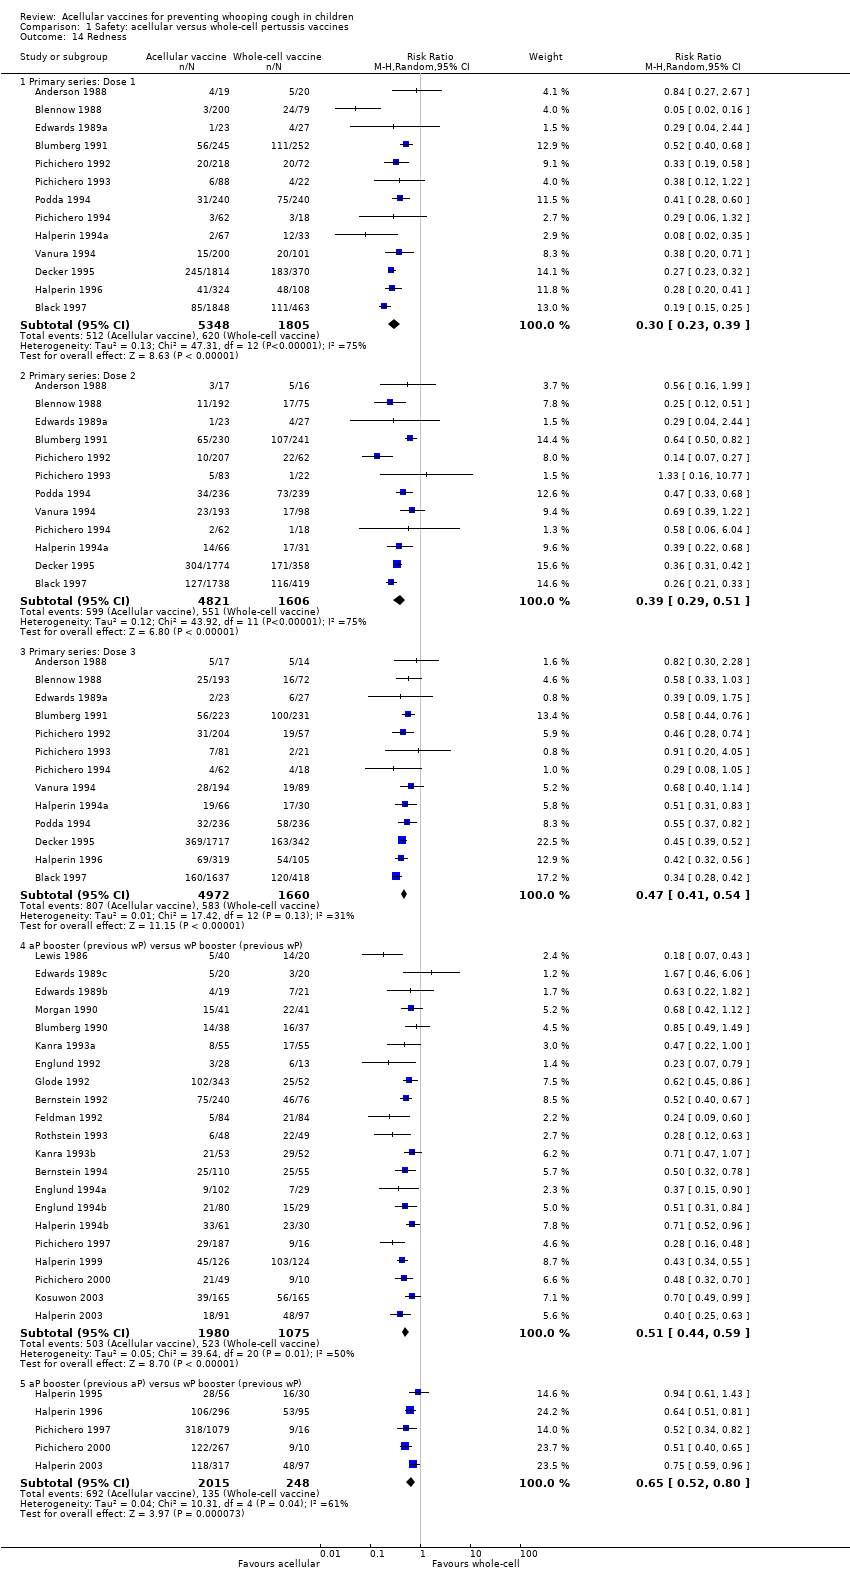
Comparison 1 Safety: acellular versus whole‐cell pertussis vaccines, Outcome 14 Redness.
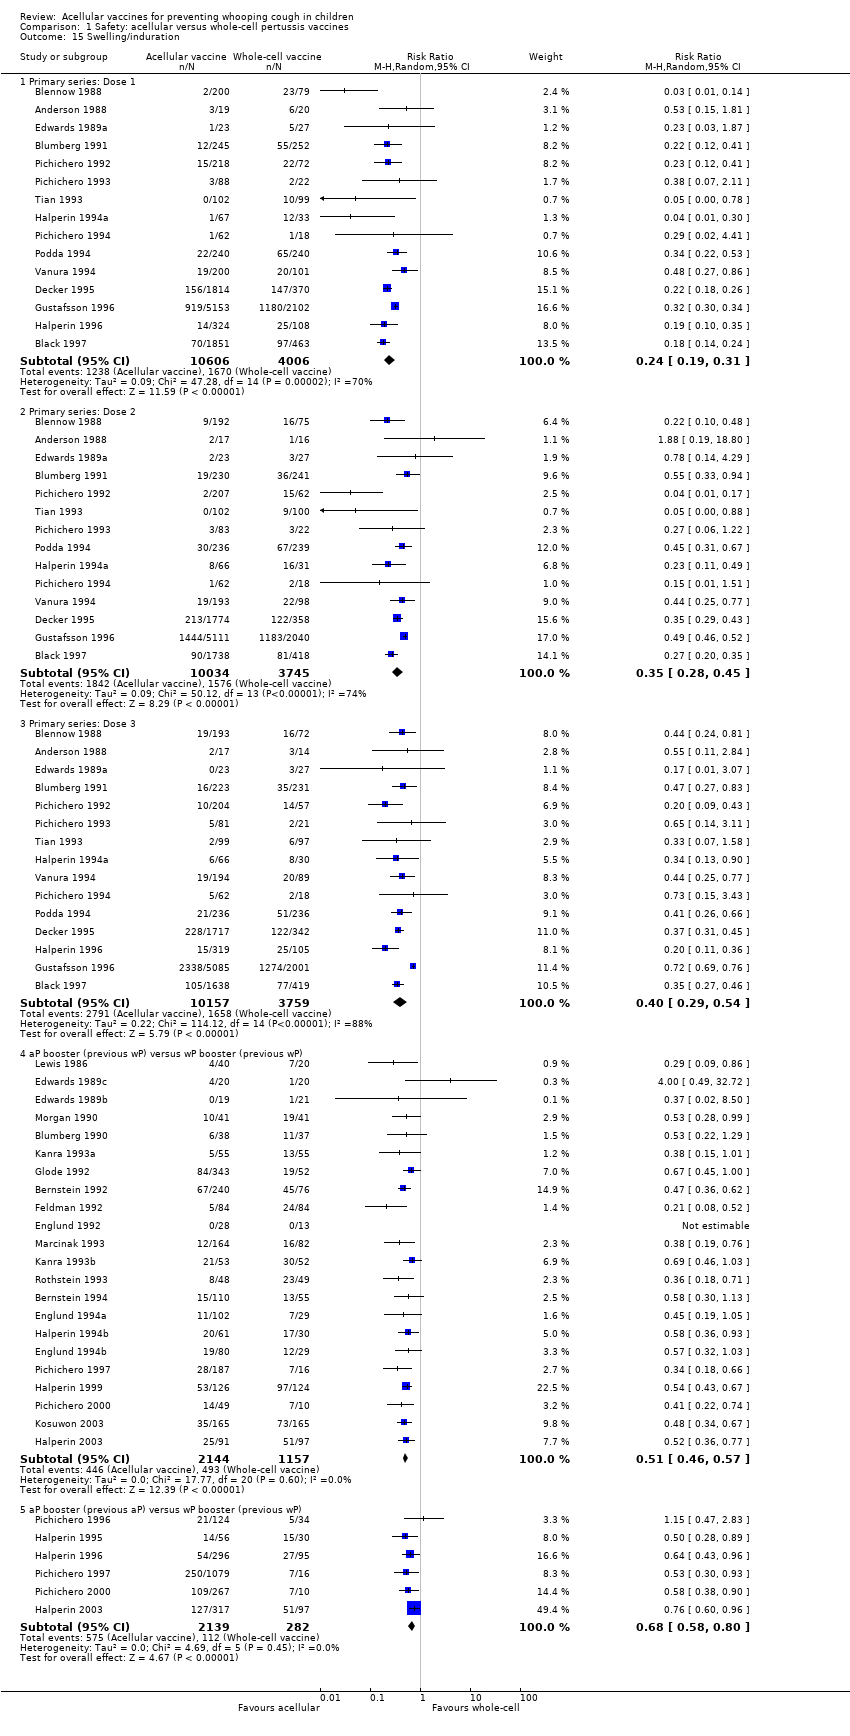
Comparison 1 Safety: acellular versus whole‐cell pertussis vaccines, Outcome 15 Swelling/induration.

Comparison 2 Safety: acellular vaccines versus placebo/DT, Outcome 1 Primary series non‐completion due to adverse events.

Comparison 2 Safety: acellular vaccines versus placebo/DT, Outcome 2 Death (all causes).

Comparison 2 Safety: acellular vaccines versus placebo/DT, Outcome 3 Death (infection).

Comparison 2 Safety: acellular vaccines versus placebo/DT, Outcome 4 Encephalopathy.
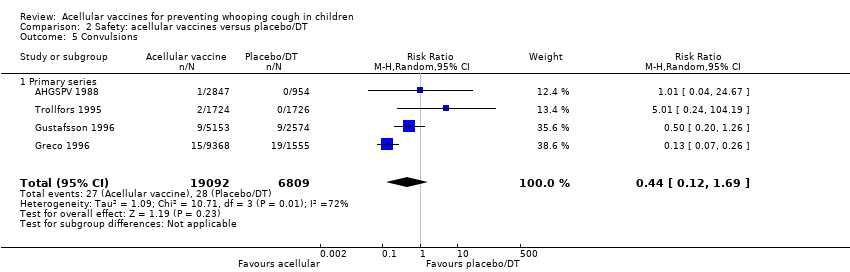
Comparison 2 Safety: acellular vaccines versus placebo/DT, Outcome 5 Convulsions.

Comparison 2 Safety: acellular vaccines versus placebo/DT, Outcome 6 Hypotonic hyporesponsive episodes.

Comparison 2 Safety: acellular vaccines versus placebo/DT, Outcome 7 Anorexia.
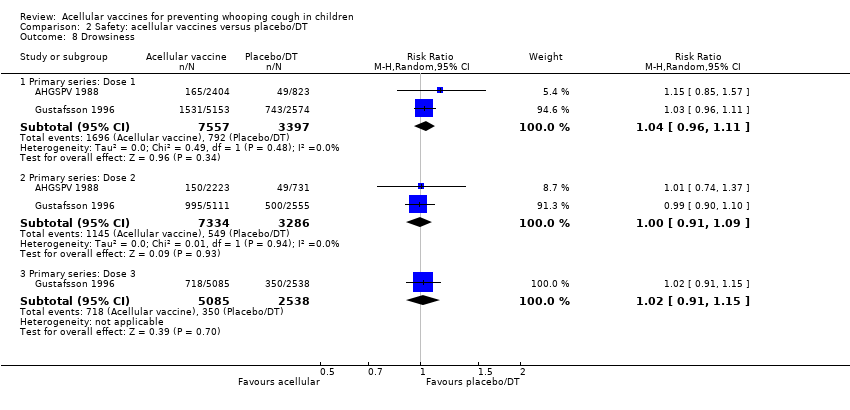
Comparison 2 Safety: acellular vaccines versus placebo/DT, Outcome 8 Drowsiness.
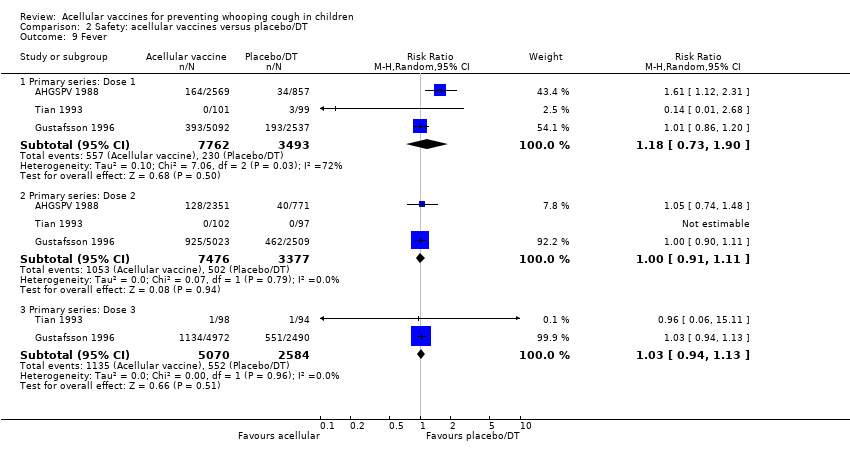
Comparison 2 Safety: acellular vaccines versus placebo/DT, Outcome 9 Fever.
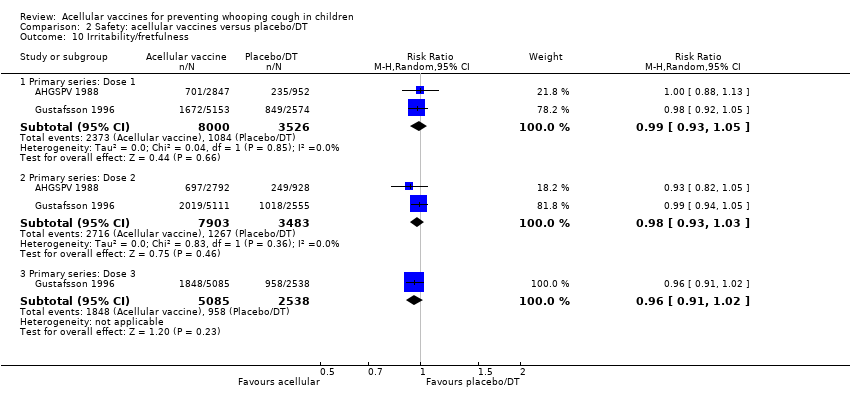
Comparison 2 Safety: acellular vaccines versus placebo/DT, Outcome 10 Irritability/fretfulness.

Comparison 2 Safety: acellular vaccines versus placebo/DT, Outcome 11 Prolonged crying.
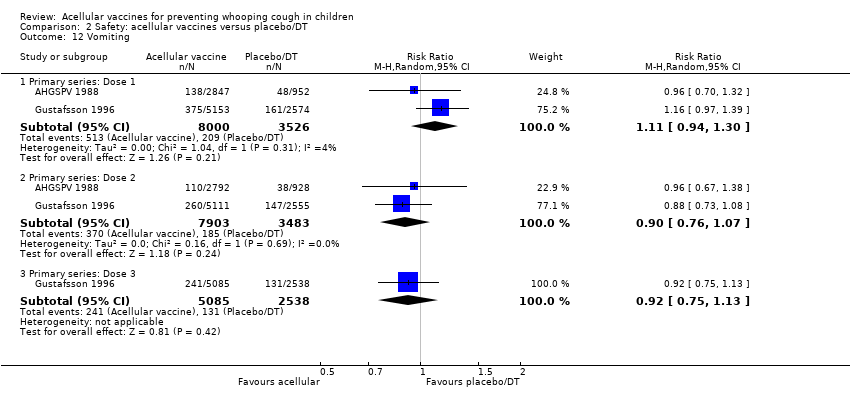
Comparison 2 Safety: acellular vaccines versus placebo/DT, Outcome 12 Vomiting.
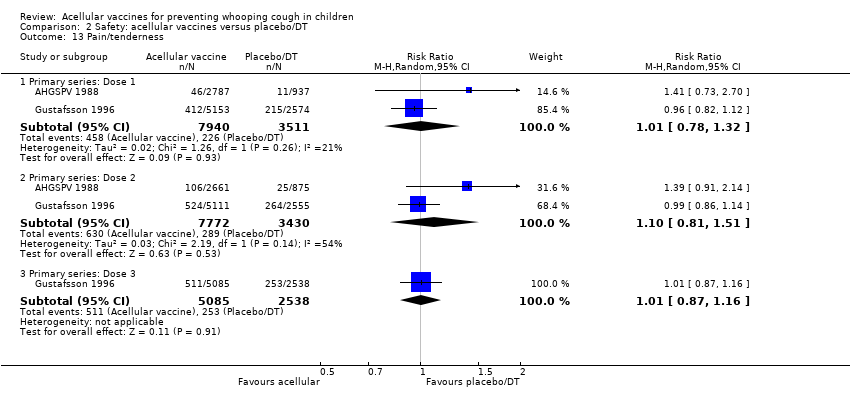
Comparison 2 Safety: acellular vaccines versus placebo/DT, Outcome 13 Pain/tenderness.

Comparison 2 Safety: acellular vaccines versus placebo/DT, Outcome 14 Swelling/induration.
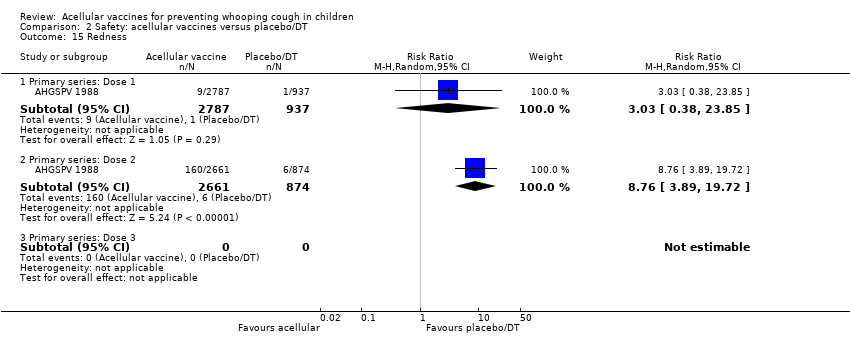
Comparison 2 Safety: acellular vaccines versus placebo/DT, Outcome 15 Redness.
| Outcome or subgroup title | No. of studies | No. of participants | Statistical method | Effect size |
| 1 Primary series non‐completion due to adverse events Show forest plot | 14 | 108909 | Risk Ratio (M‐H, Random, 95% CI) | 0.23 [0.12, 0.43] |
| 2 Death (all causes) Show forest plot | 16 | 122451 | Risk Ratio (M‐H, Random, 95% CI) | 0.87 [0.62, 1.22] |
| 2.1 Primary series | 16 | 122451 | Risk Ratio (M‐H, Random, 95% CI) | 0.87 [0.62, 1.22] |
| 3 Death (infection) Show forest plot | 13 | 34498 | Risk Ratio (M‐H, Random, 95% CI) | 0.97 [0.23, 4.16] |
| 3.1 Primary series | 13 | 34498 | Risk Ratio (M‐H, Random, 95% CI) | 0.97 [0.23, 4.16] |
| 4 Encephalopathy Show forest plot | 9 | 113762 | Risk Ratio (M‐H, Random, 95% CI) | 0.0 [0.0, 0.0] |
| 4.1 Primary series | 9 | 113762 | Risk Ratio (M‐H, Random, 95% CI) | 0.0 [0.0, 0.0] |
| 5 Convulsions Show forest plot | 26 | Risk Ratio (M‐H, Random, 95% CI) | Subtotals only | |
| 5.1 Primary series | 15 | 124387 | Risk Ratio (M‐H, Random, 95% CI) | 0.47 [0.31, 0.73] |
| 5.2 Booster | 11 | 2647 | Risk Ratio (M‐H, Random, 95% CI) | 0.46 [0.02, 11.20] |
| 6 Hypotonic hyporesponsive episodes Show forest plot | 18 | Risk Ratio (M‐H, Random, 95% CI) | Subtotals only | |
| 6.1 Primary series | 11 | 121573 | Risk Ratio (M‐H, Random, 95% CI) | 0.26 [0.08, 0.81] |
| 6.2 Booster | 7 | 2487 | Risk Ratio (M‐H, Random, 95% CI) | 0.0 [0.0, 0.0] |
| 7 Anorexia Show forest plot | 26 | Risk Ratio (M‐H, Random, 95% CI) | Subtotals only | |
| 7.1 Primary series: Dose 1 | 11 | 19632 | Risk Ratio (M‐H, Random, 95% CI) | 0.43 [0.32, 0.57] |
| 7.2 Primary series: Dose 2 | 8 | 18501 | Risk Ratio (M‐H, Random, 95% CI) | 0.45 [0.33, 0.60] |
| 7.3 Primary series: Dose 3 | 9 | 18646 | Risk Ratio (M‐H, Random, 95% CI) | 0.50 [0.43, 0.60] |
| 7.4 aP booster (previous wP) versus wP booster (previous wP) | 14 | 1939 | Risk Ratio (M‐H, Random, 95% CI) | 0.40 [0.30, 0.54] |
| 7.5 aP booster (previous aP) versus wP booster (previous wP) | 4 | 8447 | Risk Ratio (M‐H, Random, 95% CI) | 0.42 [0.31, 0.58] |
| 8 Drowsiness Show forest plot | 25 | Risk Ratio (M‐H, Random, 95% CI) | Subtotals only | |
| 8.1 Primary series: Dose 1 | 12 | 20490 | Risk Ratio (M‐H, Random, 95% CI) | 0.55 [0.45, 0.68] |
| 8.2 Primary series: Dose 2 | 9 | 19308 | Risk Ratio (M‐H, Random, 95% CI) | 0.46 [0.35, 0.60] |
| 8.3 Primary series: Dose 3 | 10 | 19430 | Risk Ratio (M‐H, Random, 95% CI) | 0.56 [0.40, 0.77] |
| 8.4 aP booster (previous wP) versus wP booster (previous wP) | 13 | 2254 | Risk Ratio (M‐H, Random, 95% CI) | 0.48 [0.41, 0.56] |
| 8.5 aP booster (previous aP) versus wP booster (previous wP) | 3 | 8367 | Risk Ratio (M‐H, Random, 95% CI) | 0.49 [0.44, 0.54] |
| 9 Fever Show forest plot | 46 | Risk Ratio (M‐H, Random, 95% CI) | Subtotals only | |
| 9.1 Primary series: Dose 1 | 19 | 23267 | Risk Ratio (M‐H, Random, 95% CI) | 0.17 [0.13, 0.20] |
| 9.2 Primary series: Dose 2 | 17 | 22001 | Risk Ratio (M‐H, Random, 95% CI) | 0.31 [0.26, 0.37] |
| 9.3 Primary series: Dose 3 | 17 | 21731 | Risk Ratio (M‐H, Random, 95% CI) | 0.34 [0.30, 0.38] |
| 9.4 aP booster (previous wP) versus wP booster (previous wP) | 24 | 3381 | Risk Ratio (M‐H, Random, 95% CI) | 0.33 [0.26, 0.43] |
| 9.5 aP booster (previous aP) versus wP booster (previous wP) | 8 | 9879 | Risk Ratio (M‐H, Random, 95% CI) | 0.35 [0.22, 0.55] |
| 10 Irritability/fretfulness Show forest plot | 33 | Risk Ratio (M‐H, Random, 95% CI) | Subtotals only | |
| 10.1 Primary series: Dose 1 | 15 | 20707 | Risk Ratio (M‐H, Random, 95% CI) | 0.48 [0.42, 0.56] |
| 10.2 Primary series: Dose 2 | 12 | 19429 | Risk Ratio (M‐H, Random, 95% CI) | 0.48 [0.41, 0.56] |
| 10.3 Primary series: Dose 3 | 13 | 19511 | Risk Ratio (M‐H, Random, 95% CI) | 0.53 [0.47, 0.59] |
| 10.4 aP booster (previous wP) versus wP booster (previous wP) | 17 | 2596 | Risk Ratio (M‐H, Random, 95% CI) | 0.36 [0.28, 0.47] |
| 10.5 aP booster (previous aP) versus wP booster (previous wP) | 6 | 9856 | Risk Ratio (M‐H, Random, 95% CI) | 0.48 [0.44, 0.51] |
| 11 Prolonged crying Show forest plot | 14 | Risk Ratio (M‐H, Random, 95% CI) | Subtotals only | |
| 11.1 Primary series: Dose 1 | 8 | 17184 | Risk Ratio (M‐H, Random, 95% CI) | 0.15 [0.11, 0.19] |
| 11.2 Primary series: Dose 2 | 6 | 16347 | Risk Ratio (M‐H, Random, 95% CI) | 0.29 [0.24, 0.35] |
| 11.3 Primary series: Dose 3 | 7 | 16545 | Risk Ratio (M‐H, Random, 95% CI) | 0.33 [0.24, 0.46] |
| 11.4 aP booster (previous wP) versus wP booster (previous wP) | 6 | 996 | Risk Ratio (M‐H, Random, 95% CI) | 0.21 [0.10, 0.48] |
| 11.5 aP booster (previous aP) versus wP booster (previous wP) | 2 | 7943 | Risk Ratio (M‐H, Random, 95% CI) | 0.27 [0.02, 3.12] |
| 12 Vomiting Show forest plot | 15 | Risk Ratio (M‐H, Random, 95% CI) | Subtotals only | |
| 12.1 Primary series: Dose 1 | 8 | 11450 | Risk Ratio (M‐H, Random, 95% CI) | 0.77 [0.66, 0.88] |
| 12.2 Primary series: Dose 2 | 7 | 10985 | Risk Ratio (M‐H, Random, 95% CI) | 0.62 [0.45, 0.86] |
| 12.3 Primary series: Dose 3 | 7 | 10813 | Risk Ratio (M‐H, Random, 95% CI) | 0.69 [0.46, 1.04] |
| 12.4 aP booster (previous wP) versus wP booster (previous wP) | 6 | 744 | Risk Ratio (M‐H, Random, 95% CI) | 0.50 [0.22, 1.11] |
| 12.5 aP booster (previous aP) versus wP booster (previous wP) | 1 | 86 | Risk Ratio (M‐H, Random, 95% CI) | 1.07 [0.10, 11.34] |
| 13 Pain/tenderness Show forest plot | 35 | Risk Ratio (M‐H, Random, 95% CI) | Subtotals only | |
| 13.1 Primary series: Dose 1 | 13 | 14180 | Risk Ratio (M‐H, Random, 95% CI) | 0.20 [0.16, 0.25] |
| 13.2 Primary series: Dose 2 | 11 | 13186 | Risk Ratio (M‐H, Random, 95% CI) | 0.18 [0.15, 0.22] |
| 13.3 Primary series: Dose 3 | 12 | 13333 | Risk Ratio (M‐H, Random, 95% CI) | 0.20 [0.17, 0.24] |
| 13.4 aP booster (previous wP) versus wP booster (previous wP) | 21 | 3051 | Risk Ratio (M‐H, Random, 95% CI) | 0.43 [0.36, 0.53] |
| 13.5 aP booster (previous aP) versus wP booster (previous wP) | 5 | 2263 | Risk Ratio (M‐H, Random, 95% CI) | 0.43 [0.32, 0.58] |
| 14 Redness Show forest plot | 35 | Risk Ratio (M‐H, Random, 95% CI) | Subtotals only | |
| 14.1 Primary series: Dose 1 | 13 | 7153 | Risk Ratio (M‐H, Random, 95% CI) | 0.30 [0.23, 0.39] |
| 14.2 Primary series: Dose 2 | 12 | 6427 | Risk Ratio (M‐H, Random, 95% CI) | 0.39 [0.29, 0.51] |
| 14.3 Primary series: Dose 3 | 13 | 6632 | Risk Ratio (M‐H, Random, 95% CI) | 0.47 [0.41, 0.54] |
| 14.4 aP booster (previous wP) versus wP booster (previous wP) | 21 | 3055 | Risk Ratio (M‐H, Random, 95% CI) | 0.51 [0.44, 0.59] |
| 14.5 aP booster (previous aP) versus wP booster (previous wP) | 5 | 2263 | Risk Ratio (M‐H, Random, 95% CI) | 0.65 [0.52, 0.80] |
| 15 Swelling/induration Show forest plot | 39 | Risk Ratio (M‐H, Random, 95% CI) | Subtotals only | |
| 15.1 Primary series: Dose 1 | 15 | 14612 | Risk Ratio (M‐H, Random, 95% CI) | 0.24 [0.19, 0.31] |
| 15.2 Primary series: Dose 2 | 14 | 13779 | Risk Ratio (M‐H, Random, 95% CI) | 0.35 [0.28, 0.45] |
| 15.3 Primary series: Dose 3 | 15 | 13916 | Risk Ratio (M‐H, Random, 95% CI) | 0.40 [0.29, 0.54] |
| 15.4 aP booster (previous wP) versus wP booster (previous wP) | 22 | 3301 | Risk Ratio (M‐H, Random, 95% CI) | 0.51 [0.46, 0.57] |
| 15.5 aP booster (previous aP) versus wP booster (previous wP) | 6 | 2421 | Risk Ratio (M‐H, Random, 95% CI) | 0.68 [0.58, 0.80] |
| Outcome or subgroup title | No. of studies | No. of participants | Statistical method | Effect size |
| 1 Primary series non‐completion due to adverse events Show forest plot | 4 | 25901 | Risk Ratio (M‐H, Random, 95% CI) | 0.70 [0.38, 1.29] |
| 2 Death (all causes) Show forest plot | 4 | 25901 | Risk Ratio (M‐H, Random, 95% CI) | 1.08 [0.26, 4.42] |
| 2.1 Primary series | 4 | 25901 | Risk Ratio (M‐H, Random, 95% CI) | 1.08 [0.26, 4.42] |
| 3 Death (infection) Show forest plot | 4 | 25902 | Risk Ratio (M‐H, Random, 95% CI) | 1.21 [0.19, 7.80] |
| 3.1 Primary series | 4 | 25902 | Risk Ratio (M‐H, Random, 95% CI) | 1.21 [0.19, 7.80] |
| 4 Encephalopathy Show forest plot | 2 | 18650 | Risk Ratio (M‐H, Random, 95% CI) | 0.0 [0.0, 0.0] |
| 4.1 Primary series | 2 | 18650 | Risk Ratio (M‐H, Random, 95% CI) | 0.0 [0.0, 0.0] |
| 5 Convulsions Show forest plot | 4 | 25901 | Risk Ratio (M‐H, Random, 95% CI) | 0.44 [0.12, 1.69] |
| 5.1 Primary series | 4 | 25901 | Risk Ratio (M‐H, Random, 95% CI) | 0.44 [0.12, 1.69] |
| 6 Hypotonic hyporesponsive episodes Show forest plot | 4 | 25901 | Risk Ratio (M‐H, Random, 95% CI) | 0.29 [0.02, 5.13] |
| 6.1 Primary series | 4 | 25901 | Risk Ratio (M‐H, Random, 95% CI) | 0.29 [0.02, 5.13] |
| 7 Anorexia Show forest plot | 2 | Risk Ratio (M‐H, Random, 95% CI) | Subtotals only | |
| 7.1 Primary series: Dose 1 | 2 | 11526 | Risk Ratio (M‐H, Random, 95% CI) | 1.06 [0.93, 1.20] |
| 7.2 Primary series: Dose 2 | 2 | 11386 | Risk Ratio (M‐H, Random, 95% CI) | 0.99 [0.66, 1.46] |
| 7.3 Primary series: Dose 3 | 1 | 7623 | Risk Ratio (M‐H, Random, 95% CI) | 1.07 [0.91, 1.26] |
| 8 Drowsiness Show forest plot | 2 | Risk Ratio (M‐H, Random, 95% CI) | Subtotals only | |
| 8.1 Primary series: Dose 1 | 2 | 10954 | Risk Ratio (M‐H, Random, 95% CI) | 1.04 [0.96, 1.11] |
| 8.2 Primary series: Dose 2 | 2 | 10620 | Risk Ratio (M‐H, Random, 95% CI) | 1.00 [0.91, 1.09] |
| 8.3 Primary series: Dose 3 | 1 | 7623 | Risk Ratio (M‐H, Random, 95% CI) | 1.02 [0.91, 1.15] |
| 9 Fever Show forest plot | 3 | Risk Ratio (M‐H, Random, 95% CI) | Subtotals only | |
| 9.1 Primary series: Dose 1 | 3 | 11255 | Risk Ratio (M‐H, Random, 95% CI) | 1.18 [0.73, 1.90] |
| 9.2 Primary series: Dose 2 | 3 | 10853 | Risk Ratio (M‐H, Random, 95% CI) | 1.00 [0.91, 1.11] |
| 9.3 Primary series: Dose 3 | 2 | 7654 | Risk Ratio (M‐H, Random, 95% CI) | 1.03 [0.94, 1.13] |
| 10 Irritability/fretfulness Show forest plot | 2 | Risk Ratio (M‐H, Random, 95% CI) | Subtotals only | |
| 10.1 Primary series: Dose 1 | 2 | 11526 | Risk Ratio (M‐H, Random, 95% CI) | 0.99 [0.93, 1.05] |
| 10.2 Primary series: Dose 2 | 2 | 11386 | Risk Ratio (M‐H, Random, 95% CI) | 0.98 [0.93, 1.03] |
| 10.3 Primary series: Dose 3 | 1 | 7623 | Risk Ratio (M‐H, Random, 95% CI) | 0.96 [0.91, 1.02] |
| 11 Prolonged crying Show forest plot | 2 | Risk Ratio (M‐H, Random, 95% CI) | Subtotals only | |
| 11.1 Primary series: Dose 1 | 2 | 11525 | Risk Ratio (M‐H, Random, 95% CI) | 1.29 [0.71, 2.34] |
| 11.2 Primary series: Dose 2 | 2 | 11386 | Risk Ratio (M‐H, Random, 95% CI) | 1.08 [0.83, 1.40] |
| 11.3 Primary series: Dose 3 | 1 | 7623 | Risk Ratio (M‐H, Random, 95% CI) | 1.06 [0.66, 1.68] |
| 12 Vomiting Show forest plot | 2 | Risk Ratio (M‐H, Random, 95% CI) | Subtotals only | |
| 12.1 Primary series: Dose 1 | 2 | 11526 | Risk Ratio (M‐H, Random, 95% CI) | 1.11 [0.94, 1.30] |
| 12.2 Primary series: Dose 2 | 2 | 11386 | Risk Ratio (M‐H, Random, 95% CI) | 0.90 [0.76, 1.07] |
| 12.3 Primary series: Dose 3 | 1 | 7623 | Risk Ratio (M‐H, Random, 95% CI) | 0.92 [0.75, 1.13] |
| 13 Pain/tenderness Show forest plot | 2 | Risk Ratio (M‐H, Random, 95% CI) | Subtotals only | |
| 13.1 Primary series: Dose 1 | 2 | 11451 | Risk Ratio (M‐H, Random, 95% CI) | 1.01 [0.78, 1.32] |
| 13.2 Primary series: Dose 2 | 2 | 11202 | Risk Ratio (M‐H, Random, 95% CI) | 1.10 [0.81, 1.51] |
| 13.3 Primary series: Dose 3 | 1 | 7623 | Risk Ratio (M‐H, Random, 95% CI) | 1.01 [0.87, 1.16] |
| 14 Swelling/induration Show forest plot | 3 | Risk Ratio (M‐H, Random, 95% CI) | Subtotals only | |
| 14.1 Primary series: Dose 1 | 3 | 11652 | Risk Ratio (M‐H, Random, 95% CI) | 1.29 [0.62, 2.68] |
| 14.2 Primary series: Dose 2 | 3 | 11401 | Risk Ratio (M‐H, Random, 95% CI) | 2.08 [0.54, 8.01] |
| 14.3 Primary series: Dose 3 | 2 | 7816 | Risk Ratio (M‐H, Random, 95% CI) | 1.13 [1.07, 1.20] |
| 15 Redness Show forest plot | 1 | Risk Ratio (M‐H, Random, 95% CI) | Subtotals only | |
| 15.1 Primary series: Dose 1 | 1 | 3724 | Risk Ratio (M‐H, Random, 95% CI) | 3.03 [0.38, 23.85] |
| 15.2 Primary series: Dose 2 | 1 | 3535 | Risk Ratio (M‐H, Random, 95% CI) | 8.76 [3.89, 19.72] |
| 15.3 Primary series: Dose 3 | 0 | 0 | Risk Ratio (M‐H, Random, 95% CI) | 0.0 [0.0, 0.0] |