| 1 Numbers improved Show forest plot | 7 | 338 | Risk Ratio (M‐H, Fixed, 95% CI) | 1.01 [0.80, 1.27] |
|
| 1.1 Chemical methods | 3 | 138 | Risk Ratio (M‐H, Fixed, 95% CI) | 0.94 [0.72, 1.24] |
| 1.2 Physical methods ‐ parallel group studies | 1 | 53 | Risk Ratio (M‐H, Fixed, 95% CI) | 1.11 [0.70, 1.74] |
| 1.3 Physical methods ‐ crossover studies | 2 | 98 | Risk Ratio (M‐H, Fixed, 95% CI) | 1.2 [0.57, 2.54] |
| 1.4 Combination methods | 1 | 49 | Risk Ratio (M‐H, Fixed, 95% CI) | 0.85 [0.21, 3.40] |
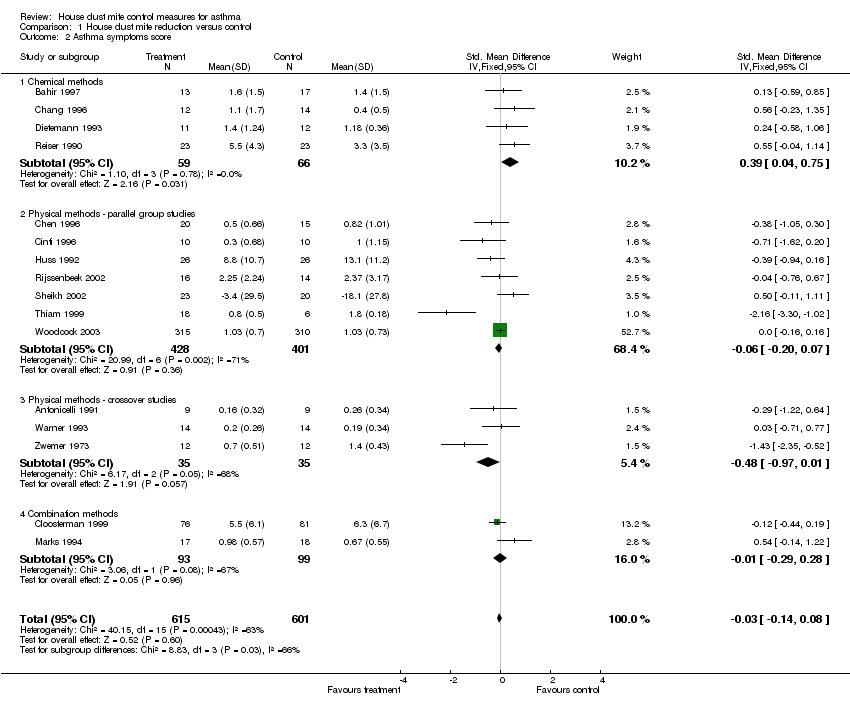
| 2 Asthma symptoms score Show forest plot | 16 | 1216 | Std. Mean Difference (IV, Fixed, 95% CI) | ‐0.03 [‐0.14, 0.08] |
|
| 2.1 Chemical methods | 4 | 125 | Std. Mean Difference (IV, Fixed, 95% CI) | 0.39 [0.04, 0.75] |
| 2.2 Physical methods ‐ parallel group studies | 7 | 829 | Std. Mean Difference (IV, Fixed, 95% CI) | ‐0.06 [‐0.20, 0.07] |
| 2.3 Physical methods ‐ crossover studies | 3 | 70 | Std. Mean Difference (IV, Fixed, 95% CI) | ‐0.48 [‐0.97, 0.01] |
| 2.4 Combination methods | 2 | 192 | Std. Mean Difference (IV, Fixed, 95% CI) | ‐0.01 [‐0.29, 0.28] |
| 3 Medication usage Show forest plot | 8 | 859 | Std. Mean Difference (IV, Fixed, 95% CI) | ‐0.05 [‐0.18, 0.09] |
|
| 3.1 Chemical methods | 1 | 23 | Std. Mean Difference (IV, Fixed, 95% CI) | 0.89 [0.02, 1.75] |
| 3.2 Physical methods ‐ parallel group studies | 4 | 764 | Std. Mean Difference (IV, Fixed, 95% CI) | ‐0.06 [‐0.20, 0.08] |
| 3.3 Physical methods ‐ crossover studies | 3 | 72 | Std. Mean Difference (IV, Fixed, 95% CI) | ‐0.17 [‐0.64, 0.29] |
| 4 FEV1 (Forced expiratory volume in one second) Show forest plot | 13 | 528 | Std. Mean Difference (IV, Fixed, 95% CI) | 0.11 [‐0.06, 0.29] |
|
| 4.1 Chemical methods | 4 | 125 | Std. Mean Difference (IV, Fixed, 95% CI) | ‐0.05 [‐0.41, 0.30] |
| 4.2 Physical methods ‐ parallel group studies | 3 | 102 | Std. Mean Difference (IV, Fixed, 95% CI) | 0.34 [‐0.07, 0.75] |
| 4.3 Physical methods ‐ crossover studies | 2 | 42 | Std. Mean Difference (IV, Fixed, 95% CI) | 0.07 [‐0.53, 0.68] |
| 4.4 Combination methods | 4 | 259 | Std. Mean Difference (IV, Fixed, 95% CI) | 0.12 [‐0.12, 0.36] |
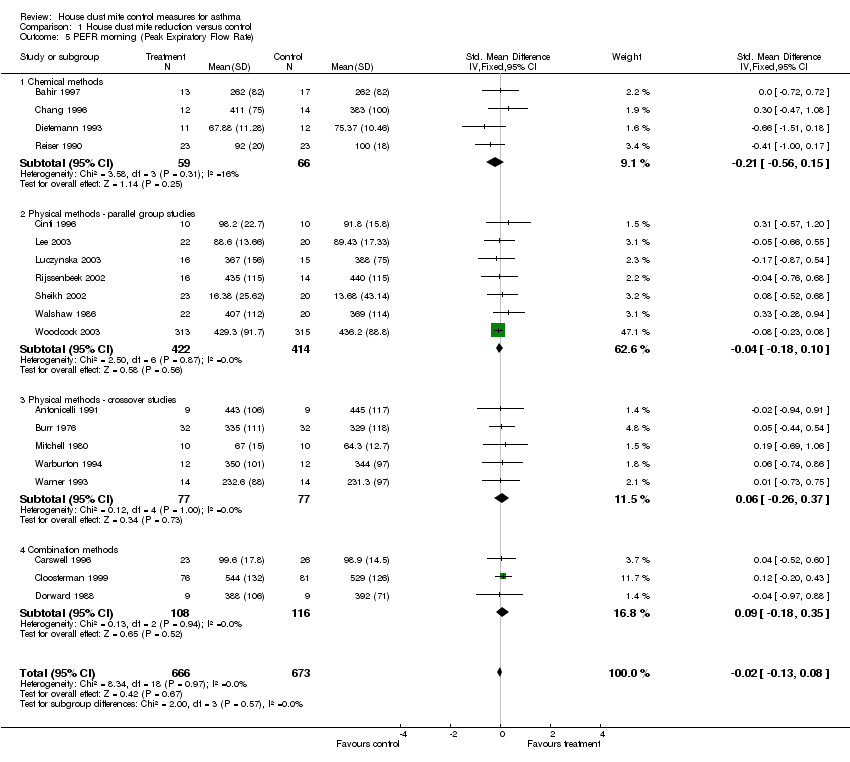
| 5 PEFR morning (Peak Expiratory Flow Rate) Show forest plot | 19 | 1339 | Std. Mean Difference (IV, Fixed, 95% CI) | ‐0.02 [‐0.13, 0.08] |
|
| 5.1 Chemical methods | 4 | 125 | Std. Mean Difference (IV, Fixed, 95% CI) | ‐0.21 [‐0.56, 0.15] |
| 5.2 Physical methods ‐ parallel group studies | 7 | 836 | Std. Mean Difference (IV, Fixed, 95% CI) | ‐0.04 [‐0.18, 0.10] |
| 5.3 Physical methods ‐ crossover studies | 5 | 154 | Std. Mean Difference (IV, Fixed, 95% CI) | 0.06 [‐0.26, 0.37] |
| 5.4 Combination methods | 3 | 224 | Std. Mean Difference (IV, Fixed, 95% CI) | 0.09 [‐0.18, 0.35] |
| 6 PEFR evening (Peak Expiratory Flow Rate) Show forest plot | 9 | 233 | Std. Mean Difference (IV, Fixed, 95% CI) | ‐0.10 [‐0.36, 0.16] |
|
| 6.1 Chemical methods | 2 | 53 | Std. Mean Difference (IV, Fixed, 95% CI) | ‐0.49 [‐1.05, 0.07] |
| 6.2 Physical methods ‐ parallel group studies | 2 | 72 | Std. Mean Difference (IV, Fixed, 95% CI) | ‐0.06 [‐0.52, 0.40] |
| 6.3 Physical methods ‐ crossover studies | 4 | 90 | Std. Mean Difference (IV, Fixed, 95% CI) | 0.06 [‐0.35, 0.47] |
| 6.4 Combination methods | 1 | 18 | Std. Mean Difference (IV, Fixed, 95% CI) | ‐0.03 [‐0.96, 0.89] |
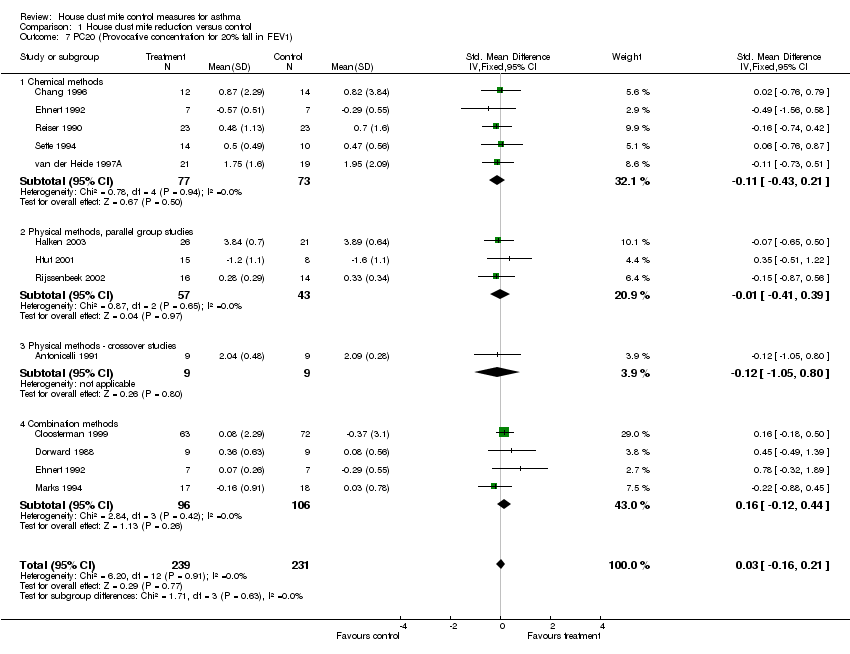
| 7 PC20 (Provocative concentration for 20% fall in FEV1) Show forest plot | 12 | 470 | Std. Mean Difference (IV, Fixed, 95% CI) | 0.03 [‐0.16, 0.21] |
|
| 7.1 Chemical methods | 5 | 150 | Std. Mean Difference (IV, Fixed, 95% CI) | ‐0.11 [‐0.43, 0.21] |
| 7.2 Physical methods, parallel group studies | 3 | 100 | Std. Mean Difference (IV, Fixed, 95% CI) | ‐0.01 [‐0.41, 0.39] |
| 7.3 Physical methods ‐ crossover studies | 1 | 18 | Std. Mean Difference (IV, Fixed, 95% CI) | ‐0.12 [‐1.05, 0.80] |
| 7.4 Combination methods | 4 | 202 | Std. Mean Difference (IV, Fixed, 95% CI) | 0.16 [‐0.12, 0.44] |