無排卵性多嚢胞性卵巣症候群の女性における排卵誘発のための腹腔鏡下卵巣開孔術
Abstract
Background
Polycystic ovary syndrome (PCOS) is a common condition affecting 8% to 13% of reproductive‐aged women. In the past clomiphene citrate (CC) used to be the first‐line treatment in women with PCOS. Ovulation induction with letrozole should be the first‐line treatment according to new guidelines, but the use of letrozole is off‐label. Consequently, CC is still commonly used. Approximately 20% of women on CC do not ovulate. Women who are CC‐resistant can be treated with gonadotrophins or other medical ovulation‐induction agents. These medications are not always successful, can be time‐consuming and can cause adverse events like multiple pregnancies and cycle cancellation due to an excessive response. Laparoscopic ovarian drilling (LOD) is a surgical alternative to medical treatment. There are risks associated with surgery, such as complications from anaesthesia, infection, and adhesions.
Objectives
To evaluate the effectiveness and safety of LOD with or without medical ovulation induction compared with medical ovulation induction alone for women with anovulatory polycystic PCOS and CC‐resistance.
Search methods
We searched the Cochrane Gynaecology and Fertility Group (CGFG) trials register, CENTRAL, MEDLINE, Embase, PsycINFO, CINAHL and two trials registers up to 8 October 2019, together with reference checking and contact with study authors and experts in the field to identify additional studies.
Selection criteria
We included randomised controlled trials (RCTs) of women with anovulatory PCOS and CC resistance who underwent LOD with or without medical ovulation induction versus medical ovulation induction alone, LOD with assisted reproductive technologies (ART) versus ART, LOD with second‐look laparoscopy versus expectant management, or different techniques of LOD.
Data collection and analysis
Two review authors independently selected studies, assessed risks of bias, extracted data and evaluated the quality of the evidence using the GRADE method. The primary effectiveness outcome was live birth and the primary safety outcome was multiple pregnancy. Pregnancy, miscarriage, ovarian hyperstimulation syndrome (OHSS), ovulation, costs, and quality of life were secondary outcomes.
Main results
This updated review includes 38 trials (3326 women). The evidence was very low‐ to moderate‐quality; the main limitations were due to poor reporting of study methods, with downgrading for risks of bias (randomisation and allocation concealment) and lack of blinding.
Laparoscopic ovarian drilling with or without medical ovulation induction versus medical ovulation induction alone
Pooled results suggest LOD may decrease live birth slightly when compared with medical ovulation induction alone (odds ratio (OR) 0.71, 95% confidence interval (CI) 0.54 to 0.92; 9 studies, 1015 women; I2 = 0%; low‐quality evidence). The evidence suggest that if the chance of live birth following medical ovulation induction alone is 42%, the chance following LOD would be between 28% and 40%. The sensitivity analysis restricted to only RCTs with low risk of selection bias suggested there is uncertainty whether there is a difference between the treatments (OR 0.90, 95% CI 0.59 to 1.36; 4 studies, 415 women; I2 = 0%, low‐quality evidence). LOD probably reduces multiple pregnancy rates (Peto OR 0.34, 95% CI 0.18 to 0.66; 14 studies, 1161 women; I2 = 2%; moderate‐quality evidence). This suggests that if we assume the risk of multiple pregnancy following medical ovulation induction is 5.0%, the risk following LOD would be between 0.9% and 3.4%.
Restricting to RCTs that followed women for six months after LOD and six cycles of ovulation induction only, the results for live birth were consistent with the main analysis.
There may be little or no difference between the treatments for the likelihood of a clinical pregnancy (OR 0.86, 95% CI 0.72 to 1.03; 21 studies, 2016 women; I2 = 19%; low‐quality evidence). There is uncertainty about the effect of LOD compared with ovulation induction alone on miscarriage (OR 1.11, 95% CI 0.78 to 1.59; 19 studies, 1909 women; I2 = 0%; low‐quality evidence). OHSS was a very rare event. LOD may reduce OHSS (Peto OR 0.25, 95% CI 0.07 to 0.91; 8 studies, 722 women; I2 = 0%; low‐quality evidence).
Unilateral LOD versus bilateral LOD
Due to the small sample size, the quality of evidence is insufficient to justify a conclusion on live birth (OR 0.83, 95% CI 0.24 to 2.78; 1 study, 44 women; very low‐quality evidence).
There were no data available on multiple pregnancy.
The likelihood of a clinical pregnancy is uncertain between the treatments, due to the quality of the evidence and the large heterogeneity between the studies (OR 0.57, 95% CI 0.39 to 0.84; 7 studies, 470 women; I2 = 60%, very low‐quality evidence). Due to the small sample size, the quality of evidence is not sufficient to justify a conclusion on miscarriage (OR 1.02, 95% CI 0.31 to 3.33; 2 studies, 131 women; I2 = 0%; very low‐quality evidence).
Other comparisons
Due to lack of evidence and very low‐quality data there is uncertainty whether there is a difference for any of the following comparisons: LOD with IVF versus IVF, LOD with second‐look laparoscopy versus expectant management, monopolar versus bipolar LOD, and adjusted thermal dose versus fixed thermal dose.
Authors' conclusions
Laparoscopic ovarian drilling with and without medical ovulation induction may decrease the live birth rate in women with anovulatory PCOS and CC resistance compared with medical ovulation induction alone. But the sensitivity analysis restricted to only RCTs at low risk of selection bias suggests there is uncertainty whether there is a difference between the treatments, due to uncertainty around the estimate. Moderate‐quality evidence shows that LOD probably reduces the number of multiple pregnancy. Low‐quality evidence suggests that there may be little or no difference between the treatments for the likelihood of a clinical pregnancy, and there is uncertainty about the effect of LOD compared with ovulation induction alone on miscarriage. LOD may result in less OHSS.
The quality of evidence is insufficient to justify a conclusion on live birth, clinical pregnancy or miscarriage rate for the analysis of unilateral LOD versus bilateral LOD. There were no data available on multiple pregnancy.
PICO
一般語訳
排卵していない多嚢胞性卵巣症候群の女性に排卵を起こさせるために、腹腔鏡下で熱やレーザーを用いて卵巣に小さな孔を開ける方法
レビューの論点
コクランの著者らは、排卵していない多嚢胞性卵巣症候群(PCOS)の女性に排卵を起こさせる腹腔鏡下卵巣開孔術(LOD)と呼ばれる外科的処置の効果について、内科的治療と比較したエビデンスをレビューした。異なるLOD技術による効果もレビューした。
背景
PCOSの女性は排卵に問題があるため、妊娠しにくい場合がある。以前から、クロミフェンクエン酸塩(CC)がPCOSの女性の第一選択の治療法として使用されてきた。新しいガイドラインによると、レトロゾールによる排卵誘発を第一選択治療とすべきであるが、レトロゾールの使用は正式には認められていない。その結果、クロミフェンクエン酸塩は現在でも一般的に使用されている。CCで治療を受けている女性の約20%は排卵に至らない。このような場合、CC抵抗性PCOSと呼ぶ。CC抵抗性PCOSの女性には、ゴナドトロピン、メトホルミン、アロマターゼ阻害剤(レトロゾール)など、他の排卵誘発剤を用いるが、これらの薬は必ずしも効果があるとは限らず、過剰な反応による多胎妊娠や周期のキャンセルなどの有害事象を引き起こす可能性がある。もう一つの治療の選択肢として、腹腔鏡下卵巣開孔術(LOD)と呼ばれる手術療法がある。この方法は、小さな切り口から腹腔鏡(カメラ)をお腹の中に入れ、卵巣に熱やレーザーを当てるものである。切り口は、通常、おへそのすぐ下に開ける。この治療によって、卵巣でのホルモン分泌やホルモンに対する反応が改善され、排卵の可能性が高まると考えられている。しかし、手術には麻酔による合併症や感染症、癒着などのリスクがある。LODは薬物療法に対する外科的な代替医療であり、このレビューではその利点とリスクを明らかにすることを目的とした。
研究の特徴
今回の更新されたレビューでは、LODと薬物による排卵誘発を比較したり、LODの異なる技術を比較したりした38の比較対照試験が含まれている。このレビューのエビデンスは、2019年10月現在のものである。
主要な結果
エビデンスの質が低い主要な解析結果によると、無排卵性PCOSおよびCC抵抗性の女性において、LODは排卵誘発剤併用の有無にかかわらず、薬物による排卵誘発のみの場合と比較して出生率がわずかに低くなる可能性があることが示された。より質の高いRCTのみを含む解析では、治療法間の差は不確実であると示唆された。薬剤のみによる排卵誘発での出生率が44%だとすると、LOD後の出生率は32~52%になるというエビデンスがある。中程度のエビデンスによると、LODはおそらく多胎妊娠の数を減らすと考えられる。薬剤のみによる排卵誘発での多胎率が5.0%だとすると、LOD後の多胎率は0.9~3.4%になるというエビデンスがある。
臨床妊娠率については、治療法による差はほとんどないか全くないかもしれない。排卵誘発剤のみの治療と比較した場合のLODの流産への影響は不確かである。卵巣過剰刺激症候群(OHSS)は、LOD後に起こる頻度は低いかもしれない。
エビデンスの質が十分でないため、片側の卵巣に対するLODと両側卵巣に対するLODの比較における、出生率、臨床妊娠率および流産に関する結論を正当化できなかった。
他の介入に関する主要アウトカムの結果は、結論を出すには不十分であった。
エビデンスの質
エビデンスの質は低度~中程度だった。エビデンスの主な限界は、研究方法の報告が不十分であること、対象者の選択におけるバイアスの存在、結果のばらつきであった。
Authors' conclusions
Summary of findings
| Laparoscopic ovarian drilling with and without medical ovulation compared to medical ovulation induction alone | ||||||
| Patient or population: women with anovulatory PCOS and CC resistance | ||||||
| Outcomes | Anticipated absolute effects* (95% CI) | Relative effect | № of participants | Certainty of the evidence | Comments | |
| Risk with medical ovulation induction alone | Risk with LOD ±medical ovulation | |||||
| Live birth | 418 per 1000 | 338 per 1000 | OR 0.71 | 1015 | ⊕⊕⊝⊝ | |
| Live birth (sensitivity analysis) | 439 per 1000 | 413 per 1000 (316 to 516) | OR 0.90 (0.59 to 1.36) | 415 (4 RCTs) | ⊕⊕⊝⊝ | |
| Multiple pregnancy | 50 per 1000 | 18 per 1000 | Peto OR 0.34 | 1161 | ⊕⊕⊕⊝ | |
| Clincial pregnancy | 460 per 1000 | 423 per 1000 | OR 0.86 | 2016 | ⊕⊕⊝⊝ | |
| Miscarriage | 64 per 1000 | 71 per 1000 | Peto OR 1.11 | 1909 | ⊕⊕⊝⊝ | |
| OHSS | 23 per 1000 | 6 per 1000 | Peto OR 0.25 | 722 | ⊕⊕⊝⊝ | |
| *The risk in the intervention group (and its 95% confidence interval) is based on the assumed risk in the comparison group and the relative effect of the intervention (and its 95% CI). | ||||||
| GRADE Working Group grades of evidence | ||||||
| aDowngraded by two levels for very serious risk of bias; inadequate randomisation or allocation concealment and no evidence of blinding. bDowngraded by one level for serious risk of bias; no evidence of blinding. cDowngraded by one level for serious imprecision. | ||||||
| LOD of one ovary (unilateral) versus LOD of both ovaries (bilateral) | ||||||
| Patient or population: women with anovulatory PCOS and CC resistance | ||||||
| Outcomes | Anticipated absolute effects* (95% CI) | Relative effect | № of participants | Certainty of the evidence | Comments | |
| Risk with Bilateral | Risk with Unilateral | |||||
| Live birth | 409 per 1000 | 365 per 1000 | OR 0.83 | 44 | ⊕⊝⊝⊝ | ‐ |
| Multiple pregnancy | ‐ | ‐ | ‐ | ‐ | ‐ | No data were reported for this outcome. |
| Clinical pregnancy | 464 per 1000 | 331 per 1000 | OR 0.57 | 470 | ⊕⊕⊝⊝ | ‐ |
| Miscarriage | 91 per 1000 | 93 per 1000 | Peto OR 1.02 | 131 | ⊕⊝⊝⊝ | ‐ |
| OHSS | ‐ | ‐ | ‐ | ‐ | ‐ | No data were reported for this outcome. |
| *The risk in the intervention group (and its 95% confidence interval) is based on the assumed risk in the comparison group and the relative effect of the intervention (and its 95% CI). | ||||||
| GRADE Working Group grades of evidence | ||||||
| aDowngraded by two levels for very serious risk of bias; inadequate randomisation or allocation concealment and no evidence of blinding. bDowngraded by one level for serious imprecision. | ||||||
Background
Description of the condition
Polycystic ovary syndrome (PCOS) is a common condition, affecting 8% to 13% of reproductive‐aged women. PCOS is commonly diagnosed with the Rotterdam PCOS diagnostic criteria (two of clinical or biochemical hyperandrogenism, ovulatory dysfunction, or polycystic ovaries on ultrasound (ESHRE 2018)). Problems in inducing ovulation are well recognised in women with PCOS. Surgical ovarian wedge resection by laparotomy was the first established treatment for women with anovulatory PCOS (Stein 1939), but was largely abandoned because of the risk of post‐surgical adhesion formation, which converted endocrinological subfertility to mechanical subfertility as a result of scarring (Adashi 1981; Buttram 1975). Wedge resection was replaced by medical ovulation induction (Franks 1985). In the past clomiphene citrate (CC) used to be the first‐line treatment in women with PCOS. According to new guidelines, ovulation induction with letrozole should be the first‐line treatment, but the use of letrozole is off‐label (ESHRE 2018). Ovulation induction with CC is not always successful, with approximately 20% of women described as 'clomiphene citrate‐resistant' (Imani 1998). CC resistance is defined as lack of ovulation with the use of CC. Women who are CC‐resistant can be treated with gonadotrophins, other medical ovulation induction agents or a surgical therapy using laparoscopic techniques known as laparoscopic ovarian drilling (LOD).
Description of the intervention
LOD was first described by Gjönnaess 1984. Both laparoscopic ovarian cautery and laser vaporisation using carbon dioxide (CO2), argon or neodymium‐doped yttrium aluminium garnet (Nd:YAG; Nd:Y3Al5O12) crystal lasers have been used to create multiple perforations (approximately 10 holes per ovary) in the ovarian surface and stroma (inner area of the ovary). The procedure can be done on an outpatient basis with less trauma and fewer postoperative adhesions than with ovarian wedge resection. Uncontrolled observational studies claim that it is followed, at least temporarily, by a high rate of spontaneous postoperative ovulation and conception (Armar 1990; Armar 1993; Greenblatt 1987; Kovacs 1991), or that subsequent medical ovulation induction becomes easier (Farhi 1995).
How the intervention might work
The mechanism of action of LOD is thought to be similar to that of ovarian wedge resection. Both procedures may destroy ovarian androgen‐producing tissue and reduce the peripheral conversion of androgens to oestrogens (one of the many disturbances of endocrine physiology that occur in women with PCOS). A fall in the serum levels of androgens and luteinising hormone (LH) and an increase in follicle‐stimulating hormone (FSH) levels have been demonstrated after ovarian drilling (Armar 1990; Greenblatt 1987). The endocrine changes following the surgery are thought to convert the adverse androgen‐dominant intrafollicular environment to an oestrogenic one (Aakvaag 1985), and to restore the hormonal environment to normal by correcting disturbances of the ovarian‐pituitary feedback mechanism (Balen 1993). Thus, both local and systemic effects are thought to promote follicular recruitment, maturation and subsequent ovulation.
Why it is important to do this review
Women who are CC‐resistant can be treated with gonadotrophins or other medical ovulation‐induction agents. These medications are not always successful and can cause adverse events like multiple pregnancies and cycle cancellation due to an excessive response. Gonadotrophin therapy requires daily injections and the need for intensive monitoring with ultrasound which makes them expensive, inconvenient and time‐consuming (ESHRE 2018). LOD is a surgical alternative to medical treatment. There are risks associated with surgery, such as complications from anaesthesia, infection, and adhesions.There might be a small risk of reduced ovarian reserve or loss of ovarian function. Clarification of the role of LOD is needed, in comparison to other treatments, in infertile women with PCOS. This review aimed to determine its benefits, safety, and costs.
Objectives
To evaluate the effectiveness and safety of laparoscopic ovarian drilling (LOD) with or without medical ovulation induction compared with medical ovulation induction alone for women with anovulatory polycystic ovary syndrome (PCOS) and clomiphene citrate resistance.
Methods
Criteria for considering studies for this review
Types of studies
We include randomised controlled trials (RCTs), but exclude quasi‐randomised trials.
Types of participants
Women with anovulatory polycystic ovary syndrome (PCOS), diagnosed by the Rotterdam criteria for PCOS, who had been shown to be resistant to clomiphene (100 mg/day or more). Clomiphene resistance was defined as lack of proven ovulation with the use of clomiphene citrate (CC).
Types of interventions
-
Laparoscopic ovarian drilling (LOD) with or without medical ovulation induction versus medical ovulation induction alone, including all different types of medical ovulation induction and different time periods of follow‐up
-
LOD in women undergoing artificial reproductive technologies (ART) such as LOD plus in vitro fertilisation (IVF) versus IVF
-
LOD with second‐look laparoscopy versus LOD with expectant management
-
Techniques for LOD, including:
-
-
LOD of one ovary (unilateral) versus LOD of both ovaries (bilateral)
-
monopolar versus bipolar
-
adjusted thermal dose versus fixed thermal dose
-
laser versus diathermy
-
We excluded trials that only compared the number of punctures to each ovary, and echoscopic transvaginal hydrolaparoscopic ovarian surgery, since the Cochrane Review Zhang 2019 includes these studies.
Types of outcome measures
Primary outcomes
-
Live birth (defined as delivery of a live fetus after 20 completed weeks of gestation)
-
Multiple pregnancy
Secondary outcomes
-
Clinical pregnancy (defined as evidence of a gestational sac, confirmed by ultrasound)
-
Miscarriage
-
Ovarian hyperstimulation syndrome (OHSS)
-
Ovulation
-
Costs
-
Quality of life
Search methods for identification of studies
For the 2020 update we searched for all published and unpublished RCTs of LOD, without language restriction and in consultation with the Cochrane Gynaecology and Fertility Group (CGFG) Information Specialist.
Electronic searches
We searched the following databases for relevant trials:
-
The CGFG Specialised Register of Controlled Trials, searched 8 October 2019 (Procite platform) (Appendix 1);
-
Cochrane Central Register of Controlled Trials (CENTRAL); searched 8 October 2019 via the Cochrane Register of Studies Online (CSRO Web platform) (Appendix 2);
-
MEDLINE, searched from 1946 to 8 October 2019 (Ovid platform) (Appendix 3);
-
Embase, searched from 1980 to 8 October 2019 (Ovid platform) (Appendix 4);
-
PsycINFO, searched from 1806 to 8 October 2019 (Ovid platform) (Appendix 5);
-
Cumulative Index to Nursing and Allied Health Literature (CINAHL), searched from 1961 to 8 October 2019 (Ebsco platform) (Appendix 6).
We combined the MEDLINE search with the Cochrane highly sensitive search strategy for identifying randomised trials, which appears in the Cochrane Handbook for Systematic Reviews of Interventions (Version 5.1.0, Chapter 6, 6.4.11; Higgins 2011). We combined the Embase, PsycINFO, and CINAHL searches with trial filters developed by the Scottish Intercollegiate Guidelines Network (www.sign.ac.uk/search‐filters.html).
Other electronic sources of trials include the following:
-
Trial registers for ongoing and registered trials: www.clinicaltrials.gov (a service of the US National Institutes of Health) and www.who.int/trialsearch/Default.aspx (the World Health Organization International Trials Registry Platform search portal);
-
LILACS and other Spanish and Portuguese language databases (Latin American and Caribbean Health Science Information database (from 1982 ongoing)), found in the Virtual Health Library Regional Portal (VHL) pesquise.bvsalud.org/portal/.
-
PubMed and Google Scholar, for recent trials not yet indexed in the major databases.
Searching other resources
We handsearched the reference lists of relevant trials and systematic reviews retrieved by the search, and contacted experts in the field to obtain additional data. We also handsearched for relevant journals and conference abstracts that were not covered in the CGFG register, in liaison with the Information Specialist.
Data collection and analysis
Selection of studies
For the 2020 update, after an initial screen of titles and abstracts retrieved by the search, conducted by EB and LR, we retrieved the full texts of all the potentially eligible studies. Two review authors (EB and LR or JM and JB) then independently examined the full‐text articles for compliance with the inclusion criteria and to select eligible studies. We intended to contact study investigators if required, to clarify study eligibility. We resolved disagreements by discussion with a third review author (MW). We documented the 2020 update selection process with a PRISMA flow chart.
Data extraction and management
Two review authors (EB and LR or JB and BN) independently extracted data from eligible studies using a data extraction form, and resolving any disagreements by discussion with a third review author (MW). Data extraction included study characteristics and outcome data (see Characteristics of included studies tables). We reported studies with multiple publications under a single study ID with multiple references. We contacted study investigators for further data on methods and results, if required.
Assessment of risk of bias in included studies
Two review authors (EB and LR or BN and JB) independently assessed the included studies for risks of bias, using the Cochrane 'Risk of bias' assessment tool (Higgins 2017) to assess: selection (random sequence generation and allocation concealment); performance (blinding of participants and personnel); detection (blinding of outcome assessors); attrition (incomplete outcome data); reporting (selective reporting); and other potential bias. We resolved disagreements by discussion with a third review author (MW). We described all judgements fully and presented the conclusions in the 'Risk of bias' table, which we incorporated into the interpretation of review findings by means of sensitivity analyses.
Measures of treatment effect
For dichotomous data, we used the numbers of events in the control and intervention groups of each study and calculated Mantel‐Haenszel odds ratios (ORs) or Peto ORs. For continuous data (e.g. costs), if all studies reported exactly the same outcomes, we calculated mean differences (MDs) between treatment groups. If similar outcomes were reported on different scales we calculated the standardised mean difference (SMD). We treated ordinal data (e.g. quality‐of‐life scores) as continuous data. We present 95% confidence intervals (CIs) for all outcomes.
Unit of analysis issues
The primary analysis was by woman randomised. We counted multiple births as one live birth event. If data did not allow valid analysis (e.g. 'by cycle' data) we contacted the primary authors for data by woman randomised, and did not include the 'by cycle' data in the meta‐analyses. For cross‐over trials, we included only first‐phase data.
Dealing with missing data
We analysed the data on an intention‐to‐treat basis as far as possible (i.e. including all randomised participants in analysis, in the groups to which they were randomised). We tried to obtain missing data from the original trialists, by contacting the primary authors. We analysed only the available data, without imputation.
Assessment of heterogeneity
We considered whether clinical and methodological characteristics of the included studies were sufficiently similar for meta‐analysis to provide a clinically meaningful summary. We assessed statistical heterogeneity by the I2 statistic. We took an I2 measurement greater than 50% as an indication of substantial heterogeneity (Deeks 2017).
Assessment of reporting biases
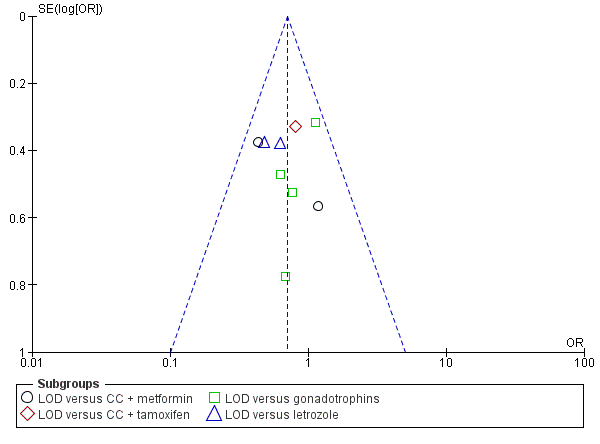
In view of the difficulty of detecting and correcting for publication bias and other reporting biases, we aimed to minimise their potential impact by ensuring a comprehensive search for eligible studies and by being alert for duplication of data. We used a funnel plot to explore the possibility of small‐study effects (a tendency for estimates of the intervention effect to be more beneficial in smaller studies), where 10 studies or more contributed to the analysis.
Data synthesis
If studies were sufficiently similar, we combined the data using a fixed‐effect model in the following comparisons:
-
LOD with or without medical ovulation induction versus medical ovulation induction alone
-
LOD in women undergoing IVF versus IVF
-
LOD with second‐look laparoscopy versus LOD with expectant management
-
Techniques for LOD, including:
-
-
LOD of one ovary (unilateral) versus LOD of both ovaries (bilateral)
-
monopolar versus bipolar
-
fixed thermal dose versus adjusted thermal dose
-
laser versus diathermy
-
We performed statistical analysis using Review Manager 5.3 (Review Manager 2014).
Subgroup analysis and investigation of heterogeneity
We conducted subgroup analyses for the different medical ovulation‐induction agents, to determine the separate evidence for:
-
clomiphene citrate (CC)
-
CC + metformin
-
CC + tamoxifen
-
CC + rosiglitazone
-
gonadotrophins
-
gonadotrophins (rFSH) + metformin
-
letrozole
-
letrozole + metformin
-
metformin
Sensitivity analysis
We conducted sensitivity analyses for the primary outcomes of live birth and multiple pregnancy, to determine whether the conclusions were robust to arbitrary decisions made about eligibility and analysis. These analyses included consideration of whether the review conclusions would have differed if:
-
Eligibility had been restricted to studies at low risk of bias (defined as studies at low risk of selection bias);
-
High levels of heterogeneity were present;
-
Follow‐up in the individual trials had lasted for at least six months or six cycles.
Overall quality of the body of evidence
We updated the 'Summary of findings' tables using GRADEpro and Cochrane methods (Gradepro GDT 2015; Schünemann 2017). summary of findings Table for the main comparison presents the overall quality of the body of evidence for the main review outcomes (live birth, multiple pregnancy, clinical pregnancy, miscarriage and OHSS) for the main review comparison (LOD with or without medical ovulation induction compared with medical ovulation induction alone). We produced an additional 'Summary of findings' table (summary of findings Table 2) for the main review outcomes for one other important comparison: Unilateral LOD versus bilateral LOD. We evaluated the quality of the evidence using GRADE criteria: risk of bias, consistency of effect, imprecision, indirectness and publication bias. Two review authors (EB and LR), working independently, made judgements about the evidence quality (high, moderate, low or very low), resolving disagreements by discussion with a third review author (MW). The judgements were justified, documented, and incorporated into the reporting of results for each outcome.
Results
Description of studies
Results of the search
The original review retrieved 19 full‐text articles and included nine RCTs. For the 2012 update we identified 86 potential articles, from which 16 trials met the inclusion criteria. The 2020 update includes a further 15 trials (Darwish 2016; Elgafor 2013; El‐Sayed 2017; Fernandez 2015; Giampaolino 2016; Ibrahim 2017; Jamal 2000; Liu 2015; Malkawi 2003; Mamonov 2000; Mehrabian 2012; Rezk 2016; Sorouri 2015; Yadav 2018; Zakherah 2011). We placed two studies which were included in the previous update to studies awaiting classification (Abu Hashim 2010; Abu Hashim 2011). This gives a total of 38 trials (3326 women) now included. See Figure 1 for the PRISMA flow chart.

Study flow diagram.
We added three papers associated with the Bayram 2004 trial, one paper associated with the Farquhar 2002 trial and one paper associated with the Zakherah 2011 trial.
There are currently nine ongoing studies (IRCT138903291306N2; NCT02239107; NCT02305693; NCT02381184; NCT02775734; NCT03009838; NCT03206892; NCT03664050; PACTR201411000886127). In future updates we will check whether data from these trials have been published.
We exclude a total of 29 studies, with eight trials excluded from the 2020 update (Franz 2016; Kandil 2018; Roy 2018; Salah 2013; Seyam 2018; Sunj 2013; Wang 2015; Zeng 2012).
See study tables: Characteristics of included studies; Characteristics of excluded studies; Characteristics of studies awaiting classification; and Characteristics of ongoing studies.
Included studies
Study design and setting
We include 38 trials in this systematic review. All studies are parallel‐design randomised controlled trials (RCTs). All of the trials recruited women with fertility problems who were attending fertility clinics. Twelve were from Egypt (Abdellah 2011; Darwish 2016; Elgafor 2013; El‐Sayed 2017; Hamed 2010; Ibrahim 2017; Nasr 2013; Nasr 2015; Rezk 2016; Youssef 2007; Zakherah 2010; Zakherah 2011), four from India (Roy 2009; Roy 2010; Sharma 2006; Yadav 2018), four from Iran (Ashrafinia 2009; Ghafarnegad 2010; Mehrabian 2012; Sorouri 2015), four from Italy (Fernandez 2015; Palomba 2004; Palomba 2010; Vegetti 1998), four from the UK (Al‐Mizyen 2000; Amer 2009; Balen 1994; Rimington 1997), two from Turkey (Gürgan 1992; Kaya 2005), one from China (Liu 2015), one from France (Fernandez 2015), one from Jordan (Malkawi 2003), one from the Netherlands (Bayram 2004), one from New Zealand (Farquhar 2002), one from Saudi Arabia (Jamal 2000), one from Ukraine (Mamonov 2000), and one from Yugoslavia (Lazoviz 1998).
Participants
1. LOD with or without medical ovulation induction versus medical ovulation induction alone
Twenty‐one trials including 1031 women in the LOD groups and 985 women in the medical ovulation induction‐alone groups (Abdellah 2011; Amer 2009; Bayram 2004; Elgafor 2013; Farquhar 2002; Fernandez 2015; Ghafarnegad 2010; Hamed 2010; Ibrahim 2017; Kaya 2005; Lazoviz 1998; Liu 2015; Malkawi 2003; Mamonov 2000; Mehrabian 2012; Palomba 2004; Palomba 2010; Roy 2010; Vegetti 1998; Yadav 2018; Zakherah 2010). All of the women had subfertility and PCOS.
2. LOD plus IVF versus IVF
One trial (Rimington 1997) included 25 women who had undergone LOD plus IVF and 25 women who had undergone IVF. The mean age of the women in the LOD+ IVF group was 31.8 years and in the IVF group 31 years.
3. LOD with second‐look laparoscopy versus LOD with expectant management
One trial (Gürgan 1992) included 20 women who had undergone second‐look laparoscopy and 20 women who had received expectant management. The mean age of the women was 25.2 years.
Techniques of ovarian drilling
4. Unilateral LOD versus bilateral LOD
Nine trials included 233 women in the unilateral LOD groups and 237 women in the bilateral LOD group (Al‐Mizyen 2000; Balen 1994; El‐Sayed 2017; Jamal 2000; Nasr 2013; Rezk 2016; Roy 2009; Sorouri 2015; Youssef 2007). The mean age of women in the unilateral group was 28.8 years and in the bilateral group 28 years. Jamal 2000 did not give details of the number of women in each group (total n = 35).
5. Monopolar versus bipolar
Three trials included 175 women in the monopolar groups and 176 women in the bipolar groups (Darwish 2016; Giampaolino 2016; Sharma 2006).
6. Adjusted thermal dose versus fixed thermal dose
Two trials including 100 women in the adjusted thermal dose groups and 100 women in the fixed thermal dose groups (Nasr 2015; Zakherah 2011).
Interventions
1. LOD with or without medical ovulation induction versus medical ovulation induction alone
-
1/22 trials compared LOD with clomiphene citrate (Amer 2009);
-
2/22 trials compared LOD with CC + metformin ( Palomba 2004; Palomba 2010);
-
1/22 trials compared LOD with CC + tamoxifen (Zakherah 2010);
-
1/22 trials compared LOD with CC + rosiglatazone (Roy 2010);
-
9/22 trials compared LOD with gonadotrophins (Bayram 2004; Farquhar 2002; Ghafarnegad 2010; Kaya 2005; Lazoviz 1998; Mamonov 2000; Mehrabian 2012; Vegetti 1998; Yadav 2018);
-
1/22 trials compared LOD with gonadotrophins (rFSH) + metformin (Fernandez 2015);
-
3/22 trials compared LOD with letrozole (Abdellah 2011; Ibrahim 2017; Liu 2015);
-
1/22 trials compared LOD with letrozole + metformin (Elgafor 2013);
-
3/22 trials compared LOD with metformin (Ashrafinia 2009; Hamed 2010; Malkawi 2003).
Fifteen of the trials followed women for six months after LOD and six cycles of ovulation induction (Abdellah 2011; Amer 2009; Ashrafinia 2009; Elgafor 2013; Fernandez 2015; Hamed 2010; Ibrahim 2017; Lazoviz 1998; Liu 2015; Palomba 2004; Palomba 2010; Roy 2010; Vegetti 1998; Yadav 2018; Zakherah 2010). Two trials had no details on the timing of follow‐up (Mehrabian 2012; Malkawi 2003), two trials followed women for six months after LOD and three cycles of gonadotrophins within six months (Farquhar 2002; Kaya 2005), one trial followed women for 12 months after LOD and six cycles of gonadotrophins within 12 months (Bayram 2004), one trial followed women for four months after LOD and four cycles of gonadotrophins (Ghafarnegad 2010), and one trial followed women for 18 months after LOD and six cycles of gonadotrophins (Mamonov 2000).
2. LOD plus IVF versus IVF
-
1/1 trial compared LOD plus IVF versus IVF (Rimington 1997). Follow‐up was for one cycle in each group.
3. LOD with second‐look laparoscopy versus LOD with expectant management
-
1/1 trial compared second‐look laparoscopy versus expectant management (Gürgan 1992). Follow‐up was for six months in each group.
Techniques of LOD
-
Nine trials compared unilateral and bilateral drilling. Four trials followed women for six months (Rezk 2016; El‐Sayed 2017; Nasr 2013; Sorouri 2015), three trials for 12 months (Al‐Mizyen 2000; Roy 2009; Youssef 2007), and two trials for three months (Balen 1994; Jamal 2000)
-
Three trials compared monopolar versus bipolar technique, of which two trials followed women for six months (Darwish 2016; Giampaolino 2016), and one trial for three months (Sharma 2006)
-
Two trials compared adjusted thermal dose versus fixed thermal dose (Nasr 2015; Zakherah 2011). Follow‐up was for six months in each group.
Outcomes
1. Outcomes for LOD with or without medical ovulation induction versus medical ovulation induction alone
-
9/22 reported live birth (Abdellah 2011; Bayram 2004; Farquhar 2002; Ghafarnegad 2010; Liu 2015; Palomba 2004; Palomba 2010; Yadav 2018; Zakherah 2010);
-
14/22 reported multiple pregnancy (Abdellah 2011; Amer 2009; Bayram 2004; Farquhar 2002; Fernandez 2015; Kaya 2005; Lazoviz 1998; Malkawi 2003; Mehrabian 2012; Palomba 2004; Palomba 2010; Roy 2010; Vegetti 1998; Yadav 2018);
-
21/22 reported clinical pregnancy (Abdellah 2011; Amer 2009; Bayram 2004; Elgafor 2013; Farquhar 2002; Fernandez 2015; Ghafarnegad 2010; Hamed 2010; Ibrahim 2017; Kaya 2005; Lazoviz 1998; Liu 2015; Malkawi 2003; Mamonov 2000; Mehrabian 2012; Palomba 2004; Palomba 2010; Roy 2010; Vegetti 1998; Yadav 2018; Zakherah 2010);
-
19/22 reported miscarriage (Abdellah 2011; Bayram 2004; Elgafor 2013; Farquhar 2002; Fernandez 2015; Ghafarnegad 2010; Hamed 2010; Ibrahim 2017; Lazoviz 1998; Liu 2015; Malkawi 2003; Mamonov 2000; Mehrabian 2012; Palomba 2004; Palomba 2010; Roy 2010; Vegetti 1998; Yadav 2018; Zakherah 2010);
-
8/22 reported OHSS (Amer 2009; Bayram 2004; Farquhar 2002; Kaya 2005; Malkawi 2003; Mehrabian 2012Roy 2010; Yadav 2018);
-
10/22 reported ovulation (Amer 2009; Elgafor 2013; Farquhar 2002; Hamed 2010; Ibrahim 2017; Malkawi 2003; Palomba 2010; Roy 2010; Yadav 2018; Zakherah 2010);
-
4/22 reported costs (Bayram 2004; Farquhar 2002; Kaya 2005; Palomba 2010);
-
1/22 reported quality of life (Bayram 2004).
One trial was identified that met all of the inclusion criteria associated with the population and interventions but did not report on any obstetric outcomes (Ashrafinia 2009). We have contacted the authors for information but there has been no response to date.
2. Outcomes for LOD plus IVF versus IVF
-
1/1 reported live birth (Rimington 1997)
-
1/1 reported multiple pregnancy (Rimington 1997)
-
1/1 reported clinical pregnancy (Rimington 1997)
-
1/1 reported miscarriage (Rimington 1997)
-
1/1 reported OHSS (Rimington 1997)
3. Outcomes for LOD with second‐look laparoscopy versus LOD with expectant management
-
1/1 reported clinical pregnancy (Gürgan 1992)
-
1/1 reported miscarriage (Gürgan 1992)
-
1/1 reported ovulation (Gürgan 1992)
4. Outcomes for techniques of LOD: unilateral versus bilateral
-
1/9 studies reported live birth (Roy 2009);
-
7/9 studies reported clinical pregnancy (Al‐Mizyen 2000; Balen 1994; El‐Sayed 2017; Rezk 2016; Roy 2009; Sorouri 2015; Youssef 2007);
-
2/9 studies reported miscarriage (Roy 2009; Youssef 2007);
-
6/9 studies reported ovulation (Balen 1994; El‐Sayed 2017; Rezk 2016; Roy 2009; Sorouri 2015; Youssef 2007).
5. Outcomes for techniques of LOD: monopolar versus bilateral
-
3/3 studies reported clinical pregnancy (Darwish 2016; Giampaolino 2016; Sharma 2006);
-
2/3 studies reported ovulation (Darwish 2016; Sharma 2006)
6. Outcomes for techniques of LOD: adjusted thermal dose versus fixed thermal dose
-
2/2 studies reported clinical pregnancy (Nasr 2015; Zakherah 2011);
-
1/2 studies reported miscarriage (Zakherah 2011);
-
2/2 studies reported ovulation (Nasr 2015; Zakherah 2011).
Jamal 2000 did not report any data in their conference abstract. Nasr 2013 reported only on anti‐Mullerian hormone as their outcome, which was not a prespecified outcome for this review.
Excluded studies
We excluded 29 studies from the review, for the following reasons (refer to Characteristics of excluded studies for further details):
-
11/29 were not RCTs (Abdel Gadir 1990; Gadir 1992; Al‐Mizyen 2000; Sunj 2013; Gürgan 1991; Heylen 1994; Keckstein 1990; Malkawi 2005; Muenstermann 2000; Rath 2006; Seyam 2018);
-
13/29 had comparisons that were not of interest (Badawy 2009; Franz 2016; Foroozanfard 2010; Kamel 2004; Kandil 2018; Kocak 2006; Nasr 2010; Roy 2018; Salah 2013; Saravelos 1996; Tabrizi 2005; Zeng 2012; Zhu 2010);
-
1/29 had participants not of interest (Abu Hashim 2011b);
-
1/29 had interventions not of interest (Vrbikova 1998);
-
1/29 had ovaries as the unit of randomisation (Greenblatt 1993);
-
1/29 was retracted by the journal (Wang 2015);
-
1/29 is a conference abstract; we tried to obtain the details, but had no response from the authors, so excluded it for lack of usable data (Lockwood 1995).
Risk of bias in included studies
The risks of bias of included studies are illustrated in Figure 2; Figure 3.

Risk of bias graph: review authors' judgements about each risk of bias item presented as percentages across all included studies.
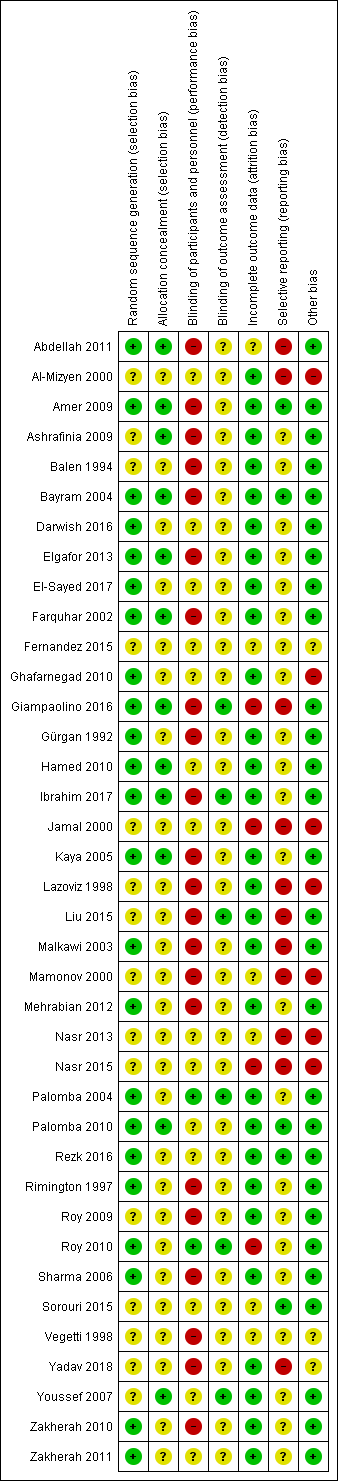
Risk of bias summary: review authors' judgements about each risk of bias item for each included study.
Allocation
Random sequence generation
Twenty‐three trials were at low risk of bias due to random sequence generation, as they clearly explained the methods used (Abdellah 2011; Amer 2009; Bayram 2004; Darwish 2016; Elgafor 2013; El‐Sayed 2017; Farquhar 2002; Ghafarnegad 2010; Giampaolino 2016; Gürgan 1992; Hamed 2010; Ibrahim 2017; Kaya 2005; Malkawi 2003; Mehrabian 2012; Palomba 2004; Palomba 2010; Rezk 2016; Rimington 1997; Roy 2010; Sharma 2006; Zakherah 2010; Zakherah 2011).
Fifteen trials did not provide an adequate explanation of the randomisation process and were judged to be at unclear risk of bias (Al‐Mizyen 2000; Ashrafinia 2009; Balen 1994; Fernandez 2015; Jamal 2000; Lazoviz 1998; Liu 2015; Mamonov 2000; Nasr 2013; Nasr 2015; Roy 2009; Sorouri 2015; Vegetti 1998; Yadav 2018; Youssef 2007).
Allocation concealment
Twelve trials were at low risk of selection bias related to allocation concealment, as they used central allocation concealment or sealed opaque sequentially‐numbered envelopes (Abdellah 2011; Amer 2009; Ashrafinia 2009; Bayram 2004; Elgafor 2013; Farquhar 2002; Giampaolino 2016; Hamed 2010; Ibrahim 2017; Kaya 2005; Palomba 2010; Youssef 2007).
Twenty‐six trials did not provide adequate details to establish whether an appropriate method of allocation concealment had been used, and were judged to be of unclear risk of selection bias (Al‐Mizyen 2000; Balen 1994; Darwish 2016; El‐Sayed 2017; Fernandez 2015; Ghafarnegad 2010; Gürgan 1992; Jamal 2000; Lazoviz 1998; Liu 2015; Malkawi 2003; Mamonov 2000; Mehrabian 2012; Nasr 2013; Nasr 2015; Palomba 2004; Rezk 2016; Rimington 1997; Roy 2009; Roy 2010; Sharma 2006; Sorouri 2015; Vegetti 1998; Yadav 2018; Zakherah 2010; Zakherah 2011).
Blinding
Performance bias
We rated two trials at low risk of performance bias (Palomba 2004; Roy 2010). There was insufficient detail to tell if researchers or participants had been blinded in 14 trials that we judged to be at unclear risk of performance bias (Al‐Mizyen 2000; Darwish 2016; El‐Sayed 2017; Fernandez 2015; Ghafarnegad 2010; Hamed 2010; Jamal 2000; Nasr 2013; Nasr 2015; Palomba 2010; Rezk 2016; Sorouri 2015; Youssef 2007; Zakherah 2011). For the remaining 22 trials there was no blinding of participants or researchers and we judged these trials to be at high risk of bias (Abdellah 2011; Amer 2009; Ashrafinia 2009; Balen 1994; Bayram 2004; Elgafor 2013; Farquhar 2002; Giampaolino 2016; Gürgan 1992; Ibrahim 2017; Kaya 2005; Lazoviz 1998; Liu 2015; Malkawi 2003; Mamonov 2000; Mehrabian 2012; Rimington 1997; Roy 2009; Sharma 2006; Vegetti 1998; Yadav 2018; Zakherah 2010).
Detection bias
We judged six trials to be at low risk of detection bias, as the outcome assessors were blinded to treatment allocation ( Giampaolino 2016; Ibrahim 2017; Liu 2015; Palomba 2004; Roy 2010; Youssef 2007).
There was insufficient detail to tell if researchers or participants had been blinded in the remaining 32 trials that we judged to be at unclear risk of detection bias (Abdellah 2011; Al‐Mizyen 2000; Amer 2009; Ashrafinia 2009; Balen 1994; Bayram 2004; Darwish 2016; Elgafor 2013; El‐Sayed 2017; Farquhar 2002; Fernandez 2015; Ghafarnegad 2010; Gürgan 1992; Hamed 2010; Jamal 2000; Kaya 2005; Lazoviz 1998; Malkawi 2003; Mamonov 2000; Mehrabian 2012; Nasr 2013; Nasr 2015; Palomba 2010; Rezk 2016; Rimington 1997; Roy 2009; Sharma 2006; Sorouri 2015; Vegetti 1998; Yadav 2018; Zakherah 2010; Zakherah 2011).
Incomplete outcome data
We judged 28 trials to be at low risk of attrition bias ( Al‐Mizyen 2000; Amer 2009; Ashrafinia 2009; Balen 1994; Bayram 2004; Darwish 2016; Elgafor 2013; El‐Sayed 2017; Farquhar 2002;Ghafarnegad 2010; Gürgan 1992; Hamed 2010; Ibrahim 2017; Kaya 2005; Lazoviz 1998; Liu 2015; Malkawi 2003; Mehrabian 2012; Palomba 2004; Palomba 2010; Rezk 2016; Rimington 1997; Roy 2009; Sharma 2006; Yadav 2018; Youssef 2007; Zakherah 2010; Zakherah 2011).
We rated six trials at unclear risk of attrition bias, due to insufficient details (Abdellah 2011; Fernandez 2015; Mamonov 2000; Nasr 2013; Sorouri 2015; Vegetti 1998).
We considered four trials to be at high risk of attrition bias (Giampaolino 2016; Jamal 2000; Nasr 2015; Roy 2010). Roy 2010 was rated at high risk of bias because the attrition of women in the trials was not adequately explained and intention‐to‐treat analysis was not conducted.
Selective reporting
We checked four of the original trial protocols, and considered four to be at low risk of bias (Amer 2009; Bayram 2004; Palomba 2010; Sorouri 2015). In these studies all the outcomes mentioned in the protocol were presented in the published report.
We could not retrieve protocols for the other trials. Most of them did report on all of the outcomes listed in the methods section of the papers. We rated 11 trials at high risk of bias (Abdellah 2011; Al‐Mizyen 2000; Giampaolino 2016; Jamal 2000; Lazoviz 1998; Liu 2015; Malkawi 2003; Mamonov 2000; Nasr 2013; Nasr 2015; Yadav 2018), with most reporting on outcomes that had not been listed in the Methods section.
Lazoviz 1998 and Nasr 2013 were published in conference abstract form only, and we could find no full study report, while Mamonov 2000 did not list any outcomes in the Methods section of their conference abstract.
Other potential sources of bias
We judged three trials to be at unclear risk of bias. Fernandez 2015 reported that the trial stopped early due to difficulties in the inclusion criteria, and Vegetti 1998 only reported interim results for which we could find no full publication. Women with LOD received CC or gonadotrophins in Yadav 2018. We rated seven trials at high risk of other bias, as they were only published as abstracts (Al‐Mizyen 2000; Ghafarnegad 2010; Jamal 2000; Lazoviz 1998; Mamonov 2000; Nasr 2013; Nasr 2015). We rated the remaining trials at low risk of bias.
Effects of interventions
See: Summary of findings for the main comparison LOD with and without medical ovulation compared to medical ovulation induction alone; Summary of findings 2 LOD of one ovary (unilateral) versus LOD of both ovaries (bilateral)
1. LOD with or without medical ovulation induction versus medical ovulation induction alone
1.1 Live birth
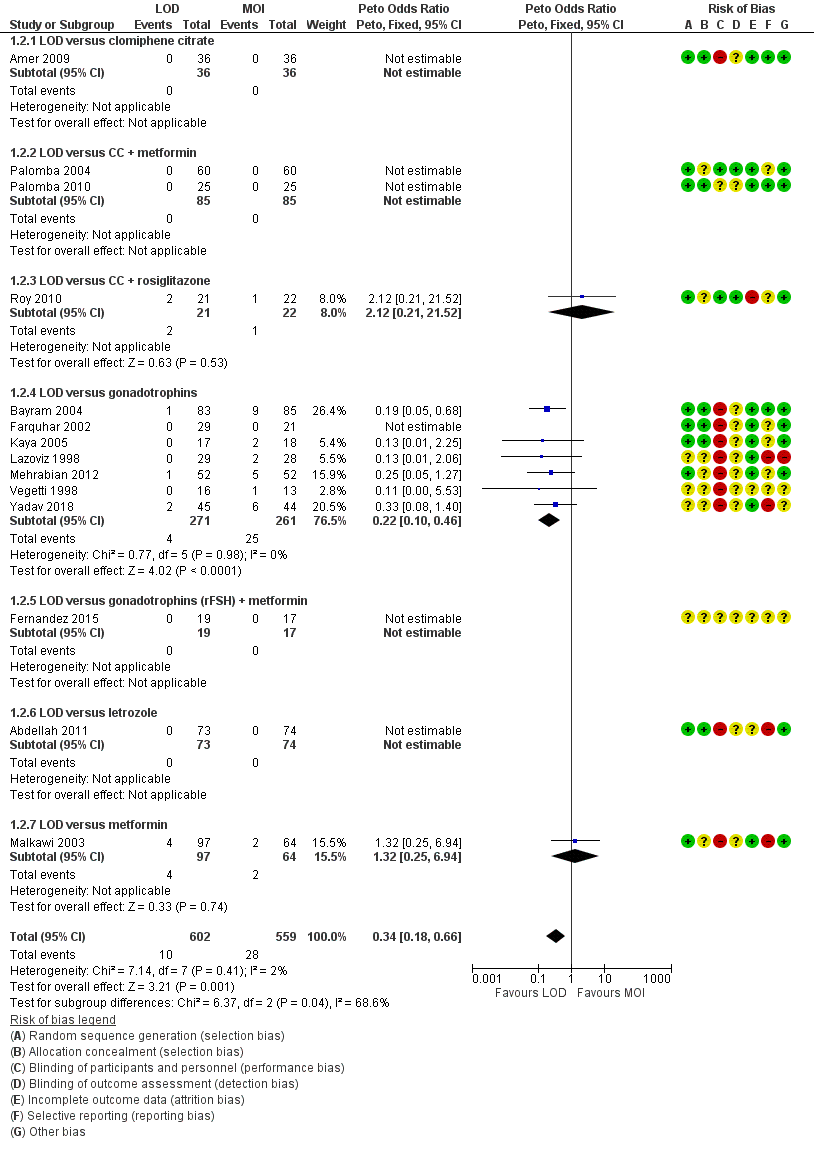
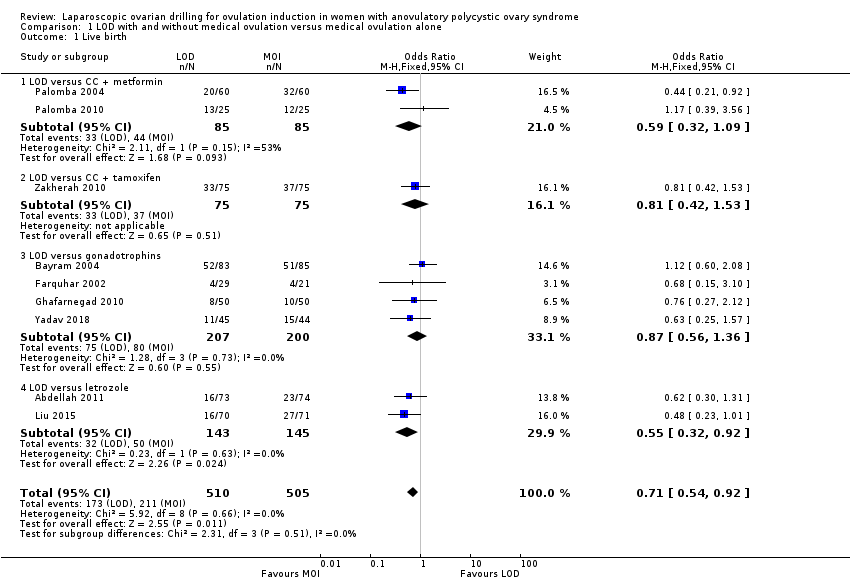
Nine trials including 1015 women reported live birth rate by woman (Abdellah 2011; Bayram 2004; Farquhar 2002; Ghafarnegad 2010; Liu 2015; Palomba 2004; Palomba 2010; Yadav 2018; Zakherah 2010). The meta‐analysis shows that LOD may decrease live birth slightly when compared with medical ovulation induction alone (odds ratio (OR) 0.71, 95% confidence interval (CI) 0.54 to 0.92; 9 studies, 1015 women; I2 = 0%; low‐quality evidence; Analysis 1.1; Figure 4).

Forest plot of comparison: 1 LOD with and without medical ovulation versus medical ovulation alone, outcome: 1.1 Live birth.
MOI: Medical ovulation induction alone
LOD: laparoscopic ovarian drilling with or without medical ovulation induction
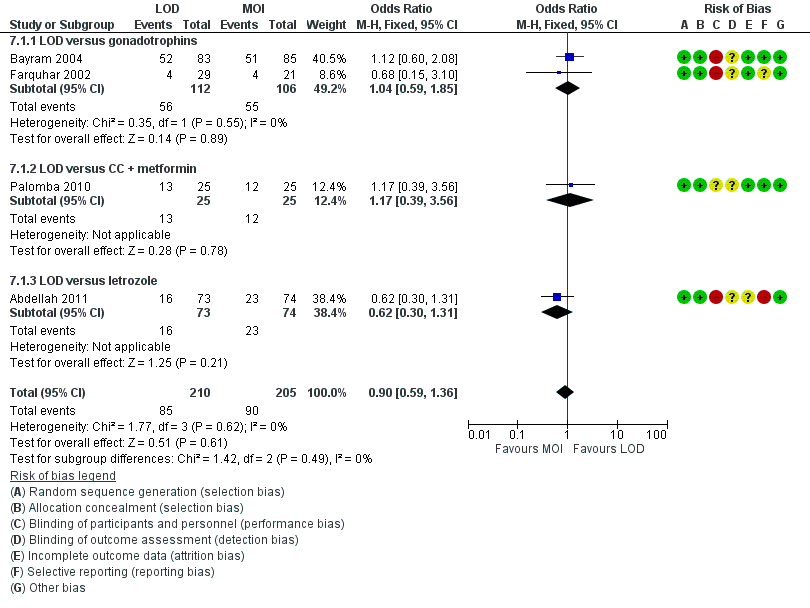
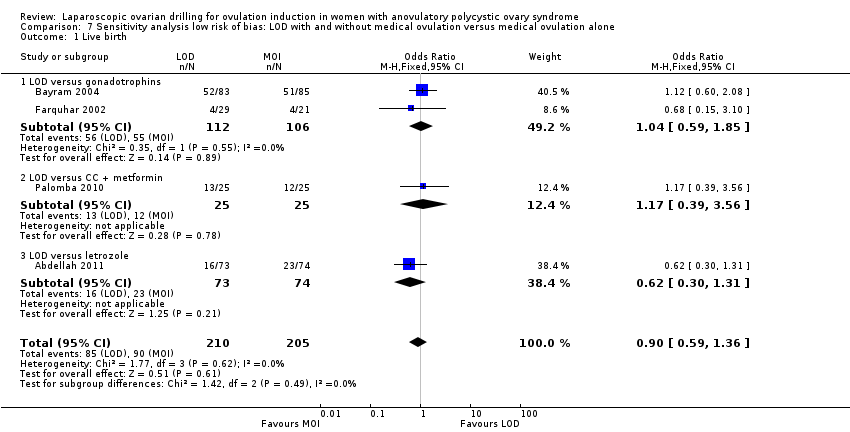
The evidence suggest that if the chance of live birth following medical ovulation induction alone is 42%, the chance following LOD would be between 28% and 40%. The funnel plot did not indicate publication bias (Figure 5). Our sensitivity analysis restricting to RCTs with low risk of selection bias (Abdellah 2011; Bayram 2004; Farquhar 2002; Palomba 2010) suggests there is uncertainty whether there is a difference between the treatments (OR 0.90, 95% CI 0.59 to 1.36; 4 studies, 415 women; I2 = 0%, low‐quality evidence; Analysis 7.1; Figure 6). This result suggests that if the chance of live birth following medical ovulation induction alone is 44%, the chance following LOD would be between 32% and 52%.

Funnel plot of comparison: 1 LOD with and without medical ovulation versus medical ovulation alone, outcome: 1.1 Live birth.
LOD: laparoscopic ovarian drilling with or without medical ovulation induction

Forest plot of comparison: 5 Sensitivity analysis low risk of bias: LOD with and without medical ovulation versus medical ovulation alone, outcome: 5.1 Live birth.
MOI: Medical ovulation induction alone
LOD: laparoscopic ovarian drilling with or without medical ovulation induction
Only one small trial had no treatment time/follow‐up of at least six months (Ghafarnegad 2010). Restricting to studies with at least six months of follow‐up resulted in a similar estimate for live birth. There were four different comparisons with LOD: clomiphene citrate (CC) and metformin (Palomba 2004; Palomba 2010), CC and tamoxifen (Zakherah 2010), gonadotrophins (Bayram 2004; Farquhar 2002; Ghafarnegad 2010; Yadav 2018) and letrozole (Abdellah 2011; Liu 2015). Subgroup analysis did not identify any between‐group differences.
One of the trials (Bayram 2004) continued longitudinal follow‐up for a mean of 133.5 months for 95% of the original sample. At this extended follow‐up point 86% of couples having LOD and 81% of couples having recombinant FSH (rFSH) had conceived and reported a live birth (P = 0.63). However, LOD resulted in significantly reduced requirements for stimulated cycles to reach a live birth outcome (44/71 live births in the LOD group versus 65/69 live births in the rFSH group; RR 0.69, 95% CI 0.55 to 0.88). Significantly more women in the LOD group had a second live birth compared with the rFSH group (61% versus 46%; RR 1.30, 95% CI 1.01 to 1.80; P = 0.03). Of those women achieving a second live birth in the LOD group 24% required additional treatment, as did 19% of those in the rFSH group who had a second live birth. At the end of follow‐up there had been 134 live births in the LOD group and 124 in the rFSH group (P = 0.09). Of the 175 pregnancies in the LOD group, five were ectopic and 31 miscarriages occurred, compared with three ectopic pregnancies in a total of 159 pregnancies in the rFSH group (risk ratio (RR) 1.50, 95% CI 0.37 to 6.20) and 23 miscarriages (RR 1.20, 95% CI 0.75 to 2.0).
1.2 Multiple pregnancy
Fourteen trials including 1161 women reported on multiple pregnancies (Abdellah 2011; Amer 2009; Bayram 2004; Farquhar 2002; Fernandez 2015; Kaya 2005; Lazoviz 1998; Malkawi 2003; Mehrabian 2012; Palomba 2004; Palomba 2010; Roy 2010; Vegetti 1998; Yadav 2018). The meta‐analysis shows that LOD probably reduces multiple pregnancy rates compared with medical ovulation induction alone (Peto OR 0.34, 95% CI 0.18 to 0.66; 14 studies, 1161 women; I2 = 2%; moderate‐quality evidence; Analysis 1.2; Figure 7). This suggests that if we assume the risk of multiple pregnancy following medical ovulation induction alone is 5.0%, the risk following LOD would be between 0.9% and 3.4%. Caution is advised in interpreting the analysis, as event rates are very low, with 10/602 in the LOD group and 28/559 in the other treatment group. Sensitivity analysis: after restricting to only RCTs with low risk of selection bias; the result for multiple pregnancy was consistent with the main analysis (Analysis 7.2). Analysis per pregnancy showed similar results (Peto OR 0.34, 95% CI 0.17 to 0.66; 14 studies, 577 women, I2 = 22%; Analysis 1.11). Subgroup analysis did not identify any between‐group differences. There were no cases of multiple pregnancies in either group for CC (Amer 2009), CC and metformin (Palomba 2004; Palomba 2010), gonadotrophins (Farquhar 2002 only), gonadotrophins (rFSH) + metformin (Fernandez 2015) or letrozole (Abdellah 2011 only) compared with LOD. Only one small trial had no treatment time/follow‐up of at least six months (Ghafarnegad 2010), and consequently restricting to studies with at least six months of follow‐up resulted in a similar estimate for multiple pregnancy.
Forest plot of comparison: 1 LOD with and without medical ovulation versus medical ovulation alone, outcome: 1.4 Multiple pregnancy rate (per ongoing pregnancy).
MOI: Medical ovulation induction alone
LOD: laparoscopic ovarian drilling with or without medical ovulation induction
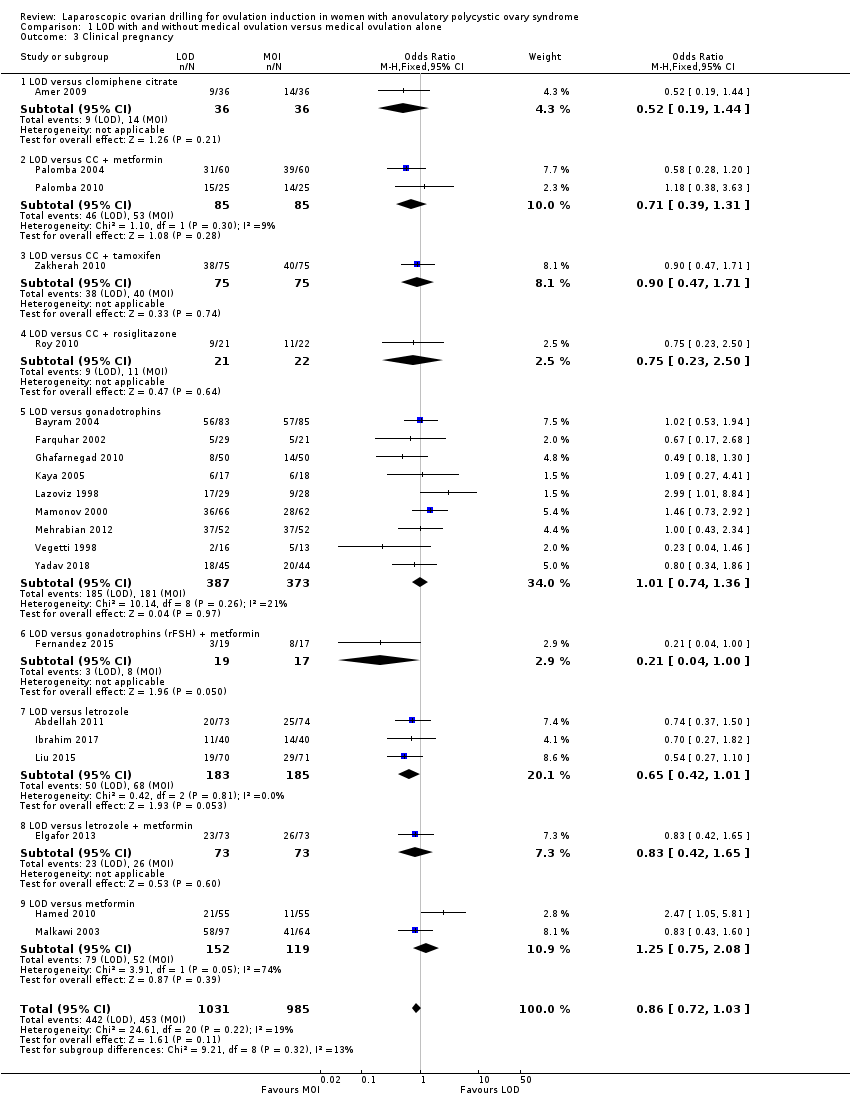
1.3 Clinical pregnancy
Twenty‐one trials including 2016 women reported on the clinical pregnancy rate (Abdellah 2011; Amer 2009; Bayram 2004; Elgafor 2013; Farquhar 2002; Fernandez 2015; Ghafarnegad 2010; Hamed 2010; Ibrahim 2017; Kaya 2005; Lazoviz 1998; Liu 2015; Malkawi 2003; Mamonov 2000; Mehrabian 2012; Palomba 2004; Palomba 2010; Roy 2010; Vegetti 1998; Yadav 2018; Zakherah 2010). The analysis suggests there may be little or no difference between LOD and medical ovulation induction alone, but the quality of the evidence was low (OR 0.86, 95% CI 0.72 to 1.03; 21 studies, 2016 women; I2 = 19%; low‐quality evidence; Analysis 1.3).
Subgroup analysis did not identify any differences between the groups with different ovulation induction therapies.
1.4 Miscarriage
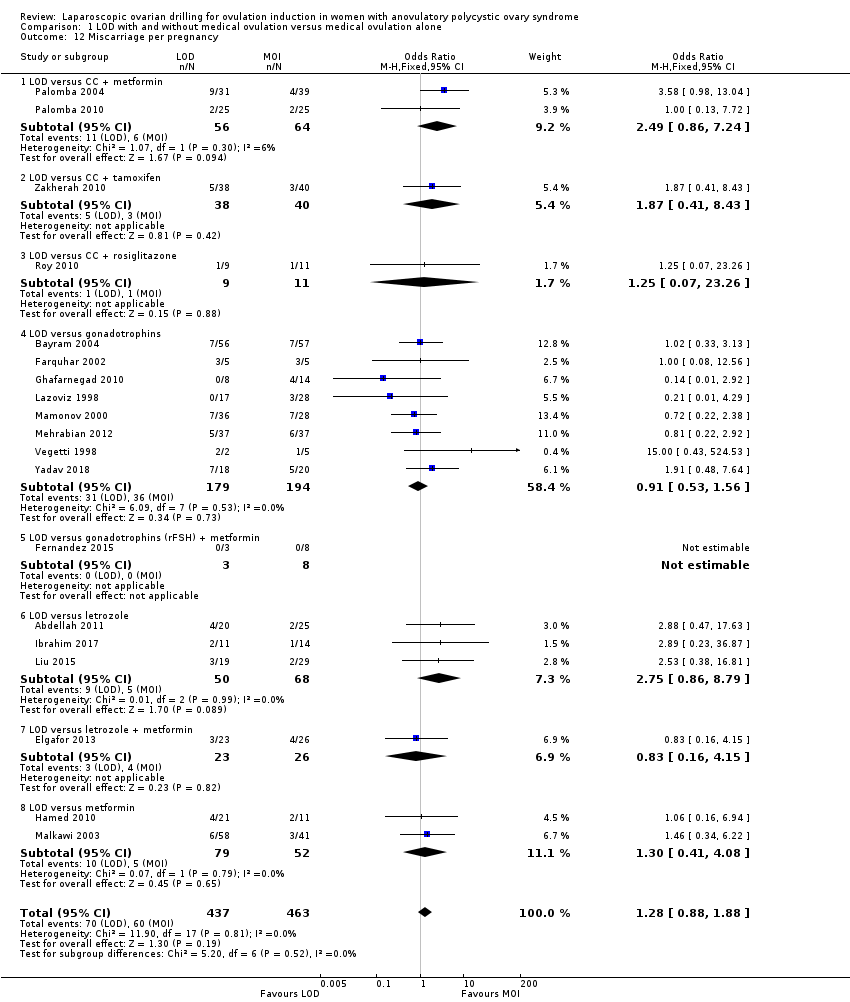
Nineteen trials including 1909 women reported on miscarriage (Abdellah 2011; Bayram 2004; Elgafor 2013; Farquhar 2002; Fernandez 2015; Ghafarnegad 2010; Hamed 2010; Ibrahim 2017; Lazoviz 1998; Liu 2015; Malkawi 2003; Mamonov 2000; Mehrabian 2012; Palomba 2004; Palomba 2010; Roy 2010; Vegetti 1998; Yadav 2018; Zakherah 2010). There is uncertainty about the effect of LOD compared with ovulation induction alone, due to large uncertainty around the estimate and the low quality of the evidence (OR 1.11, 95% CI 0.78 to 1.59; 19 studies, 1909 women; I2 = 0%; low‐quality evidence; Analysis 1.4). Analysis per pregnancy showed similar results (OR 1.28, 95% CI 0.88 to 1.88; 19 studies, 900 women; I2 = 0%; Analysis 1.12).
Subgroup analysis did not identify any differences between the groups with different ovulation induction therapies.
In Farquhar 2002 one pregnancy ended with a termination and was reported in the text as such. Fernandez 2015 reported no events of miscarriage in either group.
1.5 Ovarian hyperstimulation syndrome (OHSS)
Eight trials including 722 women reported on rates of OHSS (Amer 2009; Bayram 2004; Farquhar 2002; Kaya 2005; Malkawi 2003; Mehrabian 2012; Roy 2010; Yadav 2018). The analysis suggests that LOD may reduce OHSS (Peto OR 0.25, 95% CI 0.07 to 0.91; 8 studies, 722 women; I2 = 0%; low‐quality evidence; Analysis 1.5). Caution is advised when interpreting the data, due to the low event rates in both groups. There were two cases of OHSS associated with LOD among the 8 trials (2/380), and eight cases (8/342) for the medical ovulation induction‐alone group. Subgroup analysis did not identify any between‐group differences.
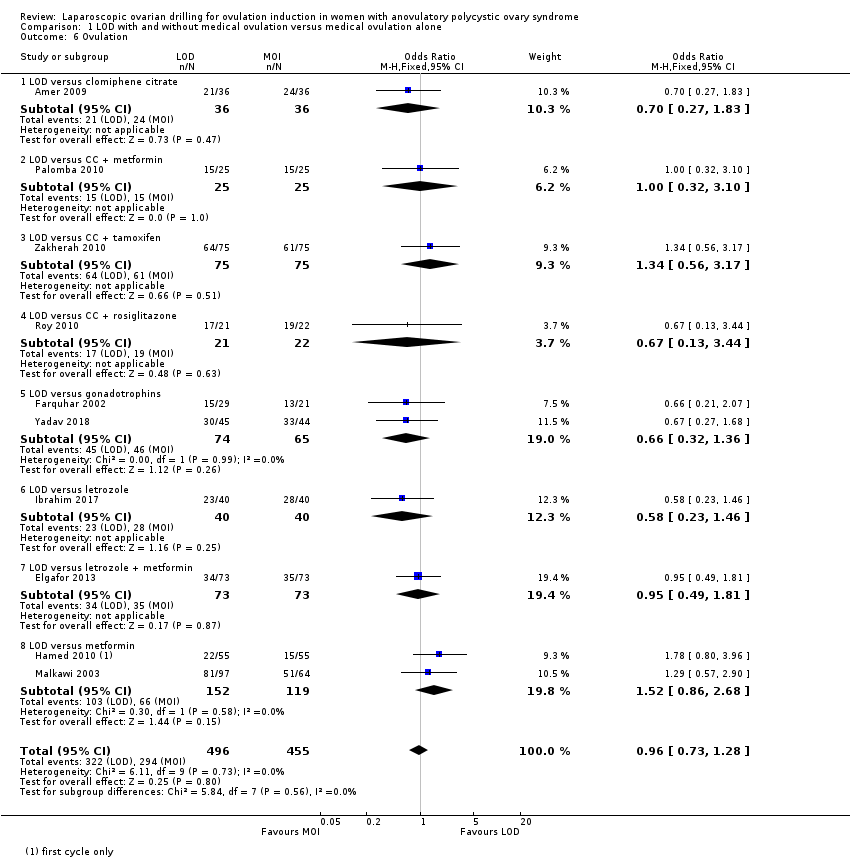
1.6 Ovulation
Ten trials including 951 women reported on ovulation (Amer 2009; Elgafor 2013; Farquhar 2002; Hamed 2010; Ibrahim 2017; Malkawi 2003; Palomba 2010; Roy 2010; Yadav 2018; Zakherah 2010). There is uncertainty about the effect of LOD compared with ovulation induction alone, due to large uncertainty around the estimate, and the low quality of the evidence (OR 0.96, 95% CI 0.73 to 1.28; 10 studies, 951 women; I2 = 0%; low‐quality evidence; Analysis 1.6). Subgroup analysis did not identify any between‐group differences.
For ovulation rate, we included only first‐cycle data in the meta‐analyses of the trial reported in Palomba 2010. Abdellah 2011 and Liu 2015 reported ovulation rates by cycle data and not by woman randomised, and we could not include these data in the meta‐analysis.
1.7 Costs
Both direct and indirect cost data were collected in five papers from four studies (Bayram 2004; Farquhar 2002; Kaya 2005; Palomba 2004). Heterogeneity was high, with I2 = 99%, which is probably due to the currencies used and the different factors taken into account when calculating costs. We have reported only as subgroups. In Bayram 2004 the addition of LOD to the diagnostic laparoscopy added 20 minutes to the procedure, but total costs following LOD were lower due to lower requirement of medical ovulation induction, with a difference of EUR 754 (95% CI 1666.1 to 155.1). In the Discussion section of this paper the cost per term pregnancy was estimated at EUR 14,489 for gonadotrophins and EUR 11,301 for LOD followed by medical induction therapy. The long‐term costs at 10‐year follow‐up were reported in a 2011 economic analysis of Bayram 2004. The costs were significantly lower for the treatment strategy starting with LOD when compared to the gonadotrophin strategy (mean difference EUR 2235; 95% CI 80 to 3790).
The costs associated with Farquhar 2002 were reported in a 2004 publication. The authors reported that the costs of a live birth were one‐third lower in the group that underwent LOD compared to the women who received gonadotrophins (NZD 19,640 and NZD 29,836, respectively). The costs were based on hospital and clinic direct and indirect costs. No estimates of a standard deviation were reported, so we have not included these data in the analysis. Refer to Table 1.
| Study | LOD ± CC | Other treatment | P value |
| EUR 1050 | Metformin ± CC EUR 50 | < 0.05 | |
| Total cost per patient NZD 2953 Chance of pregnancy 28% Cost per pregnancy NZD 10,938 Chance of live birth 14% Cost per live birth NZD 21,095 | Gonadotrophin Total cost per woman NZD 5461 Chance of pregnancy 33% Cost per pregnancy NZD 16,549 Chance of live birth 19% Cost per live birth NZD 28,744 | NS NS |
Kaya 2005 reported that the costs of LOD were almost half that of treatment with gonadotrophins (USD 1081 ± 234 versus USD 2214 ± 356).
Palomba 2004 reported that LOD was significantly more expensive (P < 0.05) than metformin treatment in a six‐month treatment programme (EUR 1050 versus EUR 50 respectively). Refer to Table 1.
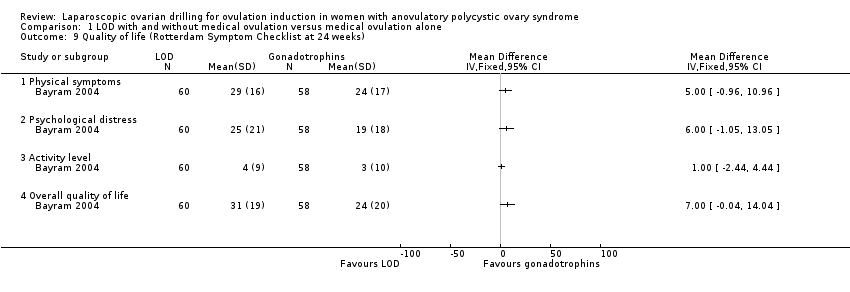
1.8 Quality of life
Only Bayram 2004 reported on health‐related quality of life, using the SF‐36, Rotterdam Symptom Checklist and depression scales (CES‐D). The intention‐to‐treat analysis comparing LOD and rFSH showed no clear evidence of a treatment effect on any of the SF‐36 subscales (Analysis 1.8). The intention‐to‐treat analysis comparing LOD and rFSH showed no clear evidence of treatment or time effects for physical symptoms, psychological measures or overall quality of life on the Rotterdam Symptom Checklist (Analysis 1.9). The intention‐to‐treat analysis comparing LOD and rFSH showed no statistically significant treatment or time effects on the depression scales (CES‐D) (Analysis 1.10).
2. LOD plus IVF versus IVF
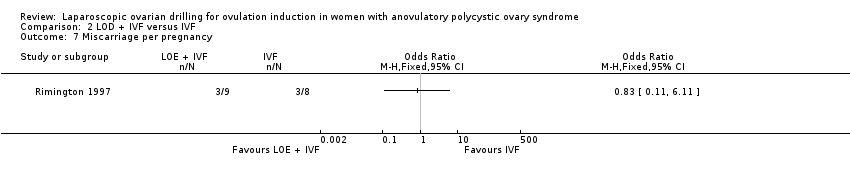
We found one trial including 50 women that compared LOD plus IVF with IVF (Rimington 1997). Due to the small sample size, the quality of evidence is not sufficient to justify a conclusion for any of the outcomes.
2.1 Live birth
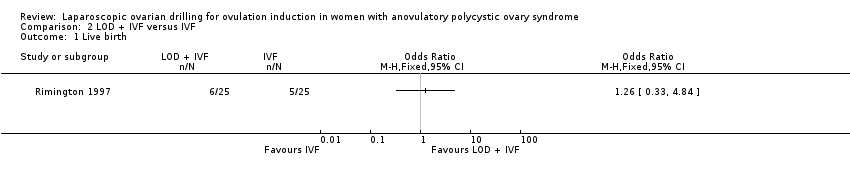
We are uncertain if LOD plus IVF improves live birth rate compared to IVF alone (OR 1.26, 95% CI 0.33 to 4.84; 1 study, 50 women; very low‐quality evidence; Analysis 2.1).
2.2 Multiple pregnancy
We are uncertain if LOD plus IVF reduces multiple pregnancy rate compared to IVF alone (Peto OR 1.0, 95% CI 0.06 to 16.45; 1 study, 50 women; very low‐quality evidence; Analysis 2.2).
2.3 Clinical pregnancy
We are uncertain if LOD plus IVF improves clinical pregnancy rate compared to IVF alone (OR 1.20, 95% CI 0.37 to 3.86; 1 study, 50 women; very low‐quality evidence; Analysis 2.3).
2.4 Miscarriage
We are uncertain if LOD plus IVF reduces miscarriage rate compared to IVF alone miscarriage (OR 1.00, 95% CI 0.18 to 5.51; 1 study, 50 women; very low‐quality evidence; Analysis 2.4).
2.5 OHSS
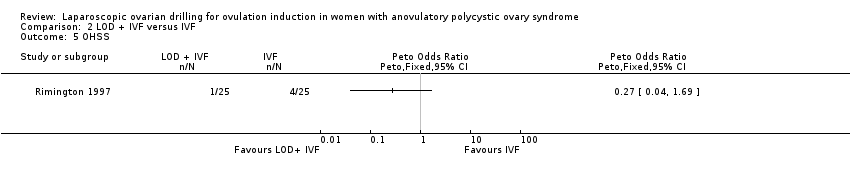
We are uncertain if LOD plus IVF improves OHSS rate compared to IVF alone (Peto OR 0.27, 95% CI 0.04 to 1.69; 1 study, 50 women; very low‐quality evidence; Analysis 2.5).
Ovulation
No data were reported for ovulation.
Costs
No data were reported for costs.
Quality of life
No data were reported for quality of life.
3. LOD with second‐look laparoscopy versus LOD with expectant management
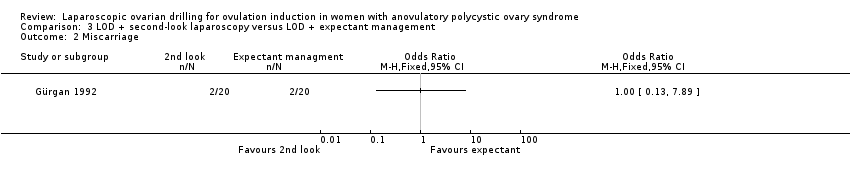
We found one trial including 40 women that compared LOD by laser or diathermy and second‐look laparoscopy adhesiolysis three to four weeks later, compared with expectant management (no second‐look laparoscopy) (Gürgan 1992). Due to the small sample size, the quality of the evidence is not sufficient to justify a conclusion for any of the outcomes.
Live birth
No data were reported for live birth.
Multiple pregnancy
No data were reported for multiple pregnancy.
3.1 Clinical pregnancy
We are uncertain if LOD with second‐look laparoscopy improves clinical pregnancy rate (OR 0.67, 95% CI 0.19 to 2.33; 1 study, 40 women; Analysis 3.1).
3.2 Miscarriage
We are uncertain if LOD with second‐look laparoscopy reduces miscarriage rate (OR 1.00, 95% CI 0.13 to 7.89; 1 study, 40 women; Analysis 3.2).
OHSS
No data were reported for OHSS.
3.3 Ovulation
We are uncertain if LOD with second‐look laparoscopy improves ovulation rate (OR 6.33, 95% CI 0.67 to 60.16; 1 study, 40 women; Analysis 3.3).
Costs
No data were reported for costs.
Quality of life
No data were reported for quality of life.
4. Techniques for LOD: unilateral versus bilateral
4.1 Live birth
Live birth was reported in one trial (Roy 2009). Due to the small sample size, the quality of evidence is not sufficient to justify a conclusion for live birth (OR 0.83, 95% CI 0.24 to 2.78; 1 study, 44 women; very low‐quality evidence; Analysis 4.1).
Multiple pregnancy
No data were reported for multiple pregnancy.
4.2 Clinical pregnancy
Clinical pregnancy rate was reported in seven trials (Al‐Mizyen 2000; Balen 1994; El‐Sayed 2017; Rezk 2016; Roy 2009; Sorouri 2015; Youssef 2007). For the likelihood of a clinical pregnancy there is uncertainty whether there is a difference between unilateral and bilateral LOD, due to the quality of the evidence and the large heterogeneity between the studies (OR 0.57, 95% CI 0.39 to 0.84; 7 studies, 470 women; I2 = 60%, very low‐quality evidence; Analysis 4.2). Rezk 2016 reports data at six months, unlike the other trials reporting this outcome. The removal of this trial from the analysis makes I2 = 0% and also changes the overall treatment effect. In this subgroup there is uncertainty whether there is a difference between the treatments, due to great uncertainty around the estimate (OR 0.79, 95% CI 0.51 to 1.21; 6 studies, 362 women; analysis not shown).
4.3 Miscarriage
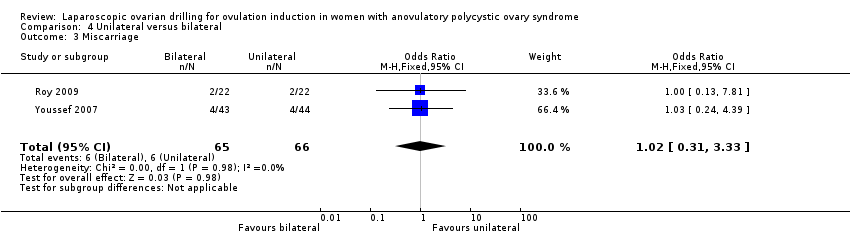
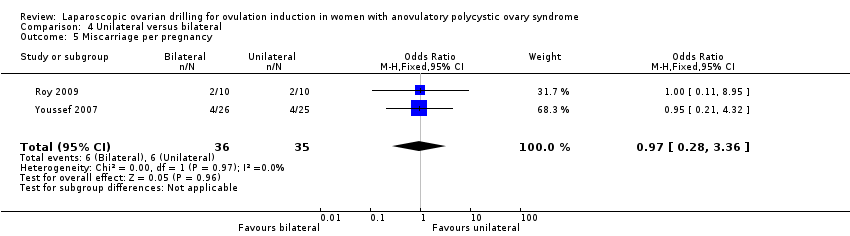
Miscarriage was reported in two trials (Roy 2009; Youssef 2007). Due to the small sample size, the quality of evidence is not sufficient to justify a conclusion for miscarriage (OR 1.02, 95% CI 0.31 to 3.33; 2 studies, 131 women; I2 = 0%; very low‐quality evidence; Analysis 4.3). Analysis per pregnancy showed similar results (OR 0.97, 95% CI 0.28 to 3.36; 2 studies, 71 women; I2 = 0%; Analysis 4.5).
OHSS
No data were reported for OHSS.
4.4 Ovulation
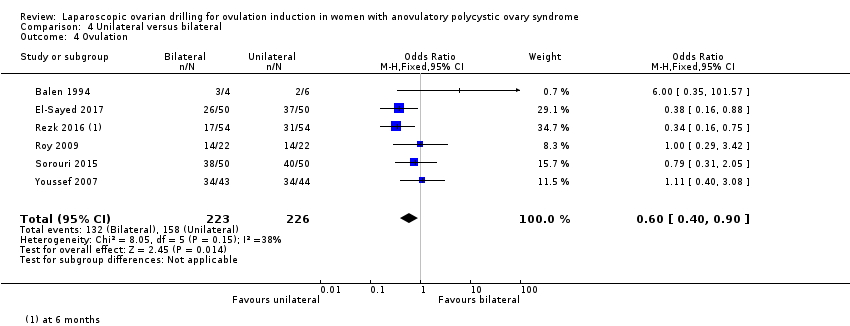
Ovulation rate was reported in six trials (Balen 1994; El‐Sayed 2017; Rezk 2016; Roy 2009; Sorouri 2015; Youssef 2007). Unilateral LOD might decrease the ovulation rate slightly compared with bilateral LOD (OR 0.60, 95% CI 0.40 to 0.90; 6 studies, 449 women; I2 = 38%; very low‐quality evidence; Analysis 4.4).
Costs
No data were reported for costs.
Quality of life
No data were reported for quality of life.
5. Techniques for LOD: monopolar verus bipolar
Due to the small sample size, the quality of evidence is not sufficient to justify a conclusion for any of the outcomes.
Live birth
No data were reported for live birth.
Multiple pregnancy
No data were reported for multiple pregnancy.
5.1 Clinical pregnancy
Clinical pregnancy rate was reported in three trials (Darwish 2016; Giampaolino 2016; Sharma 2006) (OR 0.94, 95% CI 0.62 to 1.44; 3 studies, 3541 women; I2 = 710%; very low‐quality evidence; Analysis 5.1).
Miscarriage
No data were reported for miscarriage.
OHSS
No data were reported for OHSS.
5.2 Ovulation
Ovulation was reported in two trials (Darwish 2016; Sharma 2006) (OR 0.33, 95% CI 0.14 to 0.76; 2 studies, 108 women; I2 = 0%; very low‐quality evidence; Analysis 5.2).
Costs
No data were reported for costs.
Quality of life
No data were reported for quality of life.
6. Techniques for LOD: adjusted thermal dose versus fixed thermal dose
Due to the small sample size, the quality of evidence is not sufficient to justify a conclusion for any of the outcomes.
Live birth
No data were reported for live birth.
Multiple pregnancy
No data were reported for multiple pregnancy.
6.1 Clinical pregnancy
Clinical pregnancy was reported in two trials (Nasr 2015; Zakherah 2011) (OR 1.84, 95% CI 1.04 to 3.26; 2 studies, 195 women; I2 = 0%; very low‐quality evidence; Analysis 6.1).
6.2 Miscarriage
Miscarriage was reported in one trial (Zakherah 2011) (OR 1.33, 95% CI 0.28 to 6.24; 1 study, 115 women; very low‐quality evidence; Analysis 6.2).
OHSS
No data were reported for OHSS.
6.3 Ovulation
Ovulation was reported in two trials (Nasr 2015; Zakherah 2011) (OR 1.83, 95% CI 1.01 to 3.33; 2 studies, 195 women; I2 = 0%; very low‐quality evidence; Analysis 6.3).
Costs
No data were reported for costs.
Quality of life
No data were reported for quality of life.
Discussion
Summary of main results
In women with anovulatory polycystic ovary syndrome (PCOS) and clomiphene citrate (CC) resistance, the main analysis including all studies suggests that LOD with and without medical ovulation induction may decrease live birth compared with medical ovulation induction alone. The evidence suggests that if the chance of live birth following medical ovulation induction alone is 42%, the chance following laparoscopic ovarian drilling (LOD) would be between 28% and 40%; the quality of the evidence was low. The sensitivity analysis restricting to RCTs with low risk of selection bias suggests there might be little or no difference, although there is uncertainty around the estimate.
We found that LOD with and without medical ovulation induction probably reduces the number of multiple pregnancies compared with medical ovulation induction alone. This suggests that if we assume that the risk of multiple pregnancy following medical ovulation induction alone is 5.0%, the risk following LOD would be between 0.9% and 3.4%. The quality of the evidence was moderate, and sensitivity analyses were consistent with the main analysis.
We performed subgroup analysis for the different ovulation‐induction agents, which did not identify any between‐group differences. Virtually all studies had a follow‐up time of at least six months following LOD.
Low‐quality evidence suggests there may be little or no difference in clinical pregnancy between the treatments and that there is uncertainty about the effect of LOD compared with ovulation induction alone for miscarriage. LOD may reduce OHSS , but there was a very low occurrence rate of OHSS. LOD will not by itself induce OHSS, but ovulation induction may induce OHSS (ESHRE 2018).
The quality of the evidence is not sufficient to justify a conclusion from the comparison of unilateral LOD versus bilateral LOD about live birth, clinical pregnancy or miscarriage. There were no data available on multiple pregnancy.
Due to lack of evidence and very low‐quality data there is uncertainty whether there is a difference for any of the following comparisons: LOD with IVF versus IVF alone, LOD with second‐look laparoscopy versus expectant management, monopolar versus bipolar LOD, or adjusted thermal dose versus fixed thermal dose.
Overall completeness and applicability of evidence
Although the number of studies for each drug comparison was limited, the evidence does appear to encompass all available treatments for anovulatory women with PCOS seeking a fertility outcome. As all women included were CC‐resistant, results are probably generalisable for this population, irrespective of the specific diagnostic criteria used. There may have been studies that our searches did not find. We could not find specific data on intra‐operative and post‐operative risks or for long‐term ovarian function. Although there is no superiority of LOD over medical ovulation induction agents, LOD may provide an effective alternative. Specifically, when a laparoscopy is indicated for another reason in women with anovulatory PCOS and there are no other infertility factors, LOD could be considered.
Quality of the evidence
Overall certainty of the evidence was very low to moderate (summary of findings Table for the main comparison; summary of findings Table 2). This was mainly due to inadequate explanations of randomisation, allocation concealment, and lack of detail or no blinding. All comparisons had relatively few included studies. Randomisation was adequately explained in 23 of the 38 included trials and allocation concealment was adequately explained in 12 of the 38 trials. None of the included trials blinded participants. Outcome assessors were blinded in only seven of the trials, with the remaining trials either unclear about blinding or not conducting blinding at all.
The strengths of this systematic review include the extensive search strategy, and the performance of subgroup and sensitivity analyses. One limitation is that more than half of the included trials did not report the effectiveness outcome of live birth. A second limitation is that due to small sample sizes in many of the interventions the quality of the evidence was very low and we therefore could not justify drawing conclusions about the effects of these interventions.
Potential biases in the review process
The authors of this systematic review believe we have conducted a rigorous search of the evidence. The evidence includes published and unpublished data and there were no restrictions by language.
Agreements and disagreements with other studies or reviews
We agree with the current guideline of ESHRE 2018 that LOD is an intervention that can lead to a singleton birth in women with PCOS. There is no convincing evidence of the superiority of medical ovulation‐induction agents over LOD, there is no need for monitoring (because of mono‐ovulation), and only a small risk of multiple pregnancy. However, it is important to note that LOD is an invasive surgical intervention; long‐term ovarian function and intra‐operative and post‐operative risks should be considered.
Our sensitivity analysis shows uncertainty about whether there is a difference in live birth between LOD with and without medical ovulation induction compared with medical ovulation induction alone. Similarly, a recent meta‐analysis comparing letrozole with LOD also suggests there might be no differences in the live birth rate (Yu 2019).
Although surgically‐related complications associated with LOD seem rare, a case of pelvic infection following LOD highlights the need for caution when offering this treatment over gonadotrophin therapy (Deans 1997). There are also the associated risks and morbidity of laparoscopy under general anaesthetic, postoperative adhesion formation (Greenblatt 1993), and the as yet theoretical long‐term risk of premature ovarian failure. However, a 10‐year follow‐up study did not find any indication for adhesion formation, nor for premature ovarian failure (Nahuis 2014).

Study flow diagram.

Risk of bias graph: review authors' judgements about each risk of bias item presented as percentages across all included studies.

Risk of bias summary: review authors' judgements about each risk of bias item for each included study.

Forest plot of comparison: 1 LOD with and without medical ovulation versus medical ovulation alone, outcome: 1.1 Live birth.
MOI: Medical ovulation induction alone
LOD: laparoscopic ovarian drilling with or without medical ovulation induction
Funnel plot of comparison: 1 LOD with and without medical ovulation versus medical ovulation alone, outcome: 1.1 Live birth.
LOD: laparoscopic ovarian drilling with or without medical ovulation induction
Forest plot of comparison: 5 Sensitivity analysis low risk of bias: LOD with and without medical ovulation versus medical ovulation alone, outcome: 5.1 Live birth.
MOI: Medical ovulation induction alone
LOD: laparoscopic ovarian drilling with or without medical ovulation induction

Forest plot of comparison: 1 LOD with and without medical ovulation versus medical ovulation alone, outcome: 1.4 Multiple pregnancy rate (per ongoing pregnancy).
MOI: Medical ovulation induction alone
LOD: laparoscopic ovarian drilling with or without medical ovulation induction
Comparison 1 LOD with and without medical ovulation versus medical ovulation alone, Outcome 1 Live birth.

Comparison 1 LOD with and without medical ovulation versus medical ovulation alone, Outcome 2 Multiple pregnancy.
Comparison 1 LOD with and without medical ovulation versus medical ovulation alone, Outcome 3 Clinical pregnancy.

Comparison 1 LOD with and without medical ovulation versus medical ovulation alone, Outcome 4 Miscarriage.

Comparison 1 LOD with and without medical ovulation versus medical ovulation alone, Outcome 5 OHSS.
Comparison 1 LOD with and without medical ovulation versus medical ovulation alone, Outcome 6 Ovulation.

Comparison 1 LOD with and without medical ovulation versus medical ovulation alone, Outcome 7 Costs.

Comparison 1 LOD with and without medical ovulation versus medical ovulation alone, Outcome 8 Quality of Life (Health related quality of life: SF‐36).
Comparison 1 LOD with and without medical ovulation versus medical ovulation alone, Outcome 9 Quality of life (Rotterdam Symptom Checklist at 24 weeks).
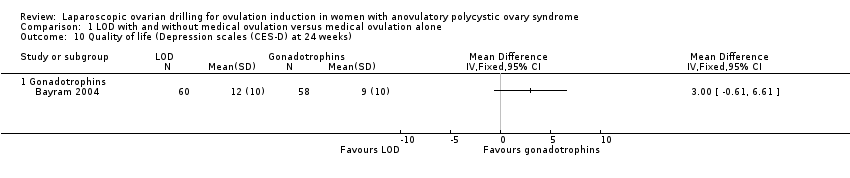
Comparison 1 LOD with and without medical ovulation versus medical ovulation alone, Outcome 10 Quality of life (Depression scales (CES‐D) at 24 weeks).

Comparison 1 LOD with and without medical ovulation versus medical ovulation alone, Outcome 11 Multiple pregnancy per pregnancy.
Comparison 1 LOD with and without medical ovulation versus medical ovulation alone, Outcome 12 Miscarriage per pregnancy.
Comparison 2 LOD + IVF versus IVF, Outcome 1 Live birth.

Comparison 2 LOD + IVF versus IVF, Outcome 2 Multiple pregnancy.

Comparison 2 LOD + IVF versus IVF, Outcome 3 Clinical pregnancy.

Comparison 2 LOD + IVF versus IVF, Outcome 4 Miscarriage.
Comparison 2 LOD + IVF versus IVF, Outcome 5 OHSS.

Comparison 2 LOD + IVF versus IVF, Outcome 6 Multiple pregnancy per pregnancy.
Comparison 2 LOD + IVF versus IVF, Outcome 7 Miscarriage per pregnancy.

Comparison 3 LOD + second‐look laparoscopy versus LOD + expectant management, Outcome 1 Clinical pregnancy.
Comparison 3 LOD + second‐look laparoscopy versus LOD + expectant management, Outcome 2 Miscarriage.

Comparison 3 LOD + second‐look laparoscopy versus LOD + expectant management, Outcome 3 Ovulation.

Comparison 3 LOD + second‐look laparoscopy versus LOD + expectant management, Outcome 4 Miscarriage per pregnancy.

Comparison 4 Unilateral versus bilateral, Outcome 1 Live birth.

Comparison 4 Unilateral versus bilateral, Outcome 2 Clinical pregnancy.
Comparison 4 Unilateral versus bilateral, Outcome 3 Miscarriage.
Comparison 4 Unilateral versus bilateral, Outcome 4 Ovulation.
Comparison 4 Unilateral versus bilateral, Outcome 5 Miscarriage per pregnancy.

Comparison 5 Monopolar versus bipolar, Outcome 1 Clinical pregnancy.

Comparison 5 Monopolar versus bipolar, Outcome 2 Ovulation.

Comparison 6 Adjusted thermal dose versus fixed thermal dose, Outcome 1 Clinical pregnancy.

Comparison 6 Adjusted thermal dose versus fixed thermal dose, Outcome 2 Miscarriage.

Comparison 6 Adjusted thermal dose versus fixed thermal dose, Outcome 3 Ovulation.
Comparison 7 Sensitivity analysis low risk of bias: LOD with and without medical ovulation versus medical ovulation alone, Outcome 1 Live birth.

Comparison 7 Sensitivity analysis low risk of bias: LOD with and without medical ovulation versus medical ovulation alone, Outcome 2 Multiple pregnancy.
| Laparoscopic ovarian drilling with and without medical ovulation compared to medical ovulation induction alone | ||||||
| Patient or population: women with anovulatory PCOS and CC resistance | ||||||
| Outcomes | Anticipated absolute effects* (95% CI) | Relative effect | № of participants | Certainty of the evidence | Comments | |
| Risk with medical ovulation induction alone | Risk with LOD ±medical ovulation | |||||
| Live birth | 418 per 1000 | 338 per 1000 | OR 0.71 | 1015 | ⊕⊕⊝⊝ | |
| Live birth (sensitivity analysis) | 439 per 1000 | 413 per 1000 (316 to 516) | OR 0.90 (0.59 to 1.36) | 415 (4 RCTs) | ⊕⊕⊝⊝ | |
| Multiple pregnancy | 50 per 1000 | 18 per 1000 | Peto OR 0.34 | 1161 | ⊕⊕⊕⊝ | |
| Clincial pregnancy | 460 per 1000 | 423 per 1000 | OR 0.86 | 2016 | ⊕⊕⊝⊝ | |
| Miscarriage | 64 per 1000 | 71 per 1000 | Peto OR 1.11 | 1909 | ⊕⊕⊝⊝ | |
| OHSS | 23 per 1000 | 6 per 1000 | Peto OR 0.25 | 722 | ⊕⊕⊝⊝ | |
| *The risk in the intervention group (and its 95% confidence interval) is based on the assumed risk in the comparison group and the relative effect of the intervention (and its 95% CI). | ||||||
| GRADE Working Group grades of evidence | ||||||
| aDowngraded by two levels for very serious risk of bias; inadequate randomisation or allocation concealment and no evidence of blinding. bDowngraded by one level for serious risk of bias; no evidence of blinding. cDowngraded by one level for serious imprecision. | ||||||
| LOD of one ovary (unilateral) versus LOD of both ovaries (bilateral) | ||||||
| Patient or population: women with anovulatory PCOS and CC resistance | ||||||
| Outcomes | Anticipated absolute effects* (95% CI) | Relative effect | № of participants | Certainty of the evidence | Comments | |
| Risk with Bilateral | Risk with Unilateral | |||||
| Live birth | 409 per 1000 | 365 per 1000 | OR 0.83 | 44 | ⊕⊝⊝⊝ | ‐ |
| Multiple pregnancy | ‐ | ‐ | ‐ | ‐ | ‐ | No data were reported for this outcome. |
| Clinical pregnancy | 464 per 1000 | 331 per 1000 | OR 0.57 | 470 | ⊕⊕⊝⊝ | ‐ |
| Miscarriage | 91 per 1000 | 93 per 1000 | Peto OR 1.02 | 131 | ⊕⊝⊝⊝ | ‐ |
| OHSS | ‐ | ‐ | ‐ | ‐ | ‐ | No data were reported for this outcome. |
| *The risk in the intervention group (and its 95% confidence interval) is based on the assumed risk in the comparison group and the relative effect of the intervention (and its 95% CI). | ||||||
| GRADE Working Group grades of evidence | ||||||
| aDowngraded by two levels for very serious risk of bias; inadequate randomisation or allocation concealment and no evidence of blinding. bDowngraded by one level for serious imprecision. | ||||||
| Study | LOD ± CC | Other treatment | P value |
| EUR 1050 | Metformin ± CC EUR 50 | < 0.05 | |
| Total cost per patient NZD 2953 Chance of pregnancy 28% Cost per pregnancy NZD 10,938 Chance of live birth 14% Cost per live birth NZD 21,095 | Gonadotrophin Total cost per woman NZD 5461 Chance of pregnancy 33% Cost per pregnancy NZD 16,549 Chance of live birth 19% Cost per live birth NZD 28,744 | NS NS |
| Outcome or subgroup title | No. of studies | No. of participants | Statistical method | Effect size |
| 1 Live birth Show forest plot | 9 | 1015 | Odds Ratio (M‐H, Fixed, 95% CI) | 0.71 [0.54, 0.92] |
| 1.1 LOD versus CC + metformin | 2 | 170 | Odds Ratio (M‐H, Fixed, 95% CI) | 0.59 [0.32, 1.09] |
| 1.2 LOD versus CC + tamoxifen | 1 | 150 | Odds Ratio (M‐H, Fixed, 95% CI) | 0.81 [0.42, 1.53] |
| 1.3 LOD versus gonadotrophins | 4 | 407 | Odds Ratio (M‐H, Fixed, 95% CI) | 0.87 [0.56, 1.36] |
| 1.4 LOD versus letrozole | 2 | 288 | Odds Ratio (M‐H, Fixed, 95% CI) | 0.55 [0.32, 0.92] |
| 2 Multiple pregnancy Show forest plot | 14 | 1161 | Peto Odds Ratio (Peto, Fixed, 95% CI) | 0.34 [0.18, 0.66] |
| 2.1 LOD versus clomiphene citrate | 1 | 72 | Peto Odds Ratio (Peto, Fixed, 95% CI) | 0.0 [0.0, 0.0] |
| 2.2 LOD versus CC + metformin | 2 | 170 | Peto Odds Ratio (Peto, Fixed, 95% CI) | 0.0 [0.0, 0.0] |
| 2.3 LOD versus CC + rosiglitazone | 1 | 43 | Peto Odds Ratio (Peto, Fixed, 95% CI) | 2.12 [0.21, 21.52] |
| 2.4 LOD versus gonadotrophins | 7 | 532 | Peto Odds Ratio (Peto, Fixed, 95% CI) | 0.22 [0.10, 0.46] |
| 2.5 LOD versus gonadotrophins (rFSH) + metformin | 1 | 36 | Peto Odds Ratio (Peto, Fixed, 95% CI) | 0.0 [0.0, 0.0] |
| 2.6 LOD versus letrozole | 1 | 147 | Peto Odds Ratio (Peto, Fixed, 95% CI) | 0.0 [0.0, 0.0] |
| 2.7 LOD versus metformin | 1 | 161 | Peto Odds Ratio (Peto, Fixed, 95% CI) | 1.32 [0.25, 6.94] |
| 3 Clinical pregnancy Show forest plot | 21 | 2016 | Odds Ratio (M‐H, Fixed, 95% CI) | 0.86 [0.72, 1.03] |
| 3.1 LOD versus clomiphene citrate | 1 | 72 | Odds Ratio (M‐H, Fixed, 95% CI) | 0.52 [0.19, 1.44] |
| 3.2 LOD versus CC + metformin | 2 | 170 | Odds Ratio (M‐H, Fixed, 95% CI) | 0.71 [0.39, 1.31] |
| 3.3 LOD versus CC + tamoxifen | 1 | 150 | Odds Ratio (M‐H, Fixed, 95% CI) | 0.90 [0.47, 1.71] |
| 3.4 LOD versus CC + rosiglitazone | 1 | 43 | Odds Ratio (M‐H, Fixed, 95% CI) | 0.75 [0.23, 2.50] |
| 3.5 LOD versus gonadotrophins | 9 | 760 | Odds Ratio (M‐H, Fixed, 95% CI) | 1.01 [0.74, 1.36] |
| 3.6 LOD versus gonadotrophins (rFSH) + metformin | 1 | 36 | Odds Ratio (M‐H, Fixed, 95% CI) | 0.21 [0.04, 1.00] |
| 3.7 LOD versus letrozole | 3 | 368 | Odds Ratio (M‐H, Fixed, 95% CI) | 0.65 [0.42, 1.01] |
| 3.8 LOD versus letrozole + metformin | 1 | 146 | Odds Ratio (M‐H, Fixed, 95% CI) | 0.83 [0.42, 1.65] |
| 3.9 LOD versus metformin | 2 | 271 | Odds Ratio (M‐H, Fixed, 95% CI) | 1.25 [0.75, 2.08] |
| 4 Miscarriage Show forest plot | 19 | 1909 | Odds Ratio (M‐H, Fixed, 95% CI) | 1.11 [0.78, 1.59] |
| 4.1 LOD versus CC + metformin | 2 | 170 | Odds Ratio (M‐H, Fixed, 95% CI) | 1.95 [0.69, 5.54] |
| 4.2 LOD versus CC + tamoxifen | 1 | 150 | Odds Ratio (M‐H, Fixed, 95% CI) | 1.71 [0.39, 7.45] |
| 4.3 LOD versus CC + rosiglitazone | 1 | 43 | Odds Ratio (M‐H, Fixed, 95% CI) | 1.05 [0.06, 17.95] |
| 4.4 LOD versus gonadotrophins | 8 | 725 | Odds Ratio (M‐H, Fixed, 95% CI) | 0.80 [0.49, 1.33] |
| 4.5 LOD versus gonadotrophins (rFSH) + metformin | 1 | 36 | Odds Ratio (M‐H, Fixed, 95% CI) | 0.0 [0.0, 0.0] |
| 4.6 LOD versus letrozole | 3 | 368 | Odds Ratio (M‐H, Fixed, 95% CI) | 1.86 [0.61, 5.67] |
| 4.7 LOD versus letrozole + metformin | 1 | 146 | Odds Ratio (M‐H, Fixed, 95% CI) | 0.74 [0.16, 3.43] |
| 4.8 LOD versus metformin | 2 | 271 | Odds Ratio (M‐H, Fixed, 95% CI) | 1.60 [0.53, 4.82] |
| 5 OHSS Show forest plot | 8 | 722 | Peto Odds Ratio (Peto, Fixed, 95% CI) | 0.25 [0.07, 0.91] |
| 5.1 LOD versus clomiphene citrate | 1 | 72 | Peto Odds Ratio (Peto, Fixed, 95% CI) | 0.14 [0.00, 6.82] |
| 5.2 LOD versus CC + metformin | 0 | 0 | Peto Odds Ratio (Peto, Fixed, 95% CI) | 0.0 [0.0, 0.0] |
| 5.3 LOD versus CC + rosiglitazone | 1 | 43 | Peto Odds Ratio (Peto, Fixed, 95% CI) | 0.0 [0.0, 0.0] |
| 5.4 LOD versus gonadotrophins | 5 | 446 | Peto Odds Ratio (Peto, Fixed, 95% CI) | 0.12 [0.02, 0.64] |
| 5.5 LOD versus letrozole | 0 | 0 | Peto Odds Ratio (Peto, Fixed, 95% CI) | 0.0 [0.0, 0.0] |
| 5.6 LOD versus metformin | 1 | 161 | Peto Odds Ratio (Peto, Fixed, 95% CI) | 1.31 [0.13, 13.44] |
| 6 Ovulation Show forest plot | 10 | 951 | Odds Ratio (M‐H, Fixed, 95% CI) | 0.96 [0.73, 1.28] |
| 6.1 LOD versus clomiphene citrate | 1 | 72 | Odds Ratio (M‐H, Fixed, 95% CI) | 0.7 [0.27, 1.83] |
| 6.2 LOD versus CC + metformin | 1 | 50 | Odds Ratio (M‐H, Fixed, 95% CI) | 1.0 [0.32, 3.10] |
| 6.3 LOD versus CC + tamoxifen | 1 | 150 | Odds Ratio (M‐H, Fixed, 95% CI) | 1.34 [0.56, 3.17] |
| 6.4 LOD versus CC + rosiglitazone | 1 | 43 | Odds Ratio (M‐H, Fixed, 95% CI) | 0.67 [0.13, 3.44] |
| 6.5 LOD versus gonadotrophins | 2 | 139 | Odds Ratio (M‐H, Fixed, 95% CI) | 0.66 [0.32, 1.36] |
| 6.6 LOD versus letrozole | 1 | 80 | Odds Ratio (M‐H, Fixed, 95% CI) | 0.58 [0.23, 1.46] |
| 6.7 LOD versus letrozole + metformin | 1 | 146 | Odds Ratio (M‐H, Fixed, 95% CI) | 0.95 [0.49, 1.81] |
| 6.8 LOD versus metformin | 2 | 271 | Odds Ratio (M‐H, Fixed, 95% CI) | 1.52 [0.86, 2.68] |
| 7 Costs Show forest plot | 3 | Mean Difference (IV, Fixed, 95% CI) | Subtotals only | |
| 7.1 LOD versus CC + metformin | 1 | 50 | Mean Difference (IV, Fixed, 95% CI) | 3711.3 [3585.17, 3837.43] |
| 7.2 LOD versus gonadotrophins only (short‐term) | 2 | 203 | Mean Difference (IV, Fixed, 95% CI) | ‐1115.75 [‐1309.72, ‐921.77] |
| 7.3 LOD versus gonadotrophins only (long‐term) | 1 | 168 | Mean Difference (IV, Fixed, 95% CI) | ‐2235.0 [‐4433.16, ‐36.84] |
| 8 Quality of Life (Health related quality of life: SF‐36) Show forest plot | 1 | Mean Difference (IV, Fixed, 95% CI) | Totals not selected | |
| 8.1 Physical functioning at 24 weeks | 1 | Mean Difference (IV, Fixed, 95% CI) | 0.0 [0.0, 0.0] | |
| 8.2 Social functioning at 24 weeks | 1 | Mean Difference (IV, Fixed, 95% CI) | 0.0 [0.0, 0.0] | |
| 8.3 Role limitations (physical) at 24 weeks | 1 | Mean Difference (IV, Fixed, 95% CI) | 0.0 [0.0, 0.0] | |
| 8.4 Role limitations (emotional) at 24 weeks | 1 | Mean Difference (IV, Fixed, 95% CI) | 0.0 [0.0, 0.0] | |
| 8.5 Mental health at 24 weeks | 1 | Mean Difference (IV, Fixed, 95% CI) | 0.0 [0.0, 0.0] | |
| 8.6 Vitality at 24 weeks | 1 | Mean Difference (IV, Fixed, 95% CI) | 0.0 [0.0, 0.0] | |
| 8.7 Pain at 24 weeks | 1 | Mean Difference (IV, Fixed, 95% CI) | 0.0 [0.0, 0.0] | |
| 8.8 General health at 24 weeks | 1 | Mean Difference (IV, Fixed, 95% CI) | 0.0 [0.0, 0.0] | |
| 9 Quality of life (Rotterdam Symptom Checklist at 24 weeks) Show forest plot | 1 | Mean Difference (IV, Fixed, 95% CI) | Totals not selected | |
| 9.1 Physical symptoms | 1 | Mean Difference (IV, Fixed, 95% CI) | 0.0 [0.0, 0.0] | |
| 9.2 Psychological distress | 1 | Mean Difference (IV, Fixed, 95% CI) | 0.0 [0.0, 0.0] | |
| 9.3 Activity level | 1 | Mean Difference (IV, Fixed, 95% CI) | 0.0 [0.0, 0.0] | |
| 9.4 Overall quality of life | 1 | Mean Difference (IV, Fixed, 95% CI) | 0.0 [0.0, 0.0] | |
| 10 Quality of life (Depression scales (CES‐D) at 24 weeks) Show forest plot | 1 | Mean Difference (IV, Fixed, 95% CI) | Totals not selected | |
| 10.1 Gonadotrophins | 1 | Mean Difference (IV, Fixed, 95% CI) | 0.0 [0.0, 0.0] | |
| 11 Multiple pregnancy per pregnancy Show forest plot | 14 | 577 | Peto Odds Ratio (Peto, Fixed, 95% CI) | 0.34 [0.17, 0.66] |
| 11.1 LOD versus clomiphene citrate | 1 | 23 | Peto Odds Ratio (Peto, Fixed, 95% CI) | 0.0 [0.0, 0.0] |
| 11.2 LOD versus CC + metformin | 2 | 99 | Peto Odds Ratio (Peto, Fixed, 95% CI) | 0.0 [0.0, 0.0] |
| 11.3 LOD versus CC + rosiglitazone | 1 | 20 | Peto Odds Ratio (Peto, Fixed, 95% CI) | 2.66 [0.24, 29.46] |
| 11.4 LOD versus gonadotrophins | 7 | 280 | Peto Odds Ratio (Peto, Fixed, 95% CI) | 0.20 [0.09, 0.43] |
| 11.5 LOD versus gonadotrophins (rFSH) + metformin | 1 | 11 | Peto Odds Ratio (Peto, Fixed, 95% CI) | 0.0 [0.0, 0.0] |
| 11.6 LOD versus letrozole | 1 | 45 | Peto Odds Ratio (Peto, Fixed, 95% CI) | 0.0 [0.0, 0.0] |
| 11.7 LOD versus metformin | 1 | 99 | Peto Odds Ratio (Peto, Fixed, 95% CI) | 1.42 [0.27, 7.53] |
| 12 Miscarriage per pregnancy Show forest plot | 19 | 900 | Odds Ratio (M‐H, Fixed, 95% CI) | 1.28 [0.88, 1.88] |
| 12.1 LOD versus CC + metformin | 2 | 120 | Odds Ratio (M‐H, Fixed, 95% CI) | 2.49 [0.86, 7.24] |
| 12.2 LOD versus CC + tamoxifen | 1 | 78 | Odds Ratio (M‐H, Fixed, 95% CI) | 1.87 [0.41, 8.43] |
| 12.3 LOD versus CC + rosiglitazone | 1 | 20 | Odds Ratio (M‐H, Fixed, 95% CI) | 1.25 [0.07, 23.26] |
| 12.4 LOD versus gonadotrophins | 8 | 373 | Odds Ratio (M‐H, Fixed, 95% CI) | 0.91 [0.53, 1.56] |
| 12.5 LOD versus gonadotrophins (rFSH) + metformin | 1 | 11 | Odds Ratio (M‐H, Fixed, 95% CI) | 0.0 [0.0, 0.0] |
| 12.6 LOD versus letrozole | 3 | 118 | Odds Ratio (M‐H, Fixed, 95% CI) | 2.75 [0.86, 8.79] |
| 12.7 LOD versus letrozole + metformin | 1 | 49 | Odds Ratio (M‐H, Fixed, 95% CI) | 0.83 [0.16, 4.15] |
| 12.8 LOD versus metformin | 2 | 131 | Odds Ratio (M‐H, Fixed, 95% CI) | 1.30 [0.41, 4.08] |
| Outcome or subgroup title | No. of studies | No. of participants | Statistical method | Effect size |
| 1 Live birth Show forest plot | 1 | Odds Ratio (M‐H, Fixed, 95% CI) | Totals not selected | |
| 2 Multiple pregnancy Show forest plot | 1 | Peto Odds Ratio (Peto, Fixed, 95% CI) | Totals not selected | |
| 3 Clinical pregnancy Show forest plot | 1 | Odds Ratio (M‐H, Fixed, 95% CI) | Totals not selected | |
| 4 Miscarriage Show forest plot | 1 | Odds Ratio (M‐H, Fixed, 95% CI) | Totals not selected | |
| 5 OHSS Show forest plot | 1 | Peto Odds Ratio (Peto, Fixed, 95% CI) | Totals not selected | |
| 6 Multiple pregnancy per pregnancy Show forest plot | 1 | Peto Odds Ratio (Peto, Fixed, 95% CI) | Totals not selected | |
| 7 Miscarriage per pregnancy Show forest plot | 1 | Odds Ratio (M‐H, Fixed, 95% CI) | Totals not selected | |
| Outcome or subgroup title | No. of studies | No. of participants | Statistical method | Effect size |
| 1 Clinical pregnancy Show forest plot | 1 | Odds Ratio (M‐H, Fixed, 95% CI) | Totals not selected | |
| 2 Miscarriage Show forest plot | 1 | Odds Ratio (M‐H, Fixed, 95% CI) | Totals not selected | |
| 3 Ovulation Show forest plot | 1 | Odds Ratio (M‐H, Fixed, 95% CI) | Totals not selected | |
| 4 Miscarriage per pregnancy Show forest plot | 1 | Odds Ratio (M‐H, Fixed, 95% CI) | Totals not selected | |
| Outcome or subgroup title | No. of studies | No. of participants | Statistical method | Effect size |
| 1 Live birth Show forest plot | 1 | Odds Ratio (M‐H, Fixed, 95% CI) | Totals not selected | |
| 2 Clinical pregnancy Show forest plot | 7 | 470 | Odds Ratio (M‐H, Fixed, 95% CI) | 0.57 [0.39, 0.84] |
| 3 Miscarriage Show forest plot | 2 | 131 | Odds Ratio (M‐H, Fixed, 95% CI) | 1.02 [0.31, 3.33] |
| 4 Ovulation Show forest plot | 6 | 449 | Odds Ratio (M‐H, Fixed, 95% CI) | 0.60 [0.40, 0.90] |
| 5 Miscarriage per pregnancy Show forest plot | 2 | 71 | Odds Ratio (M‐H, Fixed, 95% CI) | 0.97 [0.28, 3.36] |
| Outcome or subgroup title | No. of studies | No. of participants | Statistical method | Effect size |
| 1 Clinical pregnancy Show forest plot | 3 | 354 | Odds Ratio (M‐H, Fixed, 95% CI) | 0.94 [0.62, 1.44] |
| 2 Ovulation Show forest plot | 2 | 108 | Odds Ratio (M‐H, Fixed, 95% CI) | 0.33 [0.14, 0.76] |
| Outcome or subgroup title | No. of studies | No. of participants | Statistical method | Effect size |
| 1 Clinical pregnancy Show forest plot | 2 | 195 | Odds Ratio (M‐H, Fixed, 95% CI) | 1.84 [1.04, 3.26] |
| 2 Miscarriage Show forest plot | 1 | Odds Ratio (M‐H, Fixed, 95% CI) | Totals not selected | |
| 3 Ovulation Show forest plot | 2 | 195 | Odds Ratio (M‐H, Fixed, 95% CI) | 1.83 [1.01, 3.33] |
| Outcome or subgroup title | No. of studies | No. of participants | Statistical method | Effect size |
| 1 Live birth Show forest plot | 4 | 415 | Odds Ratio (M‐H, Fixed, 95% CI) | 0.90 [0.59, 1.36] |
| 1.1 LOD versus gonadotrophins | 2 | 218 | Odds Ratio (M‐H, Fixed, 95% CI) | 1.04 [0.59, 1.85] |
| 1.2 LOD versus CC + metformin | 1 | 50 | Odds Ratio (M‐H, Fixed, 95% CI) | 1.17 [0.39, 3.56] |
| 1.3 LOD versus letrozole | 1 | 147 | Odds Ratio (M‐H, Fixed, 95% CI) | 0.62 [0.30, 1.31] |
| 2 Multiple pregnancy Show forest plot | 6 | 522 | Peto Odds Ratio (Peto, Fixed, 95% CI) | 0.18 [0.06, 0.57] |
| 2.1 LOD versus CC + metformin | 1 | 50 | Peto Odds Ratio (Peto, Fixed, 95% CI) | 0.0 [0.0, 0.0] |
| 2.2 LOD versus gonadotrophins | 3 | 253 | Peto Odds Ratio (Peto, Fixed, 95% CI) | 0.18 [0.06, 0.57] |
| 2.3 LOD versus letrozole | 1 | 147 | Peto Odds Ratio (Peto, Fixed, 95% CI) | 0.0 [0.0, 0.0] |
| 2.4 LOD versus clomiphene citrate | 1 | 72 | Peto Odds Ratio (Peto, Fixed, 95% CI) | 0.0 [0.0, 0.0] |