Perforación ovárica laparoscópica para la inducción de la ovulación en mujeres con síndrome del ovario poliquístico anovulatorio
Information
- DOI:
- https://doi.org/10.1002/14651858.CD001122.pub5Copy DOI

- Database:
-
- Cochrane Database of Systematic Reviews
- Version published:
-
- 11 February 2020see what's new
- Type:
-
- Intervention
- Stage:
-
- Review
- Cochrane Editorial Group:
-
Cochrane Gynaecology and Fertility Group
- Copyright:
-
- Copyright © 2020 The Cochrane Collaboration. Published by John Wiley & Sons, Ltd.
Article metrics
Altmetric:
Cited by:
Authors
Contributions of authors
In this update Esmée Bordewijk, Lidija Rakic, Julie Brown, and Tineke Crawford selected trials for inclusion, extracted and entered data.
Bonnie Ng contributed to data extraction.
Disagreements were resolved by discussion with a third review author (Madelon van Wely).
Esmée Bordewijk conducted the analyses and prepared the initial draft.
All the other authors commented on drafts and approved the final version.
Sources of support
Internal sources
-
University of Auckland, New Zealand.
-
Yorkshire Regional Health Authority, UK.
External sources
-
No sources of support supplied
Declarations of interest
Esmée Bordewijk: none known
Ka Ying Bonnie Ng: none known
Lidija Rakic: none known
Ben Willem Mol reports grants from NHMRC, personal fees from ObsEva, personal fees from Merck Merck KGaA, personal fees from Guerbet, personal fees from iGenomix, outside the submitted work.
Julie Brown: none known
Tineke Crawford: none known
Madelon van Wely: none known
Acknowledgements
The review authors would like to acknowledge the contribution of M Arnot to the original review.
The review authors also wish to acknowledge the contribution of Richard Lilford, Patrick Vandekerckhove, Jane Marjoribanks, and Cindy Farquhar as authors in previous versions of the review.
The review authors would like to acknowledge the contribution of Elena Kostova (Managing Editor of the CGFG) to the updated version. We would like to thank Roger Hart, Katie Stocking, and Edgardo Somigliana for the valuable peer review comments.
Version history
| Published | Title | Stage | Authors | Version |
| 2020 Feb 11 | Laparoscopic ovarian drilling for ovulation induction in women with anovulatory polycystic ovary syndrome | Review | Esmée M Bordewijk, Ka Ying Bonnie Ng, Lidija Rakic, Ben Willem J Mol, Julie Brown, Tineke J Crawford, Madelon van Wely | |
| 2012 Jun 13 | Laparoscopic drilling by diathermy or laser for ovulation induction in anovulatory polycystic ovary syndrome | Review | Cindy Farquhar, Julie Brown, Jane Marjoribanks | |
| 2007 Jul 18 | Laparoscopic drilling by diathermy or laser for ovulation induction in anovulatory polycystic ovary syndrome | Review | Cindy Farquhar, Richard Lilford, Jane Marjoribanks, Patrick Vanderkerchove | |
| 2005 Jul 20 | Laparoscopic "drilling" by diathermy or laser for ovulation induction in anovulatory polycystic ovary syndrome | Review | Cindy M Farquhar, Richard Lilford, Jane Marjoribanks, Patrick Vandekerckhove | |
| 2001 Oct 23 | Laparoscopic "drilling" by diathermy or laser for ovulation induction in anovulatory polycystic ovary syndrome | Review | Cindy M Farquhar, Patrick Vandekerckhove, Richard Lilford | |
Differences between protocol and review
In the original review the only comparison was with gonadotrophins alone.
In the 2012 update the comparison was expanded to include other medical treatments. It also included women undergoing ART.
In the current (2020) update we changed the title from Laparoscopic 'drilling' by diathermy or laser for ovulation induction in anovulatory polycystic ovary syndrome to Laparoscopic ovarian drilling for ovulation induction in women with anovulatory polycystic ovary syndrome. For dichotomous data, we calculated Peto odds ratios for rare events.
Keywords
MeSH
Medical Subject Headings (MeSH) Keywords
Medical Subject Headings Check Words
Female; Humans; Pregnancy;
PICOs


Risk of bias graph: review authors' judgements about each risk of bias item presented as percentages across all included studies.
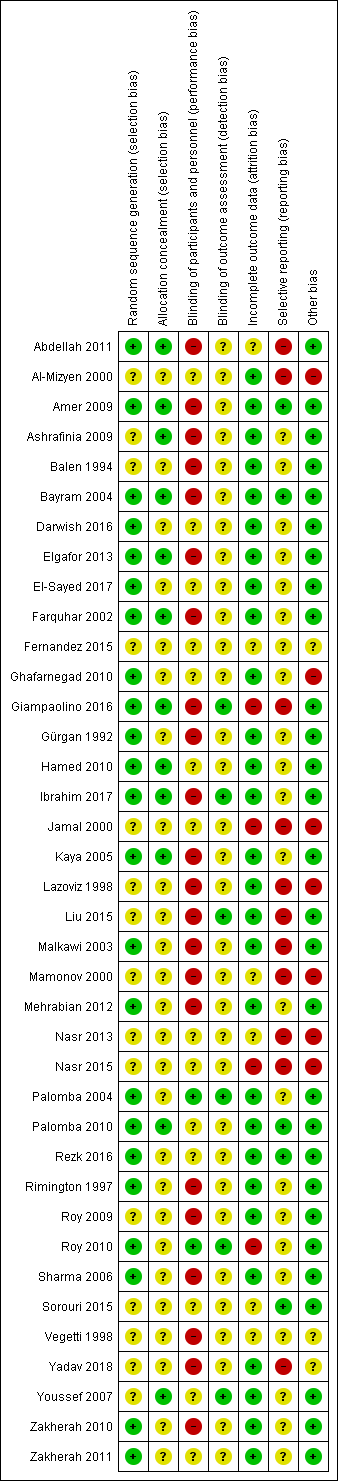
Risk of bias summary: review authors' judgements about each risk of bias item for each included study.

Forest plot of comparison: 1 LOD with and without medical ovulation versus medical ovulation alone, outcome: 1.1 Live birth.
MOI: Medical ovulation induction alone
LOD: laparoscopic ovarian drilling with or without medical ovulation induction
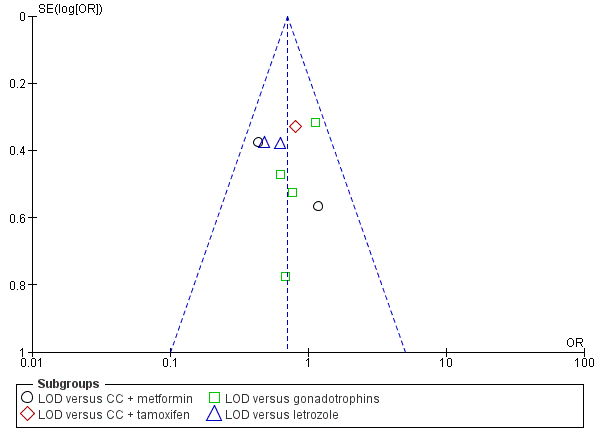
Funnel plot of comparison: 1 LOD with and without medical ovulation versus medical ovulation alone, outcome: 1.1 Live birth.
LOD: laparoscopic ovarian drilling with or without medical ovulation induction

Forest plot of comparison: 5 Sensitivity analysis low risk of bias: LOD with and without medical ovulation versus medical ovulation alone, outcome: 5.1 Live birth.
MOI: Medical ovulation induction alone
LOD: laparoscopic ovarian drilling with or without medical ovulation induction
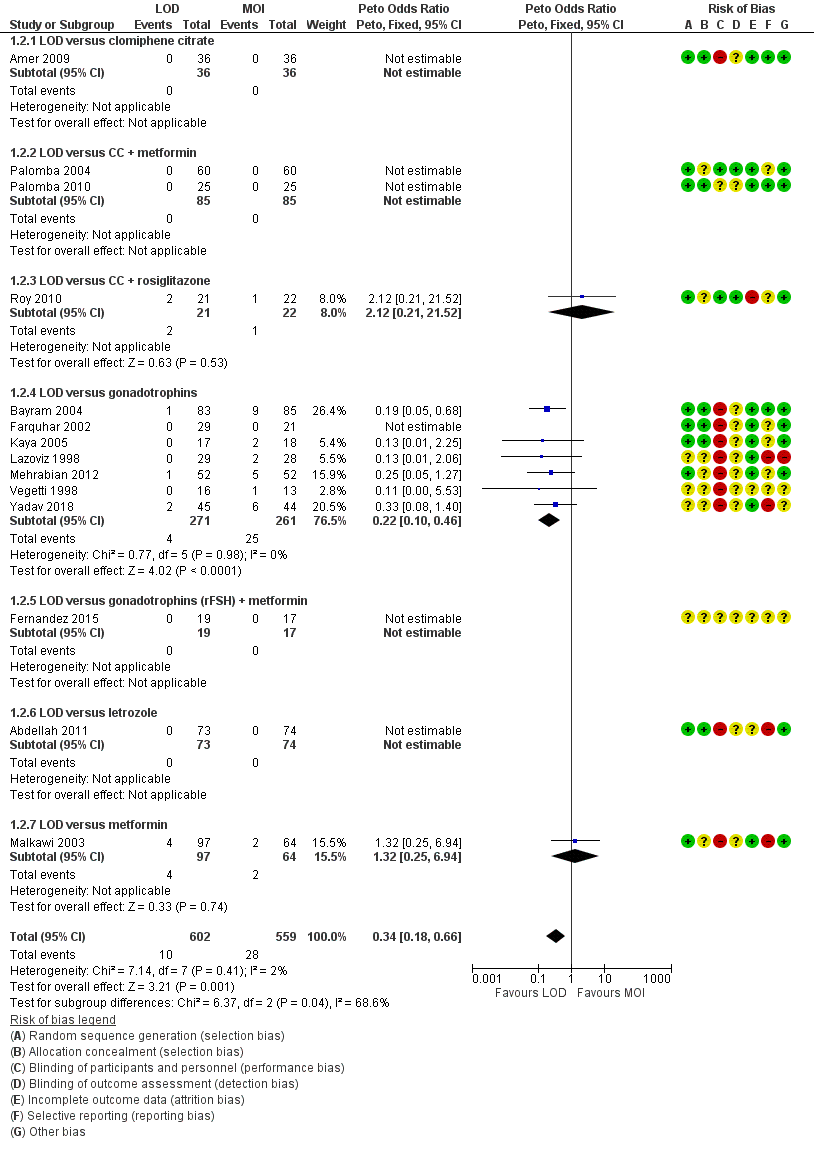
Forest plot of comparison: 1 LOD with and without medical ovulation versus medical ovulation alone, outcome: 1.4 Multiple pregnancy rate (per ongoing pregnancy).
MOI: Medical ovulation induction alone
LOD: laparoscopic ovarian drilling with or without medical ovulation induction

Comparison 1 LOD with and without medical ovulation versus medical ovulation alone, Outcome 1 Live birth.

Comparison 1 LOD with and without medical ovulation versus medical ovulation alone, Outcome 2 Multiple pregnancy.

Comparison 1 LOD with and without medical ovulation versus medical ovulation alone, Outcome 3 Clinical pregnancy.

Comparison 1 LOD with and without medical ovulation versus medical ovulation alone, Outcome 4 Miscarriage.

Comparison 1 LOD with and without medical ovulation versus medical ovulation alone, Outcome 5 OHSS.

Comparison 1 LOD with and without medical ovulation versus medical ovulation alone, Outcome 6 Ovulation.

Comparison 1 LOD with and without medical ovulation versus medical ovulation alone, Outcome 7 Costs.

Comparison 1 LOD with and without medical ovulation versus medical ovulation alone, Outcome 8 Quality of Life (Health related quality of life: SF‐36).

Comparison 1 LOD with and without medical ovulation versus medical ovulation alone, Outcome 9 Quality of life (Rotterdam Symptom Checklist at 24 weeks).

Comparison 1 LOD with and without medical ovulation versus medical ovulation alone, Outcome 10 Quality of life (Depression scales (CES‐D) at 24 weeks).

Comparison 1 LOD with and without medical ovulation versus medical ovulation alone, Outcome 11 Multiple pregnancy per pregnancy.

Comparison 1 LOD with and without medical ovulation versus medical ovulation alone, Outcome 12 Miscarriage per pregnancy.

Comparison 2 LOD + IVF versus IVF, Outcome 1 Live birth.

Comparison 2 LOD + IVF versus IVF, Outcome 2 Multiple pregnancy.

Comparison 2 LOD + IVF versus IVF, Outcome 3 Clinical pregnancy.

Comparison 2 LOD + IVF versus IVF, Outcome 4 Miscarriage.

Comparison 2 LOD + IVF versus IVF, Outcome 5 OHSS.

Comparison 2 LOD + IVF versus IVF, Outcome 6 Multiple pregnancy per pregnancy.

Comparison 2 LOD + IVF versus IVF, Outcome 7 Miscarriage per pregnancy.

Comparison 3 LOD + second‐look laparoscopy versus LOD + expectant management, Outcome 1 Clinical pregnancy.

Comparison 3 LOD + second‐look laparoscopy versus LOD + expectant management, Outcome 2 Miscarriage.

Comparison 3 LOD + second‐look laparoscopy versus LOD + expectant management, Outcome 3 Ovulation.

Comparison 3 LOD + second‐look laparoscopy versus LOD + expectant management, Outcome 4 Miscarriage per pregnancy.

Comparison 4 Unilateral versus bilateral, Outcome 1 Live birth.

Comparison 4 Unilateral versus bilateral, Outcome 2 Clinical pregnancy.

Comparison 4 Unilateral versus bilateral, Outcome 3 Miscarriage.

Comparison 4 Unilateral versus bilateral, Outcome 4 Ovulation.

Comparison 4 Unilateral versus bilateral, Outcome 5 Miscarriage per pregnancy.

Comparison 5 Monopolar versus bipolar, Outcome 1 Clinical pregnancy.

Comparison 5 Monopolar versus bipolar, Outcome 2 Ovulation.

Comparison 6 Adjusted thermal dose versus fixed thermal dose, Outcome 1 Clinical pregnancy.

Comparison 6 Adjusted thermal dose versus fixed thermal dose, Outcome 2 Miscarriage.

Comparison 6 Adjusted thermal dose versus fixed thermal dose, Outcome 3 Ovulation.

Comparison 7 Sensitivity analysis low risk of bias: LOD with and without medical ovulation versus medical ovulation alone, Outcome 1 Live birth.

Comparison 7 Sensitivity analysis low risk of bias: LOD with and without medical ovulation versus medical ovulation alone, Outcome 2 Multiple pregnancy.
| Laparoscopic ovarian drilling with and without medical ovulation compared to medical ovulation induction alone | ||||||
| Patient or population: women with anovulatory PCOS and CC resistance | ||||||
| Outcomes | Anticipated absolute effects* (95% CI) | Relative effect | № of participants | Certainty of the evidence | Comments | |
| Risk with medical ovulation induction alone | Risk with LOD ±medical ovulation | |||||
| Live birth | 418 per 1000 | 338 per 1000 | OR 0.71 | 1015 | ⊕⊕⊝⊝ | |
| Live birth (sensitivity analysis) | 439 per 1000 | 413 per 1000 (316 to 516) | OR 0.90 (0.59 to 1.36) | 415 (4 RCTs) | ⊕⊕⊝⊝ | |
| Multiple pregnancy | 50 per 1000 | 18 per 1000 | Peto OR 0.34 | 1161 | ⊕⊕⊕⊝ | |
| Clincial pregnancy | 460 per 1000 | 423 per 1000 | OR 0.86 | 2016 | ⊕⊕⊝⊝ | |
| Miscarriage | 64 per 1000 | 71 per 1000 | Peto OR 1.11 | 1909 | ⊕⊕⊝⊝ | |
| OHSS | 23 per 1000 | 6 per 1000 | Peto OR 0.25 | 722 | ⊕⊕⊝⊝ | |
| *The risk in the intervention group (and its 95% confidence interval) is based on the assumed risk in the comparison group and the relative effect of the intervention (and its 95% CI). | ||||||
| GRADE Working Group grades of evidence | ||||||
| aDowngraded by two levels for very serious risk of bias; inadequate randomisation or allocation concealment and no evidence of blinding. bDowngraded by one level for serious risk of bias; no evidence of blinding. cDowngraded by one level for serious imprecision. | ||||||
| LOD of one ovary (unilateral) versus LOD of both ovaries (bilateral) | ||||||
| Patient or population: women with anovulatory PCOS and CC resistance | ||||||
| Outcomes | Anticipated absolute effects* (95% CI) | Relative effect | № of participants | Certainty of the evidence | Comments | |
| Risk with Bilateral | Risk with Unilateral | |||||
| Live birth | 409 per 1000 | 365 per 1000 | OR 0.83 | 44 | ⊕⊝⊝⊝ | ‐ |
| Multiple pregnancy | ‐ | ‐ | ‐ | ‐ | ‐ | No data were reported for this outcome. |
| Clinical pregnancy | 464 per 1000 | 331 per 1000 | OR 0.57 | 470 | ⊕⊕⊝⊝ | ‐ |
| Miscarriage | 91 per 1000 | 93 per 1000 | Peto OR 1.02 | 131 | ⊕⊝⊝⊝ | ‐ |
| OHSS | ‐ | ‐ | ‐ | ‐ | ‐ | No data were reported for this outcome. |
| *The risk in the intervention group (and its 95% confidence interval) is based on the assumed risk in the comparison group and the relative effect of the intervention (and its 95% CI). | ||||||
| GRADE Working Group grades of evidence | ||||||
| aDowngraded by two levels for very serious risk of bias; inadequate randomisation or allocation concealment and no evidence of blinding. bDowngraded by one level for serious imprecision. | ||||||
| Study | LOD ± CC | Other treatment | P value |
| EUR 1050 | Metformin ± CC EUR 50 | < 0.05 | |
| Total cost per patient NZD 2953 Chance of pregnancy 28% Cost per pregnancy NZD 10,938 Chance of live birth 14% Cost per live birth NZD 21,095 | Gonadotrophin Total cost per woman NZD 5461 Chance of pregnancy 33% Cost per pregnancy NZD 16,549 Chance of live birth 19% Cost per live birth NZD 28,744 | NS NS |
| Outcome or subgroup title | No. of studies | No. of participants | Statistical method | Effect size |
| 1 Live birth Show forest plot | 9 | 1015 | Odds Ratio (M‐H, Fixed, 95% CI) | 0.71 [0.54, 0.92] |
| 1.1 LOD versus CC + metformin | 2 | 170 | Odds Ratio (M‐H, Fixed, 95% CI) | 0.59 [0.32, 1.09] |
| 1.2 LOD versus CC + tamoxifen | 1 | 150 | Odds Ratio (M‐H, Fixed, 95% CI) | 0.81 [0.42, 1.53] |
| 1.3 LOD versus gonadotrophins | 4 | 407 | Odds Ratio (M‐H, Fixed, 95% CI) | 0.87 [0.56, 1.36] |
| 1.4 LOD versus letrozole | 2 | 288 | Odds Ratio (M‐H, Fixed, 95% CI) | 0.55 [0.32, 0.92] |
| 2 Multiple pregnancy Show forest plot | 14 | 1161 | Peto Odds Ratio (Peto, Fixed, 95% CI) | 0.34 [0.18, 0.66] |
| 2.1 LOD versus clomiphene citrate | 1 | 72 | Peto Odds Ratio (Peto, Fixed, 95% CI) | 0.0 [0.0, 0.0] |
| 2.2 LOD versus CC + metformin | 2 | 170 | Peto Odds Ratio (Peto, Fixed, 95% CI) | 0.0 [0.0, 0.0] |
| 2.3 LOD versus CC + rosiglitazone | 1 | 43 | Peto Odds Ratio (Peto, Fixed, 95% CI) | 2.12 [0.21, 21.52] |
| 2.4 LOD versus gonadotrophins | 7 | 532 | Peto Odds Ratio (Peto, Fixed, 95% CI) | 0.22 [0.10, 0.46] |
| 2.5 LOD versus gonadotrophins (rFSH) + metformin | 1 | 36 | Peto Odds Ratio (Peto, Fixed, 95% CI) | 0.0 [0.0, 0.0] |
| 2.6 LOD versus letrozole | 1 | 147 | Peto Odds Ratio (Peto, Fixed, 95% CI) | 0.0 [0.0, 0.0] |
| 2.7 LOD versus metformin | 1 | 161 | Peto Odds Ratio (Peto, Fixed, 95% CI) | 1.32 [0.25, 6.94] |
| 3 Clinical pregnancy Show forest plot | 21 | 2016 | Odds Ratio (M‐H, Fixed, 95% CI) | 0.86 [0.72, 1.03] |
| 3.1 LOD versus clomiphene citrate | 1 | 72 | Odds Ratio (M‐H, Fixed, 95% CI) | 0.52 [0.19, 1.44] |
| 3.2 LOD versus CC + metformin | 2 | 170 | Odds Ratio (M‐H, Fixed, 95% CI) | 0.71 [0.39, 1.31] |
| 3.3 LOD versus CC + tamoxifen | 1 | 150 | Odds Ratio (M‐H, Fixed, 95% CI) | 0.90 [0.47, 1.71] |
| 3.4 LOD versus CC + rosiglitazone | 1 | 43 | Odds Ratio (M‐H, Fixed, 95% CI) | 0.75 [0.23, 2.50] |
| 3.5 LOD versus gonadotrophins | 9 | 760 | Odds Ratio (M‐H, Fixed, 95% CI) | 1.01 [0.74, 1.36] |
| 3.6 LOD versus gonadotrophins (rFSH) + metformin | 1 | 36 | Odds Ratio (M‐H, Fixed, 95% CI) | 0.21 [0.04, 1.00] |
| 3.7 LOD versus letrozole | 3 | 368 | Odds Ratio (M‐H, Fixed, 95% CI) | 0.65 [0.42, 1.01] |
| 3.8 LOD versus letrozole + metformin | 1 | 146 | Odds Ratio (M‐H, Fixed, 95% CI) | 0.83 [0.42, 1.65] |
| 3.9 LOD versus metformin | 2 | 271 | Odds Ratio (M‐H, Fixed, 95% CI) | 1.25 [0.75, 2.08] |
| 4 Miscarriage Show forest plot | 19 | 1909 | Odds Ratio (M‐H, Fixed, 95% CI) | 1.11 [0.78, 1.59] |
| 4.1 LOD versus CC + metformin | 2 | 170 | Odds Ratio (M‐H, Fixed, 95% CI) | 1.95 [0.69, 5.54] |
| 4.2 LOD versus CC + tamoxifen | 1 | 150 | Odds Ratio (M‐H, Fixed, 95% CI) | 1.71 [0.39, 7.45] |
| 4.3 LOD versus CC + rosiglitazone | 1 | 43 | Odds Ratio (M‐H, Fixed, 95% CI) | 1.05 [0.06, 17.95] |
| 4.4 LOD versus gonadotrophins | 8 | 725 | Odds Ratio (M‐H, Fixed, 95% CI) | 0.80 [0.49, 1.33] |
| 4.5 LOD versus gonadotrophins (rFSH) + metformin | 1 | 36 | Odds Ratio (M‐H, Fixed, 95% CI) | 0.0 [0.0, 0.0] |
| 4.6 LOD versus letrozole | 3 | 368 | Odds Ratio (M‐H, Fixed, 95% CI) | 1.86 [0.61, 5.67] |
| 4.7 LOD versus letrozole + metformin | 1 | 146 | Odds Ratio (M‐H, Fixed, 95% CI) | 0.74 [0.16, 3.43] |
| 4.8 LOD versus metformin | 2 | 271 | Odds Ratio (M‐H, Fixed, 95% CI) | 1.60 [0.53, 4.82] |
| 5 OHSS Show forest plot | 8 | 722 | Peto Odds Ratio (Peto, Fixed, 95% CI) | 0.25 [0.07, 0.91] |
| 5.1 LOD versus clomiphene citrate | 1 | 72 | Peto Odds Ratio (Peto, Fixed, 95% CI) | 0.14 [0.00, 6.82] |
| 5.2 LOD versus CC + metformin | 0 | 0 | Peto Odds Ratio (Peto, Fixed, 95% CI) | 0.0 [0.0, 0.0] |
| 5.3 LOD versus CC + rosiglitazone | 1 | 43 | Peto Odds Ratio (Peto, Fixed, 95% CI) | 0.0 [0.0, 0.0] |
| 5.4 LOD versus gonadotrophins | 5 | 446 | Peto Odds Ratio (Peto, Fixed, 95% CI) | 0.12 [0.02, 0.64] |
| 5.5 LOD versus letrozole | 0 | 0 | Peto Odds Ratio (Peto, Fixed, 95% CI) | 0.0 [0.0, 0.0] |
| 5.6 LOD versus metformin | 1 | 161 | Peto Odds Ratio (Peto, Fixed, 95% CI) | 1.31 [0.13, 13.44] |
| 6 Ovulation Show forest plot | 10 | 951 | Odds Ratio (M‐H, Fixed, 95% CI) | 0.96 [0.73, 1.28] |
| 6.1 LOD versus clomiphene citrate | 1 | 72 | Odds Ratio (M‐H, Fixed, 95% CI) | 0.7 [0.27, 1.83] |
| 6.2 LOD versus CC + metformin | 1 | 50 | Odds Ratio (M‐H, Fixed, 95% CI) | 1.0 [0.32, 3.10] |
| 6.3 LOD versus CC + tamoxifen | 1 | 150 | Odds Ratio (M‐H, Fixed, 95% CI) | 1.34 [0.56, 3.17] |
| 6.4 LOD versus CC + rosiglitazone | 1 | 43 | Odds Ratio (M‐H, Fixed, 95% CI) | 0.67 [0.13, 3.44] |
| 6.5 LOD versus gonadotrophins | 2 | 139 | Odds Ratio (M‐H, Fixed, 95% CI) | 0.66 [0.32, 1.36] |
| 6.6 LOD versus letrozole | 1 | 80 | Odds Ratio (M‐H, Fixed, 95% CI) | 0.58 [0.23, 1.46] |
| 6.7 LOD versus letrozole + metformin | 1 | 146 | Odds Ratio (M‐H, Fixed, 95% CI) | 0.95 [0.49, 1.81] |
| 6.8 LOD versus metformin | 2 | 271 | Odds Ratio (M‐H, Fixed, 95% CI) | 1.52 [0.86, 2.68] |
| 7 Costs Show forest plot | 3 | Mean Difference (IV, Fixed, 95% CI) | Subtotals only | |
| 7.1 LOD versus CC + metformin | 1 | 50 | Mean Difference (IV, Fixed, 95% CI) | 3711.3 [3585.17, 3837.43] |
| 7.2 LOD versus gonadotrophins only (short‐term) | 2 | 203 | Mean Difference (IV, Fixed, 95% CI) | ‐1115.75 [‐1309.72, ‐921.77] |
| 7.3 LOD versus gonadotrophins only (long‐term) | 1 | 168 | Mean Difference (IV, Fixed, 95% CI) | ‐2235.0 [‐4433.16, ‐36.84] |
| 8 Quality of Life (Health related quality of life: SF‐36) Show forest plot | 1 | Mean Difference (IV, Fixed, 95% CI) | Totals not selected | |
| 8.1 Physical functioning at 24 weeks | 1 | Mean Difference (IV, Fixed, 95% CI) | 0.0 [0.0, 0.0] | |
| 8.2 Social functioning at 24 weeks | 1 | Mean Difference (IV, Fixed, 95% CI) | 0.0 [0.0, 0.0] | |
| 8.3 Role limitations (physical) at 24 weeks | 1 | Mean Difference (IV, Fixed, 95% CI) | 0.0 [0.0, 0.0] | |
| 8.4 Role limitations (emotional) at 24 weeks | 1 | Mean Difference (IV, Fixed, 95% CI) | 0.0 [0.0, 0.0] | |
| 8.5 Mental health at 24 weeks | 1 | Mean Difference (IV, Fixed, 95% CI) | 0.0 [0.0, 0.0] | |
| 8.6 Vitality at 24 weeks | 1 | Mean Difference (IV, Fixed, 95% CI) | 0.0 [0.0, 0.0] | |
| 8.7 Pain at 24 weeks | 1 | Mean Difference (IV, Fixed, 95% CI) | 0.0 [0.0, 0.0] | |
| 8.8 General health at 24 weeks | 1 | Mean Difference (IV, Fixed, 95% CI) | 0.0 [0.0, 0.0] | |
| 9 Quality of life (Rotterdam Symptom Checklist at 24 weeks) Show forest plot | 1 | Mean Difference (IV, Fixed, 95% CI) | Totals not selected | |
| 9.1 Physical symptoms | 1 | Mean Difference (IV, Fixed, 95% CI) | 0.0 [0.0, 0.0] | |
| 9.2 Psychological distress | 1 | Mean Difference (IV, Fixed, 95% CI) | 0.0 [0.0, 0.0] | |
| 9.3 Activity level | 1 | Mean Difference (IV, Fixed, 95% CI) | 0.0 [0.0, 0.0] | |
| 9.4 Overall quality of life | 1 | Mean Difference (IV, Fixed, 95% CI) | 0.0 [0.0, 0.0] | |
| 10 Quality of life (Depression scales (CES‐D) at 24 weeks) Show forest plot | 1 | Mean Difference (IV, Fixed, 95% CI) | Totals not selected | |
| 10.1 Gonadotrophins | 1 | Mean Difference (IV, Fixed, 95% CI) | 0.0 [0.0, 0.0] | |
| 11 Multiple pregnancy per pregnancy Show forest plot | 14 | 577 | Peto Odds Ratio (Peto, Fixed, 95% CI) | 0.34 [0.17, 0.66] |
| 11.1 LOD versus clomiphene citrate | 1 | 23 | Peto Odds Ratio (Peto, Fixed, 95% CI) | 0.0 [0.0, 0.0] |
| 11.2 LOD versus CC + metformin | 2 | 99 | Peto Odds Ratio (Peto, Fixed, 95% CI) | 0.0 [0.0, 0.0] |
| 11.3 LOD versus CC + rosiglitazone | 1 | 20 | Peto Odds Ratio (Peto, Fixed, 95% CI) | 2.66 [0.24, 29.46] |
| 11.4 LOD versus gonadotrophins | 7 | 280 | Peto Odds Ratio (Peto, Fixed, 95% CI) | 0.20 [0.09, 0.43] |
| 11.5 LOD versus gonadotrophins (rFSH) + metformin | 1 | 11 | Peto Odds Ratio (Peto, Fixed, 95% CI) | 0.0 [0.0, 0.0] |
| 11.6 LOD versus letrozole | 1 | 45 | Peto Odds Ratio (Peto, Fixed, 95% CI) | 0.0 [0.0, 0.0] |
| 11.7 LOD versus metformin | 1 | 99 | Peto Odds Ratio (Peto, Fixed, 95% CI) | 1.42 [0.27, 7.53] |
| 12 Miscarriage per pregnancy Show forest plot | 19 | 900 | Odds Ratio (M‐H, Fixed, 95% CI) | 1.28 [0.88, 1.88] |
| 12.1 LOD versus CC + metformin | 2 | 120 | Odds Ratio (M‐H, Fixed, 95% CI) | 2.49 [0.86, 7.24] |
| 12.2 LOD versus CC + tamoxifen | 1 | 78 | Odds Ratio (M‐H, Fixed, 95% CI) | 1.87 [0.41, 8.43] |
| 12.3 LOD versus CC + rosiglitazone | 1 | 20 | Odds Ratio (M‐H, Fixed, 95% CI) | 1.25 [0.07, 23.26] |
| 12.4 LOD versus gonadotrophins | 8 | 373 | Odds Ratio (M‐H, Fixed, 95% CI) | 0.91 [0.53, 1.56] |
| 12.5 LOD versus gonadotrophins (rFSH) + metformin | 1 | 11 | Odds Ratio (M‐H, Fixed, 95% CI) | 0.0 [0.0, 0.0] |
| 12.6 LOD versus letrozole | 3 | 118 | Odds Ratio (M‐H, Fixed, 95% CI) | 2.75 [0.86, 8.79] |
| 12.7 LOD versus letrozole + metformin | 1 | 49 | Odds Ratio (M‐H, Fixed, 95% CI) | 0.83 [0.16, 4.15] |
| 12.8 LOD versus metformin | 2 | 131 | Odds Ratio (M‐H, Fixed, 95% CI) | 1.30 [0.41, 4.08] |
| Outcome or subgroup title | No. of studies | No. of participants | Statistical method | Effect size |
| 1 Live birth Show forest plot | 1 | Odds Ratio (M‐H, Fixed, 95% CI) | Totals not selected | |
| 2 Multiple pregnancy Show forest plot | 1 | Peto Odds Ratio (Peto, Fixed, 95% CI) | Totals not selected | |
| 3 Clinical pregnancy Show forest plot | 1 | Odds Ratio (M‐H, Fixed, 95% CI) | Totals not selected | |
| 4 Miscarriage Show forest plot | 1 | Odds Ratio (M‐H, Fixed, 95% CI) | Totals not selected | |
| 5 OHSS Show forest plot | 1 | Peto Odds Ratio (Peto, Fixed, 95% CI) | Totals not selected | |
| 6 Multiple pregnancy per pregnancy Show forest plot | 1 | Peto Odds Ratio (Peto, Fixed, 95% CI) | Totals not selected | |
| 7 Miscarriage per pregnancy Show forest plot | 1 | Odds Ratio (M‐H, Fixed, 95% CI) | Totals not selected | |
| Outcome or subgroup title | No. of studies | No. of participants | Statistical method | Effect size |
| 1 Clinical pregnancy Show forest plot | 1 | Odds Ratio (M‐H, Fixed, 95% CI) | Totals not selected | |
| 2 Miscarriage Show forest plot | 1 | Odds Ratio (M‐H, Fixed, 95% CI) | Totals not selected | |
| 3 Ovulation Show forest plot | 1 | Odds Ratio (M‐H, Fixed, 95% CI) | Totals not selected | |
| 4 Miscarriage per pregnancy Show forest plot | 1 | Odds Ratio (M‐H, Fixed, 95% CI) | Totals not selected | |
| Outcome or subgroup title | No. of studies | No. of participants | Statistical method | Effect size |
| 1 Live birth Show forest plot | 1 | Odds Ratio (M‐H, Fixed, 95% CI) | Totals not selected | |
| 2 Clinical pregnancy Show forest plot | 7 | 470 | Odds Ratio (M‐H, Fixed, 95% CI) | 0.57 [0.39, 0.84] |
| 3 Miscarriage Show forest plot | 2 | 131 | Odds Ratio (M‐H, Fixed, 95% CI) | 1.02 [0.31, 3.33] |
| 4 Ovulation Show forest plot | 6 | 449 | Odds Ratio (M‐H, Fixed, 95% CI) | 0.60 [0.40, 0.90] |
| 5 Miscarriage per pregnancy Show forest plot | 2 | 71 | Odds Ratio (M‐H, Fixed, 95% CI) | 0.97 [0.28, 3.36] |
| Outcome or subgroup title | No. of studies | No. of participants | Statistical method | Effect size |
| 1 Clinical pregnancy Show forest plot | 3 | 354 | Odds Ratio (M‐H, Fixed, 95% CI) | 0.94 [0.62, 1.44] |
| 2 Ovulation Show forest plot | 2 | 108 | Odds Ratio (M‐H, Fixed, 95% CI) | 0.33 [0.14, 0.76] |
| Outcome or subgroup title | No. of studies | No. of participants | Statistical method | Effect size |
| 1 Clinical pregnancy Show forest plot | 2 | 195 | Odds Ratio (M‐H, Fixed, 95% CI) | 1.84 [1.04, 3.26] |
| 2 Miscarriage Show forest plot | 1 | Odds Ratio (M‐H, Fixed, 95% CI) | Totals not selected | |
| 3 Ovulation Show forest plot | 2 | 195 | Odds Ratio (M‐H, Fixed, 95% CI) | 1.83 [1.01, 3.33] |
| Outcome or subgroup title | No. of studies | No. of participants | Statistical method | Effect size |
| 1 Live birth Show forest plot | 4 | 415 | Odds Ratio (M‐H, Fixed, 95% CI) | 0.90 [0.59, 1.36] |
| 1.1 LOD versus gonadotrophins | 2 | 218 | Odds Ratio (M‐H, Fixed, 95% CI) | 1.04 [0.59, 1.85] |
| 1.2 LOD versus CC + metformin | 1 | 50 | Odds Ratio (M‐H, Fixed, 95% CI) | 1.17 [0.39, 3.56] |
| 1.3 LOD versus letrozole | 1 | 147 | Odds Ratio (M‐H, Fixed, 95% CI) | 0.62 [0.30, 1.31] |
| 2 Multiple pregnancy Show forest plot | 6 | 522 | Peto Odds Ratio (Peto, Fixed, 95% CI) | 0.18 [0.06, 0.57] |
| 2.1 LOD versus CC + metformin | 1 | 50 | Peto Odds Ratio (Peto, Fixed, 95% CI) | 0.0 [0.0, 0.0] |
| 2.2 LOD versus gonadotrophins | 3 | 253 | Peto Odds Ratio (Peto, Fixed, 95% CI) | 0.18 [0.06, 0.57] |
| 2.3 LOD versus letrozole | 1 | 147 | Peto Odds Ratio (Peto, Fixed, 95% CI) | 0.0 [0.0, 0.0] |
| 2.4 LOD versus clomiphene citrate | 1 | 72 | Peto Odds Ratio (Peto, Fixed, 95% CI) | 0.0 [0.0, 0.0] |