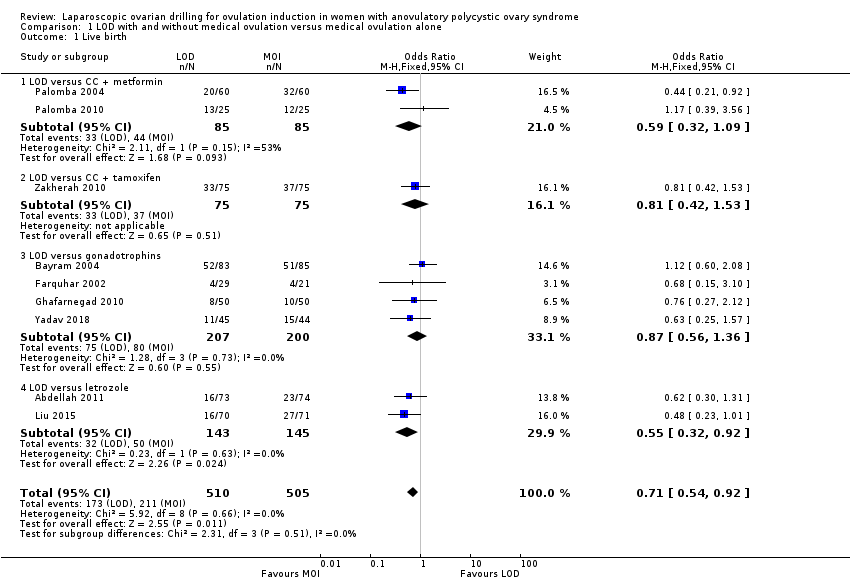
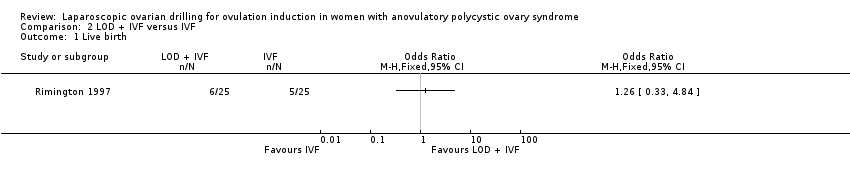
| 1 Live birth Show forest plot | 9 | 1015 | Odds Ratio (M‐H, Fixed, 95% CI) | 0.71 [0.54, 0.92] |
|
| 1.1 LOD versus CC + metformin | 2 | 170 | Odds Ratio (M‐H, Fixed, 95% CI) | 0.59 [0.32, 1.09] |
| 1.2 LOD versus CC + tamoxifen | 1 | 150 | Odds Ratio (M‐H, Fixed, 95% CI) | 0.81 [0.42, 1.53] |
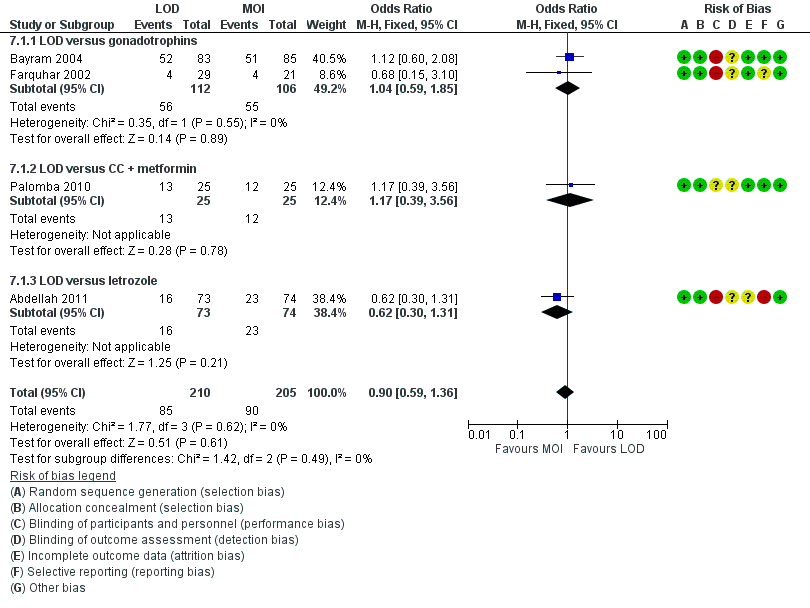
| 1.3 LOD versus gonadotrophins | 4 | 407 | Odds Ratio (M‐H, Fixed, 95% CI) | 0.87 [0.56, 1.36] |
| 1.4 LOD versus letrozole | 2 | 288 | Odds Ratio (M‐H, Fixed, 95% CI) | 0.55 [0.32, 0.92] |
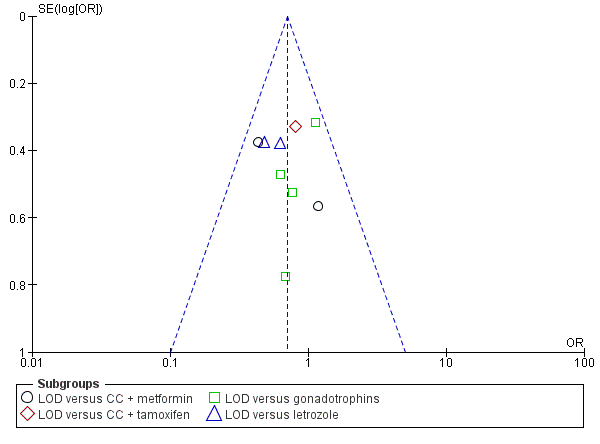
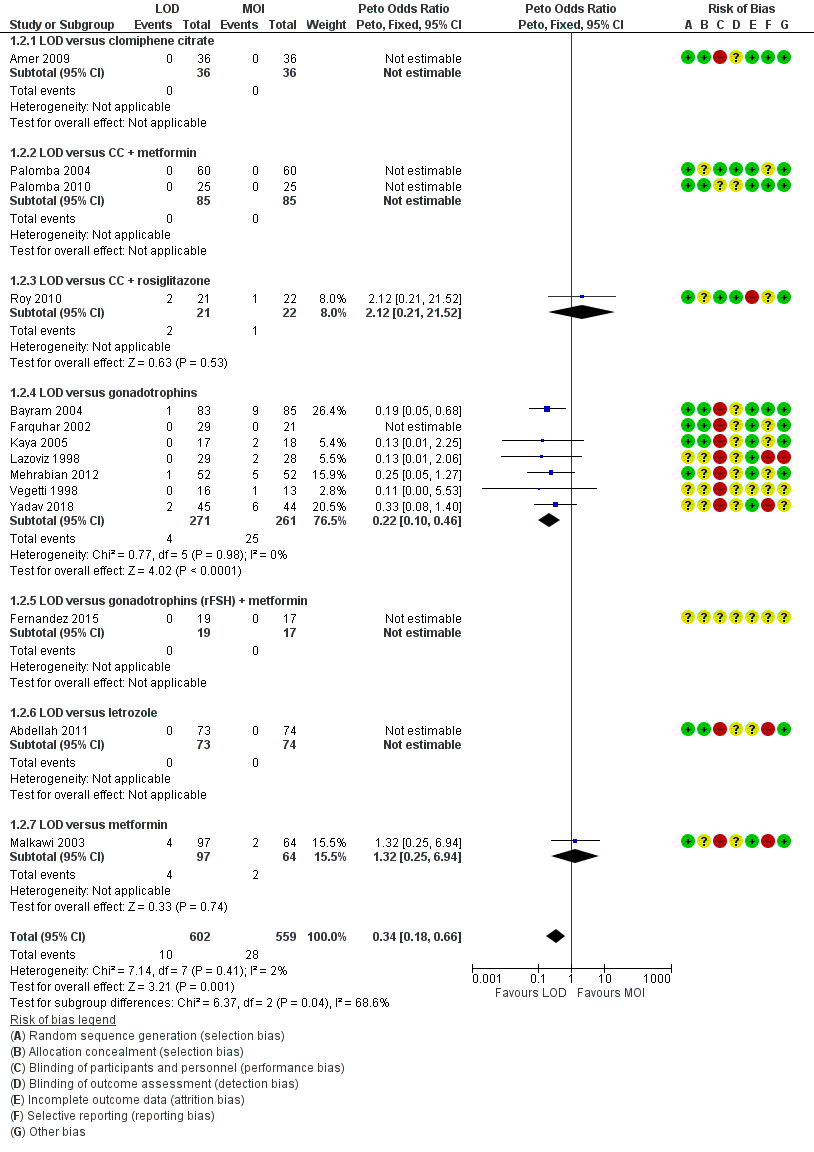
| 2 Multiple pregnancy Show forest plot | 14 | 1161 | Peto Odds Ratio (Peto, Fixed, 95% CI) | 0.34 [0.18, 0.66] |
|
| 2.1 LOD versus clomiphene citrate | 1 | 72 | Peto Odds Ratio (Peto, Fixed, 95% CI) | 0.0 [0.0, 0.0] |
| 2.2 LOD versus CC + metformin | 2 | 170 | Peto Odds Ratio (Peto, Fixed, 95% CI) | 0.0 [0.0, 0.0] |
| 2.3 LOD versus CC + rosiglitazone | 1 | 43 | Peto Odds Ratio (Peto, Fixed, 95% CI) | 2.12 [0.21, 21.52] |
| 2.4 LOD versus gonadotrophins | 7 | 532 | Peto Odds Ratio (Peto, Fixed, 95% CI) | 0.22 [0.10, 0.46] |
| 2.5 LOD versus gonadotrophins (rFSH) + metformin | 1 | 36 | Peto Odds Ratio (Peto, Fixed, 95% CI) | 0.0 [0.0, 0.0] |
| 2.6 LOD versus letrozole | 1 | 147 | Peto Odds Ratio (Peto, Fixed, 95% CI) | 0.0 [0.0, 0.0] |
| 2.7 LOD versus metformin | 1 | 161 | Peto Odds Ratio (Peto, Fixed, 95% CI) | 1.32 [0.25, 6.94] |
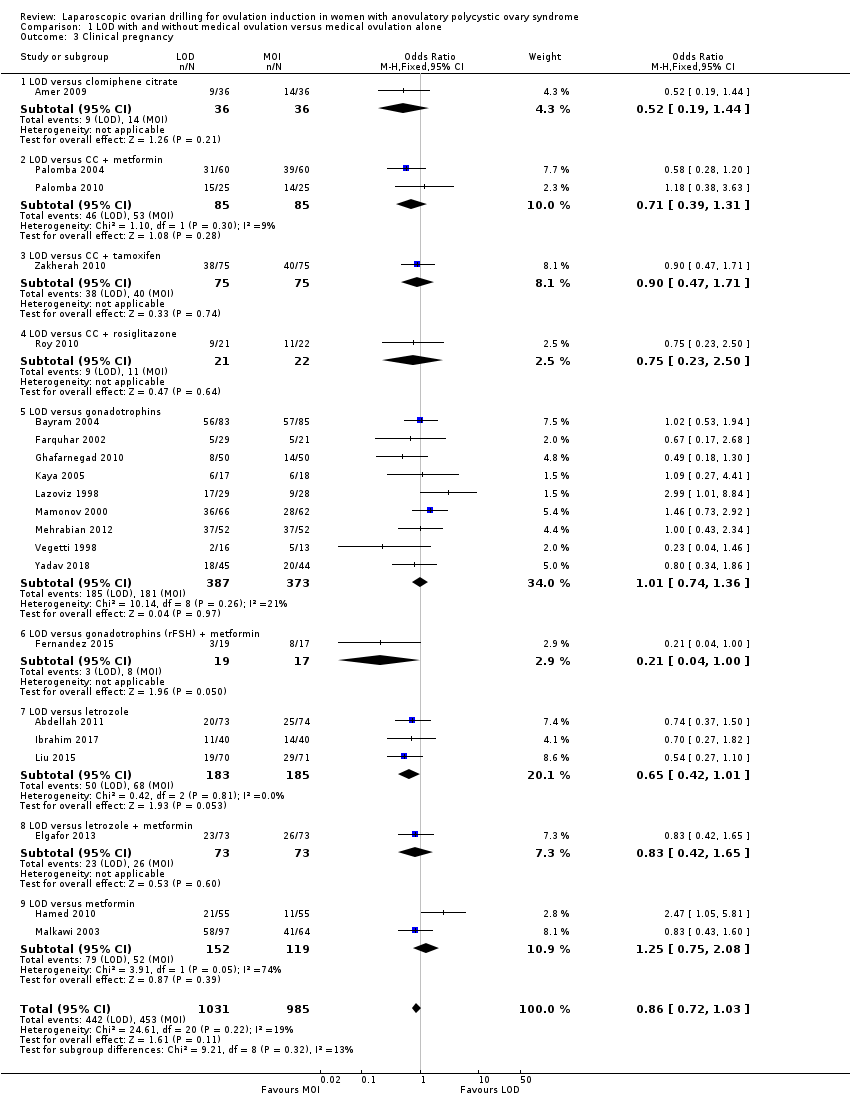
| 3 Clinical pregnancy Show forest plot | 21 | 2016 | Odds Ratio (M‐H, Fixed, 95% CI) | 0.86 [0.72, 1.03] |
|
| 3.1 LOD versus clomiphene citrate | 1 | 72 | Odds Ratio (M‐H, Fixed, 95% CI) | 0.52 [0.19, 1.44] |
| 3.2 LOD versus CC + metformin | 2 | 170 | Odds Ratio (M‐H, Fixed, 95% CI) | 0.71 [0.39, 1.31] |
| 3.3 LOD versus CC + tamoxifen | 1 | 150 | Odds Ratio (M‐H, Fixed, 95% CI) | 0.90 [0.47, 1.71] |
| 3.4 LOD versus CC + rosiglitazone | 1 | 43 | Odds Ratio (M‐H, Fixed, 95% CI) | 0.75 [0.23, 2.50] |
| 3.5 LOD versus gonadotrophins | 9 | 760 | Odds Ratio (M‐H, Fixed, 95% CI) | 1.01 [0.74, 1.36] |
| 3.6 LOD versus gonadotrophins (rFSH) + metformin | 1 | 36 | Odds Ratio (M‐H, Fixed, 95% CI) | 0.21 [0.04, 1.00] |
| 3.7 LOD versus letrozole | 3 | 368 | Odds Ratio (M‐H, Fixed, 95% CI) | 0.65 [0.42, 1.01] |
| 3.8 LOD versus letrozole + metformin | 1 | 146 | Odds Ratio (M‐H, Fixed, 95% CI) | 0.83 [0.42, 1.65] |
| 3.9 LOD versus metformin | 2 | 271 | Odds Ratio (M‐H, Fixed, 95% CI) | 1.25 [0.75, 2.08] |
| 4 Miscarriage Show forest plot | 19 | 1909 | Odds Ratio (M‐H, Fixed, 95% CI) | 1.11 [0.78, 1.59] |
|
| 4.1 LOD versus CC + metformin | 2 | 170 | Odds Ratio (M‐H, Fixed, 95% CI) | 1.95 [0.69, 5.54] |
| 4.2 LOD versus CC + tamoxifen | 1 | 150 | Odds Ratio (M‐H, Fixed, 95% CI) | 1.71 [0.39, 7.45] |
| 4.3 LOD versus CC + rosiglitazone | 1 | 43 | Odds Ratio (M‐H, Fixed, 95% CI) | 1.05 [0.06, 17.95] |
| 4.4 LOD versus gonadotrophins | 8 | 725 | Odds Ratio (M‐H, Fixed, 95% CI) | 0.80 [0.49, 1.33] |
| 4.5 LOD versus gonadotrophins (rFSH) + metformin | 1 | 36 | Odds Ratio (M‐H, Fixed, 95% CI) | 0.0 [0.0, 0.0] |
| 4.6 LOD versus letrozole | 3 | 368 | Odds Ratio (M‐H, Fixed, 95% CI) | 1.86 [0.61, 5.67] |
| 4.7 LOD versus letrozole + metformin | 1 | 146 | Odds Ratio (M‐H, Fixed, 95% CI) | 0.74 [0.16, 3.43] |
| 4.8 LOD versus metformin | 2 | 271 | Odds Ratio (M‐H, Fixed, 95% CI) | 1.60 [0.53, 4.82] |
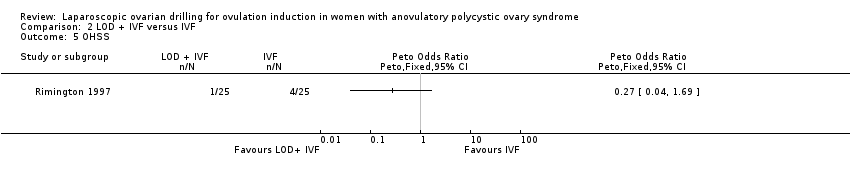
| 5 OHSS Show forest plot | 8 | 722 | Peto Odds Ratio (Peto, Fixed, 95% CI) | 0.25 [0.07, 0.91] |
|
| 5.1 LOD versus clomiphene citrate | 1 | 72 | Peto Odds Ratio (Peto, Fixed, 95% CI) | 0.14 [0.00, 6.82] |
| 5.2 LOD versus CC + metformin | 0 | 0 | Peto Odds Ratio (Peto, Fixed, 95% CI) | 0.0 [0.0, 0.0] |
| 5.3 LOD versus CC + rosiglitazone | 1 | 43 | Peto Odds Ratio (Peto, Fixed, 95% CI) | 0.0 [0.0, 0.0] |
| 5.4 LOD versus gonadotrophins | 5 | 446 | Peto Odds Ratio (Peto, Fixed, 95% CI) | 0.12 [0.02, 0.64] |
| 5.5 LOD versus letrozole | 0 | 0 | Peto Odds Ratio (Peto, Fixed, 95% CI) | 0.0 [0.0, 0.0] |
| 5.6 LOD versus metformin | 1 | 161 | Peto Odds Ratio (Peto, Fixed, 95% CI) | 1.31 [0.13, 13.44] |
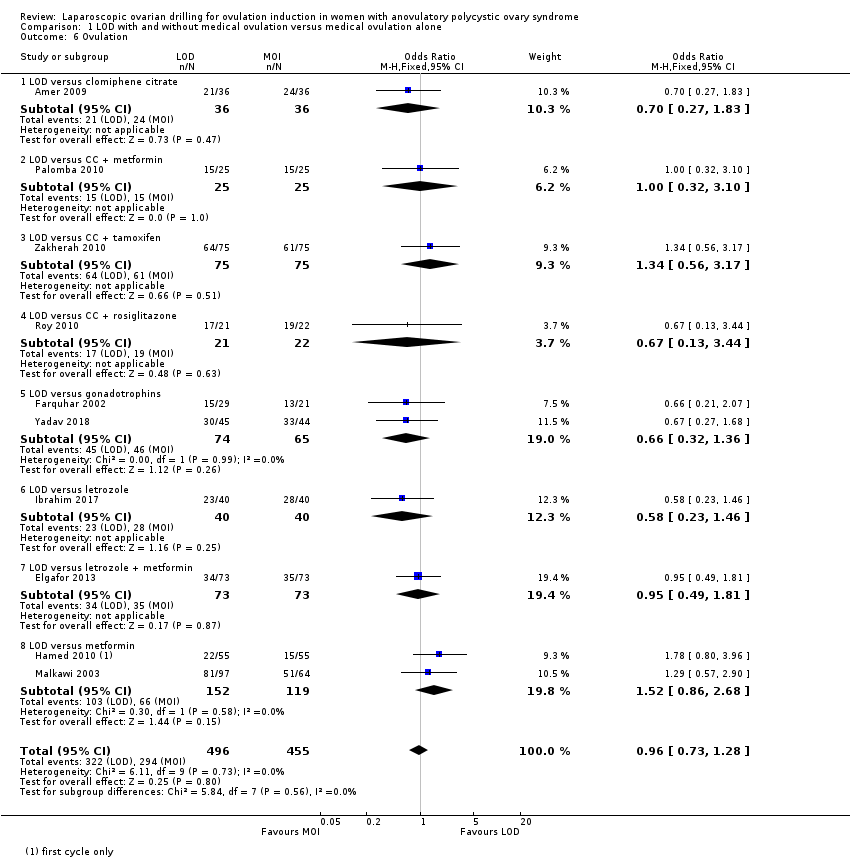
| 6 Ovulation Show forest plot | 10 | 951 | Odds Ratio (M‐H, Fixed, 95% CI) | 0.96 [0.73, 1.28] |
|
| 6.1 LOD versus clomiphene citrate | 1 | 72 | Odds Ratio (M‐H, Fixed, 95% CI) | 0.7 [0.27, 1.83] |
| 6.2 LOD versus CC + metformin | 1 | 50 | Odds Ratio (M‐H, Fixed, 95% CI) | 1.0 [0.32, 3.10] |
| 6.3 LOD versus CC + tamoxifen | 1 | 150 | Odds Ratio (M‐H, Fixed, 95% CI) | 1.34 [0.56, 3.17] |
| 6.4 LOD versus CC + rosiglitazone | 1 | 43 | Odds Ratio (M‐H, Fixed, 95% CI) | 0.67 [0.13, 3.44] |
| 6.5 LOD versus gonadotrophins | 2 | 139 | Odds Ratio (M‐H, Fixed, 95% CI) | 0.66 [0.32, 1.36] |
| 6.6 LOD versus letrozole | 1 | 80 | Odds Ratio (M‐H, Fixed, 95% CI) | 0.58 [0.23, 1.46] |
| 6.7 LOD versus letrozole + metformin | 1 | 146 | Odds Ratio (M‐H, Fixed, 95% CI) | 0.95 [0.49, 1.81] |
| 6.8 LOD versus metformin | 2 | 271 | Odds Ratio (M‐H, Fixed, 95% CI) | 1.52 [0.86, 2.68] |
| 7 Costs Show forest plot | 3 | | Mean Difference (IV, Fixed, 95% CI) | Subtotals only |
|
| 7.1 LOD versus CC + metformin | 1 | 50 | Mean Difference (IV, Fixed, 95% CI) | 3711.3 [3585.17, 3837.43] |
| 7.2 LOD versus gonadotrophins only (short‐term) | 2 | 203 | Mean Difference (IV, Fixed, 95% CI) | ‐1115.75 [‐1309.72, ‐921.77] |
| 7.3 LOD versus gonadotrophins only (long‐term) | 1 | 168 | Mean Difference (IV, Fixed, 95% CI) | ‐2235.0 [‐4433.16, ‐36.84] |
| 8 Quality of Life (Health related quality of life: SF‐36) Show forest plot | 1 | | Mean Difference (IV, Fixed, 95% CI) | Totals not selected |
|
| 8.1 Physical functioning at 24 weeks | 1 | | Mean Difference (IV, Fixed, 95% CI) | 0.0 [0.0, 0.0] |
| 8.2 Social functioning at 24 weeks | 1 | | Mean Difference (IV, Fixed, 95% CI) | 0.0 [0.0, 0.0] |
| 8.3 Role limitations (physical) at 24 weeks | 1 | | Mean Difference (IV, Fixed, 95% CI) | 0.0 [0.0, 0.0] |
| 8.4 Role limitations (emotional) at 24 weeks | 1 | | Mean Difference (IV, Fixed, 95% CI) | 0.0 [0.0, 0.0] |
| 8.5 Mental health at 24 weeks | 1 | | Mean Difference (IV, Fixed, 95% CI) | 0.0 [0.0, 0.0] |
| 8.6 Vitality at 24 weeks | 1 | | Mean Difference (IV, Fixed, 95% CI) | 0.0 [0.0, 0.0] |
| 8.7 Pain at 24 weeks | 1 | | Mean Difference (IV, Fixed, 95% CI) | 0.0 [0.0, 0.0] |
| 8.8 General health at 24 weeks | 1 | | Mean Difference (IV, Fixed, 95% CI) | 0.0 [0.0, 0.0] |
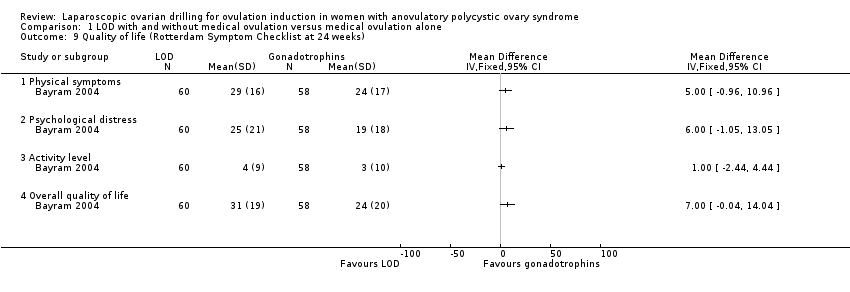
| 9 Quality of life (Rotterdam Symptom Checklist at 24 weeks) Show forest plot | 1 | | Mean Difference (IV, Fixed, 95% CI) | Totals not selected |
|
| 9.1 Physical symptoms | 1 | | Mean Difference (IV, Fixed, 95% CI) | 0.0 [0.0, 0.0] |
| 9.2 Psychological distress | 1 | | Mean Difference (IV, Fixed, 95% CI) | 0.0 [0.0, 0.0] |
| 9.3 Activity level | 1 | | Mean Difference (IV, Fixed, 95% CI) | 0.0 [0.0, 0.0] |
| 9.4 Overall quality of life | 1 | | Mean Difference (IV, Fixed, 95% CI) | 0.0 [0.0, 0.0] |
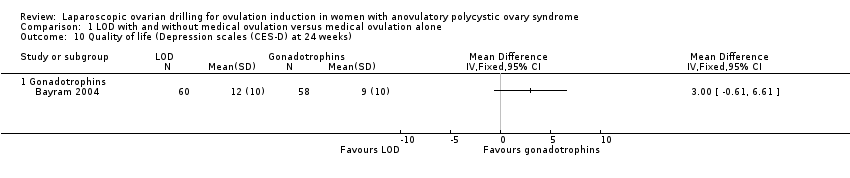
| 10 Quality of life (Depression scales (CES‐D) at 24 weeks) Show forest plot | 1 | | Mean Difference (IV, Fixed, 95% CI) | Totals not selected |
|
| 10.1 Gonadotrophins | 1 | | Mean Difference (IV, Fixed, 95% CI) | 0.0 [0.0, 0.0] |
| 11 Multiple pregnancy per pregnancy Show forest plot | 14 | 577 | Peto Odds Ratio (Peto, Fixed, 95% CI) | 0.34 [0.17, 0.66] |
|
| 11.1 LOD versus clomiphene citrate | 1 | 23 | Peto Odds Ratio (Peto, Fixed, 95% CI) | 0.0 [0.0, 0.0] |
| 11.2 LOD versus CC + metformin | 2 | 99 | Peto Odds Ratio (Peto, Fixed, 95% CI) | 0.0 [0.0, 0.0] |
| 11.3 LOD versus CC + rosiglitazone | 1 | 20 | Peto Odds Ratio (Peto, Fixed, 95% CI) | 2.66 [0.24, 29.46] |
| 11.4 LOD versus gonadotrophins | 7 | 280 | Peto Odds Ratio (Peto, Fixed, 95% CI) | 0.20 [0.09, 0.43] |
| 11.5 LOD versus gonadotrophins (rFSH) + metformin | 1 | 11 | Peto Odds Ratio (Peto, Fixed, 95% CI) | 0.0 [0.0, 0.0] |
| 11.6 LOD versus letrozole | 1 | 45 | Peto Odds Ratio (Peto, Fixed, 95% CI) | 0.0 [0.0, 0.0] |
| 11.7 LOD versus metformin | 1 | 99 | Peto Odds Ratio (Peto, Fixed, 95% CI) | 1.42 [0.27, 7.53] |
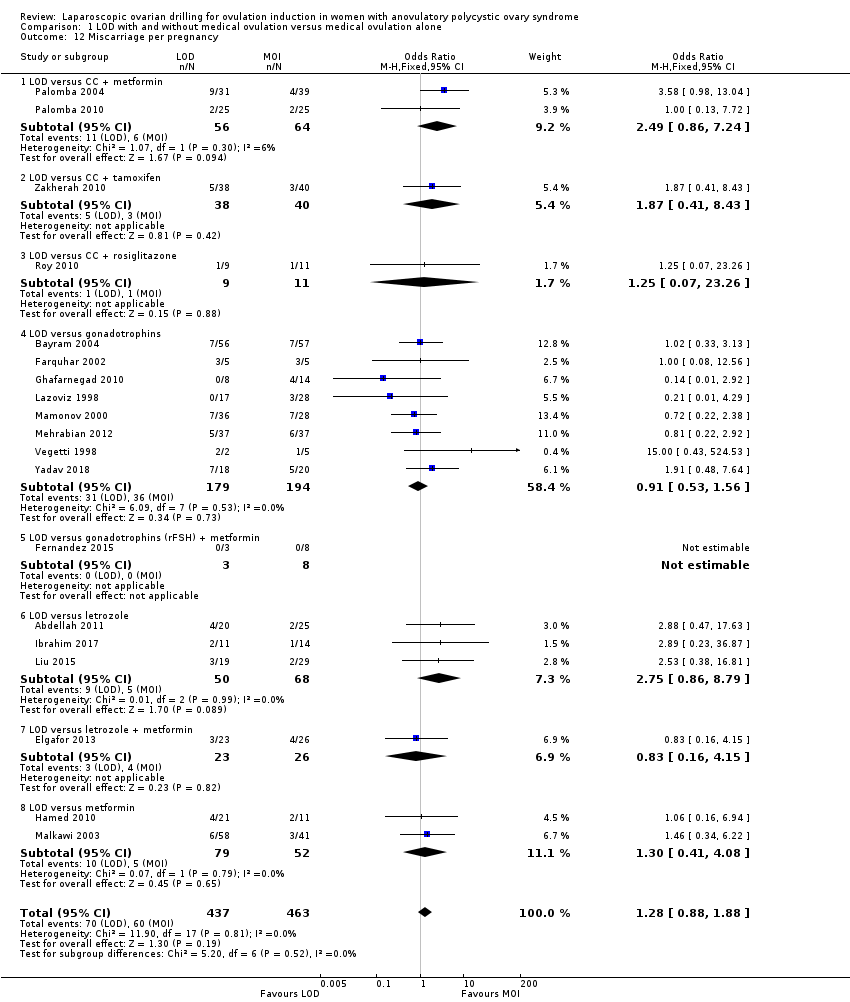
| 12 Miscarriage per pregnancy Show forest plot | 19 | 900 | Odds Ratio (M‐H, Fixed, 95% CI) | 1.28 [0.88, 1.88] |
|
| 12.1 LOD versus CC + metformin | 2 | 120 | Odds Ratio (M‐H, Fixed, 95% CI) | 2.49 [0.86, 7.24] |
| 12.2 LOD versus CC + tamoxifen | 1 | 78 | Odds Ratio (M‐H, Fixed, 95% CI) | 1.87 [0.41, 8.43] |
| 12.3 LOD versus CC + rosiglitazone | 1 | 20 | Odds Ratio (M‐H, Fixed, 95% CI) | 1.25 [0.07, 23.26] |
| 12.4 LOD versus gonadotrophins | 8 | 373 | Odds Ratio (M‐H, Fixed, 95% CI) | 0.91 [0.53, 1.56] |
| 12.5 LOD versus gonadotrophins (rFSH) + metformin | 1 | 11 | Odds Ratio (M‐H, Fixed, 95% CI) | 0.0 [0.0, 0.0] |
| 12.6 LOD versus letrozole | 3 | 118 | Odds Ratio (M‐H, Fixed, 95% CI) | 2.75 [0.86, 8.79] |
| 12.7 LOD versus letrozole + metformin | 1 | 49 | Odds Ratio (M‐H, Fixed, 95% CI) | 0.83 [0.16, 4.15] |
| 12.8 LOD versus metformin | 2 | 131 | Odds Ratio (M‐H, Fixed, 95% CI) | 1.30 [0.41, 4.08] |