無排卵性多嚢胞性卵巣症候群の女性における排卵誘発のための腹腔鏡下卵巣開孔術
Appendices
Appendix 1. Cochrane Gynaecology and Fertility (CGFG) specialised register search
Searched 8 October 2019
Procite platform
Keywords CONTAINS "polycystic ovary morphology" or "polycystic ovary syndrome" or"PCOS" or Title CONTAINS "polycystic ovary morphology" or "polycystic ovary syndrome" or "PCOS"
AND
Keywords CONTAINS "laparoscopic coagulation techniques" or "laparoscopic electrocautery" or "laparoscopic ovarian cautery" or "laparoscopic ovarian cystectomy" or "laparoscopic ovarian diathermy" or "laparoscopic ovarian drilling" or "laparoscopic ovarian electrocauterization" or "laparoscopic ovarian electrodrilling" or "laser" or "Diathermy" or "electrocautery" or "Electrocoagulation" or "electrosurgical" or "cystectomy" or "thermocoagulation" or "ovarian cystectomy" or "ovarian diathermy" or "ovarian drilling" or "ovarian adhesions" or "ovarian electrocautery" or "ovarian surgery" or Title CONTAINS "laparoscopic coagulation techniques" or "laparoscopic electrocautery" or "laparoscopic ovarian cautery" or "laparoscopic ovarian cystectomy" or "laparoscopic ovarian diathermy" or "laparoscopic ovarian drilling" or "laparoscopic ovarian electrocauterization" or "laparoscopic ovarian electrodrilling"
(113 records)
Appendix 2. CENTRAL search strategy
Searched 8 October 2019
via the Central Register of Studies Online (CRSO) web platform
#1 MESH DESCRIPTOR Polycystic Ovary Syndrome EXPLODE ALL TREES 1336
#2 (PCOS or PCOD):TI,AB,KY 2619
#3 (stein leventhal syndrome):TI,AB,KY 30
#4 (polycystic ovar*):TI,AB,KY 3203
#5 #1 OR #2 OR #3 OR #4 3511
#6 MESH DESCRIPTOR Diathermy EXPLODE ALL TREES 992
#7 MESH DESCRIPTOR Laparoscopy EXPLODE ALL TREES 5275
#8 MESH DESCRIPTOR Cautery EXPLODE ALL TREES 754
#9 MESH DESCRIPTOR Electrocoagulation EXPLODE ALL TREES 691
#10 cauter*:TI,AB,KY 718
#11 electrocauter*:TI,AB,KY 613
#12 cystectomy:TI,AB,KY 1313
#13 diathermy:TI,AB,KY 711
#14 drilling:TI,AB,KY 414
#15 electrocoagulation:TI,AB,KY 867
#16 thermocoagulation:TI,AB,KY 127
#17 MESH DESCRIPTOR Laser Coagulation EXPLODE ALL TREES 513
#18 (laparoscop* adj5 ovar*):TI,AB,KY 475
#19 laser*:TI,AB,KY 16999
#20 photocoagulation:TI,AB,KY 1420
#21 surg*:TI,AB,KY 217850
#22 electrosurg*:TI,AB,KY 534
#23 #6 OR #7 OR #8 OR #9 OR #10 OR #11 OR #12 OR #13 OR #14 OR #15 OR #16 OR #17 OR #18 OR #19 OR #20 OR #21 OR #22 230901
#24 #5 AND #23 283
Appendix 3. MEDLINE search strategy
Searched from 1946 to 8 October 2019
Ovid platform
1 Polycystic Ovary Syndrome/ (13783)
2 (polycystic adj5 ovar$).tw. (15849)
3 PCOS.tw. (10482)
4 PCOD.tw. (288)
5 (stein‐leventhal or leventhal).tw. (722)
6 (ovar$ adj (scelerocystic or polycystic or degeneration)).tw. (93)
7 or/1‐6 (18862)
8 exp Diathermy/ (14948)
9 Laparoscopy/ (82328)
10 exp cautery/ or exp electrocoagulation/ or argon plasma coagulation/ (13238)
11 cauter*.tw. (4468)
12 cystectomy.tw. (13677)
13 diathermy.tw. (2918)
14 drilling.tw. (7339)
15 electrocauter*.tw. (3491)
16 electrocoagulation.tw. (3026)
17 thermocoagulation.tw. (934)
18 Laser Coagulation/ (7395)
19 (laparoscop$ adj5 ovar$).tw. (2568)
20 laser.tw. (249887)
21 photocoagulation.tw. (9142)
22 surg$.tw. (1821592)
23 electrosurg*.tw. (3478)
24 or/8‐23 (2112511)
25 randomized controlled trial.pt. (490860)
26 controlled clinical trial.pt. (93307)
27 randomized.ab. (456000)
28 placebo.tw. (206702)
29 clinical trials as topic.sh. (188610)
30 randomly.ab. (319021)
31 trial.ti. (205456)
32 (crossover or cross‐over or cross over).tw. (81833)
33 or/25‐32 (1270919)
34 exp animals/ not humans.sh. (4625030)
35 33 not 34 (1167599)
36 7 and 24 and 35 (145)
Appendix 4. Embase search strategy
Searched from 1980 to 8 October 2019
Ovid platform
1 exp ovary polycystic disease/ or exp stein leventhal syndrome/ (25731)
2 (polycystic adj5 ovar$).tw. (22274)
3 PCOS.tw. (16338)
4 PCOD.tw. (401)
5 (stein‐leventhal or leventhal).tw. (309)
6 (ovar$ adj (scelerocystic or polycystic or degeneration)).tw. (94)
7 or/1‐6 (29877)
8 exp Diathermy/ (4500)
9 Laparoscopy/ (71638)
10 cystectom$.tw. (22067)
11 diathermy.tw. (3104)
12 drilling.tw. (8571)
13 electrocauter$.tw. (5039)
14 electrocoagulat$.tw. (3159)
15 thermocoagulat$.tw. (1220)
16 Laser Coagulation/ (19715)
17 laser$.tw. (257937)
18 (laparoscop$ adj5 ovar$).tw. (4111)
19 photocoagulation.tw. (10939)
20 surg$.tw. (2368961)
21 cauter$.tw. (6403)
22 electrosurg$.tw. (4400)
23 exp cauterization/ or exp electrosurgery/ or exp electrocoagulation/ or exp laser surgery/ (81651)
24 or/8‐23 (2661781)
25 Clinical Trial/ (954205)
26 Randomized Controlled Trial/ (571370)
27 exp randomization/ (84709)
28 Single Blind Procedure/ (36882)
29 Double Blind Procedure/ (164012)
30 Crossover Procedure/ (61044)
31 Placebo/ (329928)
32 Randomi?ed controlled trial$.tw. (213457)
33 Rct.tw. (34258)
34 random allocation.tw. (1918)
35 randomly allocated.tw. (33472)
36 allocated randomly.tw. (2484)
37 (allocated adj2 random).tw. (810)
38 Single blind$.tw. (23527)
39 Double blind$.tw. (196701)
40 ((treble or triple) adj blind$).tw. (1018)
41 placebo$.tw. (292739)
42 prospective study/ (556114)
43 or/25‐42 (2094903)
44 case study/ (64768)
45 case report.tw. (384379)
46 abstract report/ or letter/ (1075862)
47 or/44‐46 (1515022)
48 43 not 47 (2043020)
49 7 and 24 and 48 (535)
Appendix 5. PsycINFO search strategy
Searched from 1806 to 8 October 2019
Ovid platform
1 exp Endocrine Sexual Disorders/ (1726)
2 (polycystic adj5 ovar$).tw. (404)
3 PCOS.tw. (265)
4 PCOD.tw. (7)
5 (stein‐leventhal or leventhal).tw. (296)
6 (ovar$ adj (scelerocystic or polycystic or degeneration)).tw. (0)
7 or/1‐6 (2287)
8 Diathermy.tw. (30)
9 cystectomy.tw. (35)
10 drilling.tw. (291)
11 electrocautery.tw. (11)
12 electrocoagulation.tw. (72)
13 thermocoagulation.tw. (58)
14 laser.tw. (3258)
15 (laparoscop$ adj5 ovar$).tw. (8)
16 laser.tw. (3258)
17 photocoagulation.tw. (33)
18 surg$.tw. (47688)
19 electrosurgery.tw. (4)
20 or/8‐19 (51212)
21 7 and 20 (164)
22 random.tw. (56335)
23 control.tw. (431633)
24 double‐blind.tw. (22388)
25 clinical trials/ (11453)
26 placebo/ (5373)
27 exp Treatment/ (1015784)
28 or/22‐27 (1401802)
29 21 and 28 (104)
Appendix 6. CINAHL search strategy
Cumulative Index to Nursing & Allied Health Literature
Searched from 1961 to 8 October 2019
Ebsco platform
| # | Query | Results |
| S38 | S25 AND S37 | 126 |
| S37 | S26 OR S27 OR S28 OR S29 OR S30 OR S31 OR S32 OR S33 OR S34 OR S35 OR S36 | 1,350,648 |
| S36 | TX allocat* random* | 10,967 |
| S35 | (MH "Quantitative Studies") | 23,381 |
| S34 | (MH "Placebos") | 11,451 |
| S33 | TX placebo* | 59,249 |
| S32 | TX random* allocat* | 10,967 |
| S31 | (MH "Random Assignment") | 56,159 |
| S30 | TX randomi* control* trial* | 176,191 |
| S29 | TX ( (singl* n1 blind*) or (singl* n1 mask*) ) or TX ( (doubl* n1 blind*) or (doubl* n1 mask*) ) or TX ( (tripl* n1 blind*) or (tripl* n1 mask*) ) or TX ( (trebl* n1 blind*) or (trebl* n1 mask*) ) | 1,030,772 |
| S28 | TX clinic* n1 trial* | 251,547 |
| S27 | PT Clinical trial | 86,654 |
| S26 | (MH "Clinical Trials+") | 267,630 |
| S25 | S5 AND S24 | 556 |
| S24 | S6 OR S7 OR S8 OR S9 OR S10 OR S11 OR S12 OR S13 OR S14 OR S15 OR S16 OR S17 OR S18 OR S19 OR S20 OR S21 OR S22 OR S23 | 814,589 |
| S23 | TX electrosurg* | 1,359 |
| S22 | TX surg* | 794,505 |
| S21 | TX photocoagulation | 886 |
| S20 | TX laser | 29,283 |
| S19 | TX laparoscop* N5 ovar* | 544 |
| S18 | (MM "Laser Therapy+") | 7,115 |
| S17 | TX thermocoagulation | 141 |
| S16 | TX electrocoagulation | 985 |
| S15 | TX electrocauter* | 612 |
| S14 | TX drilling | 1,560 |
| S13 | TX diathermy | 676 |
| S12 | TX cystectomy | 2,323 |
| S11 | (MM "Cystectomy") | 869 |
| S10 | TX electrocautery | 570 |
| S9 | TX cauter* | 1,152 |
| S8 | (MM "Cautery+") | 11,718 |
| S7 | (MM "Surgery, Laparoscopic+") | 4,587 |
| S6 | (MM "Diathermy+") OR (MM "Electrocoagulation+") | 13,284 |
| S5 | S1 OR S2 OR S3 OR S4 | 4,752 |
| S4 | TX polycystic ovar* | 4,141 |
| S3 | TX stein leventhal syndrome | 10 |
| S2 | TX PCOS or TX PCOD | 2,578 |
| S1 | (MM "Polycystic Ovary Syndrome") | 2,596 |

Study flow diagram.

Risk of bias graph: review authors' judgements about each risk of bias item presented as percentages across all included studies.
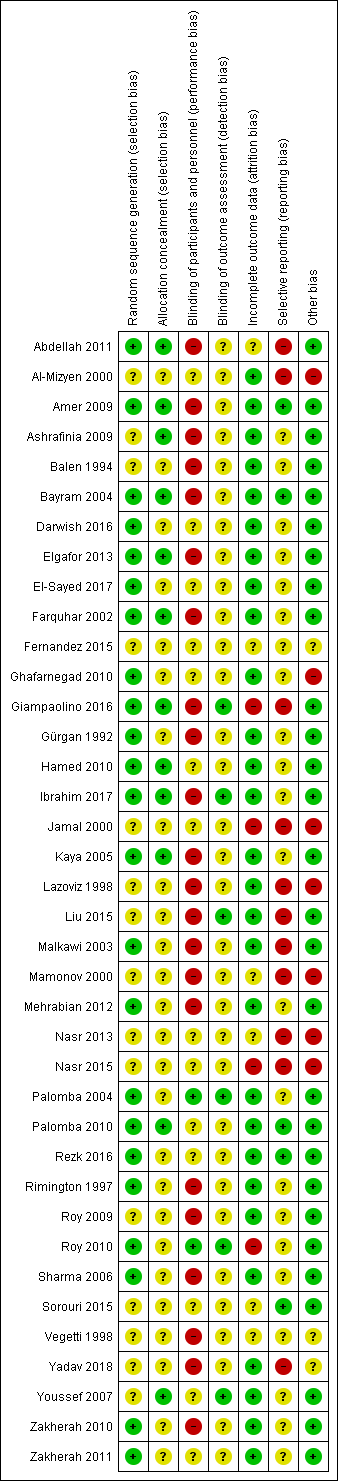
Risk of bias summary: review authors' judgements about each risk of bias item for each included study.

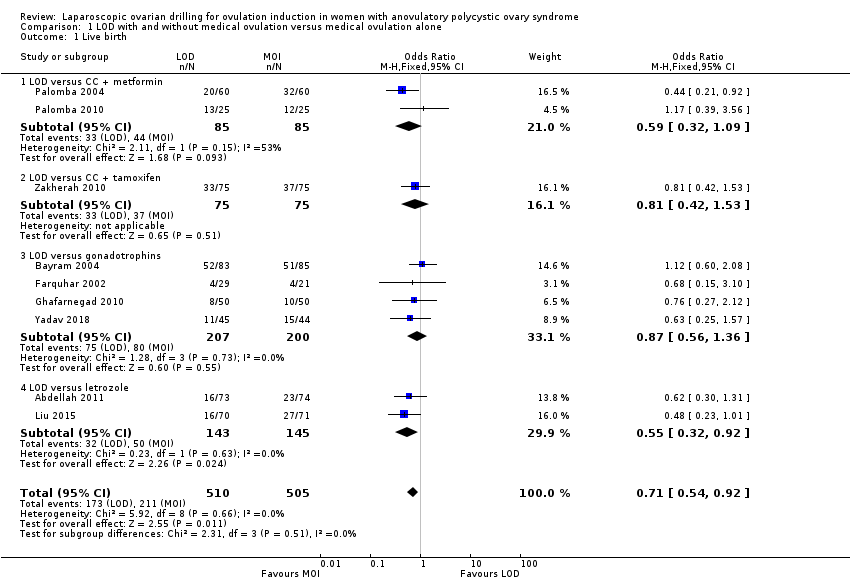
Forest plot of comparison: 1 LOD with and without medical ovulation versus medical ovulation alone, outcome: 1.1 Live birth.
MOI: Medical ovulation induction alone
LOD: laparoscopic ovarian drilling with or without medical ovulation induction
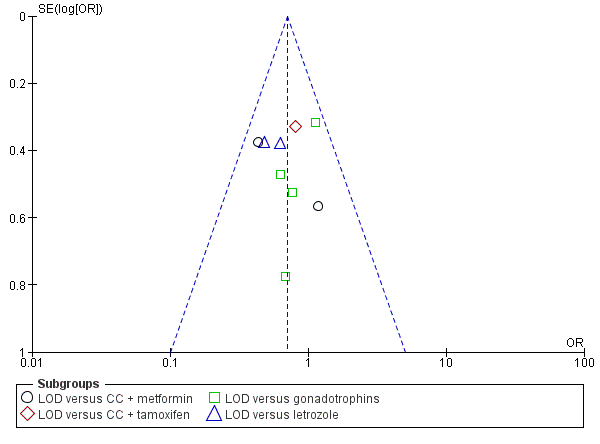
Funnel plot of comparison: 1 LOD with and without medical ovulation versus medical ovulation alone, outcome: 1.1 Live birth.
LOD: laparoscopic ovarian drilling with or without medical ovulation induction
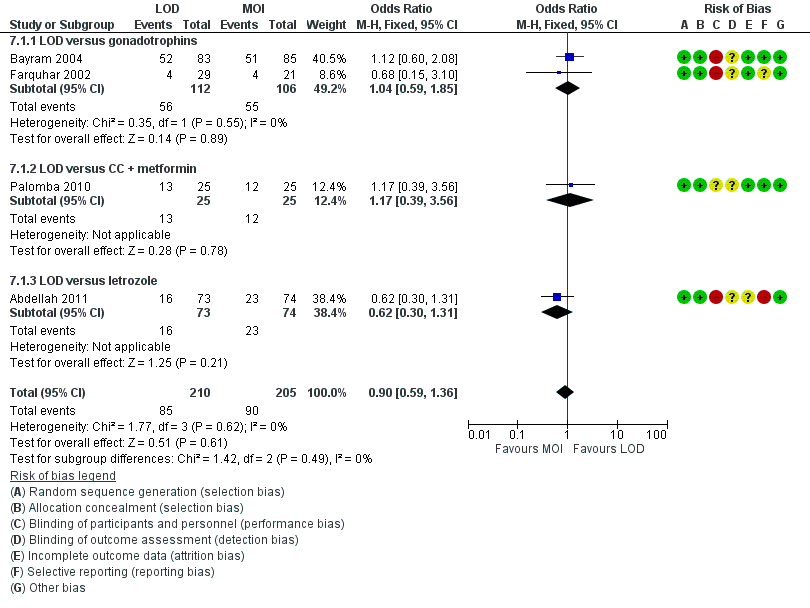
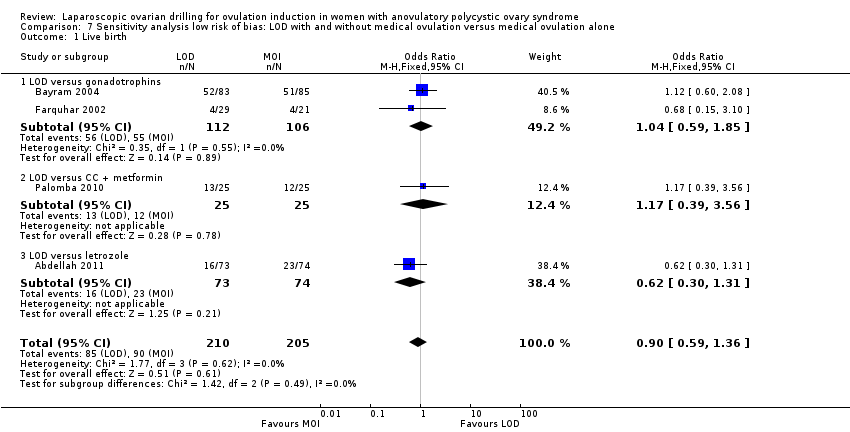
Forest plot of comparison: 5 Sensitivity analysis low risk of bias: LOD with and without medical ovulation versus medical ovulation alone, outcome: 5.1 Live birth.
MOI: Medical ovulation induction alone
LOD: laparoscopic ovarian drilling with or without medical ovulation induction
Forest plot of comparison: 1 LOD with and without medical ovulation versus medical ovulation alone, outcome: 1.4 Multiple pregnancy rate (per ongoing pregnancy).
MOI: Medical ovulation induction alone
LOD: laparoscopic ovarian drilling with or without medical ovulation induction
Comparison 1 LOD with and without medical ovulation versus medical ovulation alone, Outcome 1 Live birth.

Comparison 1 LOD with and without medical ovulation versus medical ovulation alone, Outcome 2 Multiple pregnancy.
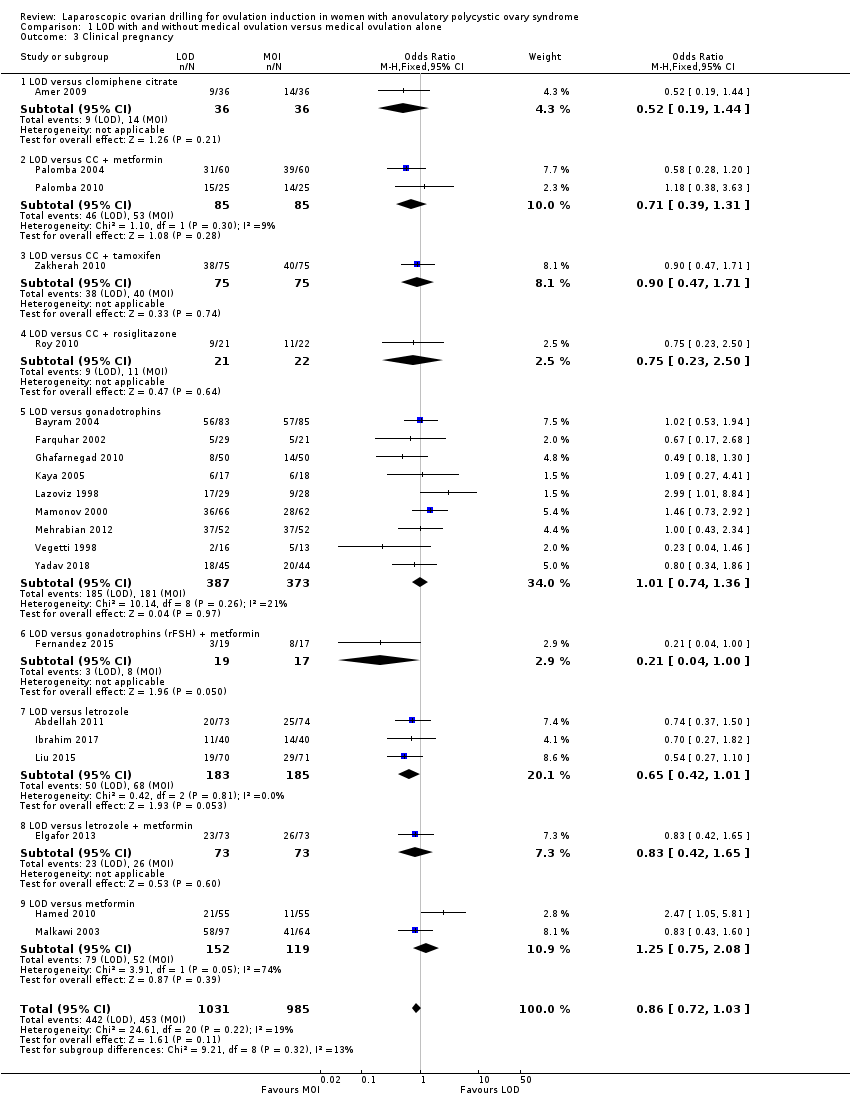
Comparison 1 LOD with and without medical ovulation versus medical ovulation alone, Outcome 3 Clinical pregnancy.

Comparison 1 LOD with and without medical ovulation versus medical ovulation alone, Outcome 4 Miscarriage.

Comparison 1 LOD with and without medical ovulation versus medical ovulation alone, Outcome 5 OHSS.
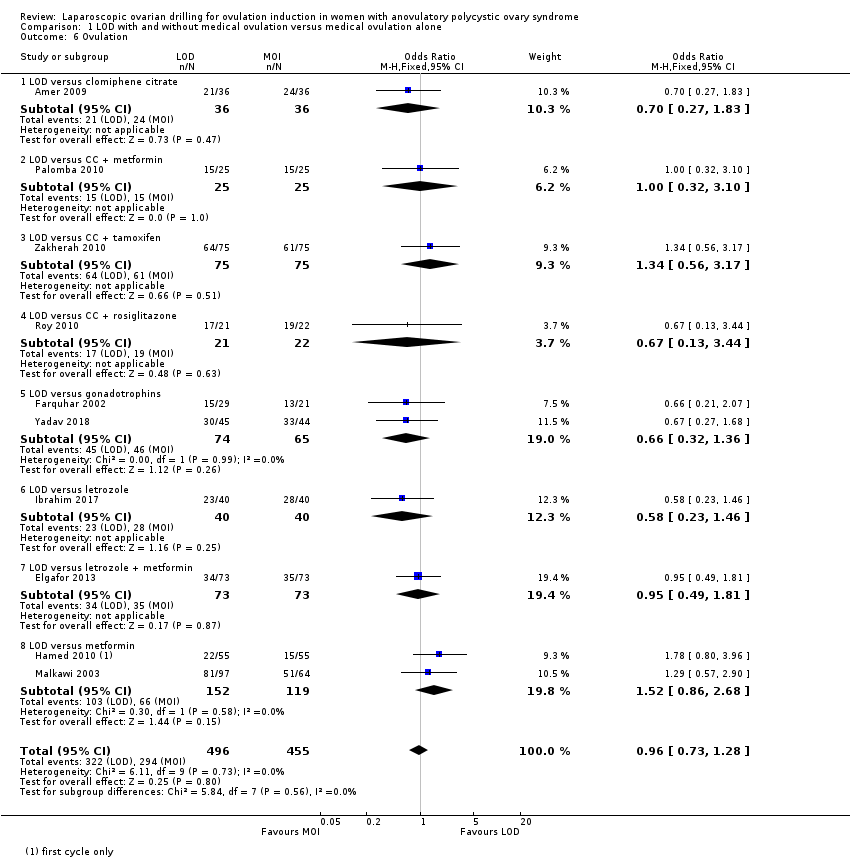
Comparison 1 LOD with and without medical ovulation versus medical ovulation alone, Outcome 6 Ovulation.

Comparison 1 LOD with and without medical ovulation versus medical ovulation alone, Outcome 7 Costs.

Comparison 1 LOD with and without medical ovulation versus medical ovulation alone, Outcome 8 Quality of Life (Health related quality of life: SF‐36).
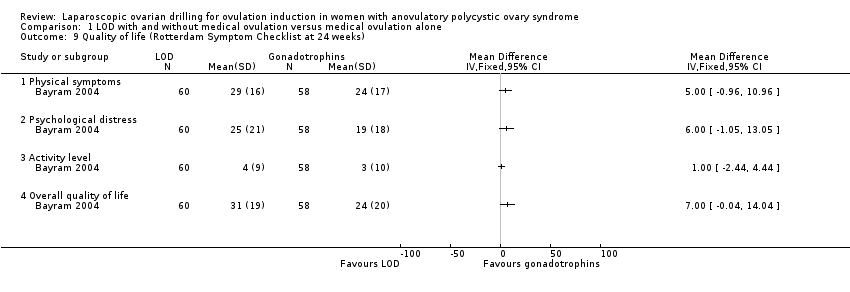
Comparison 1 LOD with and without medical ovulation versus medical ovulation alone, Outcome 9 Quality of life (Rotterdam Symptom Checklist at 24 weeks).
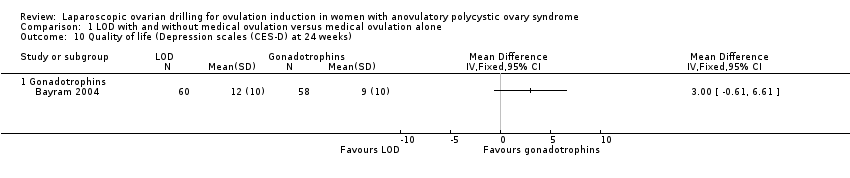
Comparison 1 LOD with and without medical ovulation versus medical ovulation alone, Outcome 10 Quality of life (Depression scales (CES‐D) at 24 weeks).

Comparison 1 LOD with and without medical ovulation versus medical ovulation alone, Outcome 11 Multiple pregnancy per pregnancy.
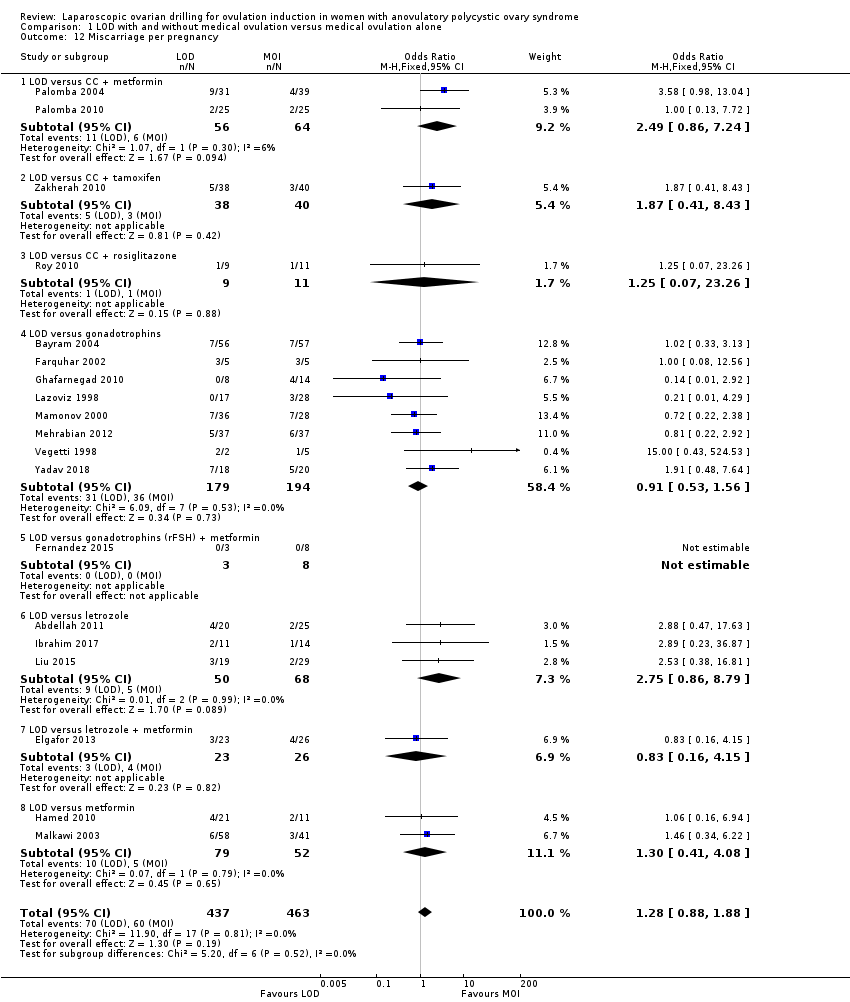
Comparison 1 LOD with and without medical ovulation versus medical ovulation alone, Outcome 12 Miscarriage per pregnancy.
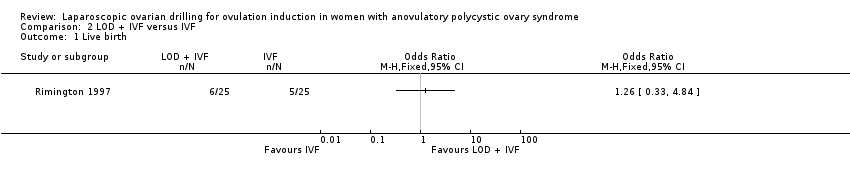
Comparison 2 LOD + IVF versus IVF, Outcome 1 Live birth.

Comparison 2 LOD + IVF versus IVF, Outcome 2 Multiple pregnancy.

Comparison 2 LOD + IVF versus IVF, Outcome 3 Clinical pregnancy.

Comparison 2 LOD + IVF versus IVF, Outcome 4 Miscarriage.
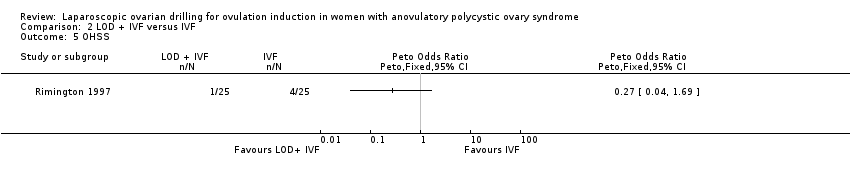
Comparison 2 LOD + IVF versus IVF, Outcome 5 OHSS.

Comparison 2 LOD + IVF versus IVF, Outcome 6 Multiple pregnancy per pregnancy.
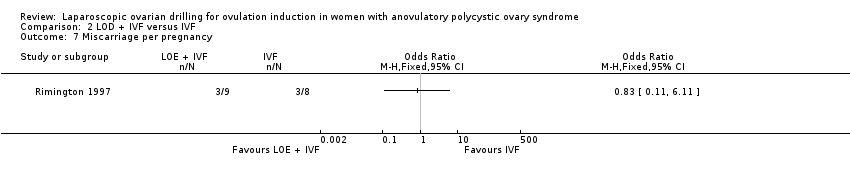
Comparison 2 LOD + IVF versus IVF, Outcome 7 Miscarriage per pregnancy.

Comparison 3 LOD + second‐look laparoscopy versus LOD + expectant management, Outcome 1 Clinical pregnancy.
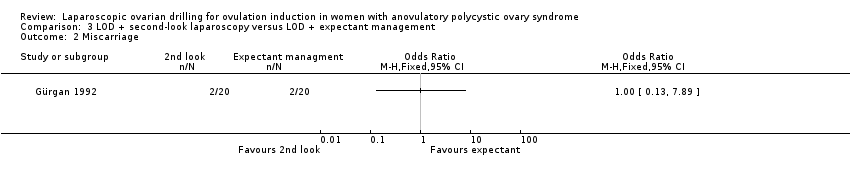
Comparison 3 LOD + second‐look laparoscopy versus LOD + expectant management, Outcome 2 Miscarriage.

Comparison 3 LOD + second‐look laparoscopy versus LOD + expectant management, Outcome 3 Ovulation.

Comparison 3 LOD + second‐look laparoscopy versus LOD + expectant management, Outcome 4 Miscarriage per pregnancy.

Comparison 4 Unilateral versus bilateral, Outcome 1 Live birth.

Comparison 4 Unilateral versus bilateral, Outcome 2 Clinical pregnancy.
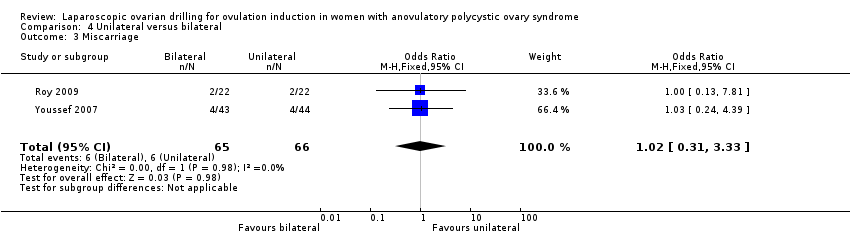
Comparison 4 Unilateral versus bilateral, Outcome 3 Miscarriage.
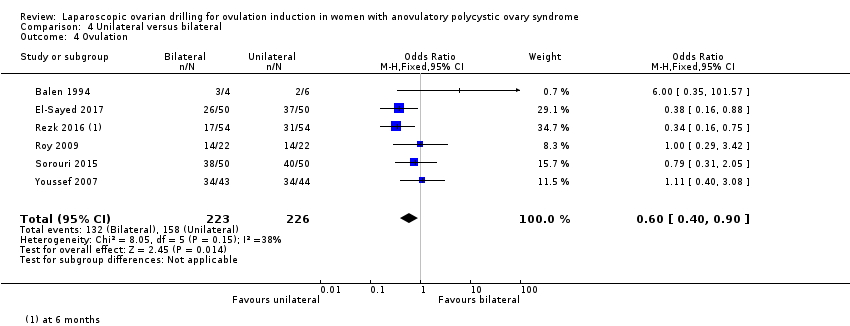
Comparison 4 Unilateral versus bilateral, Outcome 4 Ovulation.
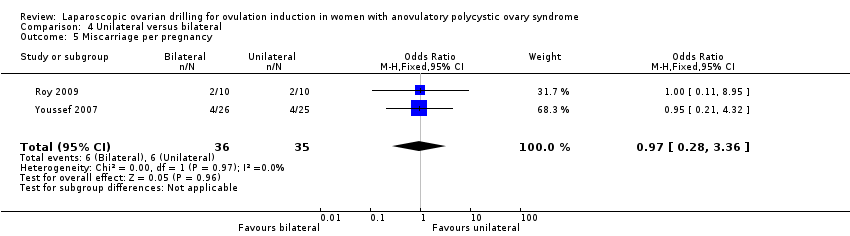
Comparison 4 Unilateral versus bilateral, Outcome 5 Miscarriage per pregnancy.

Comparison 5 Monopolar versus bipolar, Outcome 1 Clinical pregnancy.

Comparison 5 Monopolar versus bipolar, Outcome 2 Ovulation.

Comparison 6 Adjusted thermal dose versus fixed thermal dose, Outcome 1 Clinical pregnancy.

Comparison 6 Adjusted thermal dose versus fixed thermal dose, Outcome 2 Miscarriage.

Comparison 6 Adjusted thermal dose versus fixed thermal dose, Outcome 3 Ovulation.
Comparison 7 Sensitivity analysis low risk of bias: LOD with and without medical ovulation versus medical ovulation alone, Outcome 1 Live birth.

Comparison 7 Sensitivity analysis low risk of bias: LOD with and without medical ovulation versus medical ovulation alone, Outcome 2 Multiple pregnancy.
| Laparoscopic ovarian drilling with and without medical ovulation compared to medical ovulation induction alone | ||||||
| Patient or population: women with anovulatory PCOS and CC resistance | ||||||
| Outcomes | Anticipated absolute effects* (95% CI) | Relative effect | № of participants | Certainty of the evidence | Comments | |
| Risk with medical ovulation induction alone | Risk with LOD ±medical ovulation | |||||
| Live birth | 418 per 1000 | 338 per 1000 | OR 0.71 | 1015 | ⊕⊕⊝⊝ | |
| Live birth (sensitivity analysis) | 439 per 1000 | 413 per 1000 (316 to 516) | OR 0.90 (0.59 to 1.36) | 415 (4 RCTs) | ⊕⊕⊝⊝ | |
| Multiple pregnancy | 50 per 1000 | 18 per 1000 | Peto OR 0.34 | 1161 | ⊕⊕⊕⊝ | |
| Clincial pregnancy | 460 per 1000 | 423 per 1000 | OR 0.86 | 2016 | ⊕⊕⊝⊝ | |
| Miscarriage | 64 per 1000 | 71 per 1000 | Peto OR 1.11 | 1909 | ⊕⊕⊝⊝ | |
| OHSS | 23 per 1000 | 6 per 1000 | Peto OR 0.25 | 722 | ⊕⊕⊝⊝ | |
| *The risk in the intervention group (and its 95% confidence interval) is based on the assumed risk in the comparison group and the relative effect of the intervention (and its 95% CI). | ||||||
| GRADE Working Group grades of evidence | ||||||
| aDowngraded by two levels for very serious risk of bias; inadequate randomisation or allocation concealment and no evidence of blinding. bDowngraded by one level for serious risk of bias; no evidence of blinding. cDowngraded by one level for serious imprecision. | ||||||
| LOD of one ovary (unilateral) versus LOD of both ovaries (bilateral) | ||||||
| Patient or population: women with anovulatory PCOS and CC resistance | ||||||
| Outcomes | Anticipated absolute effects* (95% CI) | Relative effect | № of participants | Certainty of the evidence | Comments | |
| Risk with Bilateral | Risk with Unilateral | |||||
| Live birth | 409 per 1000 | 365 per 1000 | OR 0.83 | 44 | ⊕⊝⊝⊝ | ‐ |
| Multiple pregnancy | ‐ | ‐ | ‐ | ‐ | ‐ | No data were reported for this outcome. |
| Clinical pregnancy | 464 per 1000 | 331 per 1000 | OR 0.57 | 470 | ⊕⊕⊝⊝ | ‐ |
| Miscarriage | 91 per 1000 | 93 per 1000 | Peto OR 1.02 | 131 | ⊕⊝⊝⊝ | ‐ |
| OHSS | ‐ | ‐ | ‐ | ‐ | ‐ | No data were reported for this outcome. |
| *The risk in the intervention group (and its 95% confidence interval) is based on the assumed risk in the comparison group and the relative effect of the intervention (and its 95% CI). | ||||||
| GRADE Working Group grades of evidence | ||||||
| aDowngraded by two levels for very serious risk of bias; inadequate randomisation or allocation concealment and no evidence of blinding. bDowngraded by one level for serious imprecision. | ||||||
| Study | LOD ± CC | Other treatment | P value |
| EUR 1050 | Metformin ± CC EUR 50 | < 0.05 | |
| Total cost per patient NZD 2953 Chance of pregnancy 28% Cost per pregnancy NZD 10,938 Chance of live birth 14% Cost per live birth NZD 21,095 | Gonadotrophin Total cost per woman NZD 5461 Chance of pregnancy 33% Cost per pregnancy NZD 16,549 Chance of live birth 19% Cost per live birth NZD 28,744 | NS NS |
| Outcome or subgroup title | No. of studies | No. of participants | Statistical method | Effect size |
| 1 Live birth Show forest plot | 9 | 1015 | Odds Ratio (M‐H, Fixed, 95% CI) | 0.71 [0.54, 0.92] |
| 1.1 LOD versus CC + metformin | 2 | 170 | Odds Ratio (M‐H, Fixed, 95% CI) | 0.59 [0.32, 1.09] |
| 1.2 LOD versus CC + tamoxifen | 1 | 150 | Odds Ratio (M‐H, Fixed, 95% CI) | 0.81 [0.42, 1.53] |
| 1.3 LOD versus gonadotrophins | 4 | 407 | Odds Ratio (M‐H, Fixed, 95% CI) | 0.87 [0.56, 1.36] |
| 1.4 LOD versus letrozole | 2 | 288 | Odds Ratio (M‐H, Fixed, 95% CI) | 0.55 [0.32, 0.92] |
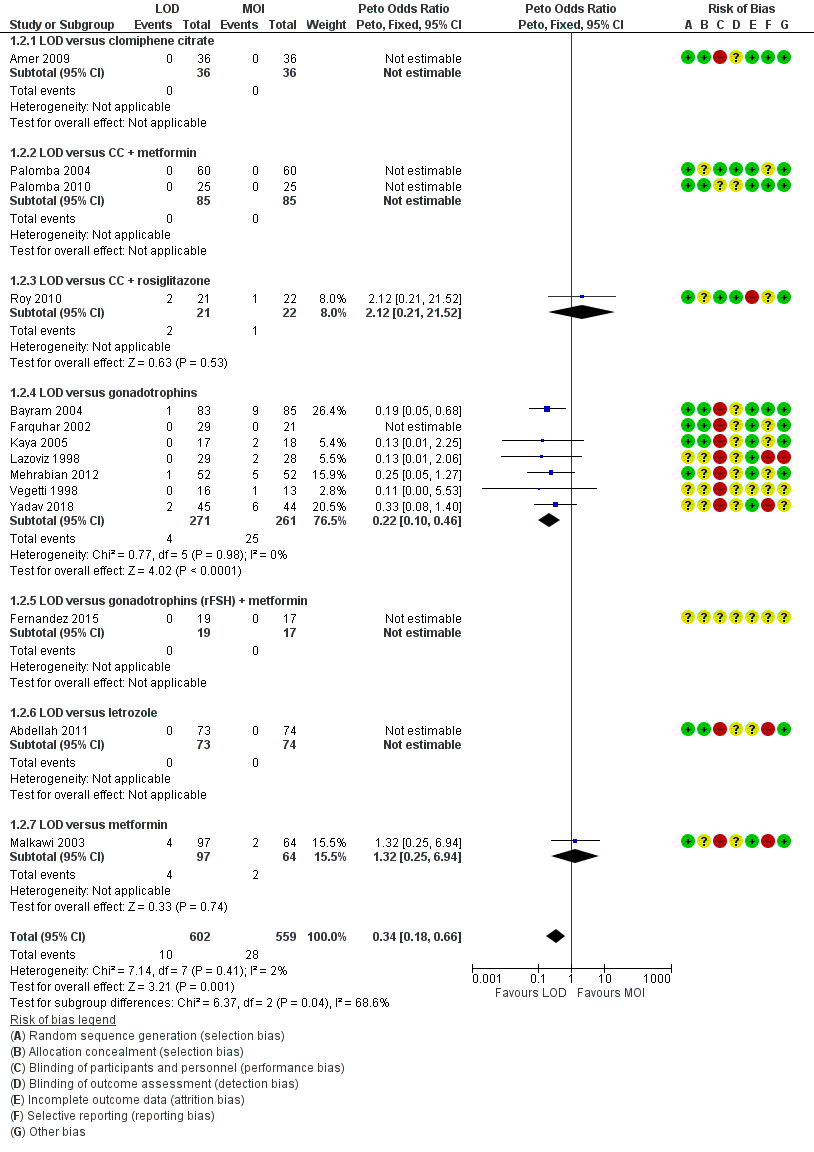
| 2 Multiple pregnancy Show forest plot | 14 | 1161 | Peto Odds Ratio (Peto, Fixed, 95% CI) | 0.34 [0.18, 0.66] |
| 2.1 LOD versus clomiphene citrate | 1 | 72 | Peto Odds Ratio (Peto, Fixed, 95% CI) | 0.0 [0.0, 0.0] |
| 2.2 LOD versus CC + metformin | 2 | 170 | Peto Odds Ratio (Peto, Fixed, 95% CI) | 0.0 [0.0, 0.0] |
| 2.3 LOD versus CC + rosiglitazone | 1 | 43 | Peto Odds Ratio (Peto, Fixed, 95% CI) | 2.12 [0.21, 21.52] |
| 2.4 LOD versus gonadotrophins | 7 | 532 | Peto Odds Ratio (Peto, Fixed, 95% CI) | 0.22 [0.10, 0.46] |
| 2.5 LOD versus gonadotrophins (rFSH) + metformin | 1 | 36 | Peto Odds Ratio (Peto, Fixed, 95% CI) | 0.0 [0.0, 0.0] |
| 2.6 LOD versus letrozole | 1 | 147 | Peto Odds Ratio (Peto, Fixed, 95% CI) | 0.0 [0.0, 0.0] |
| 2.7 LOD versus metformin | 1 | 161 | Peto Odds Ratio (Peto, Fixed, 95% CI) | 1.32 [0.25, 6.94] |
| 3 Clinical pregnancy Show forest plot | 21 | 2016 | Odds Ratio (M‐H, Fixed, 95% CI) | 0.86 [0.72, 1.03] |
| 3.1 LOD versus clomiphene citrate | 1 | 72 | Odds Ratio (M‐H, Fixed, 95% CI) | 0.52 [0.19, 1.44] |
| 3.2 LOD versus CC + metformin | 2 | 170 | Odds Ratio (M‐H, Fixed, 95% CI) | 0.71 [0.39, 1.31] |
| 3.3 LOD versus CC + tamoxifen | 1 | 150 | Odds Ratio (M‐H, Fixed, 95% CI) | 0.90 [0.47, 1.71] |
| 3.4 LOD versus CC + rosiglitazone | 1 | 43 | Odds Ratio (M‐H, Fixed, 95% CI) | 0.75 [0.23, 2.50] |
| 3.5 LOD versus gonadotrophins | 9 | 760 | Odds Ratio (M‐H, Fixed, 95% CI) | 1.01 [0.74, 1.36] |
| 3.6 LOD versus gonadotrophins (rFSH) + metformin | 1 | 36 | Odds Ratio (M‐H, Fixed, 95% CI) | 0.21 [0.04, 1.00] |
| 3.7 LOD versus letrozole | 3 | 368 | Odds Ratio (M‐H, Fixed, 95% CI) | 0.65 [0.42, 1.01] |
| 3.8 LOD versus letrozole + metformin | 1 | 146 | Odds Ratio (M‐H, Fixed, 95% CI) | 0.83 [0.42, 1.65] |
| 3.9 LOD versus metformin | 2 | 271 | Odds Ratio (M‐H, Fixed, 95% CI) | 1.25 [0.75, 2.08] |
| 4 Miscarriage Show forest plot | 19 | 1909 | Odds Ratio (M‐H, Fixed, 95% CI) | 1.11 [0.78, 1.59] |
| 4.1 LOD versus CC + metformin | 2 | 170 | Odds Ratio (M‐H, Fixed, 95% CI) | 1.95 [0.69, 5.54] |
| 4.2 LOD versus CC + tamoxifen | 1 | 150 | Odds Ratio (M‐H, Fixed, 95% CI) | 1.71 [0.39, 7.45] |
| 4.3 LOD versus CC + rosiglitazone | 1 | 43 | Odds Ratio (M‐H, Fixed, 95% CI) | 1.05 [0.06, 17.95] |
| 4.4 LOD versus gonadotrophins | 8 | 725 | Odds Ratio (M‐H, Fixed, 95% CI) | 0.80 [0.49, 1.33] |
| 4.5 LOD versus gonadotrophins (rFSH) + metformin | 1 | 36 | Odds Ratio (M‐H, Fixed, 95% CI) | 0.0 [0.0, 0.0] |
| 4.6 LOD versus letrozole | 3 | 368 | Odds Ratio (M‐H, Fixed, 95% CI) | 1.86 [0.61, 5.67] |
| 4.7 LOD versus letrozole + metformin | 1 | 146 | Odds Ratio (M‐H, Fixed, 95% CI) | 0.74 [0.16, 3.43] |
| 4.8 LOD versus metformin | 2 | 271 | Odds Ratio (M‐H, Fixed, 95% CI) | 1.60 [0.53, 4.82] |
| 5 OHSS Show forest plot | 8 | 722 | Peto Odds Ratio (Peto, Fixed, 95% CI) | 0.25 [0.07, 0.91] |
| 5.1 LOD versus clomiphene citrate | 1 | 72 | Peto Odds Ratio (Peto, Fixed, 95% CI) | 0.14 [0.00, 6.82] |
| 5.2 LOD versus CC + metformin | 0 | 0 | Peto Odds Ratio (Peto, Fixed, 95% CI) | 0.0 [0.0, 0.0] |
| 5.3 LOD versus CC + rosiglitazone | 1 | 43 | Peto Odds Ratio (Peto, Fixed, 95% CI) | 0.0 [0.0, 0.0] |
| 5.4 LOD versus gonadotrophins | 5 | 446 | Peto Odds Ratio (Peto, Fixed, 95% CI) | 0.12 [0.02, 0.64] |
| 5.5 LOD versus letrozole | 0 | 0 | Peto Odds Ratio (Peto, Fixed, 95% CI) | 0.0 [0.0, 0.0] |
| 5.6 LOD versus metformin | 1 | 161 | Peto Odds Ratio (Peto, Fixed, 95% CI) | 1.31 [0.13, 13.44] |
| 6 Ovulation Show forest plot | 10 | 951 | Odds Ratio (M‐H, Fixed, 95% CI) | 0.96 [0.73, 1.28] |
| 6.1 LOD versus clomiphene citrate | 1 | 72 | Odds Ratio (M‐H, Fixed, 95% CI) | 0.7 [0.27, 1.83] |
| 6.2 LOD versus CC + metformin | 1 | 50 | Odds Ratio (M‐H, Fixed, 95% CI) | 1.0 [0.32, 3.10] |
| 6.3 LOD versus CC + tamoxifen | 1 | 150 | Odds Ratio (M‐H, Fixed, 95% CI) | 1.34 [0.56, 3.17] |
| 6.4 LOD versus CC + rosiglitazone | 1 | 43 | Odds Ratio (M‐H, Fixed, 95% CI) | 0.67 [0.13, 3.44] |
| 6.5 LOD versus gonadotrophins | 2 | 139 | Odds Ratio (M‐H, Fixed, 95% CI) | 0.66 [0.32, 1.36] |
| 6.6 LOD versus letrozole | 1 | 80 | Odds Ratio (M‐H, Fixed, 95% CI) | 0.58 [0.23, 1.46] |
| 6.7 LOD versus letrozole + metformin | 1 | 146 | Odds Ratio (M‐H, Fixed, 95% CI) | 0.95 [0.49, 1.81] |
| 6.8 LOD versus metformin | 2 | 271 | Odds Ratio (M‐H, Fixed, 95% CI) | 1.52 [0.86, 2.68] |
| 7 Costs Show forest plot | 3 | Mean Difference (IV, Fixed, 95% CI) | Subtotals only | |
| 7.1 LOD versus CC + metformin | 1 | 50 | Mean Difference (IV, Fixed, 95% CI) | 3711.3 [3585.17, 3837.43] |
| 7.2 LOD versus gonadotrophins only (short‐term) | 2 | 203 | Mean Difference (IV, Fixed, 95% CI) | ‐1115.75 [‐1309.72, ‐921.77] |
| 7.3 LOD versus gonadotrophins only (long‐term) | 1 | 168 | Mean Difference (IV, Fixed, 95% CI) | ‐2235.0 [‐4433.16, ‐36.84] |
| 8 Quality of Life (Health related quality of life: SF‐36) Show forest plot | 1 | Mean Difference (IV, Fixed, 95% CI) | Totals not selected | |
| 8.1 Physical functioning at 24 weeks | 1 | Mean Difference (IV, Fixed, 95% CI) | 0.0 [0.0, 0.0] | |
| 8.2 Social functioning at 24 weeks | 1 | Mean Difference (IV, Fixed, 95% CI) | 0.0 [0.0, 0.0] | |
| 8.3 Role limitations (physical) at 24 weeks | 1 | Mean Difference (IV, Fixed, 95% CI) | 0.0 [0.0, 0.0] | |
| 8.4 Role limitations (emotional) at 24 weeks | 1 | Mean Difference (IV, Fixed, 95% CI) | 0.0 [0.0, 0.0] | |
| 8.5 Mental health at 24 weeks | 1 | Mean Difference (IV, Fixed, 95% CI) | 0.0 [0.0, 0.0] | |
| 8.6 Vitality at 24 weeks | 1 | Mean Difference (IV, Fixed, 95% CI) | 0.0 [0.0, 0.0] | |
| 8.7 Pain at 24 weeks | 1 | Mean Difference (IV, Fixed, 95% CI) | 0.0 [0.0, 0.0] | |
| 8.8 General health at 24 weeks | 1 | Mean Difference (IV, Fixed, 95% CI) | 0.0 [0.0, 0.0] | |
| 9 Quality of life (Rotterdam Symptom Checklist at 24 weeks) Show forest plot | 1 | Mean Difference (IV, Fixed, 95% CI) | Totals not selected | |
| 9.1 Physical symptoms | 1 | Mean Difference (IV, Fixed, 95% CI) | 0.0 [0.0, 0.0] | |
| 9.2 Psychological distress | 1 | Mean Difference (IV, Fixed, 95% CI) | 0.0 [0.0, 0.0] | |
| 9.3 Activity level | 1 | Mean Difference (IV, Fixed, 95% CI) | 0.0 [0.0, 0.0] | |
| 9.4 Overall quality of life | 1 | Mean Difference (IV, Fixed, 95% CI) | 0.0 [0.0, 0.0] | |
| 10 Quality of life (Depression scales (CES‐D) at 24 weeks) Show forest plot | 1 | Mean Difference (IV, Fixed, 95% CI) | Totals not selected | |
| 10.1 Gonadotrophins | 1 | Mean Difference (IV, Fixed, 95% CI) | 0.0 [0.0, 0.0] | |
| 11 Multiple pregnancy per pregnancy Show forest plot | 14 | 577 | Peto Odds Ratio (Peto, Fixed, 95% CI) | 0.34 [0.17, 0.66] |
| 11.1 LOD versus clomiphene citrate | 1 | 23 | Peto Odds Ratio (Peto, Fixed, 95% CI) | 0.0 [0.0, 0.0] |
| 11.2 LOD versus CC + metformin | 2 | 99 | Peto Odds Ratio (Peto, Fixed, 95% CI) | 0.0 [0.0, 0.0] |
| 11.3 LOD versus CC + rosiglitazone | 1 | 20 | Peto Odds Ratio (Peto, Fixed, 95% CI) | 2.66 [0.24, 29.46] |
| 11.4 LOD versus gonadotrophins | 7 | 280 | Peto Odds Ratio (Peto, Fixed, 95% CI) | 0.20 [0.09, 0.43] |
| 11.5 LOD versus gonadotrophins (rFSH) + metformin | 1 | 11 | Peto Odds Ratio (Peto, Fixed, 95% CI) | 0.0 [0.0, 0.0] |
| 11.6 LOD versus letrozole | 1 | 45 | Peto Odds Ratio (Peto, Fixed, 95% CI) | 0.0 [0.0, 0.0] |
| 11.7 LOD versus metformin | 1 | 99 | Peto Odds Ratio (Peto, Fixed, 95% CI) | 1.42 [0.27, 7.53] |
| 12 Miscarriage per pregnancy Show forest plot | 19 | 900 | Odds Ratio (M‐H, Fixed, 95% CI) | 1.28 [0.88, 1.88] |
| 12.1 LOD versus CC + metformin | 2 | 120 | Odds Ratio (M‐H, Fixed, 95% CI) | 2.49 [0.86, 7.24] |
| 12.2 LOD versus CC + tamoxifen | 1 | 78 | Odds Ratio (M‐H, Fixed, 95% CI) | 1.87 [0.41, 8.43] |
| 12.3 LOD versus CC + rosiglitazone | 1 | 20 | Odds Ratio (M‐H, Fixed, 95% CI) | 1.25 [0.07, 23.26] |
| 12.4 LOD versus gonadotrophins | 8 | 373 | Odds Ratio (M‐H, Fixed, 95% CI) | 0.91 [0.53, 1.56] |
| 12.5 LOD versus gonadotrophins (rFSH) + metformin | 1 | 11 | Odds Ratio (M‐H, Fixed, 95% CI) | 0.0 [0.0, 0.0] |
| 12.6 LOD versus letrozole | 3 | 118 | Odds Ratio (M‐H, Fixed, 95% CI) | 2.75 [0.86, 8.79] |
| 12.7 LOD versus letrozole + metformin | 1 | 49 | Odds Ratio (M‐H, Fixed, 95% CI) | 0.83 [0.16, 4.15] |
| 12.8 LOD versus metformin | 2 | 131 | Odds Ratio (M‐H, Fixed, 95% CI) | 1.30 [0.41, 4.08] |
| Outcome or subgroup title | No. of studies | No. of participants | Statistical method | Effect size |
| 1 Live birth Show forest plot | 1 | Odds Ratio (M‐H, Fixed, 95% CI) | Totals not selected | |
| 2 Multiple pregnancy Show forest plot | 1 | Peto Odds Ratio (Peto, Fixed, 95% CI) | Totals not selected | |
| 3 Clinical pregnancy Show forest plot | 1 | Odds Ratio (M‐H, Fixed, 95% CI) | Totals not selected | |
| 4 Miscarriage Show forest plot | 1 | Odds Ratio (M‐H, Fixed, 95% CI) | Totals not selected | |
| 5 OHSS Show forest plot | 1 | Peto Odds Ratio (Peto, Fixed, 95% CI) | Totals not selected | |
| 6 Multiple pregnancy per pregnancy Show forest plot | 1 | Peto Odds Ratio (Peto, Fixed, 95% CI) | Totals not selected | |
| 7 Miscarriage per pregnancy Show forest plot | 1 | Odds Ratio (M‐H, Fixed, 95% CI) | Totals not selected | |
| Outcome or subgroup title | No. of studies | No. of participants | Statistical method | Effect size |
| 1 Clinical pregnancy Show forest plot | 1 | Odds Ratio (M‐H, Fixed, 95% CI) | Totals not selected | |
| 2 Miscarriage Show forest plot | 1 | Odds Ratio (M‐H, Fixed, 95% CI) | Totals not selected | |
| 3 Ovulation Show forest plot | 1 | Odds Ratio (M‐H, Fixed, 95% CI) | Totals not selected | |
| 4 Miscarriage per pregnancy Show forest plot | 1 | Odds Ratio (M‐H, Fixed, 95% CI) | Totals not selected | |
| Outcome or subgroup title | No. of studies | No. of participants | Statistical method | Effect size |
| 1 Live birth Show forest plot | 1 | Odds Ratio (M‐H, Fixed, 95% CI) | Totals not selected | |
| 2 Clinical pregnancy Show forest plot | 7 | 470 | Odds Ratio (M‐H, Fixed, 95% CI) | 0.57 [0.39, 0.84] |
| 3 Miscarriage Show forest plot | 2 | 131 | Odds Ratio (M‐H, Fixed, 95% CI) | 1.02 [0.31, 3.33] |
| 4 Ovulation Show forest plot | 6 | 449 | Odds Ratio (M‐H, Fixed, 95% CI) | 0.60 [0.40, 0.90] |
| 5 Miscarriage per pregnancy Show forest plot | 2 | 71 | Odds Ratio (M‐H, Fixed, 95% CI) | 0.97 [0.28, 3.36] |
| Outcome or subgroup title | No. of studies | No. of participants | Statistical method | Effect size |
| 1 Clinical pregnancy Show forest plot | 3 | 354 | Odds Ratio (M‐H, Fixed, 95% CI) | 0.94 [0.62, 1.44] |
| 2 Ovulation Show forest plot | 2 | 108 | Odds Ratio (M‐H, Fixed, 95% CI) | 0.33 [0.14, 0.76] |
| Outcome or subgroup title | No. of studies | No. of participants | Statistical method | Effect size |
| 1 Clinical pregnancy Show forest plot | 2 | 195 | Odds Ratio (M‐H, Fixed, 95% CI) | 1.84 [1.04, 3.26] |
| 2 Miscarriage Show forest plot | 1 | Odds Ratio (M‐H, Fixed, 95% CI) | Totals not selected | |
| 3 Ovulation Show forest plot | 2 | 195 | Odds Ratio (M‐H, Fixed, 95% CI) | 1.83 [1.01, 3.33] |
| Outcome or subgroup title | No. of studies | No. of participants | Statistical method | Effect size |
| 1 Live birth Show forest plot | 4 | 415 | Odds Ratio (M‐H, Fixed, 95% CI) | 0.90 [0.59, 1.36] |
| 1.1 LOD versus gonadotrophins | 2 | 218 | Odds Ratio (M‐H, Fixed, 95% CI) | 1.04 [0.59, 1.85] |
| 1.2 LOD versus CC + metformin | 1 | 50 | Odds Ratio (M‐H, Fixed, 95% CI) | 1.17 [0.39, 3.56] |
| 1.3 LOD versus letrozole | 1 | 147 | Odds Ratio (M‐H, Fixed, 95% CI) | 0.62 [0.30, 1.31] |
| 2 Multiple pregnancy Show forest plot | 6 | 522 | Peto Odds Ratio (Peto, Fixed, 95% CI) | 0.18 [0.06, 0.57] |
| 2.1 LOD versus CC + metformin | 1 | 50 | Peto Odds Ratio (Peto, Fixed, 95% CI) | 0.0 [0.0, 0.0] |
| 2.2 LOD versus gonadotrophins | 3 | 253 | Peto Odds Ratio (Peto, Fixed, 95% CI) | 0.18 [0.06, 0.57] |
| 2.3 LOD versus letrozole | 1 | 147 | Peto Odds Ratio (Peto, Fixed, 95% CI) | 0.0 [0.0, 0.0] |
| 2.4 LOD versus clomiphene citrate | 1 | 72 | Peto Odds Ratio (Peto, Fixed, 95% CI) | 0.0 [0.0, 0.0] |