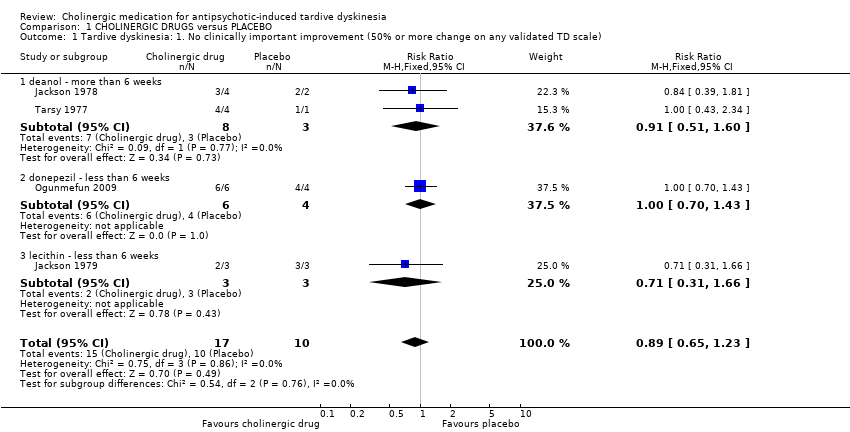
| 1 Tardive dyskinesia: 1. No clinically important improvement (50% or more change on any validated TD scale) Show forest plot | 4 | 27 | Risk Ratio (M‐H, Fixed, 95% CI) | 0.89 [0.65, 1.23] |
|
| 1.1 deanol ‐ more than 6 weeks | 2 | 11 | Risk Ratio (M‐H, Fixed, 95% CI) | 0.91 [0.51, 1.60] |
| 1.2 donepezil ‐ less than 6 weeks | 1 | 10 | Risk Ratio (M‐H, Fixed, 95% CI) | 1.0 [0.70, 1.43] |
| 1.3 lecithin ‐ less than 6 weeks | 1 | 6 | Risk Ratio (M‐H, Fixed, 95% CI) | 0.71 [0.31, 1.66] |
| 2 Tardive dyskinesia: 2a. Not any improvement (as assessed by rater) Show forest plot | 9 | 180 | Risk Ratio (M‐H, Fixed, 95% CI) | 0.87 [0.71, 1.07] |
|
| 2.1 deanol ‐ less than 6 weeks | 3 | 63 | Risk Ratio (M‐H, Fixed, 95% CI) | 0.83 [0.58, 1.18] |
| 2.2 deanol ‐ more than 6 weeks | 2 | 11 | Risk Ratio (M‐H, Fixed, 95% CI) | 0.81 [0.26, 2.57] |
| 2.3 donepezil ‐ less than 6 weeks | 1 | 10 | Risk Ratio (M‐H, Fixed, 95% CI) | 1.33 [0.72, 2.44] |
| 2.4 lecithin ‐ less than 6 weeks | 2 | 36 | Risk Ratio (M‐H, Fixed, 95% CI) | 0.87 [0.63, 1.21] |
| 2.5 meclofenoxate ‐ more than 6 weeks | 1 | 60 | Risk Ratio (M‐H, Fixed, 95% CI) | 0.84 [0.55, 1.27] |
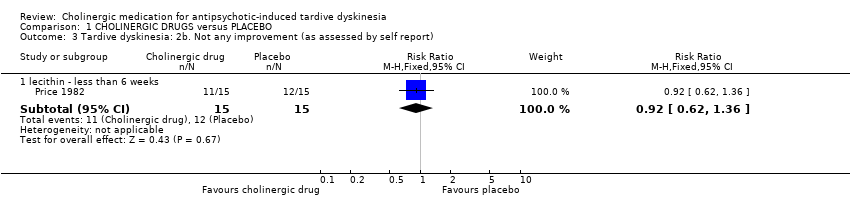
| 3 Tardive dyskinesia: 2b. Not any improvement (as assessed by self report) Show forest plot | 1 | | Risk Ratio (M‐H, Fixed, 95% CI) | Subtotals only |
|
| 3.1 lecithin ‐ less than 6 weeks | 1 | 30 | Risk Ratio (M‐H, Fixed, 95% CI) | 0.92 [0.62, 1.36] |
| 4 Tardive dyskinesia: 3a. Average endpoint score on AIMS (low score = better) Show forest plot | 7 | 171 | Mean Difference (IV, Fixed, 95% CI) | ‐0.12 [‐0.44, 0.21] |
|
| 4.1 deanol ‐ more than 6 weeks | 1 | 6 | Mean Difference (IV, Fixed, 95% CI) | 1.42 [‐0.29, 3.13] |
| 4.2 galantamine ‐ more than 6 weeks | 1 | 35 | Mean Difference (IV, Fixed, 95% CI) | 1.5 [‐0.44, 3.44] |
| 4.3 lecithin ‐ less than 6 weeks | 1 | 6 | Mean Difference (IV, Fixed, 95% CI) | ‐1.07 [‐2.21, 0.07] |
| 4.4 lecithin ‐ more than 6 weeks | 1 | 14 | Mean Difference (IV, Fixed, 95% CI) | ‐0.10 [‐1.04, 0.84] |
| 4.5 meclofenoxate ‐ more than 6 weeks | 1 | 60 | Mean Difference (IV, Fixed, 95% CI) | ‐0.19 [‐0.58, 0.20] |
| 4.6 rivastigmine ‐ less than 8 weeks | 1 | 40 | Mean Difference (IV, Fixed, 95% CI) | 2.20 [‐1.16, 5.56] |
| 4.7 donepezil ‐ less than 6 weeks | 1 | 10 | Mean Difference (IV, Fixed, 95% CI) | 1.10 [‐4.22, 6.42] |
| 5 Tardive dyskinesia: 3b. Average endpoint score on modified Simpson TDRS (low score = better) Show forest plot | | | Other data | No numeric data |
|
| 5.1 deanol ‐ more than 6 weeks | | | Other data | No numeric data |
| 6 Tardive dyskinesia: 4a. Deterioration (as assessed by rater) Show forest plot | 8 | 147 | Risk Ratio (M‐H, Fixed, 95% CI) | 1.11 [0.55, 2.24] |
|
| 6.1 deanol ‐ less than 6 weeks | 2 | 30 | Risk Ratio (M‐H, Fixed, 95% CI) | 1.67 [0.48, 5.76] |
| 6.2 deanol ‐ more than 6 weeks | 2 | 11 | Risk Ratio (M‐H, Fixed, 95% CI) | 0.67 [0.20, 2.18] |
| 6.3 donepezil ‐ less than 6 weeks | 1 | 10 | Risk Ratio (M‐H, Fixed, 95% CI) | 0.67 [0.06, 7.85] |
| 6.4 lecithin ‐ less than 6 weeks | 2 | 36 | Risk Ratio (M‐H, Fixed, 95% CI) | 1.0 [0.16, 6.31] |
| 6.5 meclofenoxate ‐ more than 6 weeks | 1 | 60 | Risk Ratio (M‐H, Fixed, 95% CI) | 1.87 [0.18, 19.55] |
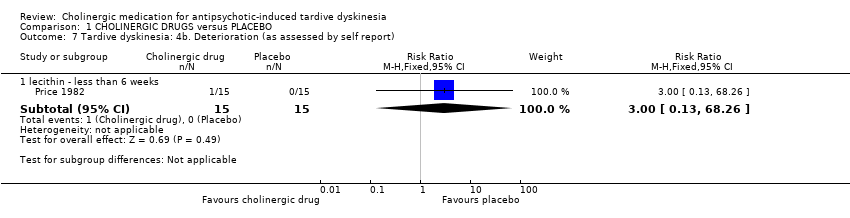
| 7 Tardive dyskinesia: 4b. Deterioration (as assessed by self report) Show forest plot | 1 | | Risk Ratio (M‐H, Fixed, 95% CI) | Subtotals only |
|
| 7.1 lecithin ‐ less than 6 weeks | 1 | 30 | Risk Ratio (M‐H, Fixed, 95% CI) | 3.0 [0.13, 68.26] |
| 8 Global outcome: Death for any reason Show forest plot | 11 | 278 | Risk Ratio (M‐H, Fixed, 95% CI) | 0.0 [0.0, 0.0] |
|
| 8.1 deanol ‐ less than 6 weeks | 4 | 83 | Risk Ratio (M‐H, Fixed, 95% CI) | 0.0 [0.0, 0.0] |
| 8.2 deanol ‐ more than 6 weeks | 2 | 11 | Risk Ratio (M‐H, Fixed, 95% CI) | 0.0 [0.0, 0.0] |
| 8.3 galantamine ‐ more than 6 weeks | 1 | 38 | Risk Ratio (M‐H, Fixed, 95% CI) | 0.0 [0.0, 0.0] |
| 8.4 lecithin ‐ less than 6 weeks | 3 | 86 | Risk Ratio (M‐H, Fixed, 95% CI) | 0.0 [0.0, 0.0] |
| 8.5 meclofenoxate ‐ more than 6 weeks | 1 | 60 | Risk Ratio (M‐H, Fixed, 95% CI) | 0.0 [0.0, 0.0] |
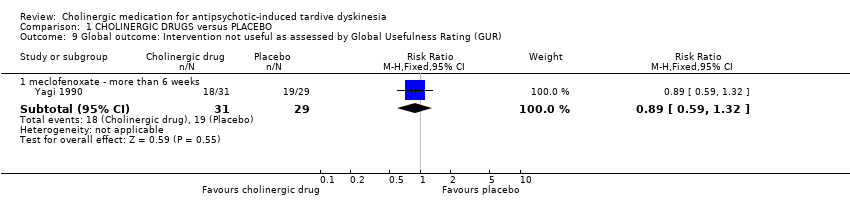
| 9 Global outcome: Intervention not useful as assessed by Global Usefulness Rating (GUR) Show forest plot | 1 | | Risk Ratio (M‐H, Fixed, 95% CI) | Subtotals only |
|
| 9.1 meclofenoxate ‐ more than 6 weeks | 1 | 60 | Risk Ratio (M‐H, Fixed, 95% CI) | 0.89 [0.59, 1.32] |
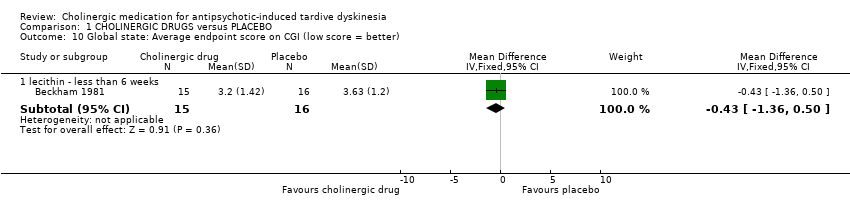
| 10 Global state: Average endpoint score on CGI (low score = better) Show forest plot | 1 | | Mean Difference (IV, Fixed, 95% CI) | Subtotals only |
|
| 10.1 lecithin ‐ less than 6 weeks | 1 | 31 | Mean Difference (IV, Fixed, 95% CI) | ‐0.43 [‐1.36, 0.50] |
| 11 Mental state: Deterioration Show forest plot | 5 | 77 | Risk Ratio (M‐H, Fixed, 95% CI) | 0.5 [0.10, 2.61] |
|
| 11.1 deanol ‐ less than 6 weeks | 1 | 10 | Risk Ratio (M‐H, Fixed, 95% CI) | 0.33 [0.02, 6.65] |
| 11.2 deanol ‐ more than 6 weeks | 2 | 11 | Risk Ratio (M‐H, Fixed, 95% CI) | 1.2 [0.08, 18.75] |
| 11.3 lecithin ‐ less than 6 weeks | 2 | 56 | Risk Ratio (M‐H, Fixed, 95% CI) | 0.33 [0.01, 7.81] |
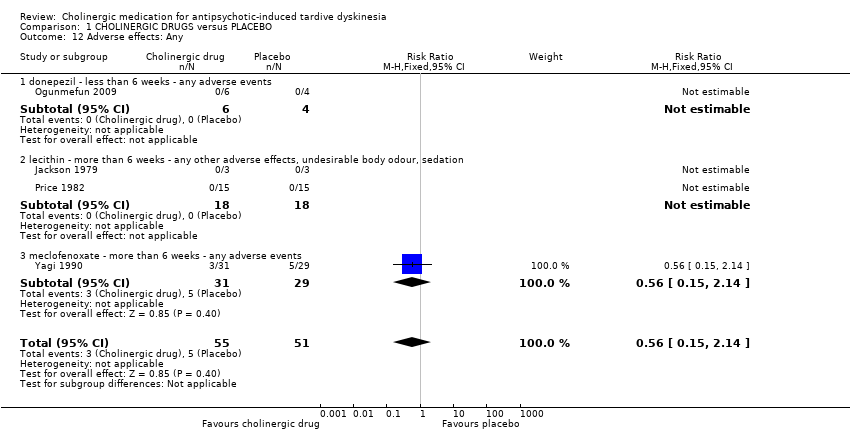
| 12 Adverse effects: Any Show forest plot | 4 | 106 | Risk Ratio (M‐H, Fixed, 95% CI) | 0.56 [0.15, 2.14] |
|
| 12.1 donepezil ‐ less than 6 weeks ‐ any adverse events | 1 | 10 | Risk Ratio (M‐H, Fixed, 95% CI) | 0.0 [0.0, 0.0] |
| 12.2 lecithin ‐ more than 6 weeks ‐ any other adverse effects, undesirable body odour, sedation | 2 | 36 | Risk Ratio (M‐H, Fixed, 95% CI) | 0.0 [0.0, 0.0] |
| 12.3 meclofenoxate ‐ more than 6 weeks ‐ any adverse events | 1 | 60 | Risk Ratio (M‐H, Fixed, 95% CI) | 0.56 [0.15, 2.14] |
| 13 Adverse effects: Various specific Show forest plot | 8 | | Risk Ratio (M‐H, Fixed, 95% CI) | Subtotals only |
|
| 13.1 deanol ‐ less than 6 weeks ‐ gastric adverse effects | 5 | 61 | Risk Ratio (M‐H, Fixed, 95% CI) | 9.0 [0.55, 147.95] |
| 13.2 deanol ‐ less than 6 weeks ‐ sedation, periferal cholinergic effects, undesirable body odour | 6 | 94 | Risk Ratio (M‐H, Fixed, 95% CI) | 6.83 [0.99, 47.25] |
| 13.3 lecithin ‐ less than 6 weeks ‐ GI adverse effects | 2 | 36 | Risk Ratio (M‐H, Fixed, 95% CI) | 0.0 [0.0, 0.0] |
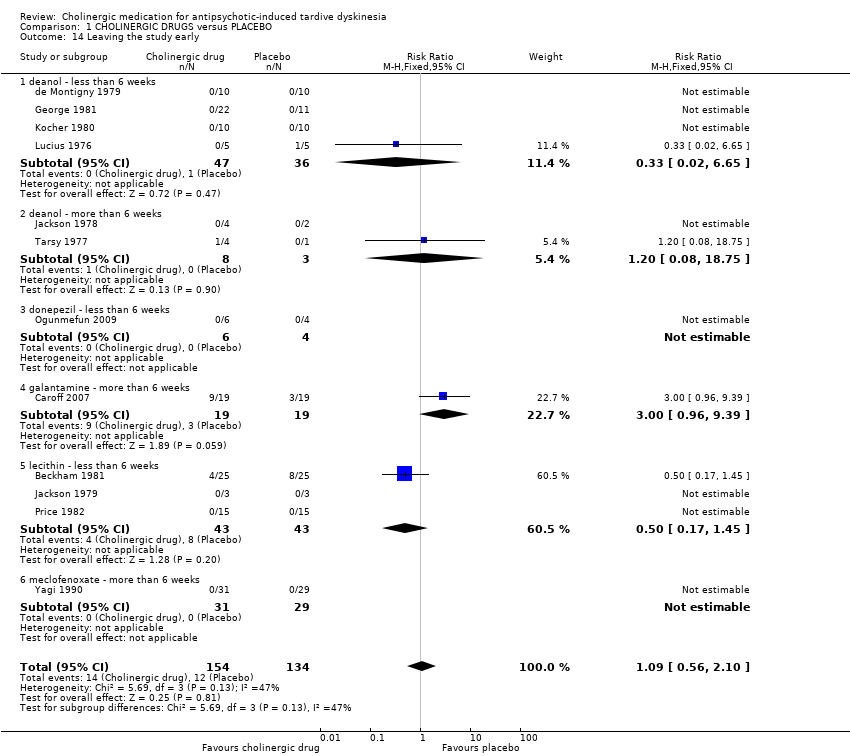
| 14 Leaving the study early Show forest plot | 12 | 288 | Risk Ratio (M‐H, Fixed, 95% CI) | 1.09 [0.56, 2.10] |
|
| 14.1 deanol ‐ less than 6 weeks | 4 | 83 | Risk Ratio (M‐H, Fixed, 95% CI) | 0.33 [0.02, 6.65] |
| 14.2 deanol ‐ more than 6 weeks | 2 | 11 | Risk Ratio (M‐H, Fixed, 95% CI) | 1.2 [0.08, 18.75] |
| 14.3 donepezil ‐ less than 6 weeks | 1 | 10 | Risk Ratio (M‐H, Fixed, 95% CI) | 0.0 [0.0, 0.0] |
| 14.4 galantamine ‐ more than 6 weeks | 1 | 38 | Risk Ratio (M‐H, Fixed, 95% CI) | 3.0 [0.96, 9.39] |
| 14.5 lecithin ‐ less than 6 weeks | 3 | 86 | Risk Ratio (M‐H, Fixed, 95% CI) | 0.5 [0.17, 1.45] |
| 14.6 meclofenoxate ‐ more than 6 weeks | 1 | 60 | Risk Ratio (M‐H, Fixed, 95% CI) | 0.0 [0.0, 0.0] |