Acetyl‐L‐carnitine for patients with hepatic encephalopathy
Abstract
Background
Hepatic encephalopathy is a common and devastating neuropsychiatric complication of acute liver failure or chronic liver disease. Ammonia content in the blood seems to play a role in the development of hepatic encephalopathy. Treatment for hepatic encephalopathy is complex. Acetyl‐L‐carnitine is a substance that may reduce ammonia toxicity. This review assessed the benefits and harms of acetyl‐L‐carnitine for patients with hepatic encephalopathy.
Objectives
To assess the benefits and harms of acetyl‐L‐carnitine for patients with hepatic encephalopathy.
Search methods
We searched the Cochrane Hepato‐Biliary Group Controlled Trials Register, CENTRAL, MEDLINE Ovid, Embase Ovid, LILACS, and Science Citation Index Expanded for randomised clinical trials. We sought additional randomised clinical trials from the World Health Organization Clinical Trials Search Portal and ClinicalTrials.gov. We performed all electronic searches until 10 September 2018. We looked through the reference lists of retrieved publications and review articles, and we searched the FDA and EMA websites.
Selection criteria
We searched for randomised clinical trials in any setting, recruiting people with hepatic encephalopathy. Trials were eligible for inclusion if they compared acetyl‐L‐carnitine plus standard care (e.g. antibiotics, lactulose) versus placebo or no acetyl‐L‐carnitine plus standard care. We are well aware that by selecting randomised clinical trials, we placed greater focus on potential benefits than on potential harms.
Data collection and analysis
We selected randomised clinical trials, assessed risk of bias in eight domains, and extracted data in a duplicate and independent fashion. We estimated risk ratios (RRs) for dichotomous outcomes and mean differences (MDs) for continuous outcomes. We measured statistical heterogeneity using I² and D² statistics. We subjected our analyses to fixed‐effect and random‐effects model meta‐analyses. We assessed bias risk domains to control systematic errors. We assessed overall quality of the data for each individual outcome by using the GRADE approach.
Main results
We identified five randomised clinical trials involving 398 participants. All trials included only participants with cirrhosis as the underlying cause of hepatic encephalopathy. Trials included participants with covert or overt hepatic encephalopathy. All trials were conducted in Italy by a single team and assessed acetyl‐L‐carnitine compared with placebo. Oral intervention was the most frequent route of administration. All trials were at high risk of bias and were underpowered. None of the trials were sponsored by the pharmaceutical industry.
None of the identified trials reported information on all‐cause mortality, serious adverse events, or days of hospitalisation. Only one trial assessed quality of life using the Short Form (SF)‐36 scale (67 participants; very low‐quality evidence). The effects of acetyl‐L‐carnitine compared with placebo on general health at 90 days are uncertain (MD ‐6.20 points, 95% confidence interval (CI) ‐9.51 to ‐2.89). Results for additional domains of the SF‐36 are also uncertain. One trial assessed fatigue using the Wessely and Powell test (121 participants; very low‐quality evidence). The effects are uncertain in people with moderate‐grade hepatic encephalopathy (mental fatigue: MD 0.40 points, 95% CI ‐0.21 to 1.01; physical fatigue: MD ‐0.20 points, 95% CI ‐0.92 to 0.52) and mild‐grade hepatic encephalopathy (mental fatigue: ‐0.80 points, 95% CI ‐1.48 to ‐0.12; physical fatigue: 0.20 points, 95% CI ‐0.72 to 1.12). Meta‐analysis showed a reduction in blood ammonium levels favouring acetyl‐L‐carnitine versus placebo (MD ‐13.06 mg/dL, 95% CI ‐17.24 to ‐8.99; 387 participants; 5 trials; very low‐quality evidence). It is unclear whether acetyl‐L‐carnitine versus placebo increases the risk of non‐serious adverse events (8/126 (6.34%) vs 3/120 (2.50%); RR 2.51, 95% CI 0.68 to 9.22; 2 trials; very low‐quality evidence). Overall, adverse events data were poorly reported and harms may have been underestimated.
Authors' conclusions
This Cochrane systematic review analysed a heterogeneous group of five trials at high risk of bias and with high risk of random errors conducted by only one research team. We assessed acetyl‐L‐carnitine versus placebo in participants with cirrhosis with covert or overt hepatic encephalopathy. Hence, we have no data on the drug for hepatic encephalopathy in acute liver failure. We found no information about all‐cause mortality, serious adverse events, or days of hospitalisation. We found no clear differences in effect between acetyl‐L‐carnitine and placebo regarding quality of life, fatigue, and non‐serious adverse events. Acetyl‐L‐carnitine reduces blood ammonium levels compared with placebo. We rated all evidence as of very low quality due to pitfalls in design and execution, inconsistency, small sample sizes, and very few events. The harms profile for acetyl‐L‐carnitine is presently unclear. Accordingly, we need further randomised clinical trials to assess acetyl‐L‐carnitine versus placebo conducted according to the SPIRIT statements and reported according to the CONSORT statements.
PICOs
Plain language summary
Acetyl‐L‐carnitine for patients with hepatic encephalopathy
What is hepatic encephalopathy?
Hepatic encephalopathy is a common and devastating neuropsychiatric complication of acute liver failure or chronic liver disease. The liver in people with hepatic encephalopathy cannot clear the portal venous blood (the big pipeline that leads blood from the small intestine into the liver). Due to this, blood ammonium levels and levels of other toxic substances are increased, which leads to brain damage. Hepatic encephalopathy is associated with significantly increased mortality among patients with liver disease, including those awaiting liver transplantation.
What is acetyl‐L‐carnitine?
Acetyl‐L‐carnitine is a substance that reduces blood and brain ammonium levels and may act as a brain‐protective agent.
The purpose of this review
This Cochrane systematic review assessed the benefits and harms of treating people with hepatic encephalopathy with acetyl‐L‐carnitine in addition to providing standard care (lactulose, antibiotics, etc.) compared with placebo or no acetyl‐L‐carnitine intervention in addition to standard care.
Findings of this review
Review authors searched the medical literature up to 10 September 2018, and identified five relevant randomised clinical trials, including a total of 398 participants. All trials were performed in Italy by only one team of investigators. All were considered at high risk of bias and included small numbers of participants, which makes potential overestimation of benefits and underestimation of harms likely. The pharmaceutical industry did not sponsor any trial. Trials tested acetyl‐L‐carnitine given orally or intravenously versus placebo. The drug did not seem to have effects on quality of life, fatigue, or non‐serious adverse events when compared with placebo (inactive sham drug).
Shortcomings of the trials included in this review
None of the included trials reported data on participants’ all‐cause mortality, serious adverse events, or days of hospitalisation. Researchers poorly reported harms caused by acetyl‐L‐carnitine, so the harms profile remains unclear. Risks of bias, imprecision, and outcome reporting bias all make the certainty of evidence low or very low. A reduction in blood ammonium levels favoured participants receiving acetyl‐L‐carnitine, but study authors observed no clinical benefits.
It is clear that additional randomised clinical trials are required to assess the benefits and harms of acetyl‐L‐carnitine compared with placebo in the treatment of people with hepatic encephalopathy. These trials should be well designed, conducted by independent researchers, and collaborative, and should include large numbers of participants.
Authors' conclusions
Summary of findings
| Acetyl‐L‐carnitine compared with placebo for patients with hepatic encephalopathy | ||||||
| Patient or population: patients with covert or overt hepatic encephalopathy | ||||||
| Outcomes | Illustrative comparative risks* (95% CI) | Relative effect | No. of participants | Quality of the evidence | Comments | |
| Assumed risk | Corresponding risk | |||||
| Placebo | Acetyl‐L‐carnitine | |||||
| All‐cause mortality | See comment | See comment | Not estimable | 0 | See comment | No trial reported this outcome |
| Quality of life (general health at 90 days) | Mean quality of life in the control groups was | Mean quality of life in the intervention groups was | ‐ | 67 | ⊕⊝⊝⊝ |
|
| Serious adverse events | See comment | See comment | Not estimable | 0 | See comment | No trial reported this outcome |
| Fatigue Scale from 0 to 10 Physical fatigue Wessely and Powell test from 0 (no fatigue) to 16 (highest possible fatigue) | Mean mental fatigue in the control groups was | Mean fatigue in the intervention groups was | ‐ | 121 | ⊕⊝⊝⊝ |
MD was assessed with fixed‐effect or random‐effects models |
| Non‐serious adverse events | 25 per 1000f | 63 per 1000 | RR 2.51 | 246 | ⊕⊝⊝⊝ | |
| Days of hospitalisation | See comment | See comment | Not estimable | 0 | See comment | No trial reported this outcome |
| Blood ammonium levels | Mean blood ammonium levels in the control groups was | Mean blood ammonium levels in the intervention groups was | ‐ | 387 | ⊕⊕⊝⊝ | |
| *The basis for the assumed risk (e.g. the median control group risk across studies) is provided in footnotes. The corresponding risk (and its 95% confidence interval) is based on the assumed risk in the comparison group and the relative effect of the intervention (and its 95% CI). | ||||||
| GRADE Working Group grades of evidence. | ||||||
| aFor mental health domain. | ||||||
Background
Description of the condition
Hepatic encephalopathy is a common and devastating neuropsychiatric complication of acute liver failure or chronic liver disease (McPhail 2010; Felipo 2013; Rahimi 2013; Nusrat 2014). Hepatic encephalopathy can be categorised into three broad groups: type A, which occurs in acute liver failure; type B, which occurs with portosystemic bypass and no intrinsic hepatocellular disease; and the most commonly recognised form, type C, which occurs with chronic liver disease (Frederick 2011; Perazzo 2012; Felipo 2013; Romero‐Gomez 2014).
The spectrum of symptoms extends from a subclinical syndrome that may not be clinically apparent (early‐stage, or 'minimal' or covert hepatic encephalopathy) to full‐blown neuropsychiatric manifestations such as cognitive impairment, confusion, slow speech, loss of fine motor skills, asterixis, peripheral neuropathy, clonus, positive Babinski sign, decerebrate and decorticate posturing, seizures, extrapyramidal symptoms, and coma, in a condition known as overt hepatic encephalopathy (Frederick 2011; Perazzo 2012; Felipo 2013; Patidar 2015; De Rui 2016; Nardone 2016; Shawcross 2016). Mental state in patients with this liver complication can be assessed via the West Haven criteria (Shores 2008). See Appendix 1 for details of these criteria.
The severity of underlying liver insufficiency and the presence or absence of a portal systemic shunt determine the prevalence or incidence of hepatic encephalopathy (Vilstrup 2014). See Appendix 2 for details of the epidemiological data.
Hepatic encephalopathy arises when the liver cannot detoxify portal venous blood (Wakim‐Fleming 2011). The pathogenesis of hepatic encephalopathy is multi‐factorial (Frederick 2011; Wakim‐Fleming 2011; Felipo 2013; Sturgeon 2014). Many hypotheses have suggested how hepatic encephalopathy develops. Ammonia is the molecular key of multiple neurotoxins and inflammatory mediators, and it has been implicated in the pathogenesis of hepatic encephalopathy (Munoz 2008; Sundaram 2009; Frederick 2011; Perazzo 2012; Felipo 2013). Accumulation of ammonia from the gut and other sources due to impaired hepatic clearance or portosystemic shunting can lead to accumulation of glutamine in brain astrocytes, which results in swelling (Liou 2014). Several precipitating factors of hepatic encephalopathy have been described, such as acidosis, alkalosis, constipation, diuretic use, dehydration, gastrointestinal bleeding, hyponatraemia, infection, protein excess, renal decompensation, sedative use, and trauma (Wakim‐Fleming 2011). Hepatic encephalopathy is associated with significantly increased mortality among patients with liver disease, including those awaiting liver transplantation (Wong 2014). Hepatic encephalopathy Is associated with mortality in patients with cirrhosis independent of other extrahepatic organ failure (Bajaj 2017).
Management of hepatic encephalopathy is complex (Frontera 2014; Leise 2014; Basu 2015; Henderson 2015). It involves a pre‐emptive approach addressing potential precipitating factors, medical therapy to reduce the production and absorption of ammonia from the gut, and surgical or medical interventions (Frederick 2011; Wakim‐Fleming 2011). Several Cochrane systematic reviews have assessed the clinical benefits and harms of several interventions for hepatic encephalopathy treatment, such as dopaminergic agonists (Junker 2014), benzodiazepine receptor antagonists (Als‐Nielsen 2004), non‐absorbable disaccharides (Gluud 2016), branched‐chain amino acids (Gluud 2017), probiotics (Dalal 2017), naloxone (Sun 2009), rifaximin (Kimer 2015), and antibiotics (Falavigna 2007). Acetyl‐L‐carnitine offers another medical approach for reducing toxicity of ammonia in patients with hepatic encephalopathy (Malaguarnera 2006; Malaguarnera 2008; Shores 2008; Malaguarnera 2011a; Malaguarnera 2011b; Malaguarnera 2011c; Malaguarnera 2012; Malaguarnera 2013).
Description of the intervention
Acetyl‐L‐carnitine is an ester of L‐carnitine and acetate that is synthesised in the human brain, liver, and kidney by the enzyme acetyl‐L‐carnitine transferase (Malaguarnera 2013).
Carnitine is an essential dietary nutrient that acts as a carrier of fatty acids across the inner mitochondrial membrane (Malaguarnera 2012). The liver is a central organ for carnitine metabolism and for distribution of carnitine to the body. Therefore, it is not surprising that carnitine metabolism is impaired among patients with certain types of chronic liver disease (Krähenbühl 1996). Selimoglu 2001 pointed out that children with cirrhosis have low plasma carnitine concentrations, and this is especially pronounced among those with Wilson's disease. Based on this perspective, these researchers suggested mandatory carnitine supplementation for patients with cirrhosis in childhood, especially those with Wilson's disease. However, controversy surrounds this issue. One study shows that patients with non‐cirrhotic liver disease had no change in the plasma carnitine pool, whereas those with cirrhosis showed a 29% increase in the long‐chain acylcarnitine concentration (Krähenbühl 1997).
How the intervention might work
Hepatic encephalopathy occurs as a functional disturbance of cells involved in cerebral neurotransmission (Munoz 2008). The major factor affecting cerebral transmission is hyperammonaemia, which is directly neurotoxic (Munoz 2008), causing swelling of astrocytes and brain oedema (Wakim‐Fleming 2011). Swelling of astrocytes generates mitochondrial dysfunction and blood–brain barrier rupture, which lead to neuronal dysfunction (Wakim‐Fleming 2011).
Theoretically, acetyl‐L‐carnitine might be an effective intervention for treating patients affected by hepatic encephalopathy through two mechanisms: first, increasing urea genesis leads to decreased levels of blood and brain ammonium (Malaguarnera 2013); and second, acetyl‐L‐carnitine transported across the blood–brain barrier and accumulating in the cerebral spinal fluid and brain facilitates the uptake of acetyl‐coenzyme A (CoA) into the mitochondria during fatty acid oxidation, enhances acetylcholine production, and stimulates protein and membrane synthesis of phospholipids. All these mechanisms could provide a substrate reservoir for cellular energy production, thereby preventing excessive neuronal cell death (Malaguarnera 2012; Malaguarnera 2013).
Why it is important to do this review
The true role of acetyl‐L‐carnitine in treating patients with hepatic encephalopathy is a topic of controversy (Krähenbühl 1996; Krähenbühl 1997; Selimoglu 2001). The costs of hospitalisation for over 40,000 US patients with hepatic encephalopathy in 2003 were estimated at $932 million (Poordad 2007). Between 2005 and 2009, 110,000 hospitalisations for hepatic encephalopathy were reported in the USA (Stepanova 2012). It has been pointed out that in the European Union, this burden is similar (Vilstrup 2014). Malaguarnera 2006,Malaguarnera 2008,Malaguarnera 2011a,Malaguarnera 2011b, and Malaguarnera 2011c assessed the clinical benefits and harms of acetyl‐L‐carnitine in patients with hepatic encephalopathy. A single research group in Italy conducted all these trials. A review including three randomised clinical trials on L‐acyl‐carnitine treatment of hepatic encephalopathy was published in 2008 (Shores 2008). Review authors did not meta‐analyse the three randomised clinical trials and assessed their quality using the outdated Jadad score (Moher 1995), rather than the bias risk domains recommended by the Cochrane Handbook for Systematic Reviews of Interventions (Higgins 2011). Review authors recommended further trials of L‐acyl‐carnitine (Shores 2008). The Jiang 2013 meta‐analysis on acetyl‐L‐carnitine for people with hepatic encephalopathy showed that acetyl‐L‐carnitine significantly reduced serum ammonia levels and improved mental state, as assessed by the Trail Making Test (Conn 1977; Jiang 2013). However, this meta‐analysis employed no assessment of risk of bias nor risk of random error among the included randomised clinical trials. Thus, a systematic assessment of the beneficial and harmful effects of acetyl‐L‐carnitine for treatment of patients with hepatic encephalopathy is warranted.
Objectives
To assess the benefits and harms of acetyl‐L‐carnitine for patients with hepatic encephalopathy.
Methods
Criteria for considering studies for this review
Types of studies
We sought randomised clinical trials irrespective of their publication status (unpublished or published as an article, abstract, or letter), language, and blinding.
We excluded quasi‐randomised studies from our assessment of benefits, but we will include these and other observational studies in our report on harms if such studies are retrieved by our searches. By choosing this strategy, we are aware that we will place greater focus on potential benefits and may overlook late occurring or rare harms, which are often missed in randomised clinical trials (Storebø 2018).
Types of participants
We included patients with hepatic encephalopathy, irrespective of aetiology.
Types of interventions
Studies compared acetyl‐L‐carnitine administered at any dose, by any route and duration of treatment, versus no intervention, placebo, or other interventions.
As hepatic encephalopathy requires different medical and endoscopic treatments (i.e. primary interventions), acetyl‐L‐carnitine is considered a supplementary intervention. Thus, for the purposes of this review, eligible randomised clinical trials were those that compared the same primary interventions or treatments with and without acetyl‐L‐carnitine drug supplementation.
Types of outcome measures
We extracted data on outcomes at the end of treatment and at maximal follow‐up.
Primary outcomes
-
All‐cause mortality
-
Quality of life (any validated scale used by trialists, such as Short Form (SF)‐36)
-
Serious adverse events (A serious adverse event, defined according to the International Conference on Harmonisation (ICH) Guidelines for Good Clinical Practice (ICH‐GCP 1997), is any untoward medical occurrence that at any dose results in death, is life‐threatening, requires inpatient hospitalisation or prolongation of existing hospitalisation, leads to persistent or significant disability or incapacity, or comprises a congenital anomaly or birth defect.) All other adverse events were considered non‐serious (see below)
Secondary outcomes
-
Non‐serious adverse events (ICH‐GCP 1997)
-
Fatigue, either mental or physical (any validated scale used by trial authors)
-
Days of hospitalisation
-
Blood ammonium levels
Search methods for identification of studies
We searched the Cochrane Hepato‐Biliary Group Controlled Trials Register (Cochrane Hepato‐Biliary Group Module; searched 10 September 2018); the Cochrane Central Register of Controlled Trials (CENTRAL), in the Cochrane Library (2018, Issue 8; searched 10 September 2018); MEDLINE Ovid (1946 to 10 September 2018); Embase Ovid (1974 to 10 September 2018); Latin American Caribbean Health Sciences Literature (LILACS) (Bireme; 1982 to 10 September 2018); and Science Citation Index Expanded (Web of Science; 1900 to 10 September 2018) (Royle 2003). We have presented search strategies along with the time spans of these searches in Appendix 3.
We looked through the reference lists of retrieved publications and review articles. We searched the Food and Drug Administration (FDA) and European Medicines Agency (EMA) websites for unpubished trials (www.fda.gov; www.ema.europa.eu/ema/). We also searched the World Health Organization (WHO) International Clinical Trials Registry Platform Search Portal and the metaRegister of Controlled Trials for ongoing and unpublished trials (apps.who.int/trialsearch/; www.controlled‐trials.com/mrct/search.html). The evidence is current until 10 September 2018.
Data collection and analysis
We summarised data using standard Cochrane methods (Higgins 2011).
Selection of studies
Two review authors independently selected studies for eligibility using the Early Review Organizing Software (EROS) (Ciapponi 2011). We reviewed titles and abstracts of all identified studies to determine whether they fulfilled the inclusion criteria. We assessed the full texts of selected studies to confirm their relevance for inclusion. We resolved disagreements by consulting with a third review author. We were not blind to study authors’ names and institutions, journal of publication, or study results at any stage of the review.
Data extraction and management
We used a form to extract data from each relevant trial (Zavala 2006). Two review authors independently extracted data from trial publications and contacted study authors if data were missing. Arturo Martí‐Carvajal (AMC) entered the data into Review Manager 5.3 (Review Manager 2014), and Ingrid Arévalo‐Rodríguez (IAR) and Cristina Martí‐Amarista (CMA) independently checked the data. We also extracted information on study design and participant characteristics (age, sex, and hepatic encephalopathy severity, as measured by West Haven grade).
Assessment of risk of bias in included studies
We assessed the following 'Risk of bias' domains of randomised clinical trials (Schulz 1995; Moher 1998; Kjaergard 2001; Wood 2008; Higgins 2011; Savovic 2012a; Savovic 2012b; Lundh 2017; Savović 2018).
Allocation sequence generation
-
Low risk of bias: sequence generation was achieved using computer random number generation or a random numbers table. Drawing lots, tossing a coin, shuffling cards, and throwing dice were adequate if performed by an independent person not otherwise involved in the trial
-
Uncertain risk of bias: the sequence generation method was not specified
-
High risk of bias: the sequence generation method was not random
Allocation concealment
-
Low risk of bias: participant allocations could not have been foreseen in advance of, or during, enrolment. Allocation was controlled by a central and independent randomisation unit. The allocation sequence was unknown to investigators (e.g. the allocation sequence was hidden in sequentially numbered, opaque, and sealed envelopes)
-
Uncertain risk of bias: the method used to conceal the allocation was not described, so that intervention allocations may have been foreseen in advance of, or during, enrolment
-
High risk of bias: the allocation sequence was likely to be known to investigators who assigned participants
Blinding of participants and personnel
-
Low risk of bias: any of the following: no blinding or incomplete blinding was described, but review authors judged that the outcome was not likely to be influenced by lack of blinding; or blinding of participants and key study personnel was ensured, and it was unlikely that blinding could have been broken
-
Unclear risk of bias: any of the following: information was insufficient to permit judgement of ‘low risk’ or ‘high risk’; or the trial did not address this outcome
-
High risk of bias: any of the following: no blinding or incomplete blinding, and the outcome was likely to be influenced by lack of blinding; or blinding of key study participants and personnel was attempted, but it is likely that blinding could have been broken, and the outcome was likely to be influenced by lack of blinding
Blinded outcome assessment
-
Low risk of bias: any of the following: no blinding of outcome assessment, but review authors judged that outcome measurement was not likely to be influenced by lack of blinding; or blinding of outcome assessment was ensured, and it is unlikely that blinding could have been broken
-
Unclear risk of bias: any of the following: information was insufficient to permit judgement of ‘low risk’ or ‘high risk’; or the trial did not address this outcome
-
High risk of bias: any of the following: no blinding of outcome assessment was described, and outcome measurement was likely to be influenced by lack of blinding; or blinding of outcome assessment was described, but it is likely that blinding could have been broken, and outcome measurement was likely to be influenced by lack of blinding
Incomplete outcome data
-
Low risk of bias: missing data were unlikely to make treatment effects depart from plausible values. Sufficient methods, such as multiple imputation, were employed to handle missing data
-
Uncertain risk of bias: information was insufficient to assess whether missing data in combination with the method used to handle missing data were likely to induce bias in the results
-
High risk of bias: results were likely to be biased due to missing data
Selective outcome reporting
-
Low risk: all pre‐defined, or clinically relevant and reasonably expected, outcomes were reported on. If the original trial protocol was available, outcomes should have been those called for in that protocol (Note: If the trial protocol was obtained from a trial registry (e.g. www.clinicaltrials.gov), the outcomes sought were those enumerated in the original protocol if the trial protocol had been registered before or at the time the trial began; if the trial protocol was registered after the trial began, those outcomes would not have been considered reliable in representing the outcomes initially sought). If the trial protocol was not available (or if the protocol had been registered after the trial began), we would expect the following clinically relevant and reasonably expected outcomes to have been reported by trial authors: all‐cause mortality, quality of life, serious adverse events, non‐serious adverse events, and days of hospitalisation
-
Unclear risk: not all pre‐defined, or clinically relevant and reasonably expected, outcomes were reported fully, or it is unclear whether data on these outcomes were recorded
-
High risk: one or more pre‐defined or clinically relevant and reasonably expected outcomes were not reported, although data on these outcomes were likely to have been available and even recorded
For‐profit bias
-
Low risk of bias: the trial appears to be free of industry sponsorship or other for‐profit support that may manipulate trial design, conduct, or results
-
Uncertain risk of bias: the trial may or may not be free of for‐profit bias, as no information on clinical trial support or sponsorship was provided
-
High risk of bias: the trial was sponsored by industry or received other for‐profit support
Other bias
-
Low risk of bias: the trial appears to be free of other components (e.g. academic bias) that could put it at risk of bias
-
Uncertain risk of bias: the trial may or may not be free of other components that could put it at risk of bias
-
High risk of bias: other factors in the trial can put it at risk of bias (e.g. study authors have conducted trials on the same topic)
We judged trials as having low risk of bias if assessed as having low risk of bias in all domains. In all other cases, we judged trials as having high risk of bias.
Measures of treatment effect
For binary outcomes, such as all‐cause mortality and adverse (serious and non‐serious) events, we calculated the risk ratio (RR) with 95% confidence interval (CI) and Trial Sequential Analysis‐adjusted CI (see below).
For continuous outcomes, such as quality of life (e.g. Short Form (SF)‐36), days of hospitalisation, and blood ammonium levels, we calculated the mean difference (MD) with 95% CI and Trial Sequential Analysis‐adjusted CI (see below). If different scales were used for measuring the same outcome (e.g. quality of life), we used the standardised mean difference (SMD) with 95% CI. As recommended by the Cochrane Handbook for Systematic Reviews of Interventions, if necessary, we multiplied the mean values from one set of studies by ‐1 to ensure that all scales point in the same direction (Higgins 2011). We estimated the ratio of means with 95% CIs for continuous outcomes (Friedrich 2008; Friedrich 2011).
Dealing with missing data
We attempted to contact the publication authors.
We attempted to use intention‐to‐treat analysis.
Due to lack of reporting of two primary outcomes (all‐cause mortality and serious adverse events), we performed a sensitivity analysis of two secondary outcomes (i.e. non‐serious adverse events and blood ammonium levels). Regarding these secondary outcomes, we included participants with incomplete or missing data in sensitivity analyses by imputing them according to the following scenarios (Hollis 1999).
-
Available‐case analysis, which ignores missing data and justifies missing at random assumption (Chaimani 2014).
-
Extreme‐case analysis favouring the experimental intervention ('best‐worse' case scenario): none of the dropouts/participants lost from the experimental arm, but all of the dropouts/participants lost from the control arm, experienced the outcome, including all randomised participants in the denominator (Hollis 1999).
-
Extreme‐case analysis favouring the control ('worst‐best' case scenario): all dropouts/participants lost from the experimental arm, but none from the control arm, experienced the outcome, including all randomised participants in the denominator (Hollis 1999).
Furthermore, we assessed the impact of missing data by using two methods based on the principle of uncertainty when used to impute missing trial data.
-
Gamble‐Hollis analysis (Gamble 2005).
-
Informative missingness odds ratio model (Chaimani 2014).
Assessment of heterogeneity
We quantified the impact of statistical heterogeneity by using the I² statistic, which describes the percentage of total variation across trials that is due to heterogeneity rather than to sampling error (Higgins 2003). We summarised these findings using a fixed‐effect model or a random‐effects model, according to Jakobsen 2014a. We estimated prediction intervals in cases of statistical heterogeneity by using the random‐effects model (Riley 2011; IntHout 2016; Borenstein 2017; Partlett 2017).
Assessment of reporting biases
For future updates, we will attempt to assess publication bias by using a funnel plot, which is usually used to illustrate variability between trials in a graphical way. We will need to include at least 10 trials if we are to make judgements about asymmetry, and if asymmetry is present, we will attempt to explore its causes (Sterne 2011).
Data synthesis
Meta‐analysis
We performed meta‐analyses with 95% CIs and Trial Sequential Analysis‐adjusted CIs (see below), using both fixed‐effect and random‐effects models, according to Jakobsen 2014a.
Trial Sequential Analysis
Although we identified no trials reporting neither all‐cause mortality nor serious adverse events, we conducted Trial Sequential Analysis (TSA) in estimating sample sizes for future trials regarding either all‐cause‐mortality or serious adverse events. We applied TSA, as cumulative meta‐analyses are at risk of producing random errors due to sparse data and repetitive testing of accumulating data (Brok 2008; Wetterslev 2008; Brok 2009; Thorlund 2009, Wetterslev 2009; Thorlund 2010; Imberger 2015; Imberger 2016; Wetterslev 2017). To minimise random errors, we calculated the required information size (i.e. the number of participants needed in a meta‐analysis to detect or reject a certain intervention effect) (Wetterslev 2008). The required information size calculation should also account for heterogeneity or diversity present in the meta‐analysis (Wetterslev 2008; Wetterslev 2009). In our meta‐analysis, the diversity‐adjusted required information size was based on the event proportion in the control group; assumption of a plausible RR reduction of 20% or RR reduction observed in the included trials at low risk of bias; risk of type I error of 5%; risk of type II error of 20%; and the empirical diversity (D²) of the meta‐analysis (Wetterslev 2009; Wetterslev 2017). Only one trial including only 67 participants assessed quality of life on the SF‐36 scale. We therefore decided not to conduct TSA, as the distance from the accrued sample size to a plausible required information size is too large. Accordingly, we reported naive 95% CIs, which ought to be interpreted conservatively. We will conduct TSA on quality of life if this outcome is measured by the same scale. We conducted TSA for serum ammonium concentration. Here, we used an alpha of 0.0125 (0.05/4) (Bonferrini adjustment), as there are four secondary outcomes, and a beta of 10% and the D² of the meta‐analysis. We added trials according to the year of publication, and if more than one trial has been published in a year, we will add trials alphabetically according to the last name of the first author. On the basis of the required information size, we constructed trial sequential monitoring boundaries (Lan 1983; Wetterslev 2008; Thorlund 2011). These boundaries determined the statistical inference one may draw regarding the cumulative meta‐analysis that has not reached the required information size; if the trial sequential monitoring boundary for benefit or harm was crossed before the required information size was reached, firm evidence might perhaps be established and further trials may turn out to be superfluous. On the other hand, if one of the boundaries is not surpassed, it is probably necessary to continue to conduct trials to detect or reject a certain intervention effect. This can be determined by assessing whether the cumulative Z‐curve crosses trial sequential boundaries for futility. If futility boundaries were crossed, then further trials might be unnecessary (TSA 2011).
We conducted TSA using the latest software version (0.9.5.10.Beta) from the Copenhagen Trial Unit (Thorlund 2011; TSA 2011).
Subgroup analysis and investigation of heterogeneity
We anticipated clinical heterogeneity in effects of the intervention, and for each comparison, we planned to conduct the following subgroup analyses, if data were available.
-
According to risk of bias when trials at low risk of bias were compared to trials at high risk of bias.
-
According to the West Haven grade of hepatic encephalopathy at entry.
-
According to the aetiology of hepatic encephalopathy.
-
According to acute liver disease compared to chronic liver disease.
We were not able to conduct subgroup analyses and investigations of heterogeneity due to lack of data: no trial measured or reported all‐cause mortality or serious adverse events. Only one trial assessed quality of life.
For future updates, we plan to perform subgroup analyses for primary outcomes.
Sensitivity analysis
In addition to the sensitivity analyses described under Dealing with missing data, we did not perform the following sensitivity analysis to explore the influence of these factors on the intervention effect size.
-
Repeating the analysis while taking attrition bias into consideration.
For future updates, we plan to perform sensitivity analyses for primary outcomes if data are available.
'Summary of findings' tables
We used the principles of the GRADE system to assess the quality of the body of evidence associated with specific outcomes (all‐cause mortality, quality of life, serious adverse events, fatigue, non‐serious adverse events, days of hospitalisation, and blood ammonium levels) in our review (Guyatt 2011e), and we constructed summary of findings Table for the main comparison using GRADEpro software.
The GRADE approach appraises the quality of a body of evidence based on the extent to which one can be confident that an estimate of effect or association reflects the item being assessed. The quality of a body of evidence considers five factors regarding limitations in design and implementation of available studies suggesting high likelihood of bias: indirectness of evidence (indirect population, intervention, control, outcomes); unexplained heterogeneity and inconsistency of results (including problems with subgroup analyses); imprecision of results (wide confidence intervals); and high probability of publication bias (Balshem 2011; Guyatt 2011a; Guyatt 2011b; Guyatt 2011c; Guyatt 2011d; Guyatt 2011e; Guyatt 2011f; Guyatt 2011g; Guyatt 2011h; Guyatt 2013a; Guyatt 2013b; Guyatt 2013c; Guyatt 2013d; Mustafa 2013; Guyatt 2017).
Calculation and interpretation of Bayes Factor
Given that P values are not as reliable as many scientists assume (Nuzzo 2014), we estimated the threshold for clinical relevance with Bayes factor (Jakobsen 2014a), which has been pointed out as complementary statistical evidence to P values (Lin 2015). Bayes factor is a likelihood ratio indicating the relative strength of evidence for two theories (Goodman 1999; Goodman 2005; Dienes 2014). Bayes factor is the ratio between the probability of getting the result assuming the null hypothesis (H0) is true divided by the probability of getting the result assuming the alternative hypothesis (HA) is true (Jakobsen 2014b). We used the Copenhagen Trial Unit‐Bayes factor calculator.
Comparison of assessments of imprecision with GRADE and Trial Sequential Analysis
Excellent concordance is usually evident between imprecision assessments with GRADE and those with Trial Sequential Analysis (Castellini 2018; Gartlehner 2018). However, in meta‐analyses with diversity for which a random‐effects model is more appropriate, the required information size will be larger with Trial Sequential Analysis than that assessed by GRADE not employing diversity correction and using a fixed‐effect model to calculate the required information size. We will therefore assess imprecision by using both methods.
Results
Description of studies
Results of the search
We identified 738 references using our search strategies. Five trials involving 398 participants met our inclusion criteria (Malaguarnera 2006; Malaguarnera 2008; Malaguarnera 2011a; Malaguarnera 2011b; Malaguarnera 2011c). The evidence is current until 10 September 2018.
See Figure 1 for details of the flow of studies.
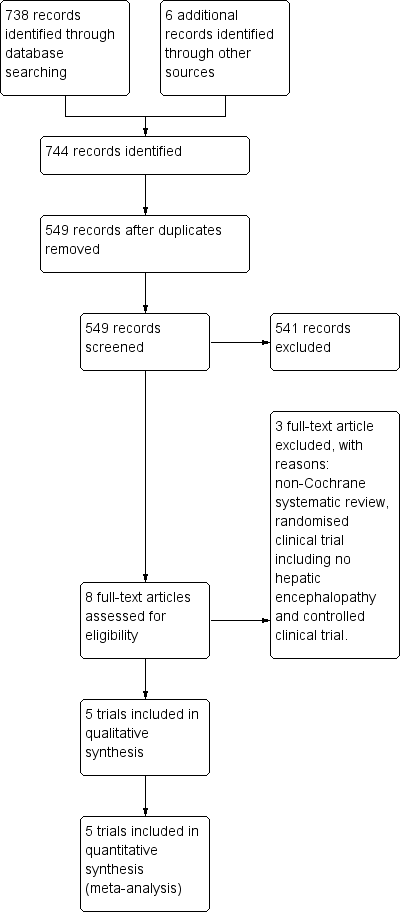
Study flow diagram for 10 August 2018.
Included studies
We have described these trials in the section Characteristics of included studies. Trials varied in size as well as in characteristics of participant populations, duration of intervention, and drug dosage.
Acetyl‐L‐carnitine and populations assessed in the trials
All trials compared acetyl‐L‐carnitine versus placebo (with or without co‐interventions). None of the trials sufficiently described the characteristics of the placebo (Malaguarnera 2006; Malaguarnera 2008; Malaguarnera 2011a; Malaguarnera 2011b; Malaguarnera 2011c).
The co‐interventions used most frequently in both experimental and control groups were lactulose (Malaguarnera 2006; Malaguarnera 2011b; Malaguarnera 2011c); insulin (Malaguarnera 2011b); diuretics (Malaguarnera 2008; Malaguarnera 2011b); beta‐blockers (Malaguarnera 2008; Malaguarnera 2011b); antibiotics (neomycin) (Malaguarnera 2011c); and branched‐chain amino acids (Malaguarnera 2011c). One trial did not report the use of any co‐intervention (Malaguarnera 2011a).
Four trials administered acetyl‐L‐carnitine orally at a dose of 2 grams (gr) twice daily over 90 days (Malaguarnera 2008; Malaguarnera 2011a; Malaguarnera 2011b; Malaguarnera 2011c). One trial administered acetyl‐L‐carnitine intravenously, and the dose was 4 gr once daily over 3 days (Malaguarnera 2006).
The mean age of participants was 50 years (standard deviation (SD) 2.3). Most participants were male (57.4% (SD 7%)). In all trials, hepatic encephalopathy was associated with cirrhosis and portal hypertension (i.e. type C) (Malaguarnera 2006; Malaguarnera 2008; Malaguarnera 2011a; Malaguarnera 2011b; Malaguarnera 2011c). Clinical severity varied and included covert hepatic encephalopathy (Malaguarnera 2008; Malaguarnera 2011a), as well as overt hepatic encephalopathy (Malaguarnera 2006; Malaguarnera 2011b; Malaguarnera 2011c). One trial reported precipitating factors (i.e. haemorrhage, sepsis, dehydration, and surgery) (Malaguarnera 2006). Trials did not provide information on duration of hepatic encephalopathy.
Location of trials
All trials were conducted in the Dipartimento di Scienze della Senescenza, Urologiche e Neurologiche, Università di Catania, in Italy (Malaguarnera 2006; Malaguarnera 2008; Malaguarnera 2011a; Malaguarnera 2011b; Malaguarnera 2011c).
Trial methods
All trials used a parallel‐group design and reported an a priori estimation of sample size. Trials were small, with sample sizes ranging from 24 to 125 participants and a median sample size of 67 and a mean size of 79.6 (SD 42.9). Trials reported inclusion and exclusion criteria. In all trials, the units of randomisation and analysis were the participants. All trials included two comparison groups, without reporting the follow‐up periods (Malaguarnera 2006; Malaguarnera 2008; Malaguarnera 2011a; Malaguarnera 2011b; Malaguarnera 2011c). Trials reported duration of the intervention: three days in Malaguarnera 2006, and 90 days in Malaguarnera 2008,Malaguarnera 2011a,Malaguarnera 2011b, and Malaguarnera 2011c. No trials reported drug company sponsorship.
Excluded studies
We excluded three studies: one meta‐analysis (Jiang 2013), one randomised clinical trial including no participants with hepatic encephalopathy (Malaguarnera 2014), and one non‐randomised clinical trial (Siciliano 2006). See the Characteristics of excluded studies table.
Ongoing trials
We identified one ongoing trial (NCT02173132). This trial also originated from Mariano Malaguarnera and his group from the University of Catania, in Italy. We have provided full details in the Characteristics of ongoing studies table.
Risk of bias in included studies
We have summarised risks of bias in the included trials in Figure 2 and Figure 3, and we have provided details in the Characteristics of included studies table.
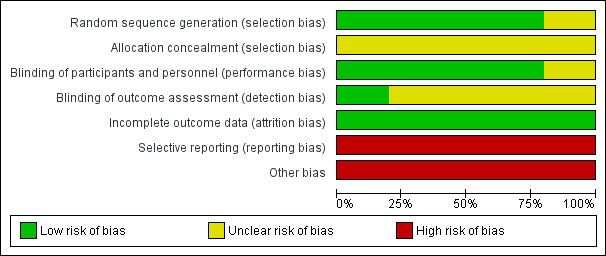
Risk of bias graph: review authors' judgements about each risk of bias item presented as percentages across all included studies.
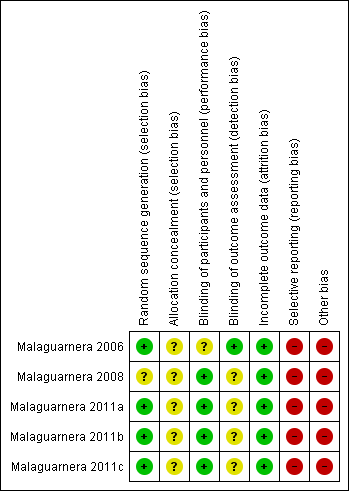
Risk of bias summary: review authors' judgements about each risk of bias item for each included study.
Allocation
Random sequence generation
We considered risk of bias arising from the method of generation of the allocation sequence to be low in four trials (Malaguarnera 2006; Malaguarnera 2011a; Malaguarnera 2011b; Malaguarnera 2011c). One trial had unclear risk of bias for this domain (Malaguarnera 2008).
Allocation concealment
We considered risk of bias arising from the method of allocation concealment to be unclear in all trials (Malaguarnera 2006; Malaguarnera 2008; Malaguarnera 2011a; Malaguarnera 2011b; Malaguarnera 2011c).
Blinding
Blinding of participants and personnel (performance bias)
We rated risk of bias due to lack of blinding of participants and personnel as low in four trials (Malaguarnera 2008; Malaguarnera 2011a; Malaguarnera 2011b; Malaguarnera 2011c). We judged risk of performance bias as unclear in one trial (Malaguarnera 2006).
Blinding of outcome assessment (detection bias)
One trial clearly reported outcome assessment as blinded, and we considered detection bias to be low (Malaguarnera 2006). Blinding of outcome assessors was unclear or was not performed in the remaining four trials (Malaguarnera 2008; Malaguarnera 2011a; Malaguarnera 2011b; Malaguarnera 2011c), so we considered risk of detection bias to be high.
Incomplete outcome data
We rated risk of attrition bias as low in all trials (Malaguarnera 2006; Malaguarnera 2008; Malaguarnera 2011a; Malaguarnera 2011b; Malaguarnera 2011c).
Selective reporting
We rated risk of selective outcome reporting bias as high in all trials (Malaguarnera 2006; Malaguarnera 2008; Malaguarnera 2011a; Malaguarnera 2011b; Malaguarnera 2011c), because these trials neither measured nor reported all‐cause mortality, quality of life, or adverse events data, considered as critical patient‐centred and patient‐reported outcomes. Only one trial reported trial registration number (Malaguarnera 2011b). Malaguarnera 2006 and Malaguarnera 2008 were not registered or published, so we could not assess what was intended and what was reported. Malaguarnera 2011a and Malaguarnera 2011c reported no trial registration number; however, these trials were registered. We noted a mean of 4 years and 6.2 months between the last trial conduction date (end of trial) and the trial publication date (Appendix 4).
Other potential sources of bias
We assessed Malaguarnera 2006,Malaguarnera 2008,Malaguarnera 2011a,Malaguarnera 2011b, and Malaguarnera 2011c as having high risk of other bias due to bias in the design associated with a large number of outcomes and a family‐wise error rate substantially over the 5% level (Follmann 1995; Delorme 2016).
We rated Malaguarnera 2008 as having high risk of allocation and confusion bias due to unclear reporting about random sequence generation and allocation concealment of sequence generation. Malaguarnera 2011b had high risk of bias in the presentation of data due to inconsistency in baseline data.
Accordingly, we considered all trials to have high risk of bias.
Effects of interventions
All trials compared acetyl‐L‐carnitine versus placebo (Malaguarnera 2006; Malaguarnera 2008; Malaguarnera 2011a; Malaguarnera 2011b; Malaguarnera 2011c).
Primary outcomes
All‐cause mortality
None of the trials reported on all‐cause mortality. A calculation with Trial Sequential Analysis suggested that with proportion of all‐cause mortality in the control group of 38% (Bajaj 2017), a relative risk reduction of 20% in the experimental group, alpha of 5%, beta of 10%, and D² of 25%, we would need a sample size of 2184 participants when conducting a randomised clinical trial to assess the size effect of acetyl‐L‐carnitine versus placebo on all‐cause mortality.
Quality of life
Only one trial involving 67 participants with covert hepatic encephalopathy assessed quality of life using the SF‐36 scale (Malaguarnera 2011a). We therefore decided not to conduct Trial Sequential Analysis, as the distance from the accrued sample size to a plausible required information size was too large. Accordingly, reported naive 95% CIs ought to be interpreted conservatively. Researchers assessed quality of life at 90 days using the SF‐36 scale (range 0 to 100 points (the higher, the better)). Regarding physical functioning, the mean difference (MD) in acetyl‐L‐carnitine compared with placebo, assessed via fixed‐effect or random‐effects models, was 7.90 points (95% CI 4.49 to 11.31); for role limitations due to physical problems, the MD was 9.60 points (95% CI 5.77 to 13.43); for bodily pain, 1.80 points (95% CI ‐2.78 to 6.38); for general health, ‐6.20 points (95% CI ‐9.51 to ‐2.89); for vitality, 2.80 points (95% CI ‐0.11 to 5.71); for social functioning, 2.90 points (95% CI 0.44 to 5.36); for role of limitations due to emotional problems, 4.80 points (95% CI 1.45 to 8.15), and for general mental health perceptions, 3.10 points (95% CI 0.64 to 5.56). Table 1 shows the effect size in MD or ratio of means on domains of quality of life of acetyl‐L‐carnitine compared with placebo. We rated the quality of evidence as very low due to limitations in design and in execution (Malaguarnera 2011a). See Analysis 1.1.
| Domain (SF‐36 scale; 0 to 100, higher score is better) | Mean difference (95% CI) | Ratio of means (95% CI) |
| Physical functioning | 7.90 | 1.12 |
| Role limitations due to physIcal problems | 9.60 | 1.15 |
| Bodily pain at 90 days | 1.80 | 1.03 |
| General health at 90 days | ‐6.20 (‐9.51 to ‐2.89) | 0.91 (0.86 to 0.96) |
| Vitality at 90 days | 2.80 (‐0.11 to 5.71) | 1.05 (1.00 to 1.10) |
| Social functioning at 90 days | 2.90 | 1.05 (1.01 to 1.08) |
| Role limitations due to emotional problems at 90 days | 4.80 (1.45 to 8.15) | 1.08 (1.02 to 1.13) |
| General mental health perceptions at 90 days | 3.10 (0.64 to 5.56) | 1.05 |
SF‐36: Short Form‐36.
Serious adverse events
None of the trials reported on serious adverse events. Calculation based on TSA suggested that with proportion of serious adverse events in the control group of 3%, a relative risk reduction of 50%, alpha of 5%, beta of 10%, and D² of 0%, we would need a sample size of 4109 participants to conduct a randomised clinical trial to detect the size effect of acetyl‐L‐carnitine versus placebo on serious adverse events.
Secondary outcomes
Non‐serious adverse events
Meta‐analysis of two trials yielded evidence of no effect in terms of non‐serious adverse events when acetyl‐L‐carnitine was compared with placebo (8/126 (6.34%) vs 3/120 (2.5%); RR fixed‐effect model and random‐effects model 2.51; 95% CI 0.68 to 9.22; I² = 0%). We rated the quality of evidence as very low due to limitations in design and in execution (Malaguarnera 2008; Malaguarnera 2011b). See Analysis 1.2. Bayes factor was 4.07 × 10‐8, which means there is a likelihood of 4.07 × 10‐8 times for acetyl‐L‐carnitine versus placebo for increasing risk of non‐serious adverse events. Trial Sequential Analysis of two trials comparing acetyl‐L‐carnitine versus placebo on non‐serious adverse events in participants with hepatic encephalopathy with proportion of non‐serious adverse events in the control group of 2.51%, a relative risk reduction of 20%, alpha of 5%, beta of 20%, and D² of 0% suggests a sample size of 27,741 participants for conducting a randomised clinical trial for detecting the size effect of acetyl‐L‐carnitine compared with placebo on non‐serious adverse events.
Sensitivity analysis by missing data on non‐serious adverse events
In sensitivity analysis by missing data showing the effect of acetyl‐L‐carnitine versus placebo on non‐serious adverse events by available case analysis (RR 2.50, 95% CI 0.68 to 9.16; I² = 0%), best‐case scenario (RR 0.97, 95% CI 0.28 to 3.40; I² = 23%), worst‐case scenario (RR 4.93, 95% CI 1.48 to 16.47; I² = 0%), Gamble‐Hollis analysis (RR 2.57, 95% CI 0.48 to 13.74; I² = 0%), and the informative missingness odds ratio model (RR 2.51, 95% CI 0.69 to 9.17; I² = 0%) showed evidence of no effect in terms of non‐serious adverse events. Testing for subgroup differences showed no significant differences (Chi² = 3.39, df = 4 (P = 0.50), I² = 0%) (Malaguarnera 2008; Malaguarnera 2011b). See Analysis 1.3.
Table 2 provides details on how adverse events were reported (Malaguarnera 2006; Malaguarnera 2008; Malaguarnera 2011a; Malaguarnera 2011b; Malaguarnera 2011c).
| Trial | Adverse events |
| "No side effects were observed in our study series" | |
| "In the group treated with acetyl‐L‐carnitine, one patient complained of nausea, two of slight headache and two of abdominal pain. In the placebo group, one patient complained | |
| Researchers did not report on adverse events | |
| "Three patients in the acetyl‐L‐carnitine group (1 with mild hepatic encephalopathy and 2 with moderate hepatic encephalopathy) withdrew from the study because of abdominal pain. One patient in the placebo group withdrew from the study because of headache. In the placebo group, we observed occasional abdominal pain, cramping, diarrhoea, and flatulence. At follow‐up 1 mo after treatment ended, 2 patients in the acetyl‐L‐carnitine group and 5 patients in the placebo group experienced moderate hepatic encephalopathy" | |
| Researchers did not report on adverse events |
Fatigue
One trial involving 121 participants with overt hepatic encephalopathy assessed fatigue ‐ mental or physical (Malaguarnera 2011b). Researchers assessed fatigue using the Wessely and Powell test at day 90. The mental fatigue scale has a range of 0 (no fatigue) to 10 (highest) points. In terms of mental fatigue among people with mild‐grade hepatic encephalopathy, the mean difference between acetyl‐L‐carnitine versus placebo was ‐0.80 points (95% CI ‐1.48 to ‐0.12; participants = 61; trials = 1), and the mean difference in mental fatigue among people with moderate‐grade hepatic encephalopathy was ‐0.40 points (95% CI ‐0.21 to 1.01; participants = 61; trials = 1). For physical fatigue in people with mild‐grade hepatic encephalopathy (Wessely and Powell test from 0 (no fatigue) to 16 (highest possible)), the mean difference was 0.20 points (95% CI ‐0.72 to 1.12; participants = 61; trials = 1), and the mean difference for physical fatigue in people with moderate‐grade hepatic encephalopathy was ‐0.20 points (95% CI ‐0.92 to 0.52; participants = 61; trials = 1) assessed by the fixed‐effect model. Malaguarnera 2011b reported data by subgroup of mild or moderate hepatic encephalopathy. Table 3 shows the effect size in MD or ratio of means on fatigue of acetyl‐L‐carnitine compared with placebo. We rated the quality of evidence as very low due to limitations in design and in execution (Malaguarnera 2011b). See Analysis 1.4.
| Type of fatigue by hepatic encephalopathy | Fatigue (the Wessely and Powell test)b,c | |
| Mean difference (95% CI) | Ratio of means (95% CI) | |
| Mental fatigue in people with mild hepatic encephalopathy (0 (no fatigue) to 10 (highest possible))a | ‐0.80 (‐1.48 to ‐0.12) | 0.88 (0.78, to 0.98) |
| Mental fatigue in people with moderate hepatic encephalopathy (0 (no fatigue) to 10 (highest possible))a | 0.40 (‐0.21 to 1.01) | 1.07 (0.97 to 1.18) |
| Physical fatigue in people with mild hepatic encephalopathy (0 (no fatigue) to 16 (highest possible))a | 0.20 (‐0.72 to 1.12) | 1.02 (0.93 to 1.13) |
| Physical fatigue in people with moderate hepatic encephalopathy (0 (no fatigue) to 16 (highest possible))a | ‐0.20 (‐0.92 to 0.52) | 0.98 (0.90 to 1.06) |
Blood ammonium levels
Meta‐analysis of five trials involving 387 participants with covert or overt hepatic encephalopathies showed a reduction in blood ammonium levels favouring participants assigned to acetyl‐L‐carnitine over participants allocated to placebo (MD ‐13.06 mg/dL, 95% CI ‐17.24 to ‐8.89; I² = 59% (95% CI 1% to 84%); D² of 63%) (Analysis 1.5). The prediction interval was MD ‐13.06 mg/dL (95% CI ‐25.43 to ‐0.69), which should be understood to show that in some 95% of the entire population, the true effect size in new settings will be between ‐25.43 and ‐0.69 mg/dL. Bayes factor was 5.02 × 10²⁰, which means there is a likelihood of 5.02 × 10²⁰ times for acetyl‐L‐carnitine over placebo for reducing blood ammonium levels by at least 13.06 mg/dL, or 18% (based on a ratio of means of 0.82). Trial Sequential Analysis of five trials comparing acetyl‐L‐carnitine versus placebo on blood ammonium levels in participants with hepatic encephalopathy suggests that no additional trials may be needed on this outcome (Figure 4). We rated the quality of evidence asvery low due to limitations in design and execution and inconsistency. Testing for subgroup differences was significant (P = 0.02), and I² attributed to subgroup differences was 64.9% (Malaguarnera 2006; Malaguarnera 2008; Malaguarnera 2011a; Malaguarnera 2011b; Malaguarnera 2011c). Table 4 shows the effect size in MD or in ratio of means of blood ammonium levels when acetyl‐L‐carnitine was compared with placebo.
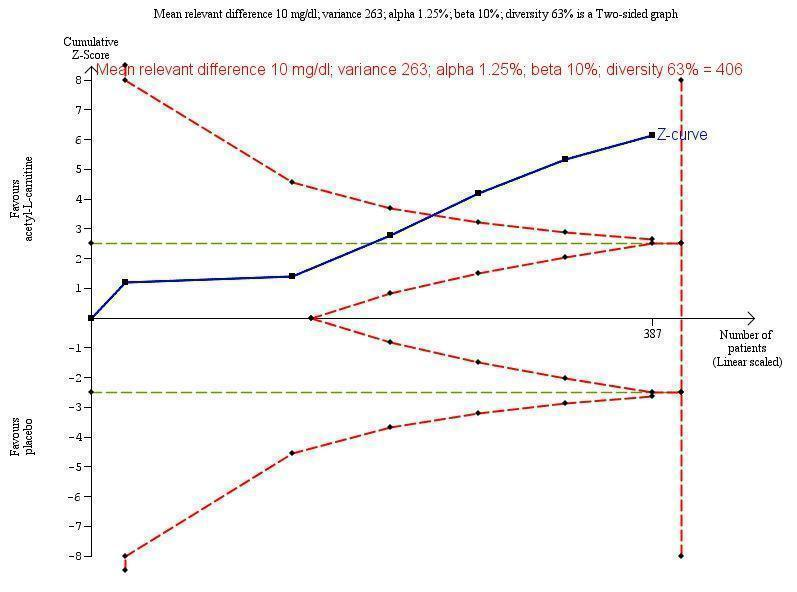
Trial Sequential Analysis of five trials comparing acetyl‐L‐carnitine versus placebo on blood ammonium levels in participants with hepatic encephalopathy.
Trial Sequential Analysis of five trials comparing acetyl‐L‐carnitine versus placebo on blood ammonium levels in participants with hepatic encephalopathy based on the diversity‐adjusted required information size (DARIS) of 406 participants. This DARIS was calculated based upon a mean relevant difference of 10 mg; a variance of 263; an alpha (α) of 1.25%; and a beta (β) of 10%. The cumulative Z‐curve (blue line) crossed the conventional alpha of 1.25% (green line) after three trials. This implies that there is not a random error. The cumulative Z‐curve (blue line) surpassed the continuous alpha‐spending boundary (monitoring efficacy boundary) after four trials. Presently, 95.3% (387/406) of the DARIS has been obtained.
Malaguarnera 2011b measured twice blood ammonium level with mild or moderate hepatic encephalopathy.
| Type of hepatic encephalopathy | Acetyl‐L‐carnitine sample size | Placebo sample size | Blood ammonium levels | |
| Mean difference, mg/dL (95% CI) | Ratio of means (95% CI) | |||
| Mild hepatic encephalopathya | 31 | 30 | ‐13.00 | 0.81 |
| Moderate hepatic encephalopathya | 30 | 30 | ‐11.30 | 0.88 |
| Hepatic comab | 13 | 11 | ‐4.10 | 0.94 |
| Minimal hepatic encephalopathyc,d Subtotal (95% CI) | 60 | 55 | ‐21.90 | 0.66 |
| 33 | 34 | ‐16.70 | 0.72 | |
| 93 | 89 | ‐17.46 | 0.70 | |
| Severe hepatic encephalopathye | 30 | 30 | ‐13.80 | 0.86 |
| Total (95% CI) | 197 | 190 | ‐13.06 | 0.82 I²= 78% |
Sensitivity analysis by missing data
Sensitivity analysis by missing data on the effect of acetyl‐L‐carnitine versus placebo on blood ammonium levels by complete‐case analysis (MD ‐13.40 mg/dL, 95% CI ‐18.31 to ‐8.48; participants = 327; I² = 66%), strategy 1 (MD ‐12.88 mg/dL, 95% CI ‐17.69 to ‐8.06; participants = 342; I² = 67%), strategy 2 (MD ‐14.70 mg/dL 95% CI ‐20.23 to ‐9.16; participants = 342; I² = 75%), strategy 3 (MD ‐14.06 mg/dL, 95% CI ‐19.50 to ‐8.62; participants = 342; I² = 74%), and strategy 4 (MD ‐13.79 mg/dL, 95% CI ‐18.99 to ‐8.58; participants = 342; I² = 71%) shows robustness of results for each of the imputation strategies. Testing for subgroup differences showed no difference (Chi² = 0.27, df = 4 (P = 0.99), I² = 0%) (Analysis 1.6).
'Summary of findings' tables
summary of findings Table for the main comparison shows the overall grading of evidence found for this Cochrane systematic review.
Discussion
Summary of main results
This Cochrane systematic review about acetyl‐L‐carnitine for treating patients with hepatic encephalopathy includes five randomised clinical trials that randomised 398 participants. These trials evaluated acetyl‐L‐carnitine given orally or intravenously compared with placebo. Overall, we assessed these trials as having high risk of bias and as being underpowered. All trials reported an a priori sample size estimation. Drug companies did not sponsor any of the trials. Trials were conducted in one country (Italy) by the same team of investigators, in general in the outpatient (ambulatory) setting.
None of the included trials assessed, reported, or measured all‐cause mortality and serious adverse events. Regarding quality of life and mental and physical fatigue, the certainty of the estimate was very low due to limitations in design and execution of included trials, and smallness of study samples. We were able to meta‐analyse data only on trial participants with non‐serious adverse events. Meta‐analysis of two trials showed no effect of acetyl‐L‐carnitine versus placebo on non‐serious adverse events. The certainty of the estimate was very low due to limitations in design and execution of included trials, smallness of sample size, and very low numbers of events. Meta‐analysis of five trials showed a reduction in blood ammonium levels favouring people receiving acetyl‐L‐carnitine. We judged the certainty of the estimate as very low due to limitations in design and execution of included trials, and smallness of study samples (summary of findings Table for the main comparison).
Overall completeness and applicability of evidence
Our analyses and conclusions are based on five single‐centre small randomised clinical trials at high risk of bias due to pitfalls in design and execution. Given this information and GRADE findings, we believe that future trials are necessary to determine, with greater certainty, the potential clinical benefits and harms of acetyl‐L‐carnitine for patients with hepatic encephalopathy. The harm profile of acetyl‐L‐carnitine remains unknown due to lack of sufficient reporting of adverse events and reactions. Regarding dealing with neutral results, one must keep in mind that 'absence of evidence' is not 'evidence of absence' (Fermi Paradox 1950; Altman 1995). The fact that this review detected no strong differences between acetyl‐L‐carnitine and placebo groups should not be interpreted as meaning that placebo therapy and acetyl‐L‐carnitine are equal. The first possible explanation is failure to achieve an appropriate sample size (Schulz 1995). Moreover, when dealing with such small numbers of participants as were randomised here, the risk that randomisation has not achieved what we want of it is substantial. Simulation studies have shown that sample sizes well over 1000 participants are needed before simple randomisation can bring what we expect: a fair and even distribution of prognostic factors among participants (Nguyen 2017).
When we assessed the results of Malaguarnera 2011b for mental or physical fatigue, we feared that study authors may have overinterpreted their results (Boutron 2010; Arunachalam 2016). It is widely recognised that subgroup analyses can produce spurious results (Brookes 2001). According to recommendations from Brookes 2001 and Sun 2014, results from any subgroup analysis should not be overinterpreted.
Although acetyl‐L‐carnitine reduced blood ammonium levels by almost 20%, it provided no apparent clinical benefit (Analysis 1.5; Table 4). A comparable phenomenon has been found with homocysteine‐lowering interventions for preventing cardiovascular events (Marti‐Carvajal 2015). Several variables have been described to explain this failure of physiological and biochemical theories to translate into benefit for patients (Heneghan 2017). The pitfalls of several biomarkers considered useful for assessing clinical benefits of interventions have been pointed out previously (Ioannidis 2017a). On the other hand, and to delve deeper into meta‐analysis on blood ammonium levels (Analysis 1.5), we found significant variation in estimated effects between trials (high statistical heterogeneity) measuring the mean difference or the ratio of means (Table 4). However, it is known that I² can be biased and inaccurate in small meta‐analyses (von Hippel 2015). Notwithstanding, Trial Sequential Analysis revealed diversity (D²) of 63% (Figure 4). Diversity is the percentage that between‐trial variability constitutes of the sum of between‐trial variability and a sampling error estimate in light of the required information size (Wetterslev 2009; Wetterslev 2017), when the required information size is not sufficiently accounted for by correction with I² (Higgins 2003). The impact of heterogeneity is shown in the wide prediction interval of differences in means (‐13.06 mg/dL, 95% confidence interval (CI) ‐25.43 to ‐0.69). Trials with low methodological quality and small sample sizes and the small number of included trials hinder determination of a potential association between a moderator variable and effect size (Hempel 2012; Hempel 2013). This is the case in meta‐analysis of acetyl‐L‐carnitine for blood ammonium levels in this Cochrane Review (Analysis 1.5).
Finally, this review found a shortage of data on harm profiles about acetyl‐L‐carnitine, which is not uncommon (Ioannidis 2009; Pitrou 2009; Storebø 2018).
Thus, overall completeness and applicability of evidence are poor due to potentially spurious findings.
Quality of the evidence
One key detail needed to understand the findings of this Cochrane Review is that the only source of evidence comprises trials conducted by the same research team. Evidence suggests that single‐centre randomised clinical trials overestimate treatment effects when compared to multi‐centre randomised clinical trials (Dechartres 2011; Unverzagt 2013). Therefore, one should assess clinical research findings from single centres with caution.
We noted that proper description of placebo was lacking in included trials. It is known that in a particular context, placebo interventions can influence patient‐reported outcomes (Hróbjartsson 2010).
We conducted GRADE assessment on outcomes of both meta‐analysed and non‐meta‐analysed trials. We determined that none of the trials provided strong evidence, primarily due to small sample sizes (even after meta‐analysis), which generate wide confidence intervals and low precision of estimates of treatment effects, along with high risk of bias due to lack of adequate randomisation methods, unclear risk of blinding, and unclear reporting of outcomes. These issues are associated with inflation of intervention effect size estimates and increments in between‐trial inconsistency among trials reporting subjectively assessed outcomes (Savovic 2012a). Missing data did not affect results related to non‐serious adverse events (Analysis 1.5).
Although four of the five included trials reported the tool used for random sequence generation, none provided details of their randomisation techniques. Furthermore, none of the trials mentioned concealment of the allocation sequence (Malaguarnera 2006; Malaguarnera 2011a; Malaguarnera 2011b; Malaguarnera 2011c). These pitfalls may not have protected against bias, given the small size of included trials (Nguyen 2017), but they may have led to downgraded quality of evidence provided by the trials included in this Cochrane Review. Thereupon, causal inference from these trials fails (Berger 2008; Backmann 2017).
We downgraded the quality of evidence emerging from a biomarker outcome (blood ammonium levels) due to limitations in design and execution, as well as inconsistency. However, sensitivity analysis by missing data shows the robustness of evidence that emerged from meta‐analysis of this outcome (Guyatt 2017). Therefore, we did not downgrade the quality of evidence for missing data.
Due to the smallness of sample sizes or the very low numbers of events that yielded imprecision with wide confidence intervals, one should interpret all estimates of treatment effect reported in this review, possibly with the exception of those related to blood ammonium levels, as potentially false positive (inflated or overestimated beneficial effects) or as potentially false negative (underestimated harms) (Gaskin 2014; Szucs 2017).
See summary of findings Table for the main comparison for a complete assessment and rationale for ratings.
Potential biases in the review process
A group of biases called 'significance‐chasing biases' includes publication bias, selective outcome reporting bias, selective analysis reporting bias, and fabrication bias (Ioannidis 2010). Publication bias represents a major threat to the validity of systematic reviews, particularly reviews that include small trials. However, this Cochrane Review has low risk of publication bias due to the meticulous trial search that was performed. Furthermore, we adhered to the recommendations for reducing play of chance or bias due to selective inclusion and reporting of outcomes and analyses in systematic reviews of randomised trials of healthcare interventions (Page 2014). We were not able to prepare a funnel plot or test for funnel plot asymmetry due to lack of trials reporting primary outcomes and inclusion of few trials in this review.
Selective outcome reporting bias operates through suppression of information about specific outcomes and has similarities to publication bias for whole studies or trials, in that ‘negative’ results remain unpublished (Ioannidis 2010). Furthermore, it has been pointed out that selective reporting practices yield trial results that are more attractive but spurious (Ioannidis 2017b). We found five trials with high risk of selective outcome reporting bias mainly due to absence of information on all‐cause mortality and serious adverse events. However, all these trials reported information on blood ammonium levels, which remain a non‐validated surrogate outcome for patient‐centred outcomes such as hepatic encephalopathy, complications, and mortality (Cochrane Hepato‐Biliary Group Module). Only when we derive data (preferably individual participant data) from randomised clinical trials reporting effects of acetyl‐L‐carnitine on both blood ammonium levels and clinical outcomes can we assess whether changes in ammonium levies can predict changes in clinical outcomes (Gluud 2007).
This Cochrane Review has identified the following issues, which should be considered in planning of future trials: lack of information concerning all‐cause mortality and adverse events, and paucity of information on quality of life and fatigue, whether mental or physical. Differences in definitions of outcomes and inconsistency of reported outcomes must be avoided. Trials should adopt an agreed upon set of core outcomes for each medical condition (Clarke 2007). This approach may reduce the impact of outcome reporting bias (Kirkham 2010; Dwan 2013).
The impact of outcome reporting bias may be reduced by adopting the recommendations of the Patient‐Centered Outcomes Research Institute (PCORI) (Fleurence 2015). This organisation was established by the US Congress as an independent, non‐profit organisation, created to conduct research that provides information about the best available evidence, to help patients and their healthcare providers make more informed decisions. PCORI research is intended to enhance patient understanding of available prevention, treatment, and care options, as well as the science that supports these options (Selby 2014).
Agreements and disagreements with other studies or reviews
Our findings differ from those of a non‐Cochrane review and meta‐analysis published in 2013 (Jiang 2013). First, we conducted our systematic review based on a peer‐reviewed published protocol for the systematic review. Jiang and colleagues did not base their review on a published or unpublished protocol (Jiang 2013). Second, we assessed both orally and intravenously administered acetyl‐L‐carnitine, but Jiang 2013 included only trials assessing oral acetyl‐L‐carnitine and another compound. Third, Jiang 2013 included trials assessing acetyl‐L‐carnitine or L‐carnitine, and we included only trials assessing acetyl‐L‐carnitine. However, Jiang 2013 was explicit in its inclusion criteria for the intervention ‐ "RCTs compared oral acetyl‐L‐carnitine to placebo". Confusion seems related to the fact that acetyl‐L‐carnitine is not the same as L‐carnitine. Fourth, Jiang 2013 conducted assessment of risk of bias using Jadad's scale, and we assessed eight bias domains. Fifth, Jiang 2013 did not mention which were their primary or secondary outcomes. Sixth, Jiang 2013 did not report information about all‐cause mortality and adverse events. Thus, we found different results compared to Jiang 2013. This could be explained by differences in perspectives, goals, and constraints between Jiang 2013 and the present Cochrane systematic review (Saldanha 2017). However, both reviews found a paucity of information on adverse events. For this Cochrane Review, FDA 2016 presented a similar opinion as for Jiang 2013: "The general conclusion of the analysis is that acetyl‐L‐carnitine was effective in reducing serum ammonia levels. However, there were no outcomes that suggested the clinical meaningfulness of a mean reduction of serum ammonia by 26 mg/dL. No conclusions were drawn regarding the consistency of secondary outcomes" (FDA 2016).
Study flow diagram for 10 August 2018.
Risk of bias graph: review authors' judgements about each risk of bias item presented as percentages across all included studies.
Risk of bias summary: review authors' judgements about each risk of bias item for each included study.
Trial Sequential Analysis of five trials comparing acetyl‐L‐carnitine versus placebo on blood ammonium levels in participants with hepatic encephalopathy.
Trial Sequential Analysis of five trials comparing acetyl‐L‐carnitine versus placebo on blood ammonium levels in participants with hepatic encephalopathy based on the diversity‐adjusted required information size (DARIS) of 406 participants. This DARIS was calculated based upon a mean relevant difference of 10 mg; a variance of 263; an alpha (α) of 1.25%; and a beta (β) of 10%. The cumulative Z‐curve (blue line) crossed the conventional alpha of 1.25% (green line) after three trials. This implies that there is not a random error. The cumulative Z‐curve (blue line) surpassed the continuous alpha‐spending boundary (monitoring efficacy boundary) after four trials. Presently, 95.3% (387/406) of the DARIS has been obtained.
Malaguarnera 2011b measured twice blood ammonium level with mild or moderate hepatic encephalopathy.
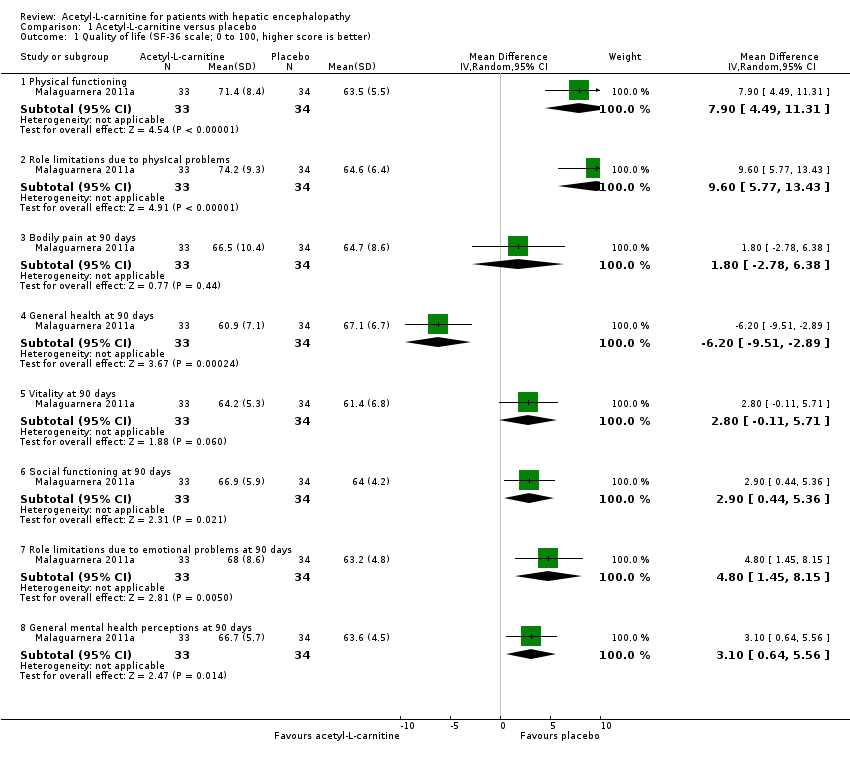
Comparison 1 Acetyl‐L‐carnitine versus placebo, Outcome 1 Quality of life (SF‐36 scale; 0 to 100, higher score is better).

Comparison 1 Acetyl‐L‐carnitine versus placebo, Outcome 2 Non‐serious adverse events.

Comparison 1 Acetyl‐L‐carnitine versus placebo, Outcome 3 Non‐serious adverse events (sensitivity analysis by missing data).

Comparison 1 Acetyl‐L‐carnitine versus placebo, Outcome 4 Fatigue (the Wessely and Powell test).

Comparison 1 Acetyl‐L‐carnitine versus placebo, Outcome 5 Blood ammonium levels.

Comparison 1 Acetyl‐L‐carnitine versus placebo, Outcome 6 Blood ammonium levels (sensitivity analysis according to missing data).
| Acetyl‐L‐carnitine compared with placebo for patients with hepatic encephalopathy | ||||||
| Patient or population: patients with covert or overt hepatic encephalopathy | ||||||
| Outcomes | Illustrative comparative risks* (95% CI) | Relative effect | No. of participants | Quality of the evidence | Comments | |
| Assumed risk | Corresponding risk | |||||
| Placebo | Acetyl‐L‐carnitine | |||||
| All‐cause mortality | See comment | See comment | Not estimable | 0 | See comment | No trial reported this outcome |
| Quality of life (general health at 90 days) | Mean quality of life in the control groups was | Mean quality of life in the intervention groups was | ‐ | 67 | ⊕⊝⊝⊝ |
|
| Serious adverse events | See comment | See comment | Not estimable | 0 | See comment | No trial reported this outcome |
| Fatigue Scale from 0 to 10 Physical fatigue Wessely and Powell test from 0 (no fatigue) to 16 (highest possible fatigue) | Mean mental fatigue in the control groups was | Mean fatigue in the intervention groups was | ‐ | 121 | ⊕⊝⊝⊝ |
MD was assessed with fixed‐effect or random‐effects models |
| Non‐serious adverse events | 25 per 1000f | 63 per 1000 | RR 2.51 | 246 | ⊕⊝⊝⊝ | |
| Days of hospitalisation | See comment | See comment | Not estimable | 0 | See comment | No trial reported this outcome |
| Blood ammonium levels | Mean blood ammonium levels in the control groups was | Mean blood ammonium levels in the intervention groups was | ‐ | 387 | ⊕⊕⊝⊝ | |
| *The basis for the assumed risk (e.g. the median control group risk across studies) is provided in footnotes. The corresponding risk (and its 95% confidence interval) is based on the assumed risk in the comparison group and the relative effect of the intervention (and its 95% CI). | ||||||
| GRADE Working Group grades of evidence. | ||||||
| aFor mental health domain. | ||||||
| Domain (SF‐36 scale; 0 to 100, higher score is better) | Mean difference (95% CI) | Ratio of means (95% CI) |
| Physical functioning | 7.90 | 1.12 |
| Role limitations due to physIcal problems | 9.60 | 1.15 |
| Bodily pain at 90 days | 1.80 | 1.03 |
| General health at 90 days | ‐6.20 (‐9.51 to ‐2.89) | 0.91 (0.86 to 0.96) |
| Vitality at 90 days | 2.80 (‐0.11 to 5.71) | 1.05 (1.00 to 1.10) |
| Social functioning at 90 days | 2.90 | 1.05 (1.01 to 1.08) |
| Role limitations due to emotional problems at 90 days | 4.80 (1.45 to 8.15) | 1.08 (1.02 to 1.13) |
| General mental health perceptions at 90 days | 3.10 (0.64 to 5.56) | 1.05 |
| SF‐36: Short Form‐36. | ||
| Trial | Adverse events |
| "No side effects were observed in our study series" | |
| "In the group treated with acetyl‐L‐carnitine, one patient complained of nausea, two of slight headache and two of abdominal pain. In the placebo group, one patient complained | |
| Researchers did not report on adverse events | |
| "Three patients in the acetyl‐L‐carnitine group (1 with mild hepatic encephalopathy and 2 with moderate hepatic encephalopathy) withdrew from the study because of abdominal pain. One patient in the placebo group withdrew from the study because of headache. In the placebo group, we observed occasional abdominal pain, cramping, diarrhoea, and flatulence. At follow‐up 1 mo after treatment ended, 2 patients in the acetyl‐L‐carnitine group and 5 patients in the placebo group experienced moderate hepatic encephalopathy" | |
| Researchers did not report on adverse events |
| Type of fatigue by hepatic encephalopathy | Fatigue (the Wessely and Powell test)b,c | |
| Mean difference (95% CI) | Ratio of means (95% CI) | |
| Mental fatigue in people with mild hepatic encephalopathy (0 (no fatigue) to 10 (highest possible))a | ‐0.80 (‐1.48 to ‐0.12) | 0.88 (0.78, to 0.98) |
| Mental fatigue in people with moderate hepatic encephalopathy (0 (no fatigue) to 10 (highest possible))a | 0.40 (‐0.21 to 1.01) | 1.07 (0.97 to 1.18) |
| Physical fatigue in people with mild hepatic encephalopathy (0 (no fatigue) to 16 (highest possible))a | 0.20 (‐0.72 to 1.12) | 1.02 (0.93 to 1.13) |
| Physical fatigue in people with moderate hepatic encephalopathy (0 (no fatigue) to 16 (highest possible))a | ‐0.20 (‐0.92 to 0.52) | 0.98 (0.90 to 1.06) |
| Type of hepatic encephalopathy | Acetyl‐L‐carnitine sample size | Placebo sample size | Blood ammonium levels | |
| Mean difference, mg/dL (95% CI) | Ratio of means (95% CI) | |||
| Mild hepatic encephalopathya | 31 | 30 | ‐13.00 | 0.81 |
| Moderate hepatic encephalopathya | 30 | 30 | ‐11.30 | 0.88 |
| Hepatic comab | 13 | 11 | ‐4.10 | 0.94 |
| Minimal hepatic encephalopathyc,d Subtotal (95% CI) | 60 | 55 | ‐21.90 | 0.66 |
| 33 | 34 | ‐16.70 | 0.72 | |
| 93 | 89 | ‐17.46 | 0.70 | |
| Severe hepatic encephalopathye | 30 | 30 | ‐13.80 | 0.86 |
| Total (95% CI) | 197 | 190 | ‐13.06 | 0.82 I²= 78% |
| Outcome or subgroup title | No. of studies | No. of participants | Statistical method | Effect size |
| 1 Quality of life (SF‐36 scale; 0 to 100, higher score is better) Show forest plot | 1 | Mean Difference (IV, Random, 95% CI) | Subtotals only | |
| 1.1 Physical functioning | 1 | 67 | Mean Difference (IV, Random, 95% CI) | 7.90 [4.49, 11.31] |
| 1.2 Role limitations due to physIcal problems | 1 | 67 | Mean Difference (IV, Random, 95% CI) | 9.60 [5.77, 13.43] |
| 1.3 Bodily pain at 90 days | 1 | 67 | Mean Difference (IV, Random, 95% CI) | 1.80 [‐2.78, 6.38] |
| 1.4 General health at 90 days | 1 | 67 | Mean Difference (IV, Random, 95% CI) | ‐6.20 [‐9.51, ‐2.89] |
| 1.5 Vitality at 90 days | 1 | 67 | Mean Difference (IV, Random, 95% CI) | 2.80 [‐0.11, 5.71] |
| 1.6 Social functioning at 90 days | 1 | 67 | Mean Difference (IV, Random, 95% CI) | 2.90 [0.44, 5.36] |
| 1.7 Role limitations due to emotional problems at 90 days | 1 | 67 | Mean Difference (IV, Random, 95% CI) | 4.80 [1.45, 8.15] |
| 1.8 General mental health perceptions at 90 days | 1 | 67 | Mean Difference (IV, Random, 95% CI) | 3.10 [0.64, 5.56] |
| 2 Non‐serious adverse events Show forest plot | 2 | 246 | Risk Ratio (M‐H, Random, 95% CI) | 2.51 [0.68, 9.22] |
| 3 Non‐serious adverse events (sensitivity analysis by missing data) Show forest plot | 2 | Risk Ratio (Random, 95% CI) | Subtotals only | |
| 3.1 Available case analysis | 2 | Risk Ratio (Random, 95% CI) | 2.50 [0.68, 9.16] | |
| 3.2 Best‐case scenario | 2 | Risk Ratio (Random, 95% CI) | 0.97 [0.28, 3.40] | |
| 3.3 Worst‐case scenario | 2 | Risk Ratio (Random, 95% CI) | 4.93 [1.48, 16.47] | |
| 3.4 Gamble‐Hollis analysis | 2 | Risk Ratio (Random, 95% CI) | 2.57 [0.48, 13.74] | |
| 3.5 Informative missingness odds ratio (OR = 2) | 2 | Risk Ratio (Random, 95% CI) | 2.51 [0.69, 9.17] | |
| 4 Fatigue (the Wessely and Powell test) Show forest plot | 1 | Mean Difference (IV, Random, 95% CI) | Subtotals only | |
| 4.1 Mental fatigue in people with mild hepatic encephalopathy (0 (no fatigue) to 10 (highest possible)) | 1 | 61 | Mean Difference (IV, Random, 95% CI) | ‐0.80 [‐1.48, ‐0.12] |
| 4.2 Mental fatigue in people with moderate hepatic encephalopathy (0 (no fatigue) to 10 (highest possible)) | 1 | 61 | Mean Difference (IV, Random, 95% CI) | 0.40 [‐0.21, 1.01] |
| 4.3 Physical fatigue in people with mild hepatic encephalopathy (0 (no fatigue) to 16 (highest possible)) | 1 | 61 | Mean Difference (IV, Random, 95% CI) | 0.20 [‐0.72, 1.12] |
| 4.4 Physical fatigue in people with moderate hepatic encephalopathy (0 (no fatigue) to 16 (highest possible)) | 1 | 61 | Mean Difference (IV, Random, 95% CI) | ‐0.20 [‐0.92, 0.52] |
| 5 Blood ammonium levels Show forest plot | 5 | 387 | Mean Difference (IV, Random, 95% CI) | ‐13.06 [‐17.24, ‐8.89] |
| 5.1 Mild hepatic encephalopathy | 1 | 61 | Mean Difference (IV, Random, 95% CI) | ‐13.00 [‐18.17, ‐7.83] |
| 5.2 Moderate hepatic encephalopathy | 1 | 60 | Mean Difference (IV, Random, 95% CI) | ‐11.30 [‐19.05, ‐3.55] |
| 5.3 Hepatic coma | 1 | 24 | Mean Difference (IV, Random, 95% CI) | ‐4.10 [‐10.77, 2.57] |
| 5.4 Minimal hepatic encephalopathy | 2 | 182 | Mean Difference (IV, Random, 95% CI) | ‐17.46 [‐21.63, ‐13.28] |
| 5.5 Severe hepatic encephalopathy | 1 | 60 | Mean Difference (IV, Random, 95% CI) | ‐13.80 [‐20.78, ‐6.82] |
| 6 Blood ammonium levels (sensitivity analysis according to missing data) Show forest plot | 5 | Mean Difference (IV, Random, 95% CI) | Subtotals only | |
| 6.1 Complete case analysis | 5 | 327 | Mean Difference (IV, Random, 95% CI) | ‐13.40 [‐18.31, ‐8.48] |
| 6.2 Strategy 1 | 5 | 342 | Mean Difference (IV, Random, 95% CI) | ‐12.88 [‐17.69, ‐8.06] |
| 6.3 Strategy 2 | 5 | 342 | Mean Difference (IV, Random, 95% CI) | ‐14.70 [‐20.23, ‐9.16] |
| 6.4 Strategy 3 | 5 | 342 | Mean Difference (IV, Random, 95% CI) | ‐14.06 [‐19.50, ‐8.62] |
| 6.5 Strategy 4 | 5 | 342 | Mean Difference (IV, Random, 95% CI) | ‐13.79 [‐18.99, ‐8.58] |