Acetyl‐L‐carnitine for patients with hepatic encephalopathy
Information
- DOI:
- https://doi.org/10.1002/14651858.CD011451.pub2Copy DOI

- Database:
-
- Cochrane Database of Systematic Reviews
- Version published:
-
- 05 January 2019see what's new
- Type:
-
- Intervention
- Stage:
-
- Review
- Cochrane Editorial Group:
-
Cochrane Hepato-Biliary Group
- Copyright:
-
- Copyright © 2019 The Cochrane Collaboration. Published by John Wiley & Sons, Ltd.
Article metrics
Altmetric:
Cited by:
Authors
Contributions of authors
Arturo Marti‐Carvajal drafted the review.
Christian Gluud revised the review.
Ingrid Arévalo Rodríguez revised the review and checked Risk of bias in included studies, Characteristics of included studies, and Characteristics of excluded studies,
Cristina Martí‐Amarista checked double‐entry data and Risk of bias in included studies, Characteristics of included studies, and Characteristics of excluded studies.
All review authors approved this systematic review for publication.
Sources of support
Internal sources
-
No sources of support supplied
External sources
-
Cochrane Hepato‐Biliary Group, Denmark.
Academic and financial
-
Iberoamerican Cochrane Centre, Spain.
Academic
Declarations of interest
In 2004 and 2007, Arturo Martí‐Carvajal was employed by Eli Lilly to run a four‐hour workshop on "How to critically appraise clinical trials on osteoporosis and how to teach this". This activity was not related to Arturo Martí‐Carvajal's work with The Cochrane Collaboration or any other Cochrane Review.
Christian Gluud: none known.
Ingrid Arevalo‐Rodriguez: none known. However, see "Acknowledements".
Cristina Martí‐Amarista: none known.
Acknowledgements
The review authors express gratitude to:
-
Sarah Louise Klingenberg of the Cochrane Hepato‐Biliary Group for preparing the search strategies; and
-
Dimitrinka Nikolova of the Cochrane Hepato‐Biliary Group for improving the quality of this Cochrane Review through her excellent questions and revisions.
Ingrid Arevalo‐Rodriguez is funded by a Sara Borrell contract from the Instituto de Salud Carlos III (CD17/00219; Acción Estrategica en Salud 2013‐2016, co‐funded by European Social Fund 2014‐2020, "Investing in your future").
Peer reviewers: Kapil Kumar Sharma, India; one peer reviewer who wishes to remain anonymous.
Contact editor: Janus Christian Jakobsen, Denmark.
Cochrane Review Group funding acknowledgement: The Danish State is the largest single funder of the Cochrane Hepato‐Biliary Group through its investment in the Copenhagen Trial Unit, Centre for Clinical Intervention Research, Rigshospitalet, Copenhagen University Hospital, Denmark.
Disclaimer: The views and opinions expressed in this review are those of the authors and do not necessarily reflect those of the Danish State or the Copenhagen Trial Unit.
Version history
| Published | Title | Stage | Authors | Version |
| 2019 Jan 05 | Acetyl‐L‐carnitine for patients with hepatic encephalopathy | Review | Arturo J Martí‐Carvajal, Christian Gluud, Ingrid Arevalo‐Rodriguez, Cristina Elena Martí‐Amarista | |
| 2014 Dec 30 | Acetyl‐L‐carnitine for patients with hepatic encephalopathy | Protocol | Arturo J Martí‐Carvajal, Christian Gluud, Ingrid Arevalo‐Rodriguez | |
Differences between protocol and review
-
We added 'Fatigue' because it is an important disability among people with hepatic encephalopathy
-
We were not able to search the Chinese BioMedical Database, Traditional Chinese Medical Literature Analysis and Retrieval System, China National Knowledge Infrastructure, Chinese VIP Information, Chinese Academic Conference Papers Database, and Chinese Dissertation Database
-
We adapted Trial Sequential Analysis to the recommendations described in Wetterslev 2017
-
We searched the Food and Drug Administraion and European Medicines Agency web sites for unpublished trials
-
We updated definitions in the assessment of risk of bias regarding 'Blinding of participants, personnel, and outcome assessors' according to hbg.cochrane.org/information‐authors
-
We included the threshold for clinical relevance as Bayes factor
-
We included estimations of prediction intervals
-
We added estimations of ratio of means
-
We added sensitivity analysis by missing data to improve information on non‐serious adverse events and blood ammonium levels, although these are secondary outcomes
Keywords
MeSH
Medical Subject Headings (MeSH) Keywords
Medical Subject Headings Check Words
Female; Humans; Male; Middle Aged;
PICOs
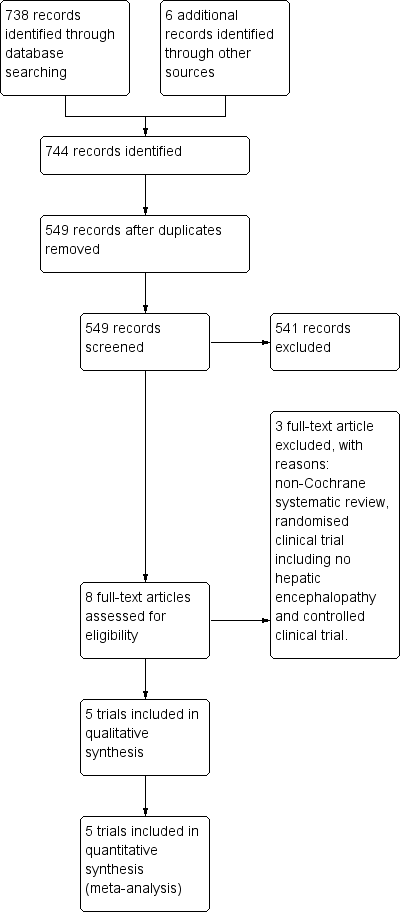
Study flow diagram for 10 August 2018.
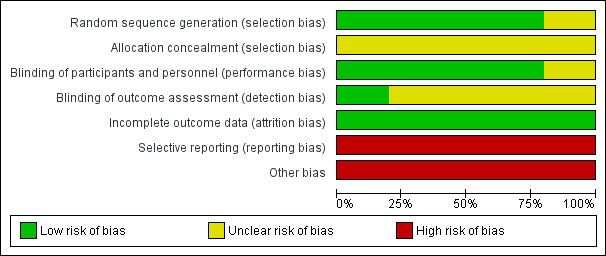
Risk of bias graph: review authors' judgements about each risk of bias item presented as percentages across all included studies.
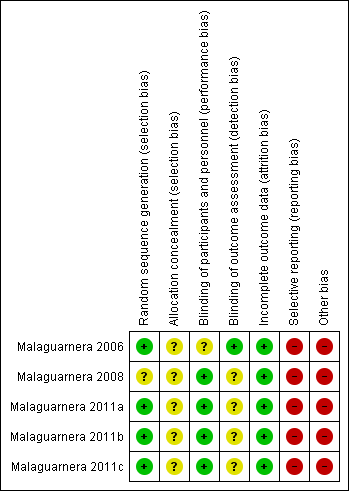
Risk of bias summary: review authors' judgements about each risk of bias item for each included study.
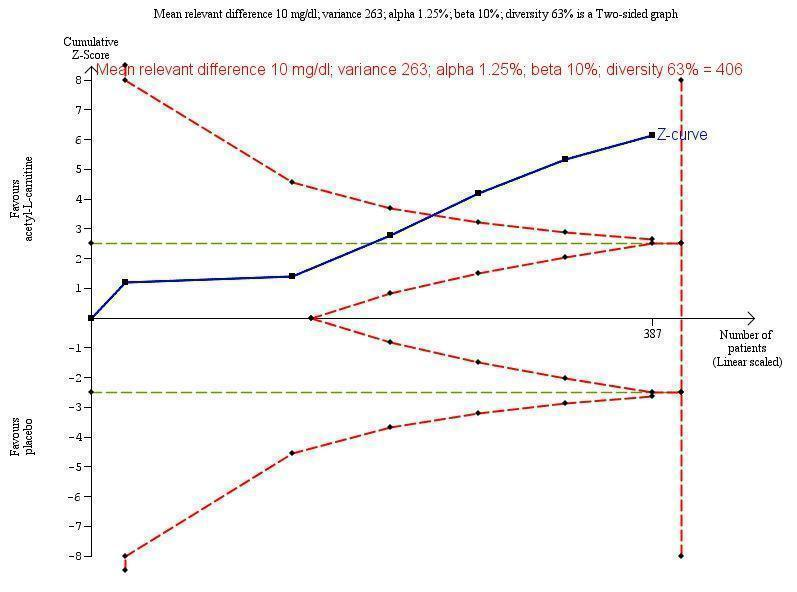
Trial Sequential Analysis of five trials comparing acetyl‐L‐carnitine versus placebo on blood ammonium levels in participants with hepatic encephalopathy.
Trial Sequential Analysis of five trials comparing acetyl‐L‐carnitine versus placebo on blood ammonium levels in participants with hepatic encephalopathy based on the diversity‐adjusted required information size (DARIS) of 406 participants. This DARIS was calculated based upon a mean relevant difference of 10 mg; a variance of 263; an alpha (α) of 1.25%; and a beta (β) of 10%. The cumulative Z‐curve (blue line) crossed the conventional alpha of 1.25% (green line) after three trials. This implies that there is not a random error. The cumulative Z‐curve (blue line) surpassed the continuous alpha‐spending boundary (monitoring efficacy boundary) after four trials. Presently, 95.3% (387/406) of the DARIS has been obtained.
Malaguarnera 2011b measured twice blood ammonium level with mild or moderate hepatic encephalopathy.
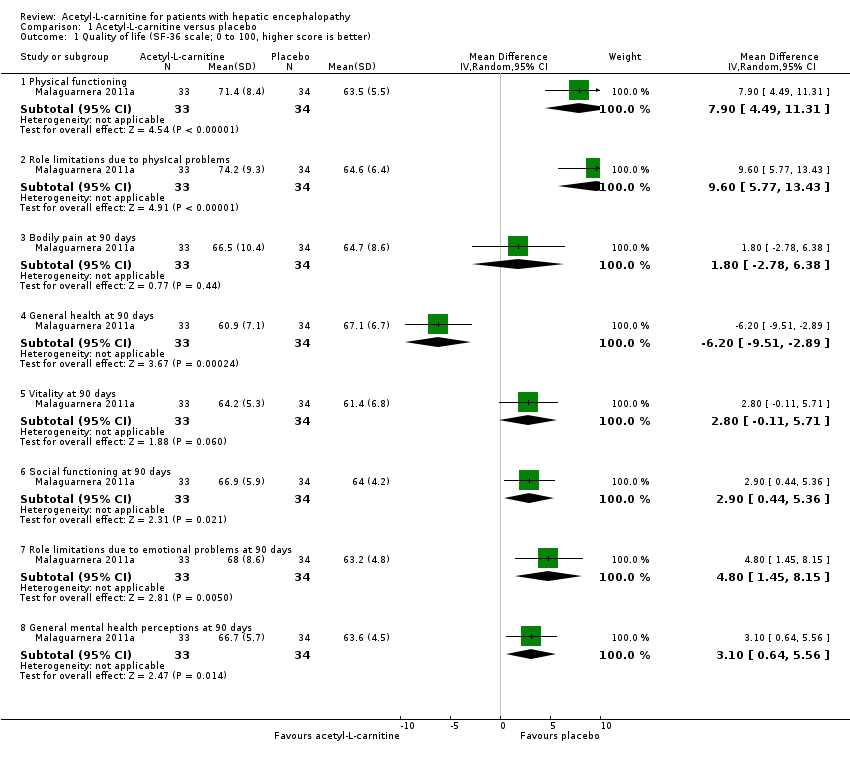
Comparison 1 Acetyl‐L‐carnitine versus placebo, Outcome 1 Quality of life (SF‐36 scale; 0 to 100, higher score is better).

Comparison 1 Acetyl‐L‐carnitine versus placebo, Outcome 2 Non‐serious adverse events.

Comparison 1 Acetyl‐L‐carnitine versus placebo, Outcome 3 Non‐serious adverse events (sensitivity analysis by missing data).

Comparison 1 Acetyl‐L‐carnitine versus placebo, Outcome 4 Fatigue (the Wessely and Powell test).

Comparison 1 Acetyl‐L‐carnitine versus placebo, Outcome 5 Blood ammonium levels.

Comparison 1 Acetyl‐L‐carnitine versus placebo, Outcome 6 Blood ammonium levels (sensitivity analysis according to missing data).
| Acetyl‐L‐carnitine compared with placebo for patients with hepatic encephalopathy | ||||||
| Patient or population: patients with covert or overt hepatic encephalopathy | ||||||
| Outcomes | Illustrative comparative risks* (95% CI) | Relative effect | No. of participants | Quality of the evidence | Comments | |
| Assumed risk | Corresponding risk | |||||
| Placebo | Acetyl‐L‐carnitine | |||||
| All‐cause mortality | See comment | See comment | Not estimable | 0 | See comment | No trial reported this outcome |
| Quality of life (general health at 90 days) | Mean quality of life in the control groups was | Mean quality of life in the intervention groups was | ‐ | 67 | ⊕⊝⊝⊝ |
|
| Serious adverse events | See comment | See comment | Not estimable | 0 | See comment | No trial reported this outcome |
| Fatigue Scale from 0 to 10 Physical fatigue Wessely and Powell test from 0 (no fatigue) to 16 (highest possible fatigue) | Mean mental fatigue in the control groups was | Mean fatigue in the intervention groups was | ‐ | 121 | ⊕⊝⊝⊝ |
MD was assessed with fixed‐effect or random‐effects models |
| Non‐serious adverse events | 25 per 1000f | 63 per 1000 | RR 2.51 | 246 | ⊕⊝⊝⊝ | |
| Days of hospitalisation | See comment | See comment | Not estimable | 0 | See comment | No trial reported this outcome |
| Blood ammonium levels | Mean blood ammonium levels in the control groups was | Mean blood ammonium levels in the intervention groups was | ‐ | 387 | ⊕⊕⊝⊝ | |
| *The basis for the assumed risk (e.g. the median control group risk across studies) is provided in footnotes. The corresponding risk (and its 95% confidence interval) is based on the assumed risk in the comparison group and the relative effect of the intervention (and its 95% CI). | ||||||
| GRADE Working Group grades of evidence. | ||||||
| aFor mental health domain. | ||||||
| Domain (SF‐36 scale; 0 to 100, higher score is better) | Mean difference (95% CI) | Ratio of means (95% CI) |
| Physical functioning | 7.90 | 1.12 |
| Role limitations due to physIcal problems | 9.60 | 1.15 |
| Bodily pain at 90 days | 1.80 | 1.03 |
| General health at 90 days | ‐6.20 (‐9.51 to ‐2.89) | 0.91 (0.86 to 0.96) |
| Vitality at 90 days | 2.80 (‐0.11 to 5.71) | 1.05 (1.00 to 1.10) |
| Social functioning at 90 days | 2.90 | 1.05 (1.01 to 1.08) |
| Role limitations due to emotional problems at 90 days | 4.80 (1.45 to 8.15) | 1.08 (1.02 to 1.13) |
| General mental health perceptions at 90 days | 3.10 (0.64 to 5.56) | 1.05 |
| SF‐36: Short Form‐36. | ||
| Trial | Adverse events |
| "No side effects were observed in our study series" | |
| "In the group treated with acetyl‐L‐carnitine, one patient complained of nausea, two of slight headache and two of abdominal pain. In the placebo group, one patient complained | |
| Researchers did not report on adverse events | |
| "Three patients in the acetyl‐L‐carnitine group (1 with mild hepatic encephalopathy and 2 with moderate hepatic encephalopathy) withdrew from the study because of abdominal pain. One patient in the placebo group withdrew from the study because of headache. In the placebo group, we observed occasional abdominal pain, cramping, diarrhoea, and flatulence. At follow‐up 1 mo after treatment ended, 2 patients in the acetyl‐L‐carnitine group and 5 patients in the placebo group experienced moderate hepatic encephalopathy" | |
| Researchers did not report on adverse events |
| Type of fatigue by hepatic encephalopathy | Fatigue (the Wessely and Powell test)b,c | |
| Mean difference (95% CI) | Ratio of means (95% CI) | |
| Mental fatigue in people with mild hepatic encephalopathy (0 (no fatigue) to 10 (highest possible))a | ‐0.80 (‐1.48 to ‐0.12) | 0.88 (0.78, to 0.98) |
| Mental fatigue in people with moderate hepatic encephalopathy (0 (no fatigue) to 10 (highest possible))a | 0.40 (‐0.21 to 1.01) | 1.07 (0.97 to 1.18) |
| Physical fatigue in people with mild hepatic encephalopathy (0 (no fatigue) to 16 (highest possible))a | 0.20 (‐0.72 to 1.12) | 1.02 (0.93 to 1.13) |
| Physical fatigue in people with moderate hepatic encephalopathy (0 (no fatigue) to 16 (highest possible))a | ‐0.20 (‐0.92 to 0.52) | 0.98 (0.90 to 1.06) |
| Type of hepatic encephalopathy | Acetyl‐L‐carnitine sample size | Placebo sample size | Blood ammonium levels | |
| Mean difference, mg/dL (95% CI) | Ratio of means (95% CI) | |||
| Mild hepatic encephalopathya | 31 | 30 | ‐13.00 | 0.81 |
| Moderate hepatic encephalopathya | 30 | 30 | ‐11.30 | 0.88 |
| Hepatic comab | 13 | 11 | ‐4.10 | 0.94 |
| Minimal hepatic encephalopathyc,d Subtotal (95% CI) | 60 | 55 | ‐21.90 | 0.66 |
| 33 | 34 | ‐16.70 | 0.72 | |
| 93 | 89 | ‐17.46 | 0.70 | |
| Severe hepatic encephalopathye | 30 | 30 | ‐13.80 | 0.86 |
| Total (95% CI) | 197 | 190 | ‐13.06 | 0.82 I²= 78% |
| Outcome or subgroup title | No. of studies | No. of participants | Statistical method | Effect size |
| 1 Quality of life (SF‐36 scale; 0 to 100, higher score is better) Show forest plot | 1 | Mean Difference (IV, Random, 95% CI) | Subtotals only | |
| 1.1 Physical functioning | 1 | 67 | Mean Difference (IV, Random, 95% CI) | 7.90 [4.49, 11.31] |
| 1.2 Role limitations due to physIcal problems | 1 | 67 | Mean Difference (IV, Random, 95% CI) | 9.60 [5.77, 13.43] |
| 1.3 Bodily pain at 90 days | 1 | 67 | Mean Difference (IV, Random, 95% CI) | 1.80 [‐2.78, 6.38] |
| 1.4 General health at 90 days | 1 | 67 | Mean Difference (IV, Random, 95% CI) | ‐6.20 [‐9.51, ‐2.89] |
| 1.5 Vitality at 90 days | 1 | 67 | Mean Difference (IV, Random, 95% CI) | 2.80 [‐0.11, 5.71] |
| 1.6 Social functioning at 90 days | 1 | 67 | Mean Difference (IV, Random, 95% CI) | 2.90 [0.44, 5.36] |
| 1.7 Role limitations due to emotional problems at 90 days | 1 | 67 | Mean Difference (IV, Random, 95% CI) | 4.80 [1.45, 8.15] |
| 1.8 General mental health perceptions at 90 days | 1 | 67 | Mean Difference (IV, Random, 95% CI) | 3.10 [0.64, 5.56] |
| 2 Non‐serious adverse events Show forest plot | 2 | 246 | Risk Ratio (M‐H, Random, 95% CI) | 2.51 [0.68, 9.22] |
| 3 Non‐serious adverse events (sensitivity analysis by missing data) Show forest plot | 2 | Risk Ratio (Random, 95% CI) | Subtotals only | |
| 3.1 Available case analysis | 2 | Risk Ratio (Random, 95% CI) | 2.50 [0.68, 9.16] | |
| 3.2 Best‐case scenario | 2 | Risk Ratio (Random, 95% CI) | 0.97 [0.28, 3.40] | |
| 3.3 Worst‐case scenario | 2 | Risk Ratio (Random, 95% CI) | 4.93 [1.48, 16.47] | |
| 3.4 Gamble‐Hollis analysis | 2 | Risk Ratio (Random, 95% CI) | 2.57 [0.48, 13.74] | |
| 3.5 Informative missingness odds ratio (OR = 2) | 2 | Risk Ratio (Random, 95% CI) | 2.51 [0.69, 9.17] | |
| 4 Fatigue (the Wessely and Powell test) Show forest plot | 1 | Mean Difference (IV, Random, 95% CI) | Subtotals only | |
| 4.1 Mental fatigue in people with mild hepatic encephalopathy (0 (no fatigue) to 10 (highest possible)) | 1 | 61 | Mean Difference (IV, Random, 95% CI) | ‐0.80 [‐1.48, ‐0.12] |
| 4.2 Mental fatigue in people with moderate hepatic encephalopathy (0 (no fatigue) to 10 (highest possible)) | 1 | 61 | Mean Difference (IV, Random, 95% CI) | 0.40 [‐0.21, 1.01] |
| 4.3 Physical fatigue in people with mild hepatic encephalopathy (0 (no fatigue) to 16 (highest possible)) | 1 | 61 | Mean Difference (IV, Random, 95% CI) | 0.20 [‐0.72, 1.12] |
| 4.4 Physical fatigue in people with moderate hepatic encephalopathy (0 (no fatigue) to 16 (highest possible)) | 1 | 61 | Mean Difference (IV, Random, 95% CI) | ‐0.20 [‐0.92, 0.52] |
| 5 Blood ammonium levels Show forest plot | 5 | 387 | Mean Difference (IV, Random, 95% CI) | ‐13.06 [‐17.24, ‐8.89] |
| 5.1 Mild hepatic encephalopathy | 1 | 61 | Mean Difference (IV, Random, 95% CI) | ‐13.00 [‐18.17, ‐7.83] |
| 5.2 Moderate hepatic encephalopathy | 1 | 60 | Mean Difference (IV, Random, 95% CI) | ‐11.30 [‐19.05, ‐3.55] |
| 5.3 Hepatic coma | 1 | 24 | Mean Difference (IV, Random, 95% CI) | ‐4.10 [‐10.77, 2.57] |
| 5.4 Minimal hepatic encephalopathy | 2 | 182 | Mean Difference (IV, Random, 95% CI) | ‐17.46 [‐21.63, ‐13.28] |
| 5.5 Severe hepatic encephalopathy | 1 | 60 | Mean Difference (IV, Random, 95% CI) | ‐13.80 [‐20.78, ‐6.82] |
| 6 Blood ammonium levels (sensitivity analysis according to missing data) Show forest plot | 5 | Mean Difference (IV, Random, 95% CI) | Subtotals only | |
| 6.1 Complete case analysis | 5 | 327 | Mean Difference (IV, Random, 95% CI) | ‐13.40 [‐18.31, ‐8.48] |
| 6.2 Strategy 1 | 5 | 342 | Mean Difference (IV, Random, 95% CI) | ‐12.88 [‐17.69, ‐8.06] |
| 6.3 Strategy 2 | 5 | 342 | Mean Difference (IV, Random, 95% CI) | ‐14.70 [‐20.23, ‐9.16] |
| 6.4 Strategy 3 | 5 | 342 | Mean Difference (IV, Random, 95% CI) | ‐14.06 [‐19.50, ‐8.62] |
| 6.5 Strategy 4 | 5 | 342 | Mean Difference (IV, Random, 95% CI) | ‐13.79 [‐18.99, ‐8.58] |