| 1 Quality of life (SF‐36 scale; 0 to 100, higher score is better) Show forest plot | 1 | | Mean Difference (IV, Random, 95% CI) | Subtotals only |
|
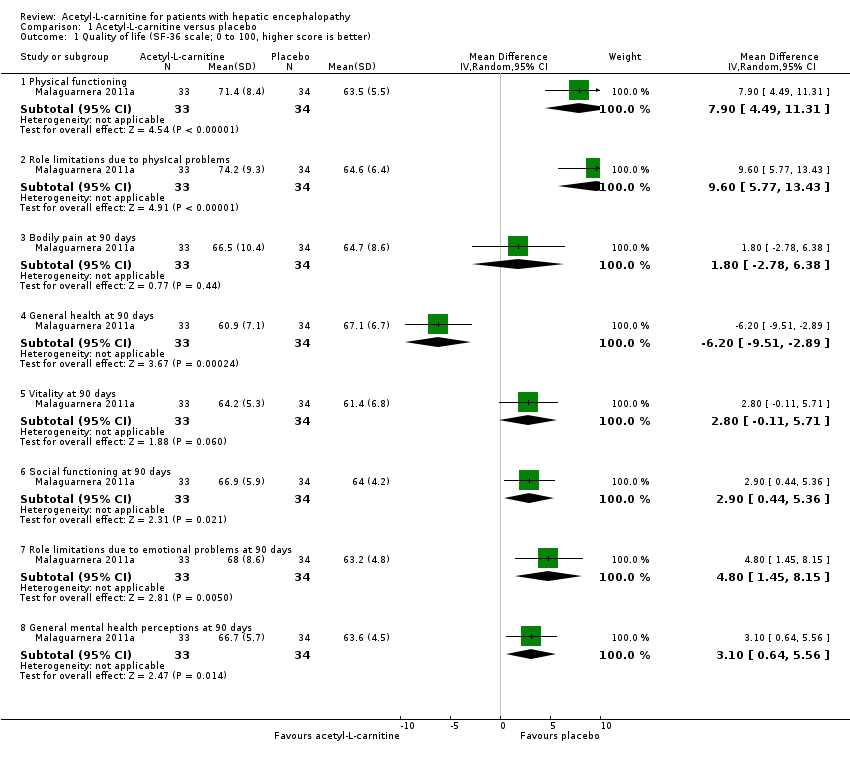
| 1.1 Physical functioning | 1 | 67 | Mean Difference (IV, Random, 95% CI) | 7.90 [4.49, 11.31] |
| 1.2 Role limitations due to physIcal problems | 1 | 67 | Mean Difference (IV, Random, 95% CI) | 9.60 [5.77, 13.43] |
| 1.3 Bodily pain at 90 days | 1 | 67 | Mean Difference (IV, Random, 95% CI) | 1.80 [‐2.78, 6.38] |
| 1.4 General health at 90 days | 1 | 67 | Mean Difference (IV, Random, 95% CI) | ‐6.20 [‐9.51, ‐2.89] |
| 1.5 Vitality at 90 days | 1 | 67 | Mean Difference (IV, Random, 95% CI) | 2.80 [‐0.11, 5.71] |
| 1.6 Social functioning at 90 days | 1 | 67 | Mean Difference (IV, Random, 95% CI) | 2.90 [0.44, 5.36] |
| 1.7 Role limitations due to emotional problems at 90 days | 1 | 67 | Mean Difference (IV, Random, 95% CI) | 4.80 [1.45, 8.15] |
| 1.8 General mental health perceptions at 90 days | 1 | 67 | Mean Difference (IV, Random, 95% CI) | 3.10 [0.64, 5.56] |
| 2 Non‐serious adverse events Show forest plot | 2 | 246 | Risk Ratio (M‐H, Random, 95% CI) | 2.51 [0.68, 9.22] |
|
| 3 Non‐serious adverse events (sensitivity analysis by missing data) Show forest plot | 2 | | Risk Ratio (Random, 95% CI) | Subtotals only |
|
| 3.1 Available case analysis | 2 | | Risk Ratio (Random, 95% CI) | 2.50 [0.68, 9.16] |
| 3.2 Best‐case scenario | 2 | | Risk Ratio (Random, 95% CI) | 0.97 [0.28, 3.40] |
| 3.3 Worst‐case scenario | 2 | | Risk Ratio (Random, 95% CI) | 4.93 [1.48, 16.47] |
| 3.4 Gamble‐Hollis analysis | 2 | | Risk Ratio (Random, 95% CI) | 2.57 [0.48, 13.74] |
| 3.5 Informative missingness odds ratio (OR = 2) | 2 | | Risk Ratio (Random, 95% CI) | 2.51 [0.69, 9.17] |
| 4 Fatigue (the Wessely and Powell test) Show forest plot | 1 | | Mean Difference (IV, Random, 95% CI) | Subtotals only |
|
| 4.1 Mental fatigue in people with mild hepatic encephalopathy (0 (no fatigue) to 10 (highest possible)) | 1 | 61 | Mean Difference (IV, Random, 95% CI) | ‐0.80 [‐1.48, ‐0.12] |
| 4.2 Mental fatigue in people with moderate hepatic encephalopathy (0 (no fatigue) to 10 (highest possible)) | 1 | 61 | Mean Difference (IV, Random, 95% CI) | 0.40 [‐0.21, 1.01] |
| 4.3 Physical fatigue in people with mild hepatic encephalopathy (0 (no fatigue) to 16 (highest possible)) | 1 | 61 | Mean Difference (IV, Random, 95% CI) | 0.20 [‐0.72, 1.12] |
| 4.4 Physical fatigue in people with moderate hepatic encephalopathy (0 (no fatigue) to 16 (highest possible)) | 1 | 61 | Mean Difference (IV, Random, 95% CI) | ‐0.20 [‐0.92, 0.52] |
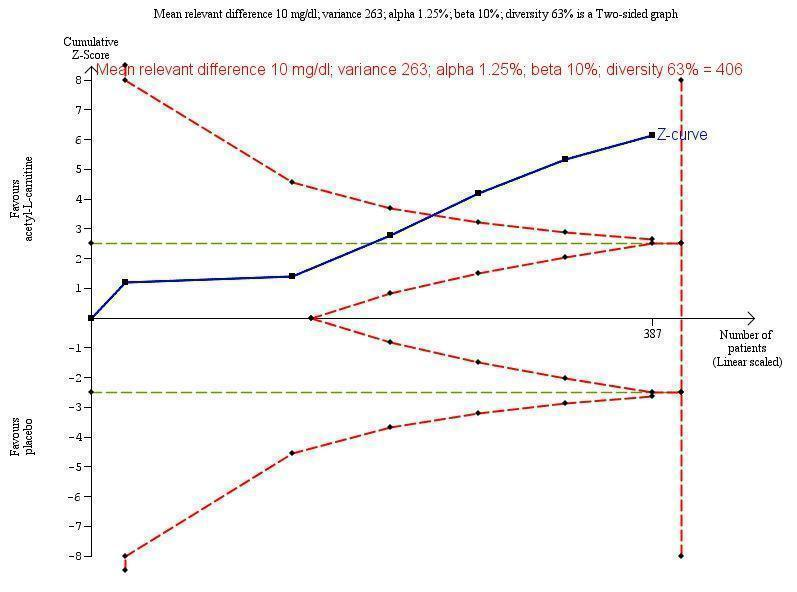
| 5 Blood ammonium levels Show forest plot | 5 | 387 | Mean Difference (IV, Random, 95% CI) | ‐13.06 [‐17.24, ‐8.89] |
|
| 5.1 Mild hepatic encephalopathy | 1 | 61 | Mean Difference (IV, Random, 95% CI) | ‐13.00 [‐18.17, ‐7.83] |
| 5.2 Moderate hepatic encephalopathy | 1 | 60 | Mean Difference (IV, Random, 95% CI) | ‐11.30 [‐19.05, ‐3.55] |
| 5.3 Hepatic coma | 1 | 24 | Mean Difference (IV, Random, 95% CI) | ‐4.10 [‐10.77, 2.57] |
| 5.4 Minimal hepatic encephalopathy | 2 | 182 | Mean Difference (IV, Random, 95% CI) | ‐17.46 [‐21.63, ‐13.28] |
| 5.5 Severe hepatic encephalopathy | 1 | 60 | Mean Difference (IV, Random, 95% CI) | ‐13.80 [‐20.78, ‐6.82] |
| 6 Blood ammonium levels (sensitivity analysis according to missing data) Show forest plot | 5 | | Mean Difference (IV, Random, 95% CI) | Subtotals only |
|
| 6.1 Complete case analysis | 5 | 327 | Mean Difference (IV, Random, 95% CI) | ‐13.40 [‐18.31, ‐8.48] |
| 6.2 Strategy 1 | 5 | 342 | Mean Difference (IV, Random, 95% CI) | ‐12.88 [‐17.69, ‐8.06] |
| 6.3 Strategy 2 | 5 | 342 | Mean Difference (IV, Random, 95% CI) | ‐14.70 [‐20.23, ‐9.16] |
| 6.4 Strategy 3 | 5 | 342 | Mean Difference (IV, Random, 95% CI) | ‐14.06 [‐19.50, ‐8.62] |
| 6.5 Strategy 4 | 5 | 342 | Mean Difference (IV, Random, 95% CI) | ‐13.79 [‐18.99, ‐8.58] |