Acetil‐L‐carnitina para el tratamiento de pacientes con encefalopatía hepática
Resumen
Antecedentes
La encefalopatía hepática es una complicación neuropsiquiátrica común y devastadora de la insuficiencia hepática aguda o de las enfermedades hepáticas crónicas. El contenido de amoníaco en la sangre parece desempeñar una función en el desarrollo de la encefalopatía hepática. El tratamiento de la encefalopatía hepática es complejo. La acetil‐L‐carnitina es una sustancia que puede reducir la toxicidad por amoníaco. En esta revisión se evaluaron los efectos beneficiosos y perjudiciales de la acetil‐L‐carnitina en los pacientes con encefalopatía hepática.
Objetivos
Evaluar los efectos beneficiosos y perjudiciales de la acetil‐L‐carnitina en los pacientes con encefalopatía hepática.
Métodos de búsqueda
Se hicieron búsquedas de ensayos clínicos aleatorios en el Registro de Ensayos Controlados del Grupo Cochrane Hepatobiliar (Cochrane Hepato‐Biliary Group Controlled Trials Register), CENTRAL, MEDLINE Ovid, Embase Ovid, LILACS, y en Science Citation Index Expanded. Se buscaron ensayos clínicos aleatorios adicionales en en el World Health Organization Clinical Trials Search Portal y en ClinicalTrials.gov. Se realizaron todas las búsquedas electrónicas hasta el 10 de septiembre de 2018. Se revisaron las listas de referencias de las publicaciones y los artículos de revisiones recuperados, y se realizaron búsquedas en los sitios web de la FDA y de la EMA.
Criterios de selección
Se buscaron los ensayos clínicos aleatorios en cualquier contexto, que incluyeron a pacientes con encefalopatía hepática. Los ensayos fueron elegibles para inclusión si compararon acetil‐L‐carnitina más atención estándar (p.ej., antibióticos, lactulosa) versus placebo o ninguna acetil‐L‐carnitina más atención estándar. Se sabe que al seleccionar los ensayos clínicos aleatorios, se otorga un mayor énfasis a los efectos beneficiosos potenciales que a los efectos perjudiciales potenciales.
Obtención y análisis de los datos
Se seleccionaron los ensayos clínicos aleatorios, se evaluó el riesgo de sesgo en ocho dominios, y se extrajeron los datos por duplicado y de manera independiente. Se calcularon los cocientes de riesgos (CR) para los resultados dicotómicos y las diferencias de medias (DM) para los resultados continuos. La heterogeneidad estadística se midió con las estadísticas I² y D². Los análisis se evaluaron con el modelo de efectos fijos y de efectos aleatorios. Se evaluaron los dominios del riesgo de sesgo para controlar los errores sistemáticos. La calidad general de los datos para cada resultado individual se evaluó mediante el uso del enfoque GRADE.
Resultados principales
Se identificaron cinco ensayos clínicos aleatorios con 398 participantes. Todos los ensayos incluyeron solamente a participantes con cirrosis como la causa subyacente de la encefalopatía hepática. Los ensayos incluyeron a participantes con encefalopatía hepática oculta o evidente. Todos los ensayos se realizaron en Italia por parte de un único equipo y evaluaron la acetil‐L‐carnitina en comparación con placebo. La intervención oral fue la vía de administración más frecuente. Todos los ensayos tuvieron alto riesgo de sesgo y tuvieron escaso poder estadístico. Ninguno de los ensayos fue patrocinado por la industria farmacéutica.
Ninguno de los ensayos identificados proporcionó información sobre la mortalidad por todas las causas, los eventos adversos graves o los días de hospitalización. Sólo un ensayo evaluó la calidad de vida mediante la escala Short Form (SF)‐36 (67 participantes; evidencia de muy baja calidad). Los efectos de la acetil‐L‐carnitina en comparación con placebo sobre la salud general a los 90 días no están claros (DM ‐6,20 puntos; intervalo de confianza [IC] del 95%: ‐9,51 a ‐2,89). Los resultados de los dominios adicionales del SF‐36 tampoco están claros. Un ensayo evaluó la fatiga mediante la prueba Wessely and Powell (121 participantes; evidencia de muy baja calidad). No están claros los efectos en los pacientes con encefalopatía hepática de grado moderado (fatiga mental: DM 0,40 puntos; IC del 95%: ‐0,21 a 1,01; fatiga física: DM ‐0,20 puntos; IC del 95%: ‐0,92 a 0,52) y encefalopatía hepática de grado leve (fatiga mental: ‐0,80 puntos; IC del 95%: ‐1,48 a ‐0,12; fatiga física: 0,20 puntos; IC del 95%: ‐0,72 a 1,12). El metanálisis mostró una reducción de los niveles sanguíneos de amonio a favor de la acetil‐L‐carnitina versus placebo (DM ‐13,06 mg/dl; IC del 95%: ‐17,24 a ‐8,99; 387 participantes; cinco ensayos; evidencia de muy baja calidad). No está claro si la acetil‐L‐carnitina versus placebo aumenta el riesgo de eventos adversos no graves (8/126 [6,34%] versus 3/120 [2,50%]; CR 2,51; IC del 95%: 0,68 a 9,22; dos ensayos; evidencia de muy baja calidad). En general, los datos de los eventos adversos se informaron de forma deficiente y los efectos perjudiciales se pueden haber subestimado.
Conclusiones de los autores
Esta revisión sistemática Cochrane analizó un grupo heterogéneo de cinco ensayos con alto riesgo de sesgo y con alto riesgo de errores aleatorios realizados por sólo un equipo de investigación. Se evaluó la acetil‐L‐carnitina versus placebo en participantes con cirrosis y encefalopatía hepática oculta o evidente. En consecuencia, no hay datos sobre el fármaco para la encefalopatía hepática en la insuficiencia hepática aguda. No se encontró información acerca de la mortalidad por todas las causas, los eventos adversos graves o los días de hospitalización. No se encontraron diferencias claras en el efecto entre acetil‐L‐carnitina y placebo con respecto a la calidad de vida, la fatiga y los eventos adversos no graves. La acetil‐L‐carnitina reduce los niveles sanguíneos de amonio en comparación con placebo. Toda la evidencia se consideró de muy baja calidad debido a las deficiencias en el diseño y la ejecución, la inconsistencia, los tamaños pequeños de la muestra y los muy escasos eventos. Actualmente no se conoce el perfil de efectos perjudiciales de la acetil‐L‐carnitina. En consecuencia, se necesitan más ensayos clínicos aleatorios para evaluar la acetil‐L‐carnitina versus placebo realizados según las declaraciones SPIRIT e informados según las declaraciones CONSORT.
PICOs
Resumen en términos sencillos
Acetil‐L‐carnitina para el tratamiento de pacientes con encefalopatía hepática
¿Qué es la encefalopatía hepática?
La encefalopatía hepática es una complicación neuropsiquiátrica común y devastadora de la insuficiencia hepática aguda o de las enfermedades hepáticas crónicas. En los pacientes con encefalopatía hepática el hígado no puede depurar la sangre venosa portal (los conductos grandes que transportan sangre del intestino delgado al hígado). Debido a este hecho, aumentan los niveles sanguíneos de amonio y los niveles de otras sustancias tóxicas, lo que da lugar a daño cerebral. La encefalopatía hepática se asocia con un aumento significativo de la mortalidad entre los pacientes con enfermedades hepáticas, incluidos los que están en espera de un trasplante hepático.
¿Qué es la acetil‐L‐carnitina?
La acetil‐L‐carnitina es una sustancia que reduce los niveles sanguíneos y cerebrales de amonio y puede actuar como un agente protector del cerebro.
Propósito de esta revisión
Esta revisión sistemática Cochrane evaluó los efectos beneficiosos y perjudiciales del tratamiento de los pacientes con encefalopatía hepática con acetil‐L‐carnitina además de la administración de atención estándar (lactulosa, antibióticos, etc.) en comparación con placebo o una intervención sin acetil‐L‐carnitina además de la atención estándar.
Hallazgos de esta revisión
Los autores de la revisión buscaron en la literatura médica hasta el 10 de septiembre de 2018 e identificaron cinco ensayos clínicos aleatorios relevantes, que incluyen un total de 398 participantes. Todos los ensayos fueron realizados en Italia por un solo equipo de investigadores. Todos se consideraron con alto riesgo de sesgo e incluyeron números pequeños de participantes, lo que da lugar a la posibilidad de sobrestimación de los efectos beneficiosos y subestimación de los efectos perjudiciales. Ningún ensayo fue patrocinado por la industria. Los ensayos evaluaron la acetil‐L‐carnitina administrada por vía oral o por vía intravenosa versus placebo. El fármaco no pareció tener efectos sobre la calidad de vida, la fatiga o los eventos adversos no graves en comparación con placebo (fármaco simulado inactivo).
Deficiencias de los ensayos incluidos en esta revisión
Ninguno de los ensayos incluidos informó datos sobre la mortalidad por todas las causas de los participantes, los eventos adversos graves o los días de hospitalización. Los investigadores informaron de manera deficiente los efectos perjudiciales causados por la acetil‐L‐carnitina, de manera que aún no está claro el perfil de efectos perjudiciales. Los riesgos de sesgo, la imprecisión y el sesgo de informe de resultado dan lugar a que la certeza de la evidencia sea baja o muy baja. La reducción en los niveles sanguíneos de amonio favoreció a los participantes que recibieron acetil‐L‐carnitina, pero los autores de los estudios no observaron efectos clínicos beneficiosos.
Está claro que se necesitan ensayos clínicos aleatorios adicionales para evaluar los efectos beneficiosos y perjudiciales de la acetil‐L‐carnitina en comparación con placebo para el tratamiento de los pacientes con encefalopatía hepática. Estos ensayos deben estar diseñados de forma adecuada, ser realizados por investigadores independientes y colaboradores, y deben incluir a un gran número de participantes.
Conclusiones de los autores
Summary of findings
| Acetyl‐L‐carnitine compared with placebo for patients with hepatic encephalopathy | ||||||
| Patient or population: patients with covert or overt hepatic encephalopathy | ||||||
| Outcomes | Illustrative comparative risks* (95% CI) | Relative effect | No. of participants | Quality of the evidence | Comments | |
| Assumed risk | Corresponding risk | |||||
| Placebo | Acetyl‐L‐carnitine | |||||
| All‐cause mortality | See comment | See comment | Not estimable | 0 | See comment | No trial reported this outcome |
| Quality of life (general health at 90 days) | Mean quality of life in the control groups was | Mean quality of life in the intervention groups was | ‐ | 67 | ⊕⊝⊝⊝ |
|
| Serious adverse events | See comment | See comment | Not estimable | 0 | See comment | No trial reported this outcome |
| Fatigue Scale from 0 to 10 Physical fatigue Wessely and Powell test from 0 (no fatigue) to 16 (highest possible fatigue) | Mean mental fatigue in the control groups was | Mean fatigue in the intervention groups was | ‐ | 121 | ⊕⊝⊝⊝ |
MD was assessed with fixed‐effect or random‐effects models |
| Non‐serious adverse events | 25 per 1000f | 63 per 1000 | RR 2.51 | 246 | ⊕⊝⊝⊝ | |
| Days of hospitalisation | See comment | See comment | Not estimable | 0 | See comment | No trial reported this outcome |
| Blood ammonium levels | Mean blood ammonium levels in the control groups was | Mean blood ammonium levels in the intervention groups was | ‐ | 387 | ⊕⊕⊝⊝ | |
| *The basis for the assumed risk (e.g. the median control group risk across studies) is provided in footnotes. The corresponding risk (and its 95% confidence interval) is based on the assumed risk in the comparison group and the relative effect of the intervention (and its 95% CI). | ||||||
| GRADE Working Group grades of evidence. | ||||||
| aFor mental health domain. | ||||||
Antecedentes
Descripción de la afección
La encefalopatía hepática es una complicación neuropsiquiátrica común y devastadora de la insuficiencia hepática aguda o de las enfermedades hepáticas crónicas (McPhail 2010; Felipo 2013; Rahimi 2013; Nusrat 2014). La encefalopatía hepática se puede categorizar en tres grupos amplios: tipo A, que se presenta en la insuficiencia hepática aguda; tipo b, que ocurre con derivación portosistémica y ninguna enfermedad hepatocelular intrínseca; y la forma reconocida más comúnmente, el tipo C, que se presenta con enfermedades hepáticas crónicas (Frederick 2011; Perazzo 2012; Felipo 2013; Romero‐Gomez 2014).
El espectro de síntomas se extiende desde un síndrome subclínico que puede no ser evidente en términos clínicos (encefalopatía hepática en estadio temprano, o "mínima" u oculta) hasta manifestaciones neuropsiquiátricas completamente desarrolladas como deterioro cognitivo, confusión, lentitud al hablar, pérdida de las aptitudes motoras complejas, asterixis, neuropatía periférica, clonus, signo positivo de Babinski, posición de descerebración y decorticación, crisis convulsivas, síntomas extrapiramidales y coma, en un trastorno conocido como encefalopatía hepática evidente (Frederick 2011; Perazzo 2012; Felipo 2013; Patidar 2015; De Rui 2016; Nardone 2016; Shawcross 2016). El estado mental en pacientes con esta complicación hepática se puede evaluar con los criterios West Haven (Shores 2008). Vea Apéndice 1 para los detalles de estos criterios.
La gravedad de la insuficiencia hepática subyacente y la presencia o ausencia de una anastomosis sistémica portal determinan la prevalencia o la incidencia de encefalopatía hepática (Vilstrup 2014). Ver Apéndice 2 para obtener los detalles de los datos epidemiológicos.
La encefalopatía hepática surge cuando el hígado no puede desintoxicar la sangre venosa portal (Wakim‐Fleming 2011). La patogenia de la encefalopatía hepática es multifactorial (Frederick 2011; Wakim‐Fleming 2011; Felipo 2013; Sturgeon 2014). Muchas hipótesis han indicado la forma en que se desarrolla la encefalopatía hepática. El amoníaco es la clave molecular de las neurotoxinas múltiples y los mediadores inflamatorios, y se ha implicado en la patogenia de la encefalopatía hepática (Munoz 2008; Sundaram 2009; Frederick 2011; Perazzo 2012; Felipo 2013). La acumulación del amoníaco de los intestinos y otras fuentes debido al deterioro de la depuración hepática o la derivación portosistémica puede dar lugar a la acumulación de glutamina en los astrocitos cerebrales, lo que da lugar a edema (Liou 2014). Se han descrito varios factores precipitantes de la encefalopatía hepática, como la acidosis, la alcalosis, el estreñimiento, el uso de diuréticos, la deshidratación, la hemorragia gastrointestinal, la hiponatremia, la infección, el exceso de proteínas, la descompensación renal, el uso de sedantes y el traumatismo (Wakim‐Fleming 2011). La encefalopatía hepática se asocia con un aumento significativo de la mortalidad entre los pacientes con enfermedades hepáticas, incluidos los que están en espera de un trasplante hepático (Wong 2014). La encefalopatía hepática se asocia con mortalidad en los pacientes con cirrosis independiente de otra insuficiencia orgánica extrahepática (Bajaj 2017).
El tratamiento de la encefalopatía hepática es complejo (Frontera 2014; Leise 2014; Basu 2015; Henderson 2015). Incluye un enfoque preventivo que considera los factores precipitantes potenciales, tratamiento médico para reducir la producción y la absorción del amoníaco de los intestinos, e intervenciones quirúrgicas o médicas (Frederick 2011; Wakim‐Fleming 2011). Varias revisiones sistemáticas Cochrane han evaluado los efectos beneficiosos y perjudiciales clínicos de varias intervenciones para el tratamiento de la encefalopatía hepática, como los agonistas dopaminérgicos (Junker 2014), los antagonistas de los receptores benzodiazepínicos (Al‐Nielsen 2004), los disacáridos no absorbibles (Gluud 2016), los aminoácidos de cadena ramificada (Gluud 2017), los probióticos (Dalal 2017), la naloxona (Sun 2009), la rifaximina (Kimer 2015) y los antibióticos (Falavigna 2007). La acetil‐L‐carnitina ofrece otro enfoque médico para la reducción de la toxicidad del amoníaco en pacientes con encefalopatía hepática (Malaguarnera 2006; Malaguarnera 2008; Shores 2008; Malaguarnera 2011a; Malaguarnera 2011b; Malaguarnera 2011c; Malaguarnera 2012; Malaguarnera 2013).
Descripción de la intervención
La acetil‐L‐carnitina es un éster de L‐carnitina y acetato que se sintetiza en el cerebro, el hígado y el riñón humano mediante la enzima acetil‐L‐carnitina transferasa (Malaguarnera 2013).
La carnitina es un nutriente dietético esencial que actúa como portador de los ácidos grasos a través de la membrana mitocondrial interna (Malaguarnera 2012). El hígado es un órgano central para el metabolismo de la carnitina y para la distribución de la carnitina al cuerpo. Por lo tanto, no es sorprendente que el metabolismo de la carnitina esté deteriorado entre los pacientes con determinados tipos de enfermedades hepáticas crónicas (Krähenbühl 1996). Selimoglu 2001 señaló que los niños con cirrosis tienen concentraciones bajas de carnitina en plasma, lo que es especialmente pronunciado entre los que presentan la enfermedad de Wilson. Sobre la base de esta perspectiva, estos investigadores indicaron la administración obligatoria de suplementos de carnitina a los pacientes con cirrosis en la niñez, en especial los que presentan la enfermedad de Wilson. Sin embargo, hay controversia en cuanto a este tema. Un estudio muestra que los pacientes con enfermedad hepática no cirrótica no tuvieron cambios en la reserva de carnitina en plasma, mientras que los que presentan cirrosis tuvieron un aumento del 29% en la concentración de acilcarnitina de cadena larga (Krähenbühl 1997).
De qué manera podría funcionar la intervención
La encefalopatía hepática ocurre como una alteración funcional de las células involucradas en la neurotransmisión cerebral (Munoz 2008). El factor principal que afecta la transmisión cerebral es la hiperamonemia, que es directamente neurotóxica (Munoz 2008) y causa edema de los astrocitos y edema cerebral (Wakim‐Fleming 2011). El edema de los astrocitos genera disfunción mitocondrial y rotura de la barrera sanguínea–cerebral, lo que provoca disfunción neuronal (Wakim‐Fleming 2011).
Teóricamente, la acetil‐L‐carnitina podría ser una intervención efectiva para el tratamiento de los pacientes afectados por encefalopatía hepática a través de dos mecanismos: primero, el aumento de la génesis de urea da lugar a niveles reducidos de amonio en la sangre y el cerebro (Malaguarnera 2013); y segundo, la acetil‐L‐carnitina transportada a través de la barrera sanguínea‐cerebral y que se acumula en el líquido cefalorraquídeo cerebral y el cerebro facilita la captación de la acetil‐coenzima A (CoA) en la mitocondria durante la oxidación de los ácidos grasos, mejora la producción de acetilcolina y estimula la síntesis de proteínas y de la membrana de los fosfolípidos. Todos estos mecanismos podrían proporcionar un reservorio de sustratos para la producción de energía celular y de ese modo evitar la muerte excesiva de células neuronales (Malaguarnera 2012; Malaguarnera 2013).
Por qué es importante realizar esta revisión
La función verdadera de la acetil‐L‐carnitina en el tratamiento de los pacientes con encefalopatía hepática es tema de controversia (Krähenbühl 1996; Krähenbühl 1997; Selimoglu 2001). Se calculó que los costos de hospitalización de más de 40 000 pacientes de los EE.UU. con encefalopatía hepática en 2003 fueron $932 000 000 (Poordad 2007). Entre 2005 y 2009 se informaron 110 000 hospitalizaciones debido a la encefalopatía hepática en los EE.UU. (Stepanova 2012). Se ha señalado que en la Unión Europea, esta carga es similar (Vilstrup 2014). Malaguarnera 2006; Malaguarnera 2008; Malaguarnera 2011a, Malaguarnera 2011b, y Malaguarnera 2011c evaluaron los efectos beneficiosos y perjudiciales clínicos de la acetil‐L‐carnitina en pacientes con encefalopatía hepática. Un único grupo de investigación en Italia realizó todos estos ensayos. En 2008 se publicó una revisión que incluyó tres ensayos clínicos aleatorios sobre el tratamiento de la encefalopatía hepática con L‐acil‐carnitina (Shores 2008). Los autores de la revisión no realizaron un metanálisis de los tres ensayos clínicos aleatorios y evaluaron su calidad mediante la puntuación desactualizada de Jadad (Moher 1995), en lugar de los dominios del riesgo de sesgo como recomienda el Manual Cochrane para las Revisiones Sistemáticas de Intervenciones (Higgins 2011). Los autores de la revisión recomendaron la realización de ensayos adicionales de la L‐acil‐carnitina (Shores 2008). El metanálisis Jiang 2013 sobre la acetil‐L‐carnitina en los pacientes con encefalopatía hepática mostró que la acetil‐L‐carnitina redujo los niveles de amoníaco sérico y mejoró el estado mental, según lo evaluado por la Trail Making Test (Conn 1977; Jiang 2013). Sin embargo, este metanálisis no empleó una evaluación del riesgo de sesgo ni del riesgo de errores aleatorios en los ensayos clínicos aleatorios incluidos. Por lo tanto, se justifica la realización de una evaluación sistemática de los efectos beneficiosos y perjudiciales de la acetil‐L‐carnitina para el tratamiento de los pacientes con encefalopatía hepática.
Objetivos
Evaluar los efectos beneficiosos y perjudiciales de la acetil‐L‐carnitina en los pacientes con encefalopatía hepática.
Métodos
Criterios de inclusión de estudios para esta revisión
Tipos de estudios
Se buscaron los ensayos clínicos aleatorios independientemente del estado de publicación (no publicados o publicados como un artículo, resumen, o carta), el idioma y el cegamiento.
Los estudios cuasialeatorios se excluyeron de la evaluación de los efectos beneficiosos, pero estos y otros estudios observacionales se incluirán en el informe de los efectos perjudiciales si dichos estudios son recuperados por las búsquedas. Al elegir esta estrategia, se sabe que se otorgará un mayor énfasis a los efectos beneficiosos potenciales y es posible pasar por alto los efectos perjudiciales tardíos o poco frecuentes, que a menudo se omiten en los ensayos clínicos aleatorios (Storebø 2018).
Tipos de participantes
Se incluyeron pacientes con encefalopatía hepática, independientemente de la etiología.
Tipos de intervenciones
Los estudios compararon la acetil‐L‐carnitina administrada a cualquier dosis, por cualquier vía y duración del tratamiento, versus ninguna intervención, placebo, u otras intervenciones.
Debido a que la encefalopatía hepática requiere diferentes tratamientos médicos y endoscópicos (es decir intervenciones primarias), la acetil‐L‐carnitina se considera una intervención complementaria. Por lo tanto, con el objetivo de realizar esta revisión, los ensayos clínicos aleatorios elegibles fueron los que compararon las mismas intervenciones o tratamientos primarios con y sin suplementos de fármacos de acetil‐L‐carnitina.
Tipos de medida de resultado
Se extrajeron datos sobre los resultados al final del tratamiento y al seguimiento máximo.
Resultados primarios
-
Mortalidad por todas las causas
-
Calidad de vida (cualquier escala validada utilizada por los investigadores, como el Short Form [SF]‐36)
-
Eventos adversos graves (un evento adverso grave, definido de acuerdo a la International Conference on Harmonisation [ICH] Guidelines for Good Clinical Practice [ICH‐GCP 1997], es cualquier situación médica adversa que a cualquier dosis da lugar a la muerte, es potencialmente mortal, requiere hospitalización o la prolongación de la hospitalización existente, da lugar a discapacidad o incapacidad persistente o significativa, o comprende una anomalía congénita o un defecto congénito.) Todos los demás eventos adversos se consideraron no graves (ver a continuación)
Resultados secundarios
-
Eventos adversos no graves (ICH‐GCP 1997)
-
Fatiga, ya sea mental o física (cualquier escala validada utilizada por los autores del ensayo)
-
Días de hospitalización
-
Niveles sanguíneos de amonio
Métodos de búsqueda para la identificación de los estudios
We searched the Cochrane Hepato‐Biliary Group Controlled Trials Register (Cochrane Hepato‐Biliary Group Module; searched 10 September 2018); the Cochrane Central Register of Controlled Trials (CENTRAL), in the Cochrane Library (2018, Issue 8; searched 10 September 2018); MEDLINE Ovid (1946 to 10 September 2018); Embase Ovid (1974 to 10 September 2018); Latin American Caribbean Health Sciences Literature (LILACS) (Bireme; 1982 to 10 September 2018); and Science Citation Index Expanded (Web of Science; 1900 to 10 September 2018) (Royle 2003). We have presented search strategies along with the time spans of these searches in Appendix 3.
We looked through the reference lists of retrieved publications and review articles. We searched the Food and Drug Administration (FDA) and European Medicines Agency (EMA) websites for unpubished trials (www.fda.gov; www.ema.europa.eu/ema/). We also searched the World Health Organization (WHO) International Clinical Trials Registry Platform Search Portal and the metaRegister of Controlled Trials for ongoing and unpublished trials (apps.who.int/trialsearch/; www.controlled‐trials.com/mrct/search.html). The evidence is current until 10 September 2018.
Obtención y análisis de los datos
We summarised data using standard Cochrane methods (Higgins 2011).
Selección de los estudios
Two review authors independently selected studies for eligibility using the Early Review Organizing Software (EROS) (Ciapponi 2011). We reviewed titles and abstracts of all identified studies to determine whether they fulfilled the inclusion criteria. We assessed the full texts of selected studies to confirm their relevance for inclusion. We resolved disagreements by consulting with a third review author. We were not blind to study authors’ names and institutions, journal of publication, or study results at any stage of the review.
Extracción y manejo de los datos
We used a form to extract data from each relevant trial (Zavala 2006). Two review authors independently extracted data from trial publications and contacted study authors if data were missing. Arturo Martí‐Carvajal (AMC) entered the data into Review Manager 5.3 (Review Manager 2014), and Ingrid Arévalo‐Rodríguez (IAR) and Cristina Martí‐Amarista (CMA) independently checked the data. We also extracted information on study design and participant characteristics (age, sex, and hepatic encephalopathy severity, as measured by West Haven grade).
Evaluación del riesgo de sesgo de los estudios incluidos
We assessed the following 'Risk of bias' domains of randomised clinical trials (Schulz 1995; Moher 1998; Kjaergard 2001; Wood 2008; Higgins 2011; Savovic 2012a; Savovic 2012b; Lundh 2017; Savović 2018).
Allocation sequence generation
-
Low risk of bias: sequence generation was achieved using computer random number generation or a random numbers table. Drawing lots, tossing a coin, shuffling cards, and throwing dice were adequate if performed by an independent person not otherwise involved in the trial
-
Uncertain risk of bias: the sequence generation method was not specified
-
High risk of bias: the sequence generation method was not random
Allocation concealment
-
Low risk of bias: participant allocations could not have been foreseen in advance of, or during, enrolment. Allocation was controlled by a central and independent randomisation unit. The allocation sequence was unknown to investigators (e.g. the allocation sequence was hidden in sequentially numbered, opaque, and sealed envelopes)
-
Uncertain risk of bias: the method used to conceal the allocation was not described, so that intervention allocations may have been foreseen in advance of, or during, enrolment
-
High risk of bias: the allocation sequence was likely to be known to investigators who assigned participants
Blinding of participants and personnel
-
Low risk of bias: any of the following: no blinding or incomplete blinding was described, but review authors judged that the outcome was not likely to be influenced by lack of blinding; or blinding of participants and key study personnel was ensured, and it was unlikely that blinding could have been broken
-
Unclear risk of bias: any of the following: information was insufficient to permit judgement of ‘low risk’ or ‘high risk’; or the trial did not address this outcome
-
High risk of bias: any of the following: no blinding or incomplete blinding, and the outcome was likely to be influenced by lack of blinding; or blinding of key study participants and personnel was attempted, but it is likely that blinding could have been broken, and the outcome was likely to be influenced by lack of blinding
Blinded outcome assessment
-
Low risk of bias: any of the following: no blinding of outcome assessment, but review authors judged that outcome measurement was not likely to be influenced by lack of blinding; or blinding of outcome assessment was ensured, and it is unlikely that blinding could have been broken
-
Unclear risk of bias: any of the following: information was insufficient to permit judgement of ‘low risk’ or ‘high risk’; or the trial did not address this outcome
-
High risk of bias: any of the following: no blinding of outcome assessment was described, and outcome measurement was likely to be influenced by lack of blinding; or blinding of outcome assessment was described, but it is likely that blinding could have been broken, and outcome measurement was likely to be influenced by lack of blinding
Incomplete outcome data
-
Low risk of bias: missing data were unlikely to make treatment effects depart from plausible values. Sufficient methods, such as multiple imputation, were employed to handle missing data
-
Uncertain risk of bias: information was insufficient to assess whether missing data in combination with the method used to handle missing data were likely to induce bias in the results
-
High risk of bias: results were likely to be biased due to missing data
Selective outcome reporting
-
Low risk: all pre‐defined, or clinically relevant and reasonably expected, outcomes were reported on. If the original trial protocol was available, outcomes should have been those called for in that protocol (Note: If the trial protocol was obtained from a trial registry (e.g. www.clinicaltrials.gov), the outcomes sought were those enumerated in the original protocol if the trial protocol had been registered before or at the time the trial began; if the trial protocol was registered after the trial began, those outcomes would not have been considered reliable in representing the outcomes initially sought). If the trial protocol was not available (or if the protocol had been registered after the trial began), we would expect the following clinically relevant and reasonably expected outcomes to have been reported by trial authors: all‐cause mortality, quality of life, serious adverse events, non‐serious adverse events, and days of hospitalisation
-
Unclear risk: not all pre‐defined, or clinically relevant and reasonably expected, outcomes were reported fully, or it is unclear whether data on these outcomes were recorded
-
High risk: one or more pre‐defined or clinically relevant and reasonably expected outcomes were not reported, although data on these outcomes were likely to have been available and even recorded
For‐profit bias
-
Low risk of bias: the trial appears to be free of industry sponsorship or other for‐profit support that may manipulate trial design, conduct, or results
-
Uncertain risk of bias: the trial may or may not be free of for‐profit bias, as no information on clinical trial support or sponsorship was provided
-
High risk of bias: the trial was sponsored by industry or received other for‐profit support
Other bias
-
Low risk of bias: the trial appears to be free of other components (e.g. academic bias) that could put it at risk of bias
-
Uncertain risk of bias: the trial may or may not be free of other components that could put it at risk of bias
-
High risk of bias: other factors in the trial can put it at risk of bias (e.g. study authors have conducted trials on the same topic)
We judged trials as having low risk of bias if assessed as having low risk of bias in all domains. In all other cases, we judged trials as having high risk of bias.
Medidas del efecto del tratamiento
For binary outcomes, such as all‐cause mortality and adverse (serious and non‐serious) events, we calculated the risk ratio (RR) with 95% confidence interval (CI) and Trial Sequential Analysis‐adjusted CI (see below).
For continuous outcomes, such as quality of life (e.g. Short Form (SF)‐36), days of hospitalisation, and blood ammonium levels, we calculated the mean difference (MD) with 95% CI and Trial Sequential Analysis‐adjusted CI (see below). If different scales were used for measuring the same outcome (e.g. quality of life), we used the standardised mean difference (SMD) with 95% CI. As recommended by the Cochrane Handbook for Systematic Reviews of Interventions, if necessary, we multiplied the mean values from one set of studies by ‐1 to ensure that all scales point in the same direction (Higgins 2011). We estimated the ratio of means with 95% CIs for continuous outcomes (Friedrich 2008; Friedrich 2011).
Manejo de los datos faltantes
We attempted to contact the publication authors.
We attempted to use intention‐to‐treat analysis.
Due to lack of reporting of two primary outcomes (all‐cause mortality and serious adverse events), we performed a sensitivity analysis of two secondary outcomes (i.e. non‐serious adverse events and blood ammonium levels). Regarding these secondary outcomes, we included participants with incomplete or missing data in sensitivity analyses by imputing them according to the following scenarios (Hollis 1999).
-
Available‐case analysis, which ignores missing data and justifies missing at random assumption (Chaimani 2014).
-
Extreme‐case analysis favouring the experimental intervention ('best‐worse' case scenario): none of the dropouts/participants lost from the experimental arm, but all of the dropouts/participants lost from the control arm, experienced the outcome, including all randomised participants in the denominator (Hollis 1999).
-
Extreme‐case analysis favouring the control ('worst‐best' case scenario): all dropouts/participants lost from the experimental arm, but none from the control arm, experienced the outcome, including all randomised participants in the denominator (Hollis 1999).
Furthermore, we assessed the impact of missing data by using two methods based on the principle of uncertainty when used to impute missing trial data.
-
Gamble‐Hollis analysis (Gamble 2005).
-
Informative missingness odds ratio model (Chaimani 2014).
Evaluación de la heterogeneidad
We quantified the impact of statistical heterogeneity by using the I² statistic, which describes the percentage of total variation across trials that is due to heterogeneity rather than to sampling error (Higgins 2003). We summarised these findings using a fixed‐effect model or a random‐effects model, according to Jakobsen 2014a. We estimated prediction intervals in cases of statistical heterogeneity by using the random‐effects model (Riley 2011; IntHout 2016; Borenstein 2017; Partlett 2017).
Evaluación de los sesgos de notificación
For future updates, we will attempt to assess publication bias by using a funnel plot, which is usually used to illustrate variability between trials in a graphical way. We will need to include at least 10 trials if we are to make judgements about asymmetry, and if asymmetry is present, we will attempt to explore its causes (Sterne 2011).
Síntesis de los datos
Meta‐analysis
We performed meta‐analyses with 95% CIs and Trial Sequential Analysis‐adjusted CIs (see below), using both fixed‐effect and random‐effects models, according to Jakobsen 2014a.
Trial Sequential Analysis
Although we identified no trials reporting neither all‐cause mortality nor serious adverse events, we conducted Trial Sequential Analysis (TSA) in estimating sample sizes for future trials regarding either all‐cause‐mortality or serious adverse events. We applied TSA, as cumulative meta‐analyses are at risk of producing random errors due to sparse data and repetitive testing of accumulating data (Brok 2008; Wetterslev 2008; Brok 2009; Thorlund 2009, Wetterslev 2009; Thorlund 2010; Imberger 2015; Imberger 2016; Wetterslev 2017). To minimise random errors, we calculated the required information size (i.e. the number of participants needed in a meta‐analysis to detect or reject a certain intervention effect) (Wetterslev 2008). The required information size calculation should also account for heterogeneity or diversity present in the meta‐analysis (Wetterslev 2008; Wetterslev 2009). In our meta‐analysis, the diversity‐adjusted required information size was based on the event proportion in the control group; assumption of a plausible RR reduction of 20% or RR reduction observed in the included trials at low risk of bias; risk of type I error of 5%; risk of type II error of 20%; and the empirical diversity (D²) of the meta‐analysis (Wetterslev 2009; Wetterslev 2017). Only one trial including only 67 participants assessed quality of life on the SF‐36 scale. We therefore decided not to conduct TSA, as the distance from the accrued sample size to a plausible required information size is too large. Accordingly, we reported naive 95% CIs, which ought to be interpreted conservatively. We will conduct TSA on quality of life if this outcome is measured by the same scale. We conducted TSA for serum ammonium concentration. Here, we used an alpha of 0.0125 (0.05/4) (Bonferrini adjustment), as there are four secondary outcomes, and a beta of 10% and the D² of the meta‐analysis. We added trials according to the year of publication, and if more than one trial has been published in a year, we will add trials alphabetically according to the last name of the first author. On the basis of the required information size, we constructed trial sequential monitoring boundaries (Lan 1983; Wetterslev 2008; Thorlund 2011). These boundaries determined the statistical inference one may draw regarding the cumulative meta‐analysis that has not reached the required information size; if the trial sequential monitoring boundary for benefit or harm was crossed before the required information size was reached, firm evidence might perhaps be established and further trials may turn out to be superfluous. On the other hand, if one of the boundaries is not surpassed, it is probably necessary to continue to conduct trials to detect or reject a certain intervention effect. This can be determined by assessing whether the cumulative Z‐curve crosses trial sequential boundaries for futility. If futility boundaries were crossed, then further trials might be unnecessary (TSA 2011).
We conducted TSA using the latest software version (0.9.5.10.Beta) from the Copenhagen Trial Unit (Thorlund 2011; TSA 2011).
Análisis de subgrupos e investigación de la heterogeneidad
We anticipated clinical heterogeneity in effects of the intervention, and for each comparison, we planned to conduct the following subgroup analyses, if data were available.
-
According to risk of bias when trials at low risk of bias were compared to trials at high risk of bias.
-
According to the West Haven grade of hepatic encephalopathy at entry.
-
According to the aetiology of hepatic encephalopathy.
-
According to acute liver disease compared to chronic liver disease.
We were not able to conduct subgroup analyses and investigations of heterogeneity due to lack of data: no trial measured or reported all‐cause mortality or serious adverse events. Only one trial assessed quality of life.
For future updates, we plan to perform subgroup analyses for primary outcomes.
Análisis de sensibilidad
In addition to the sensitivity analyses described under Dealing with missing data, we did not perform the following sensitivity analysis to explore the influence of these factors on the intervention effect size.
-
Repeating the analysis while taking attrition bias into consideration.
For future updates, we plan to perform sensitivity analyses for primary outcomes if data are available.
'Summary of findings' tables
We used the principles of the GRADE system to assess the quality of the body of evidence associated with specific outcomes (all‐cause mortality, quality of life, serious adverse events, fatigue, non‐serious adverse events, days of hospitalisation, and blood ammonium levels) in our review (Guyatt 2011e), and we constructed Summary of findings table 1 using GRADEpro software.
The GRADE approach appraises the quality of a body of evidence based on the extent to which one can be confident that an estimate of effect or association reflects the item being assessed. The quality of a body of evidence considers five factors regarding limitations in design and implementation of available studies suggesting high likelihood of bias: indirectness of evidence (indirect population, intervention, control, outcomes); unexplained heterogeneity and inconsistency of results (including problems with subgroup analyses); imprecision of results (wide confidence intervals); and high probability of publication bias (Balshem 2011; Guyatt 2011a; Guyatt 2011b; Guyatt 2011c; Guyatt 2011d; Guyatt 2011e; Guyatt 2011f; Guyatt 2011g; Guyatt 2011h; Guyatt 2013a; Guyatt 2013b; Guyatt 2013c; Guyatt 2013d; Mustafa 2013; Guyatt 2017).
Calculation and interpretation of Bayes Factor
Given that P values are not as reliable as many scientists assume (Nuzzo 2014), we estimated the threshold for clinical relevance with Bayes factor (Jakobsen 2014a), which has been pointed out as complementary statistical evidence to P values (Lin 2015). Bayes factor is a likelihood ratio indicating the relative strength of evidence for two theories (Goodman 1999; Goodman 2005; Dienes 2014). Bayes factor is the ratio between the probability of getting the result assuming the null hypothesis (H0) is true divided by the probability of getting the result assuming the alternative hypothesis (HA) is true (Jakobsen 2014b). We used the Copenhagen Trial Unit‐Bayes factor calculator.
Comparison of assessments of imprecision with GRADE and Trial Sequential Analysis
Excellent concordance is usually evident between imprecision assessments with GRADE and those with Trial Sequential Analysis (Castellini 2018; Gartlehner 2018). However, in meta‐analyses with diversity for which a random‐effects model is more appropriate, the required information size will be larger with Trial Sequential Analysis than that assessed by GRADE not employing diversity correction and using a fixed‐effect model to calculate the required information size. We will therefore assess imprecision by using both methods.
Results
Description of studies
Results of the search
We identified 738 references using our search strategies. Five trials involving 398 participants met our inclusion criteria (Malaguarnera 2006; Malaguarnera 2008; Malaguarnera 2011a; Malaguarnera 2011b; Malaguarnera 2011c). The evidence is current until 10 September 2018.
See Figure 1 for details of the flow of studies.
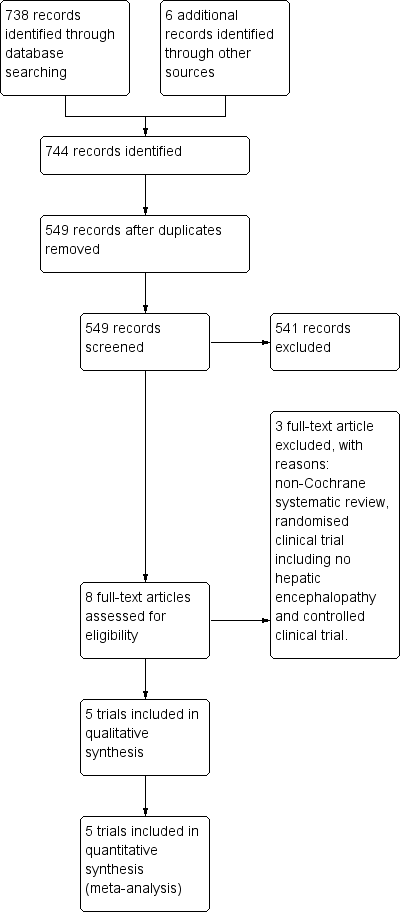
Study flow diagram for 10 August 2018.
Included studies
We have described these trials in the section Characteristics of included studies. Trials varied in size as well as in characteristics of participant populations, duration of intervention, and drug dosage.
Acetyl‐L‐carnitine and populations assessed in the trials
All trials compared acetyl‐L‐carnitine versus placebo (with or without co‐interventions). None of the trials sufficiently described the characteristics of the placebo (Malaguarnera 2006; Malaguarnera 2008; Malaguarnera 2011a; Malaguarnera 2011b; Malaguarnera 2011c).
The co‐interventions used most frequently in both experimental and control groups were lactulose (Malaguarnera 2006; Malaguarnera 2011b; Malaguarnera 2011c); insulin (Malaguarnera 2011b); diuretics (Malaguarnera 2008; Malaguarnera 2011b); beta‐blockers (Malaguarnera 2008; Malaguarnera 2011b); antibiotics (neomycin) (Malaguarnera 2011c); and branched‐chain amino acids (Malaguarnera 2011c). One trial did not report the use of any co‐intervention (Malaguarnera 2011a).
Four trials administered acetyl‐L‐carnitine orally at a dose of 2 grams (gr) twice daily over 90 days (Malaguarnera 2008; Malaguarnera 2011a; Malaguarnera 2011b; Malaguarnera 2011c). One trial administered acetyl‐L‐carnitine intravenously, and the dose was 4 gr once daily over 3 days (Malaguarnera 2006).
The mean age of participants was 50 years (standard deviation (SD) 2.3). Most participants were male (57.4% (SD 7%)). In all trials, hepatic encephalopathy was associated with cirrhosis and portal hypertension (i.e. type C) (Malaguarnera 2006; Malaguarnera 2008; Malaguarnera 2011a; Malaguarnera 2011b; Malaguarnera 2011c). Clinical severity varied and included covert hepatic encephalopathy (Malaguarnera 2008; Malaguarnera 2011a), as well as overt hepatic encephalopathy (Malaguarnera 2006; Malaguarnera 2011b; Malaguarnera 2011c). One trial reported precipitating factors (i.e. haemorrhage, sepsis, dehydration, and surgery) (Malaguarnera 2006). Trials did not provide information on duration of hepatic encephalopathy.
Location of trials
All trials were conducted in the Dipartimento di Scienze della Senescenza, Urologiche e Neurologiche, Università di Catania, in Italy (Malaguarnera 2006; Malaguarnera 2008; Malaguarnera 2011a; Malaguarnera 2011b; Malaguarnera 2011c).
Trial methods
All trials used a parallel‐group design and reported an a priori estimation of sample size. Trials were small, with sample sizes ranging from 24 to 125 participants and a median sample size of 67 and a mean size of 79.6 (SD 42.9). Trials reported inclusion and exclusion criteria. In all trials, the units of randomisation and analysis were the participants. All trials included two comparison groups, without reporting the follow‐up periods (Malaguarnera 2006; Malaguarnera 2008; Malaguarnera 2011a; Malaguarnera 2011b; Malaguarnera 2011c). Trials reported duration of the intervention: three days in Malaguarnera 2006, and 90 days in Malaguarnera 2008,Malaguarnera 2011a,Malaguarnera 2011b, and Malaguarnera 2011c. No trials reported drug company sponsorship.
Excluded studies
We excluded three studies: one meta‐analysis (Jiang 2013), one randomised clinical trial including no participants with hepatic encephalopathy (Malaguarnera 2014), and one non‐randomised clinical trial (Siciliano 2006). See the Characteristics of excluded studies table.
Ongoing trials
We identified one ongoing trial (NCT02173132). This trial also originated from Mariano Malaguarnera and his group from the University of Catania, in Italy. We have provided full details in the Characteristics of ongoing studies table.
Risk of bias in included studies
We have summarised risks of bias in the included trials in Figure 2 and Figure 3, and we have provided details in the Characteristics of included studies table.
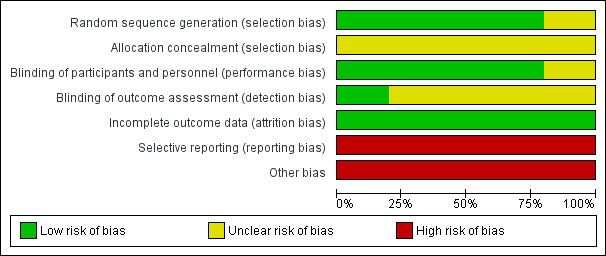
Risk of bias graph: review authors' judgements about each risk of bias item presented as percentages across all included studies.
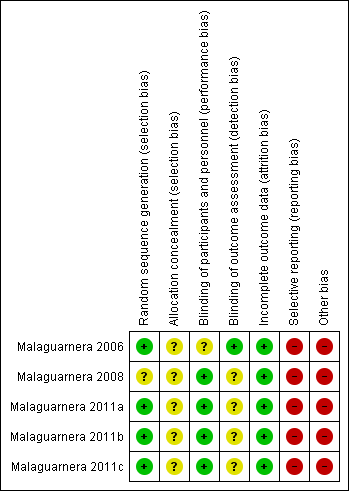
Risk of bias summary: review authors' judgements about each risk of bias item for each included study.
Allocation
Random sequence generation
We considered risk of bias arising from the method of generation of the allocation sequence to be low in four trials (Malaguarnera 2006; Malaguarnera 2011a; Malaguarnera 2011b; Malaguarnera 2011c). One trial had unclear risk of bias for this domain (Malaguarnera 2008).
Allocation concealment
We considered risk of bias arising from the method of allocation concealment to be unclear in all trials (Malaguarnera 2006; Malaguarnera 2008; Malaguarnera 2011a; Malaguarnera 2011b; Malaguarnera 2011c).
Blinding
Blinding of participants and personnel (performance bias)
We rated risk of bias due to lack of blinding of participants and personnel as low in four trials (Malaguarnera 2008; Malaguarnera 2011a; Malaguarnera 2011b; Malaguarnera 2011c). We judged risk of performance bias as unclear in one trial (Malaguarnera 2006).
Blinding of outcome assessment (detection bias)
One trial clearly reported outcome assessment as blinded, and we considered detection bias to be low (Malaguarnera 2006). Blinding of outcome assessors was unclear or was not performed in the remaining four trials (Malaguarnera 2008; Malaguarnera 2011a; Malaguarnera 2011b; Malaguarnera 2011c), so we considered risk of detection bias to be high.
Incomplete outcome data
We rated risk of attrition bias as low in all trials (Malaguarnera 2006; Malaguarnera 2008; Malaguarnera 2011a; Malaguarnera 2011b; Malaguarnera 2011c).
Selective reporting
We rated risk of selective outcome reporting bias as high in all trials (Malaguarnera 2006; Malaguarnera 2008; Malaguarnera 2011a; Malaguarnera 2011b; Malaguarnera 2011c), because these trials neither measured nor reported all‐cause mortality, quality of life, or adverse events data, considered as critical patient‐centred and patient‐reported outcomes. Only one trial reported trial registration number (Malaguarnera 2011b). Malaguarnera 2006 and Malaguarnera 2008 were not registered or published, so we could not assess what was intended and what was reported. Malaguarnera 2011a and Malaguarnera 2011c reported no trial registration number; however, these trials were registered. We noted a mean of 4 years and 6.2 months between the last trial conduction date (end of trial) and the trial publication date (Appendix 4).
Other potential sources of bias
We assessed Malaguarnera 2006,Malaguarnera 2008,Malaguarnera 2011a,Malaguarnera 2011b, and Malaguarnera 2011c as having high risk of other bias due to bias in the design associated with a large number of outcomes and a family‐wise error rate substantially over the 5% level (Follmann 1995; Delorme 2016).
We rated Malaguarnera 2008 as having high risk of allocation and confusion bias due to unclear reporting about random sequence generation and allocation concealment of sequence generation. Malaguarnera 2011b had high risk of bias in the presentation of data due to inconsistency in baseline data.
Accordingly, we considered all trials to have high risk of bias.
Effects of interventions
All trials compared acetyl‐L‐carnitine versus placebo (Malaguarnera 2006; Malaguarnera 2008; Malaguarnera 2011a; Malaguarnera 2011b; Malaguarnera 2011c).
Primary outcomes
All‐cause mortality
None of the trials reported on all‐cause mortality. A calculation with Trial Sequential Analysis suggested that with proportion of all‐cause mortality in the control group of 38% (Bajaj 2017), a relative risk reduction of 20% in the experimental group, alpha of 5%, beta of 10%, and D² of 25%, we would need a sample size of 2184 participants when conducting a randomised clinical trial to assess the size effect of acetyl‐L‐carnitine versus placebo on all‐cause mortality.
Quality of life
Only one trial involving 67 participants with covert hepatic encephalopathy assessed quality of life using the SF‐36 scale (Malaguarnera 2011a). We therefore decided not to conduct Trial Sequential Analysis, as the distance from the accrued sample size to a plausible required information size was too large. Accordingly, reported naive 95% CIs ought to be interpreted conservatively. Researchers assessed quality of life at 90 days using the SF‐36 scale (range 0 to 100 points (the higher, the better)). Regarding physical functioning, the mean difference (MD) in acetyl‐L‐carnitine compared with placebo, assessed via fixed‐effect or random‐effects models, was 7.90 points (95% CI 4.49 to 11.31); for role limitations due to physical problems, the MD was 9.60 points (95% CI 5.77 to 13.43); for bodily pain, 1.80 points (95% CI ‐2.78 to 6.38); for general health, ‐6.20 points (95% CI ‐9.51 to ‐2.89); for vitality, 2.80 points (95% CI ‐0.11 to 5.71); for social functioning, 2.90 points (95% CI 0.44 to 5.36); for role of limitations due to emotional problems, 4.80 points (95% CI 1.45 to 8.15), and for general mental health perceptions, 3.10 points (95% CI 0.64 to 5.56). Table 1 shows the effect size in MD or ratio of means on domains of quality of life of acetyl‐L‐carnitine compared with placebo. We rated the quality of evidence as very low due to limitations in design and in execution (Malaguarnera 2011a). See Analysis 1.1.
| Domain (SF‐36 scale; 0 to 100, higher score is better) | Mean difference (95% CI) | Ratio of means (95% CI) |
| Physical functioning | 7.90 | 1.12 |
| Role limitations due to physIcal problems | 9.60 | 1.15 |
| Bodily pain at 90 days | 1.80 | 1.03 |
| General health at 90 days | ‐6.20 (‐9.51 to ‐2.89) | 0.91 (0.86 to 0.96) |
| Vitality at 90 days | 2.80 (‐0.11 to 5.71) | 1.05 (1.00 to 1.10) |
| Social functioning at 90 days | 2.90 | 1.05 (1.01 to 1.08) |
| Role limitations due to emotional problems at 90 days | 4.80 (1.45 to 8.15) | 1.08 (1.02 to 1.13) |
| General mental health perceptions at 90 days | 3.10 (0.64 to 5.56) | 1.05 |
SF‐36: Short Form‐36.
Serious adverse events
None of the trials reported on serious adverse events. Calculation based on TSA suggested that with proportion of serious adverse events in the control group of 3%, a relative risk reduction of 50%, alpha of 5%, beta of 10%, and D² of 0%, we would need a sample size of 4109 participants to conduct a randomised clinical trial to detect the size effect of acetyl‐L‐carnitine versus placebo on serious adverse events.
Secondary outcomes
Non‐serious adverse events
Meta‐analysis of two trials yielded evidence of no effect in terms of non‐serious adverse events when acetyl‐L‐carnitine was compared with placebo (8/126 (6.34%) vs 3/120 (2.5%); RR fixed‐effect model and random‐effects model 2.51; 95% CI 0.68 to 9.22; I² = 0%). We rated the quality of evidence as very low due to limitations in design and in execution (Malaguarnera 2008; Malaguarnera 2011b). See Analysis 1.2. Bayes factor was 4.07 × 10‐8, which means there is a likelihood of 4.07 × 10‐8 times for acetyl‐L‐carnitine versus placebo for increasing risk of non‐serious adverse events. Trial Sequential Analysis of two trials comparing acetyl‐L‐carnitine versus placebo on non‐serious adverse events in participants with hepatic encephalopathy with proportion of non‐serious adverse events in the control group of 2.51%, a relative risk reduction of 20%, alpha of 5%, beta of 20%, and D² of 0% suggests a sample size of 27,741 participants for conducting a randomised clinical trial for detecting the size effect of acetyl‐L‐carnitine compared with placebo on non‐serious adverse events.
Sensitivity analysis by missing data on non‐serious adverse events
In sensitivity analysis by missing data showing the effect of acetyl‐L‐carnitine versus placebo on non‐serious adverse events by available case analysis (RR 2.50, 95% CI 0.68 to 9.16; I² = 0%), best‐case scenario (RR 0.97, 95% CI 0.28 to 3.40; I² = 23%), worst‐case scenario (RR 4.93, 95% CI 1.48 to 16.47; I² = 0%), Gamble‐Hollis analysis (RR 2.57, 95% CI 0.48 to 13.74; I² = 0%), and the informative missingness odds ratio model (RR 2.51, 95% CI 0.69 to 9.17; I² = 0%) showed evidence of no effect in terms of non‐serious adverse events. Testing for subgroup differences showed no significant differences (Chi² = 3.39, df = 4 (P = 0.50), I² = 0%) (Malaguarnera 2008; Malaguarnera 2011b). See Analysis 1.3.
Table 2 provides details on how adverse events were reported (Malaguarnera 2006; Malaguarnera 2008; Malaguarnera 2011a; Malaguarnera 2011b; Malaguarnera 2011c).
| Trial | Adverse events |
| "No side effects were observed in our study series" | |
| "In the group treated with acetyl‐L‐carnitine, one patient complained of nausea, two of slight headache and two of abdominal pain. In the placebo group, one patient complained | |
| Researchers did not report on adverse events | |
| "Three patients in the acetyl‐L‐carnitine group (1 with mild hepatic encephalopathy and 2 with moderate hepatic encephalopathy) withdrew from the study because of abdominal pain. One patient in the placebo group withdrew from the study because of headache. In the placebo group, we observed occasional abdominal pain, cramping, diarrhoea, and flatulence. At follow‐up 1 mo after treatment ended, 2 patients in the acetyl‐L‐carnitine group and 5 patients in the placebo group experienced moderate hepatic encephalopathy" | |
| Researchers did not report on adverse events |
Fatigue
One trial involving 121 participants with overt hepatic encephalopathy assessed fatigue ‐ mental or physical (Malaguarnera 2011b). Researchers assessed fatigue using the Wessely and Powell test at day 90. The mental fatigue scale has a range of 0 (no fatigue) to 10 (highest) points. In terms of mental fatigue among people with mild‐grade hepatic encephalopathy, the mean difference between acetyl‐L‐carnitine versus placebo was ‐0.80 points (95% CI ‐1.48 to ‐0.12; participants = 61; trials = 1), and the mean difference in mental fatigue among people with moderate‐grade hepatic encephalopathy was ‐0.40 points (95% CI ‐0.21 to 1.01; participants = 61; trials = 1). For physical fatigue in people with mild‐grade hepatic encephalopathy (Wessely and Powell test from 0 (no fatigue) to 16 (highest possible)), the mean difference was 0.20 points (95% CI ‐0.72 to 1.12; participants = 61; trials = 1), and the mean difference for physical fatigue in people with moderate‐grade hepatic encephalopathy was ‐0.20 points (95% CI ‐0.92 to 0.52; participants = 61; trials = 1) assessed by the fixed‐effect model. Malaguarnera 2011b reported data by subgroup of mild or moderate hepatic encephalopathy. Table 3 shows the effect size in MD or ratio of means on fatigue of acetyl‐L‐carnitine compared with placebo. We rated the quality of evidence as very low due to limitations in design and in execution (Malaguarnera 2011b). See Analysis 1.4.
| Type of fatigue by hepatic encephalopathy | Fatigue (the Wessely and Powell test)b,c | |
| Mean difference (95% CI) | Ratio of means (95% CI) | |
| Mental fatigue in people with mild hepatic encephalopathy (0 (no fatigue) to 10 (highest possible))a | ‐0.80 (‐1.48 to ‐0.12) | 0.88 (0.78, to 0.98) |
| Mental fatigue in people with moderate hepatic encephalopathy (0 (no fatigue) to 10 (highest possible))a | 0.40 (‐0.21 to 1.01) | 1.07 (0.97 to 1.18) |
| Physical fatigue in people with mild hepatic encephalopathy (0 (no fatigue) to 16 (highest possible))a | 0.20 (‐0.72 to 1.12) | 1.02 (0.93 to 1.13) |
| Physical fatigue in people with moderate hepatic encephalopathy (0 (no fatigue) to 16 (highest possible))a | ‐0.20 (‐0.92 to 0.52) | 0.98 (0.90 to 1.06) |
Blood ammonium levels
Meta‐analysis of five trials involving 387 participants with covert or overt hepatic encephalopathies showed a reduction in blood ammonium levels favouring participants assigned to acetyl‐L‐carnitine over participants allocated to placebo (MD ‐13.06 mg/dL, 95% CI ‐17.24 to ‐8.89; I² = 59% (95% CI 1% to 84%); D² of 63%) (Analysis 1.5). The prediction interval was MD ‐13.06 mg/dL (95% CI ‐25.43 to ‐0.69), which should be understood to show that in some 95% of the entire population, the true effect size in new settings will be between ‐25.43 and ‐0.69 mg/dL. Bayes factor was 5.02 × 10²⁰, which means there is a likelihood of 5.02 × 10²⁰ times for acetyl‐L‐carnitine over placebo for reducing blood ammonium levels by at least 13.06 mg/dL, or 18% (based on a ratio of means of 0.82). Trial Sequential Analysis of five trials comparing acetyl‐L‐carnitine versus placebo on blood ammonium levels in participants with hepatic encephalopathy suggests that no additional trials may be needed on this outcome (Figure 4). We rated the quality of evidence asvery low due to limitations in design and execution and inconsistency. Testing for subgroup differences was significant (P = 0.02), and I² attributed to subgroup differences was 64.9% (Malaguarnera 2006; Malaguarnera 2008; Malaguarnera 2011a; Malaguarnera 2011b; Malaguarnera 2011c). Table 4 shows the effect size in MD or in ratio of means of blood ammonium levels when acetyl‐L‐carnitine was compared with placebo.
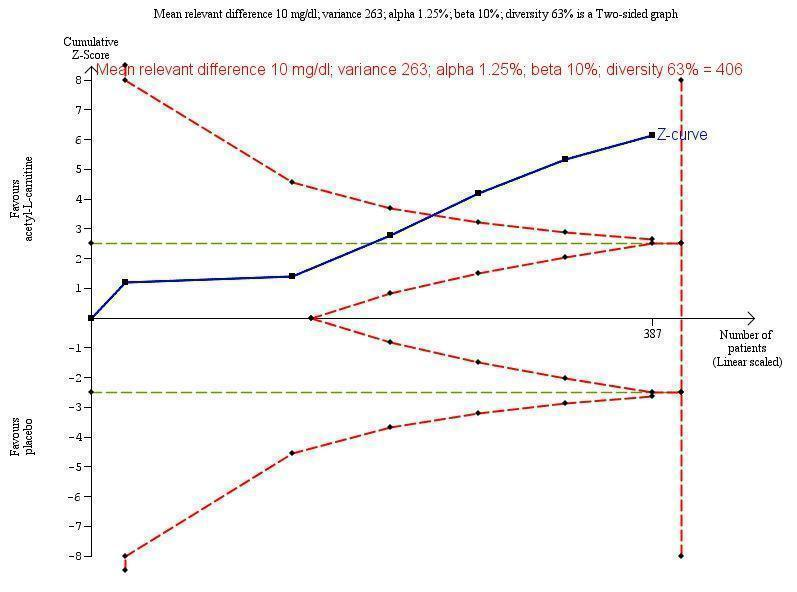
Trial Sequential Analysis of five trials comparing acetyl‐L‐carnitine versus placebo on blood ammonium levels in participants with hepatic encephalopathy.
Trial Sequential Analysis of five trials comparing acetyl‐L‐carnitine versus placebo on blood ammonium levels in participants with hepatic encephalopathy based on the diversity‐adjusted required information size (DARIS) of 406 participants. This DARIS was calculated based upon a mean relevant difference of 10 mg; a variance of 263; an alpha (α) of 1.25%; and a beta (β) of 10%. The cumulative Z‐curve (blue line) crossed the conventional alpha of 1.25% (green line) after three trials. This implies that there is not a random error. The cumulative Z‐curve (blue line) surpassed the continuous alpha‐spending boundary (monitoring efficacy boundary) after four trials. Presently, 95.3% (387/406) of the DARIS has been obtained.
Malaguarnera 2011b measured twice blood ammonium level with mild or moderate hepatic encephalopathy.
| Type of hepatic encephalopathy | Acetyl‐L‐carnitine sample size | Placebo sample size | Blood ammonium levels | |
| Mean difference, mg/dL (95% CI) | Ratio of means (95% CI) | |||
| Mild hepatic encephalopathya | 31 | 30 | ‐13.00 | 0.81 |
| Moderate hepatic encephalopathya | 30 | 30 | ‐11.30 | 0.88 |
| Hepatic comab | 13 | 11 | ‐4.10 | 0.94 |
| Minimal hepatic encephalopathyc,d Subtotal (95% CI) | 60 | 55 | ‐21.90 | 0.66 |
| 33 | 34 | ‐16.70 | 0.72 | |
| 93 | 89 | ‐17.46 | 0.70 | |
| Severe hepatic encephalopathye | 30 | 30 | ‐13.80 | 0.86 |
| Total (95% CI) | 197 | 190 | ‐13.06 | 0.82 I²= 78% |
Sensitivity analysis by missing data
Sensitivity analysis by missing data on the effect of acetyl‐L‐carnitine versus placebo on blood ammonium levels by complete‐case analysis (MD ‐13.40 mg/dL, 95% CI ‐18.31 to ‐8.48; participants = 327; I² = 66%), strategy 1 (MD ‐12.88 mg/dL, 95% CI ‐17.69 to ‐8.06; participants = 342; I² = 67%), strategy 2 (MD ‐14.70 mg/dL 95% CI ‐20.23 to ‐9.16; participants = 342; I² = 75%), strategy 3 (MD ‐14.06 mg/dL, 95% CI ‐19.50 to ‐8.62; participants = 342; I² = 74%), and strategy 4 (MD ‐13.79 mg/dL, 95% CI ‐18.99 to ‐8.58; participants = 342; I² = 71%) shows robustness of results for each of the imputation strategies. Testing for subgroup differences showed no difference (Chi² = 0.27, df = 4 (P = 0.99), I² = 0%) (Analysis 1.6).
'Summary of findings' tables
summary of findings Table for the main comparison shows the overall grading of evidence found for this Cochrane systematic review.
Discusión
Resumen de los resultados principales
Esta revisión sistemática Cochrane acerca de la acetil‐L‐carnitina para el tratamiento de los pacientes con encefalopatía hepática incluye cinco ensayos clínicos aleatorios que asignaron al azar a 398 participantes. Estos ensayos evaluaron la acetil‐L‐carnitina administrada por vía oral o por vía intravenosa en comparación con placebo. En términos generales, estos ensayos se consideraron con alto riesgo de sesgo y de escaso poder estadístico. Todos los ensayos informaron de un cálculo a priori del tamaño de la muestra. Ninguno de los ensayos fue patrocinado por las compañías farmacéuticas. Los ensayos fueron realizados en un país (Italia) por el mismo equipo de investigadores, en general en contextos ambulatorios.
Ninguno de los ensayos incluidos evaluó, informó o midió la mortalidad por todas las causas ni los eventos adversos graves. Con respecto a la calidad de vida y la fatiga mental y física, la certeza de la estimación fue muy baja debido a las limitaciones en el diseño y la ejecución de los ensayos incluidos y el tamaño pequeño de las muestras de estudio. Fue posible realizar el metanálisis de los datos sólo en los participantes del ensayo que presentaron eventos adversos no graves. El metanálisis de dos ensayos no mostró efectos de la acetil‐L‐carnitina versus placebo sobre los eventos adversos no graves. La certeza de la estimación fue muy baja debido a las limitaciones en el diseño y la ejecución de los ensayos incluidos, el tamaño pequeño de la muestra y los números muy reducidos de eventos. El metanálisis de cinco ensayos mostró una reducción de los niveles sanguíneos de amonio a favor de los pacientes que recibieron acetil‐L‐carnitina. La certeza de la estimación se consideró muy baja debido a las limitaciones en el diseño y la ejecución de los ensayos incluidos, y el tamaño pequeño de las muestras del estudio (Resumen de los hallazgos, tabla 1).
Compleción y aplicabilidad general de las pruebas
Los análisis y las conclusiones se basan en cinco ensayos clínicos aleatorios pequeños de único centro con alto riesgo de sesgo debido a las deficiencias en el diseño y la ejecución. Debido a esta información y los resultados de GRADE, se cree que los ensayos futuros son necesarios para determinar, con mayor certeza, los efectos beneficiosos y perjudiciales clínicos potenciales de la acetil‐L‐carnitina en los pacientes con encefalopatía hepática. Aún no se conoce el perfil de efectos perjudiciales de la acetil‐L‐carnitina debido a la falta de un informe suficiente de las reacciones y los eventos adversos. Con respeto al manejo de los resultados neutros, se debe recordar que la "ausencia de evidencia" no es "evidencia de ausencia" (Fermi Paradox 1950; Altman 1995). El hecho de que esta revisión no detectara una diferencia fuerte entre los grupos de acetil‐L‐carnitina y placebo no se debe interpretar como que el tratamiento con placebo y acetil‐L‐carnitina son iguales. La primera explicación posible es que no se pudo determinar un tamaño de la muestra adecuado (Schulz 1995). Además, al tratar con números tan pequeños de participantes como los asignados al azar aquí, el riesgo de que la asignación al azar no haya logrado lo deseado es significativo. Los estudios de simulación han mostrado que se necesitan tamaños de la muestra muy por encima de 1000 participantes antes de que la simple asignación al azar pueda proporcionar lo esperado: una distribución justa y equitativa de los factores pronósticos entre los participantes (Nguyen 2017).
Cuando se evaluaron los resultados de Malaguarnera 2011b para la fatiga mental o física, se temió que los autores del estudio pudieran haber sobreinterpretado los resultados (Boutron 2010; Arunachalam 2016). Se reconoce ampliamente que los análisis de subgrupos pueden producir resultados falsos (Brookes 2001). Según las recomendaciones de Brookes 2001 y Sun 2014; los resultados de cualquier análisis de subgrupos no deben ser sobreinterpretados.
Aunque la acetil‐L‐carnitina redujo los niveles de amonio sanguíneo en casi el 20%, no proporcionó un efecto clínico beneficioso evidente (Análisis 1.5; Tabla 4). Se ha encontrado un fenómeno equivalente con las intervenciones de disminución de la homocisteína para la prevención de los eventos cardiovasculares (Marti‐Carvajal 2015). Se han descrito diversas variables para explicar este fracaso de las teorías fisiológicas y bioquímicas de traducirse en un efecto beneficioso para los pacientes (Heneghan 2017). Previamente se han señalado las deficiencias de varios biomarcadores considerados útiles para evaluar los efectos clínicos beneficiosos de las intervenciones (Ioannidis 2017a). Por otro lado, y para ahondar más profundamente en el metanálisis sobre los niveles sanguíneos de amonio (Análisis 1.5), se encontró una variación significativa en los efectos calculados entre los ensayos (heterogeneidad estadística alta) que miden la diferencia de medias o el cociente de medias (Tabla 4). Sin embargo, se sabe que la I² puede estar sesgada y ser inexacta en los metanálisis pequeños (von Hippel 2015). A pesar de lo anterior el Análisis Secuencial de Ensayos reveló una diversidad (D²) del 63% (Figura 4). La diversidad es el porcentaje que la variabilidad entre los ensayos constituye de la suma de la variabilidad entre los ensayos y un cálculo del error de muestreo considerando el tamaño necesario de información (Wetterslev 2009; Wetterslev 2017), cuando el tamaño necesario de información no es representado de forma suficiente mediante la corrección con I² (Higgins 2003). La repercusión de la heterogeneidad se observa en el intervalo amplio de predicción de las diferencias en las medias (‐13,06 mg/dl; intervalo de confianza [IC] del 95%: ‐25,43 a ‐0,69). Los ensayos con baja calidad metodológica y tamaños de la muestra pequeños y un número pequeño de ensayos incluidos impiden determinar una asociación potencial entre una variable moderadora y el tamaño del efecto (Hempel 2012; Hempel 2013). Este es el caso en el metanálisis de la acetil‐L‐carnitina para los niveles sanguíneos de amonio en esta revisión Cochrane (Análisis 1.5).
Finalmente, esta revisión encontró una escasez de datos sobre los perfiles de efectos perjudiciales acerca de la acetil‐L‐carnitina, que no es poco común (Ioannidis 2009; Pitrou 2009; Storebø 2018).
Por lo tanto, la completitud y la aplicabilidad generales de la evidencia son deficientes debido a los resultados potencialmente falsos.
Calidad de la evidencia
Un detalle clave necesario para comprender los resultados de esta revisión Cochrane es que la única fuente de evidencia comprende los ensayos realizados por el mismo equipo de investigación. La evidencia indica que los ensayos clínicos aleatorios de único centro sobrestiman los efectos del tratamiento en comparación con los ensayos clínicos aleatorios multicéntricos (Dechartres 2011; Unverzagt 2013). Por lo tanto, los resultados de la investigación clínica de centros únicos se deben evaluar con cuidado.
Se observó la falta de una descripción adecuada del placebo en los ensayos incluidos. Se sabe que en un contexto particular, las intervenciones placebo pueden influir en los resultados informados por los pacientes (Hróbjartsson 2010).
Se realizó la evaluación GRADE sobre los resultados de los ensayos metanalizados y no metanalizados. Se determinó que ninguno de los ensayos aportó evidencia sólida, principalmente debido a los tamaños de la muestra pequeños (incluso después del metanálisis), que generan intervalos de confianza amplios y poca precisión de las estimaciones de los efectos del tratamiento, junto con un alto riesgo de sesgo debido a la falta de métodos de asignación al azar adecuados, un riesgo incierto de cegamiento y el informe poco claro de los resultados. Estos temas se asocian con la inflación de las estimaciones del tamaño del efecto de la intervención e incrementos en la inconsistencia entre los ensayos en los ensayos que informan resultados evaluados de forma subjetiva (Savovic 2012a). Los datos faltantes no afectaron los resultados relacionados con los eventos adversos no graves (Análisis 1.5).
Aunque cuatro de los cinco ensayos incluidos informaron la herramienta utilizada para la generación de la secuencia aleatoria, ninguno aportó detalles de las técnicas de asignación al azar. Además, ninguno de los ensayos mencionó la ocultación de la secuencia de asignación (Malaguarnera 2006; Malaguarnera 2011a; Malaguarnera 2011b; Malaguarnera 2011c). Estas deficiencias pueden no haber protegido contra el sesgo, debido al tamaño pequeño de los ensayos incluidos (Nguyen 2017), pero pueden haber dado lugar a la disminución de la calidad de la evidencia proporcionada por los ensayos incluidos en esta revisión Cochrane. Por lo tanto, no fue posible obtener una inferencia causal de estos ensayos (Berger 2008; Backmann 2017).
Se disminuyó la certeza de la evidencia que surgió de un resultado del biomarcador (niveles de amonio en sangre) debido a las limitaciones en el diseño y la ejecución, así como la inconsistencia. Sin embargo, el análisis de sensibilidad mediante los datos faltantes muestra la solidez de la evidencia que surgió del metanálisis de este resultado (Guyatt 2017). Por lo tanto, no se disminuyó la calidad de la evidencia debido a los datos faltantes.
Debido al tamaño pequeño de la muestra o los números muy reducidos de eventos que produjeron imprecisión con intervalos de confianza amplios, todas las estimaciones del efecto del tratamiento informadas en esta revisión, posiblemente con la excepción de las relacionadas con los niveles sanguíneos de amonio, se deben interpretar como posibles falsos positivos (efectos beneficiosos inflados o sobrestimados) o como posibles falsos negativos (efectos perjudiciales subestimados) (Gaskin 2014; Szucs 2017).
Ver la evaluación completa y la justificación de las calificaciones en "Resumen de los hallazgos", tabla 1.
Sesgos potenciales en el proceso de revisión
Un grupo de sesgos llamados "sesgos de búsqueda de significación" incluye el sesgo de publicación, el sesgo de informe de resultado selectivo, el sesgo de informe de análisis selectivo y el sesgo de fabricación (Ioannidis 2010). El sesgo de publicación representa una amenaza principal para la validez de las revisiones sistemáticas, en particular en las revisiones que incluyen ensayos pequeños. Sin embargo, esta revisión Cochrane tiene un bajo riesgo de sesgo de publicación debido a la búsqueda meticulosa de ensayos que se realizó. Además, se cumplieron las recomendaciones para la reducción de la intervención del azar o el sesgo debido a la inclusión y al informe selectivos de los resultados y los análisis en las revisiones sistemáticas de ensayos aleatorios de intervenciones de asistencia sanitaria (Page 2014). No fue posible preparar un gráfico en embudo ni evaluar la asimetría del gráfico en embudo debido a la falta de ensayos que informaran sobre los resultados primarios y la inclusión de pocos ensayos en esta revisión.
El sesgo de informe de resultados selectivo funciona mediante la supresión de la información acerca de resultados específicos y tiene semejanzas con el sesgo de publicación de estudios o ensayos completos, en cuanto a que los resultados "negativos" permanecen sin publicar (Ioannidis 2010). Además, se ha señalado que las prácticas de informe selectivo producen resultados del ensayo que son más atractivos, pero falsos (Ioannidis 2017b). Se encontraron cinco ensayos con alto riesgo de sesgo de informe de resultado selectivo principalmente debido a la ausencia de información sobre la mortalidad por todas las causas y los eventos adversos graves. Sin embargo, todos estos ensayos presentaron información sobre los niveles sanguíneos de amonio, que sigue siendo un resultado alternativo no validado para los resultados centrados en los pacientes como la encefalopatía hepática, las complicaciones y la mortalidad (Cochrane Hepato‐Biliary Group Module). Sólo al derivar los datos (preferentemente los datos de los participantes individuales) de los ensayos clínicos aleatorios que informaban los efectos de la acetil‐L‐carnitina sobre los niveles sanguíneos de amonio y los resultados clínicos es posible evaluar si los cambios en los niveles de amonio pueden predecir cambios en los resultados clínicos (Gluud 2007).
Esta revisión Cochrane identificó los siguientes aspectos que se deben considerar al planificar los ensayos futuros: la falta de información en cuanto a la mortalidad por todas las causas y los eventos adversos, y la escasez de información sobre la calidad de vida y la fatiga, ya sea mental o física. Se deben evitar las diferencias en las definiciones de los resultados y la inconsistencia de los resultados informados. Los ensayos deben adoptar un grupo de resultados centrales acordados para cada trastorno médico (Clarke 2007). Este enfoque puede reducir el impacto del sesgo de informe de resultado (Kirkham 2010; Dwan 2013).
El impacto del sesgo de informe de resultado se puede reducir mediante la adopción de las recomendaciones del Patient‐Centered Outcomes Research Institute (PCORI) (Fleurence 2015). Esta organización fue establecida por el Congreso de los Estados Unidos como una organización independiente y sin fines de lucro, creada para realizar investigaciones y aportar información acerca de la mejor evidencia disponible con el objetivo de ayudar a los pacientes y a los profesionales sanitarios a tomar decisiones más fundamentadas. La investigación PCORI está destinada a mejorar la comprensión del paciente de la prevención, el tratamiento y las opciones de atención disponibles, así como la ciencia que apoya estas opciones (Selby 2014).
Acuerdos y desacuerdos con otros estudios o revisiones
Los resultados son diferentes de los de una revisión y metanálisis no Cochrane publicados en 2013 (Jiang 2013). Primero, la presente revisión sistemática se realizó sobre la base de un protocolo publicado revisado por pares para la revisión sistemática. Jiang y colegas no basaron la revisión en un protocolo publicado o no publicado (Jiang 2013). Segundo, en esta revisión se evaluó la acetil‐L‐carnitina administrada por vía oral y por vía intravenosa, pero Jiang 2013 incluyó sólo los ensayos que evaluaron la acetil‐L‐carnitina oral y otro compuesto. Tercero, Jiang 2013 incluyó los ensayos que evaluaron la acetil‐L‐carnitina o la L‐carnitina y en la presente revisión sólo se incluyeron los ensayos que evaluaron la acetil‐L‐carnitina. Sin embargo, Jiang 2013 fue explícito en los criterios de inclusión para la intervención ‐ "los ECA que compararon acetil‐L‐carnitina oral con placebo". La confusión parece estar relacionada con el hecho de que acetil‐L‐carnitina no es lo mismo que L‐carnitina. Cuarto, Jiang 2013 realizó la evaluación del riesgo de sesgo mediante la escala de Jadad y en esta revisión se evaluaron ocho dominios del sesgo. Quinto, Jiang 2013 no mencionó cuáles fueron los resultados primarios o secundarios. Sexto, Jiang 2013 no proporcionó información acerca de la mortalidad por todas las causas y los eventos adversos. Por lo tanto, en esta revisión se encontraron diferentes resultados en comparación con Jiang 2013. Lo anterior podría ser explicado por las diferencias en las perspectivas, las metas y las limitaciones entre Jiang 2013 y la presente revisión sistemática Cochrane (Saldanha 2017). Sin embargo, ambas revisiones encontraron una escasez de información sobre los eventos adversos. Para esta revisión Cochrane, la FDA 2016 presentó una opinión similar a Jiang 2013: "La conclusión general del análisis es que la acetil‐L‐carnitina fue efectiva para reducir los niveles de amoníaco sérico. Sin embargo, no hubo resultados que indicaran la significación clínica de una reducción media del amoníaco sérico de 26 mg/dl. No es posible establecer una conclusión con respecto a la consistencia de los resultados secundarios" (FDA 2016).
Study flow diagram for 10 August 2018.
Risk of bias graph: review authors' judgements about each risk of bias item presented as percentages across all included studies.
Risk of bias summary: review authors' judgements about each risk of bias item for each included study.
Trial Sequential Analysis of five trials comparing acetyl‐L‐carnitine versus placebo on blood ammonium levels in participants with hepatic encephalopathy.
Trial Sequential Analysis of five trials comparing acetyl‐L‐carnitine versus placebo on blood ammonium levels in participants with hepatic encephalopathy based on the diversity‐adjusted required information size (DARIS) of 406 participants. This DARIS was calculated based upon a mean relevant difference of 10 mg; a variance of 263; an alpha (α) of 1.25%; and a beta (β) of 10%. The cumulative Z‐curve (blue line) crossed the conventional alpha of 1.25% (green line) after three trials. This implies that there is not a random error. The cumulative Z‐curve (blue line) surpassed the continuous alpha‐spending boundary (monitoring efficacy boundary) after four trials. Presently, 95.3% (387/406) of the DARIS has been obtained.
Malaguarnera 2011b measured twice blood ammonium level with mild or moderate hepatic encephalopathy.
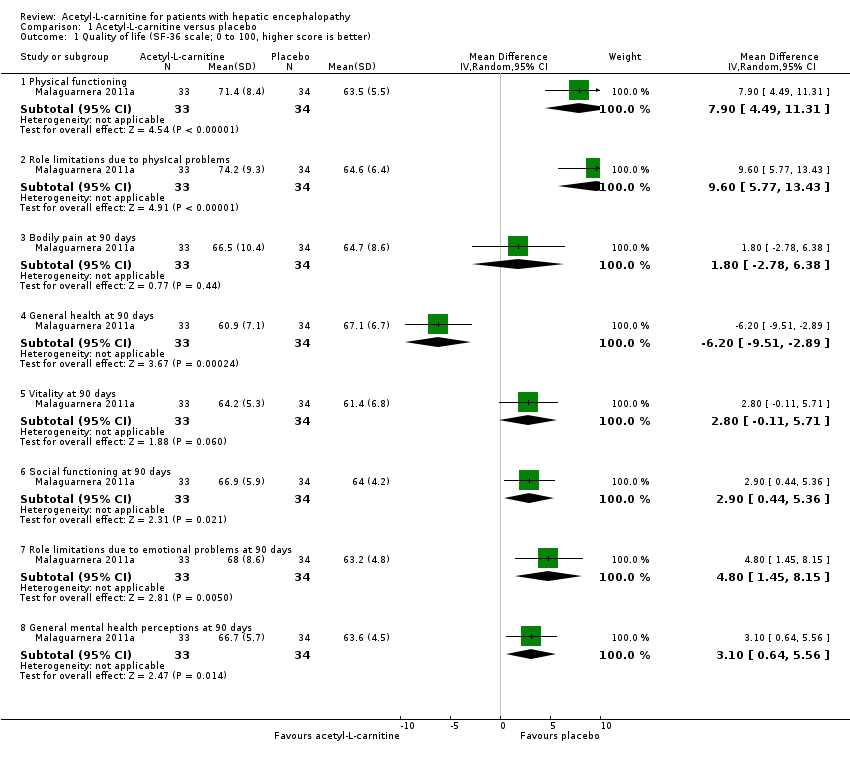
Comparison 1 Acetyl‐L‐carnitine versus placebo, Outcome 1 Quality of life (SF‐36 scale; 0 to 100, higher score is better).

Comparison 1 Acetyl‐L‐carnitine versus placebo, Outcome 2 Non‐serious adverse events.

Comparison 1 Acetyl‐L‐carnitine versus placebo, Outcome 3 Non‐serious adverse events (sensitivity analysis by missing data).

Comparison 1 Acetyl‐L‐carnitine versus placebo, Outcome 4 Fatigue (the Wessely and Powell test).

Comparison 1 Acetyl‐L‐carnitine versus placebo, Outcome 5 Blood ammonium levels.

Comparison 1 Acetyl‐L‐carnitine versus placebo, Outcome 6 Blood ammonium levels (sensitivity analysis according to missing data).
| Acetyl‐L‐carnitine compared with placebo for patients with hepatic encephalopathy | ||||||
| Patient or population: patients with covert or overt hepatic encephalopathy | ||||||
| Outcomes | Illustrative comparative risks* (95% CI) | Relative effect | No. of participants | Quality of the evidence | Comments | |
| Assumed risk | Corresponding risk | |||||
| Placebo | Acetyl‐L‐carnitine | |||||
| All‐cause mortality | See comment | See comment | Not estimable | 0 | See comment | No trial reported this outcome |
| Quality of life (general health at 90 days) | Mean quality of life in the control groups was | Mean quality of life in the intervention groups was | ‐ | 67 | ⊕⊝⊝⊝ |
|
| Serious adverse events | See comment | See comment | Not estimable | 0 | See comment | No trial reported this outcome |
| Fatigue Scale from 0 to 10 Physical fatigue Wessely and Powell test from 0 (no fatigue) to 16 (highest possible fatigue) | Mean mental fatigue in the control groups was | Mean fatigue in the intervention groups was | ‐ | 121 | ⊕⊝⊝⊝ |
MD was assessed with fixed‐effect or random‐effects models |
| Non‐serious adverse events | 25 per 1000f | 63 per 1000 | RR 2.51 | 246 | ⊕⊝⊝⊝ | |
| Days of hospitalisation | See comment | See comment | Not estimable | 0 | See comment | No trial reported this outcome |
| Blood ammonium levels | Mean blood ammonium levels in the control groups was | Mean blood ammonium levels in the intervention groups was | ‐ | 387 | ⊕⊕⊝⊝ | |
| *The basis for the assumed risk (e.g. the median control group risk across studies) is provided in footnotes. The corresponding risk (and its 95% confidence interval) is based on the assumed risk in the comparison group and the relative effect of the intervention (and its 95% CI). | ||||||
| GRADE Working Group grades of evidence. | ||||||
| aFor mental health domain. | ||||||
| Domain (SF‐36 scale; 0 to 100, higher score is better) | Mean difference (95% CI) | Ratio of means (95% CI) |
| Physical functioning | 7.90 | 1.12 |
| Role limitations due to physIcal problems | 9.60 | 1.15 |
| Bodily pain at 90 days | 1.80 | 1.03 |
| General health at 90 days | ‐6.20 (‐9.51 to ‐2.89) | 0.91 (0.86 to 0.96) |
| Vitality at 90 days | 2.80 (‐0.11 to 5.71) | 1.05 (1.00 to 1.10) |
| Social functioning at 90 days | 2.90 | 1.05 (1.01 to 1.08) |
| Role limitations due to emotional problems at 90 days | 4.80 (1.45 to 8.15) | 1.08 (1.02 to 1.13) |
| General mental health perceptions at 90 days | 3.10 (0.64 to 5.56) | 1.05 |
| SF‐36: Short Form‐36. | ||
| Trial | Adverse events |
| "No side effects were observed in our study series" | |
| "In the group treated with acetyl‐L‐carnitine, one patient complained of nausea, two of slight headache and two of abdominal pain. In the placebo group, one patient complained | |
| Researchers did not report on adverse events | |
| "Three patients in the acetyl‐L‐carnitine group (1 with mild hepatic encephalopathy and 2 with moderate hepatic encephalopathy) withdrew from the study because of abdominal pain. One patient in the placebo group withdrew from the study because of headache. In the placebo group, we observed occasional abdominal pain, cramping, diarrhoea, and flatulence. At follow‐up 1 mo after treatment ended, 2 patients in the acetyl‐L‐carnitine group and 5 patients in the placebo group experienced moderate hepatic encephalopathy" | |
| Researchers did not report on adverse events |
| Type of fatigue by hepatic encephalopathy | Fatigue (the Wessely and Powell test)b,c | |
| Mean difference (95% CI) | Ratio of means (95% CI) | |
| Mental fatigue in people with mild hepatic encephalopathy (0 (no fatigue) to 10 (highest possible))a | ‐0.80 (‐1.48 to ‐0.12) | 0.88 (0.78, to 0.98) |
| Mental fatigue in people with moderate hepatic encephalopathy (0 (no fatigue) to 10 (highest possible))a | 0.40 (‐0.21 to 1.01) | 1.07 (0.97 to 1.18) |
| Physical fatigue in people with mild hepatic encephalopathy (0 (no fatigue) to 16 (highest possible))a | 0.20 (‐0.72 to 1.12) | 1.02 (0.93 to 1.13) |
| Physical fatigue in people with moderate hepatic encephalopathy (0 (no fatigue) to 16 (highest possible))a | ‐0.20 (‐0.92 to 0.52) | 0.98 (0.90 to 1.06) |
| Type of hepatic encephalopathy | Acetyl‐L‐carnitine sample size | Placebo sample size | Blood ammonium levels | |
| Mean difference, mg/dL (95% CI) | Ratio of means (95% CI) | |||
| Mild hepatic encephalopathya | 31 | 30 | ‐13.00 | 0.81 |
| Moderate hepatic encephalopathya | 30 | 30 | ‐11.30 | 0.88 |
| Hepatic comab | 13 | 11 | ‐4.10 | 0.94 |
| Minimal hepatic encephalopathyc,d Subtotal (95% CI) | 60 | 55 | ‐21.90 | 0.66 |
| 33 | 34 | ‐16.70 | 0.72 | |
| 93 | 89 | ‐17.46 | 0.70 | |
| Severe hepatic encephalopathye | 30 | 30 | ‐13.80 | 0.86 |
| Total (95% CI) | 197 | 190 | ‐13.06 | 0.82 I²= 78% |
| Outcome or subgroup title | No. of studies | No. of participants | Statistical method | Effect size |
| 1 Quality of life (SF‐36 scale; 0 to 100, higher score is better) Show forest plot | 1 | Mean Difference (IV, Random, 95% CI) | Subtotals only | |
| 1.1 Physical functioning | 1 | 67 | Mean Difference (IV, Random, 95% CI) | 7.90 [4.49, 11.31] |
| 1.2 Role limitations due to physIcal problems | 1 | 67 | Mean Difference (IV, Random, 95% CI) | 9.60 [5.77, 13.43] |
| 1.3 Bodily pain at 90 days | 1 | 67 | Mean Difference (IV, Random, 95% CI) | 1.80 [‐2.78, 6.38] |
| 1.4 General health at 90 days | 1 | 67 | Mean Difference (IV, Random, 95% CI) | ‐6.20 [‐9.51, ‐2.89] |
| 1.5 Vitality at 90 days | 1 | 67 | Mean Difference (IV, Random, 95% CI) | 2.80 [‐0.11, 5.71] |
| 1.6 Social functioning at 90 days | 1 | 67 | Mean Difference (IV, Random, 95% CI) | 2.90 [0.44, 5.36] |
| 1.7 Role limitations due to emotional problems at 90 days | 1 | 67 | Mean Difference (IV, Random, 95% CI) | 4.80 [1.45, 8.15] |
| 1.8 General mental health perceptions at 90 days | 1 | 67 | Mean Difference (IV, Random, 95% CI) | 3.10 [0.64, 5.56] |
| 2 Non‐serious adverse events Show forest plot | 2 | 246 | Risk Ratio (M‐H, Random, 95% CI) | 2.51 [0.68, 9.22] |
| 3 Non‐serious adverse events (sensitivity analysis by missing data) Show forest plot | 2 | Risk Ratio (Random, 95% CI) | Subtotals only | |
| 3.1 Available case analysis | 2 | Risk Ratio (Random, 95% CI) | 2.50 [0.68, 9.16] | |
| 3.2 Best‐case scenario | 2 | Risk Ratio (Random, 95% CI) | 0.97 [0.28, 3.40] | |
| 3.3 Worst‐case scenario | 2 | Risk Ratio (Random, 95% CI) | 4.93 [1.48, 16.47] | |
| 3.4 Gamble‐Hollis analysis | 2 | Risk Ratio (Random, 95% CI) | 2.57 [0.48, 13.74] | |
| 3.5 Informative missingness odds ratio (OR = 2) | 2 | Risk Ratio (Random, 95% CI) | 2.51 [0.69, 9.17] | |
| 4 Fatigue (the Wessely and Powell test) Show forest plot | 1 | Mean Difference (IV, Random, 95% CI) | Subtotals only | |
| 4.1 Mental fatigue in people with mild hepatic encephalopathy (0 (no fatigue) to 10 (highest possible)) | 1 | 61 | Mean Difference (IV, Random, 95% CI) | ‐0.80 [‐1.48, ‐0.12] |
| 4.2 Mental fatigue in people with moderate hepatic encephalopathy (0 (no fatigue) to 10 (highest possible)) | 1 | 61 | Mean Difference (IV, Random, 95% CI) | 0.40 [‐0.21, 1.01] |
| 4.3 Physical fatigue in people with mild hepatic encephalopathy (0 (no fatigue) to 16 (highest possible)) | 1 | 61 | Mean Difference (IV, Random, 95% CI) | 0.20 [‐0.72, 1.12] |
| 4.4 Physical fatigue in people with moderate hepatic encephalopathy (0 (no fatigue) to 16 (highest possible)) | 1 | 61 | Mean Difference (IV, Random, 95% CI) | ‐0.20 [‐0.92, 0.52] |
| 5 Blood ammonium levels Show forest plot | 5 | 387 | Mean Difference (IV, Random, 95% CI) | ‐13.06 [‐17.24, ‐8.89] |
| 5.1 Mild hepatic encephalopathy | 1 | 61 | Mean Difference (IV, Random, 95% CI) | ‐13.00 [‐18.17, ‐7.83] |
| 5.2 Moderate hepatic encephalopathy | 1 | 60 | Mean Difference (IV, Random, 95% CI) | ‐11.30 [‐19.05, ‐3.55] |
| 5.3 Hepatic coma | 1 | 24 | Mean Difference (IV, Random, 95% CI) | ‐4.10 [‐10.77, 2.57] |
| 5.4 Minimal hepatic encephalopathy | 2 | 182 | Mean Difference (IV, Random, 95% CI) | ‐17.46 [‐21.63, ‐13.28] |
| 5.5 Severe hepatic encephalopathy | 1 | 60 | Mean Difference (IV, Random, 95% CI) | ‐13.80 [‐20.78, ‐6.82] |
| 6 Blood ammonium levels (sensitivity analysis according to missing data) Show forest plot | 5 | Mean Difference (IV, Random, 95% CI) | Subtotals only | |
| 6.1 Complete case analysis | 5 | 327 | Mean Difference (IV, Random, 95% CI) | ‐13.40 [‐18.31, ‐8.48] |
| 6.2 Strategy 1 | 5 | 342 | Mean Difference (IV, Random, 95% CI) | ‐12.88 [‐17.69, ‐8.06] |
| 6.3 Strategy 2 | 5 | 342 | Mean Difference (IV, Random, 95% CI) | ‐14.70 [‐20.23, ‐9.16] |
| 6.4 Strategy 3 | 5 | 342 | Mean Difference (IV, Random, 95% CI) | ‐14.06 [‐19.50, ‐8.62] |
| 6.5 Strategy 4 | 5 | 342 | Mean Difference (IV, Random, 95% CI) | ‐13.79 [‐18.99, ‐8.58] |