Surgery for patellar tendinopathy (jumper’s knee)
Abstract
Background
Patellar tendinopathy is an overuse condition that commonly affects athletes. Surgery is usually offered if medical and physical therapies fail to treat it effectively. There is variation in the type of surgery performed for the condition.
Objectives
To assess the benefits and harms of surgery for patellar tendinopathy in adults.
Search methods
We searched the following databases, to 17 July 2018: the Cochrane Central Register of Controlled Trials (CENTRAL) via the Cochrane Library, OVID MEDLINE, OVID Embase, clinical trial registries (www.ClinicalTrials.gov) and the WHO trials portal (www.who.int/ictrp/en/).
Selection criteria
We included all randomised controlled trials (RCTs) that compared surgical techniques (open or arthroscopic) with non‐operative treatment (including placebo surgery, exercise or other non‐surgical modalities) in adults with patellar tendinopathy.
Major outcomes assessed were knee pain, function, quality of life, participant global assessment of success, withdrawal rate, proportion with adverse events and proportion with tendon rupture.
Data collection and analysis
Two review authors selected studies for inclusion, extracted trial characteristics and outcome data, assessed the risk of bias and assessed the quality of the evidence using GRADE.
Main results
Two trials (92 participants) met our inclusion criteria. Participants in both trials were followed for 12 months. Neither trial compared surgery to placebo surgery. One trial (40 randomised participants) compared open surgical excision with eccentric exercises, and the other compared arthroscopic surgery with sclerosing injections (52 randomised participants). Due to the nature of the interventions, neither the participants or the investigators were blinded to the group allocation, resulting in the potential for performance and detection bias. Some outcomes were selectively not recorded, leading to reporting bias. Overall, the certainty of the evidence from these studies was low for all outcomes due to the potential for bias, and imprecision due to small sample sizes.
Compared with eccentric exercises, low‐certainty evidence indicates that open surgical excision provides no clinically important benefits with respect to knee pain, function or global assessment of success. At 12 months, mean knee pain — measured by pain with standing jump on a 10‐point scale (lower scores indicating less pain) — was 1.7 points (standard deviation (SD) 1.6) in the eccentric training group and 1.3 (SD 0.8) in the surgical group (one trial, 40 participants). This equates to an absolute pain reduction of 4% (ranging from 4% worse to 12% better, the minimal clinically important difference being 15%) and a relative reduction in pain of 10% better (ranging from 30% better to 10% worse) in the treatment group. At 12 months, function on the zero‐ to 100‐point Victorian Institute of Sport Assessment (VISA) scale was 65.7 (SD 23.8) in the eccentric training group and 72.9 (SD 11.7) in the surgical group (one trial, 40 participants). This equates to an absolute change of 7% better function (ranging from 4% worse to 19% better) and relative change of 25% better (ranging from 15% worse to 65% better, the minimal clinically important difference being 13%). Participant global assessment of success was measured by the number of people with no pain at 12 months: 7/20 participants in the eccentric training group reported no pain, compared with 5/20 in the open surgical group (risk ratio (RR) 0.71 (95% CI 0.27 to 1.88); one trial, 40 participants). There were no withdrawals, but five out of 20 people from the eccentric exercise group crossed over to open surgical excision. Quality of life, adverse events and tendon ruptures were not measured.
Compared with sclerosing injection, low‐certainty evidence indicates that arthroscopic surgery may provide a reduction in pain and improvement in participant global assessment of success, however further studies are likely to change these results. At 12 months, mean pain with activities, measured on a 100‐point scale (lower scores indicating less pain), was 41.1 (SD 28.5) in the sclerosing injection group and 12.8 (SD 19.3) in the arthroscopic surgery group (one trial, 52 participants). This equates to an absolute pain reduction of 28% better (ranging from 15% to 42% better, the minimal clinically important difference being 15%), and a relative change of 41% better (ranging from 21% to 61% better). At 12 months, the mean participant global assessment of success, measured by satisfaction on a 100‐point scale (scale zero to 100, higher scores indicating greater satisfaction), was 52.9 (SD 32.6) in the sclerosing injection group and 86.8 (SD 20.8) in the arthroscopic surgery group (one trial, 52 participants). This equates to an absolute improvement of 34% (ranging from 19% to 49%). In both groups, one participant (4%) withdrew from the study. Functional outcome scores, including the VISA score, were not reported. Quality‐of‐life assessment, adverse events, and specifically the proportion with a tendon rupture, were not reported.
We did not perform subgroup analysis to assess differences in outcome between arthroscopic or open surgical excision, as we did not identify more than one study with a common comparator.
Authors' conclusions
We are uncertain if surgery is beneficial over other therapeutic interventions, namely eccentric exercises or injectables. Low‐certainty evidence shows that surgery for patellar tendinopathy may not provide clinically important benefits over eccentric exercise in terms of pain, function or participant‐reported treatment success, but may provide clinically meaningful pain reduction and treatment success when compared with sclerosing injections. However, further research is likely to change these results. The evidence was downgraded two levels due to the small sample sizes and susceptibility to bias. We are uncertain if there are additional risks associated with surgery as study authors failed to report adverse events. Surgery seems to be embedded in clinical practice for late‐stage patella tendinopathy, due to exhaustion of other therapeutic methods rather than evidence of benefit.
PICO
Plain language summary
Surgery for patella tendinopathy (jumper's knee)
Background
Patella tendinopathy is a painful condition that commonly affects jumping athletes who train a lot, for example those who play volleyball and basketball. Many people with the condition are unable to continue their chosen sport at the same level of competition or intensity of training. There are many treatments for the condition, the most common of which is a particular type of exercise called eccentric exercise (where the tendon is under tension while the muscle lengthens).
Other treatments for patella tendinopathy include oral and topical analgesia (pain‐relief medication taken orally or applied to the skin), various injectables (e.g. corticosteroids) and surgery. Surgery is used if other treatments fail, and is the treatment assessed in this review.
Study characteristics
This Cochrane Review is current to July 2018. We searched online databases for all studies (specifically randomised controlled trials) that compared surgical treatment with non‐operative treatment in adults with patellar tendinopathy. We found two studies; they compared open surgical removal to eccentric exercises (one study involving 40 people) and arthroscopic surgery to sclerosing injections (these scar and block the blood vessels supplying nerve fibres to the diseased tendon) (one study involving 56 people). The studies were performed in an outpatient setting in two countries (Norway and Sweden). The majority of people in the studies were male, with a mean age ranging from 27 to 31 years, and mean symptom duration of 24 to 33 months. Trials were conducted without funding (financial support) from industry (medical or device companies), but some authors from the one study received funding from pharmaceutical companies in addition to research funding from non‐industry sources.
Key results
Compared with eccentric exercises, open surgery offered little benefit at 12 months (results for individual outcomes as follows).
Pain (lower scores mean less pain)
Improved by 4% (ranging from 4% worse to 12% better) or by 0.4 points on a scale of zero to 10 points.
People who had surgery rated their pain as 1.3 points.
People who had eccentric exercises rated their pain as 1.7 points.
Global assessment of success (those who reported no pain at 12 months)
10% fewer people had no pain (ranging from 38% less to 18% more), or 10 fewer people out of 100.
Twenty‐five out of 100 people had no pain with surgery.
Thirty‐five out of 100 people had no pain with eccentric exercises.
Withdrawals
No participants in either group withdrew from the study.
The study did not report on quality‐of‐life improvements or adverse events (including tendon ruptures).
Compared with sclerosing injections, arthroscopic (keyhole) surgery offered some reduction in pain and improvement in participant global assessment of success at 12 months (results for individual outcomes as follows; further studies are likely to change these results).
Pain (lower scores mean less pain)
Improved by 28% (ranging from 15% to 42% better) or by 28 points on a scale of zero to 100 points.
People who had surgery rated their pain as 12.8 points.
People who had sclerosing injection rated their pain as 41.1 points.
Global assessment of success (participant‐reported success, higher score is better)
Improved by 34% (ranging from 19% to 49% better) or by 33.9 points on a scale of zero to 100 points.
People who had surgery rated their pain as 86.8 points.
People who had sclerosing injection rated their pain as 52.9 points.
Withdrawals
One person from each group (4%) withdrew from the study for reasons unrelated to the treatment.
The study did not report on quality‐of‐life improvements, functional score improvements or adverse events (including tendon ruptures).
Quality of the evidence
We decided the evidence was low‐certainty due to flaws in the design of the studies that may over‐estimate benefits of treatment. For example, people involved in the study were aware of which treatment they were receiving, the studies selectively reported some results but not others, and there was imprecision in the results due to the small number of participants and trials. Therefore, we are uncertain if surgery has any benefits over eccentric exercises or sclerosing injections for treating patellar tendinopathy in adults. Further studies are likely to change the results.
Authors' conclusions
Summary of findings
| Open surgical excision compared to eccentric exercises for patella tendinopathy | ||||||
| Patient or population: adult participants with patellar tendinopathy | ||||||
| Outcomes | Anticipated absolute effects* (95% CI) | Relative effect | № of participants | Certainty of the evidence | Comments | |
| Risk with eccentric exercises | Risk with open surgical excision | |||||
| Knee pain Scale from: 0 to 10 (0 is no pain) | The mean pain was 1.7 points | The mean pain in the intervention group was 0.4 points better | ‐ | 40 | ⊕⊕⊝⊝ | Absolute change 4% better (4% worse to 12% better); relative change 10% better (30% better to 10% worse)3,4 |
| Function | The mean function in the control group was 65.7 | The mean function was 7.2 points higher | ‐ | 40 | ⊕⊕⊝⊝ | Absolute change 7% better (4% worse to 19% better); relative change 25% better (15% worse to 65% better)3,4 |
| Participant global assessment of success | 350 per 1000 | 250 per 1000 (95 to 658) | RR 0.71 (0.27 to 1.88) | 40 | ⊕⊕⊝⊝ | Absolute risk difference of 10% less success (38% less to 18% more); relative change 29% fewer experience no pain at 12 months (73% fewer to 88% more)4 |
| Quality of life | not measured | not measured | ‐ | ‐ | Not measured | |
| Withdrawal rate | 5/20 crossed over to surgery | No withdrawals or cross‐overs were possible from surgery | No estimate | 40 | ⊕⊕⊝⊝ | We cannot estimate comparative withdrawal rates, as no or cross‐overs were possible from surgery to exercise. |
| Adverse event | None | One participant developed chronic quadriceps pain | 40 | ⊕⊕⊕⊝ | Not estimable | |
| Tendon rupture | Not reported | Not reported | ‐ | ‐ | ‐ | Not reported, unclear if this outcome was measured |
| *The risk in the intervention group (and its 95% confidence interval) is based on the assumed risk in the comparison group and the relative effect of the intervention (and its 95% CI). | ||||||
| GRADE Working Group grades of evidence | ||||||
| 1 Downgraded one level for significant detection bias and reporting bias | ||||||
| Arthroscopic surgery compared to sclerosing injection for patella tendinopathy | ||||||
| Patient or population: adult participants with patellar tendinopathy | ||||||
| Outcomes | Anticipated absolute effects* (95% CI) | Relative effect | № of participants | Certainty of the evidence | Comments | |
| Risk with sclerosing injection | Risk with arthroscopic surgery | |||||
| Knee pain Scale from: 0 to 100 (0 is no pain) | Mean pain was 41.1 points. | The mean pain was 28.3 points better in the intervention group (14.8 to 41.8 points better). | ‐ | 50 | ⊕⊕⊝⊝ | Absolute difference 28% better (15% to 42% better); relative change 41% better (21% to 61% better)3, NNTB 2 (1 to 4) |
| Function | Not reported | Not reported | ‐ | ‐ | ‐ | Not reported |
| Participant global assessment of success Follow‐up: 12 months | Mean satisfaction was 52.9 points. | The mean patient satisfaction was 33.9 points better (18.7 to 49.1 points better). | ‐ | 50 | ⊕⊕⊝⊝ | Absolute improvement of 34% (19% to 49%)4 |
| Quality of life | Not measured | Not measured | ‐ | Not measured | ||
| Withdrawal rate | 1 event | 1 event, no reliable estimate | ‐ | 40 | ⊕⊝⊝⊝ VERY LOW1,2 | Not related to treatment (pregnancy) |
| Adverse event | Not reported | Not reported | ‐ | ‐ | ‐ | Not reported, unclear if this outcome was measured |
| Tendon rupture | Not reported | Not reported | ‐ | ‐ | ‐ | Not reported, unclear if this outcome was measured |
| *The risk in the intervention group (and its 95% confidence interval) is based on the assumed risk in the comparison group and the relative effect of the intervention (and its 95% CI). | ||||||
| GRADE Working Group grades of evidence | ||||||
| 1 Downgraded one level for significant detection bias and reporting bias | ||||||
Background
Description of the condition
Patellar tendinopathy is an overuse condition that commonly affects athletes, with an overall incidence of 14% in one study (Lian 2005). Patellar tendinopathy is more common in jumping sports, with up to 40% incidence in volleyball players (Ferretti 1986); hence, Blazina coined the term 'jumper's knee' in his original description of the condition (Blazina 1973). The prognosis is poor: one report suggests that more than one‐third of athletes who seek treatment do not return to sport within six months (Cook 1997), and another study reported that up to 53% of athletes retire from sport due to the condition, compared to 7% of athletes who retire without the condition (Kettunen 2002).
'Jumper’s knee' is a broader term than patellar tendinopathy and includes people with pain at the quadriceps insertion of the tendon (25% of cases), the insertion at the distal (inferior) pole of the patella (knee cap) (65%), and the insertion at the tibial tubercle (raised area of bone over the upper tibia) (10%) (Ferretti 1985). However, patellar tendinopathy is limited to symptoms where the patellar tendon (also known as the patellar ligament) inserts at the distal pole of the knee cap (Ferretti 1985).
The condition was previously called tendonitis, implying it is associated with inflammation, but histology shows it is degenerative rather than inflammatory. It is characterised by degeneration, cell death and micro‐tears in the tendon, along with evidence of formation of new blood vessels (Khan 2002). The diagnosis is usually clinical but ultrasound shows thickening of the tendon (Mourad 1988), and both ultrasound and magnetic resonance imaging (MRI) scanning indicate abnormalities at the proximal patellar tendon attachment and blurry ligament margins (Khan 1996).
The primary classification system used to grade the severity of patella tendinopathy was formalised by Blazina, who divided the condition into phases (Blazina 1973). This provided a qualitative description of the clinical progression of the disease. Phase 1 is pain after exercise, phase 2 is characterised by pain that is present at the beginning and end of activity but absent after ‘warm up’, and phase 3 is pain during and after activity (Blazina 1973). Phase 4 was a later addition by Roels and others which represents complete tendon rupture (Roels 1978).
To better quantify severity and response to treatment, the Victorian Institute of Sport Assessment (VISA) scale was developed. Designed in 1998, it is a series of eight questions with a total score out of 100, and a higher score represents fewer symptoms. Examples of mean scores are 95 (standard deviation (SD) 8) for asymptomatic individuals; 55 (SD 12) for those with the disease participating in sport; 22 (SD 17) as a preoperative score; 49 (SD 15) for six‐month postoperative recovery; and 75 (SD 17) for 12‐month postoperative recovery (Visentini 1998).
Description of the intervention
Non‐surgical treatments for patellar tendinopathy include reduction in sporting and other activity, exercise, anti‐inflammatory drugs, taping, massage, physiotherapy modalities and injection therapies; there is limited evidence or consensus on optimal treatment (Cook 2001). Most commonly, exercise strength in particular, eccentric exercises (when the muscle lengthens as it contracts) are used. In the case of knee tendinopathy, eccentric exercises typically include decline squat training or similar exercises (Larsson 2012; Malliaras 2013).
Approximately 10% of athletes with patellar tendinopathy, usually those in the latter stages of the condition for whom non‐surgical interventions have failed, undergo surgery (Ogon 2006). Surgery may be performed with an open incision, or arthroscopically (with an endoscope or illuminated optical tubing device, via a small incision or keyhole). Procedures include surgical debridement or excision of the degenerated areas of the tendon; drilling of the lower pole of the patella bone at the site of tendon attachment to stimulate new blood flow and promote healing (Blazina 1973; Romeo 1999); and tenotomy, which involves an incision to expose the tendon, followed by cutting through or disconnecting the tendon to allow for a greater range of movement of the tendon and joint (Khan 1999); or a combination of procedures.
How the intervention might work
There are different purported modes of action depending on the type of surgical intervention. During surgical debridement, the surgeon removes the diseased portion of the tendon. Drilling of the bone at the site of tendon attachment is thought to stimulate a healing response by inducing blood flow to the area (Blazina 1973; Romeo 1999). Tenotomy involves cutting through the tendon, and is thought to 'release' the tendon to allow greater range of movement through the tendon and muscle (Khan 1999). How surgery improves the function of the patellar tendon is not well understood, as there seems to be little correlation between the appearance of abnormalities on imaging of the tendon and clinical assessment via functional scores after surgery (Khan 1999).
Why it is important to do this review
Surgery is usually offered for patella tendinopathy after failure of medical and physical therapies, but there is variation in the type of surgery performed for the condition, and little consensus on the benefits of surgery (Figueroa 2016; Kaeding 2006; Khan 2016). Indeed, the clinical benefit of surgery has been questioned; a randomised controlled trial reported little difference in outcome between participants who underwent surgery compared with those who received eccentric exercise training, and both treatment groups reported improvement over the 12‐month follow‐up (Bahr 2006). However, large case series reporting the utility of surgery for the condition continue to be published (Brockmeyer 2015), and review articles summarising evidence from case series also conclude that surgery is beneficial (Figueroa 2016; Khan 2016). There is no current systematic review that summarises and appraises the quality and strength of evidence from randomised controlled trials comparing surgical and non‐surgical interventions.
Objectives
To assess the benefits and harms of surgery for patella tendinopathy in adults.
The major outcomes were pain, function, quality of life, participant global assessment of success, withdrawal rate, total adverse events and tendon rupture. The minor outcome was return to sport.
Methods
Criteria for considering studies for this review
Types of studies
We included studies described as randomised controlled trials (RCTs). We included studies reported as full text, those published as abstract only and unpublished data. TWe applied no language or date restrictions on the search.
Types of participants
We included trials of adults with a diagnosis of patella tendinopathy, as defined in the trials.
Types of interventions
Trials were eligible if they compared surgical techniques (open or arthroscopic) with placebo surgery, exercise or other non‐surgical modalities.
Types of outcome measures
Major outcomes
-
Knee pain: mean overall pain, assessed by visual analogue scale (VAS), numerical or categorical rating scales or other measures.
-
Function: mean function, assessed by Victorian Insitute of Sport Assessment (Visentini 1998) or Lysholm or other region‐specific or condition‐specific scores.
-
Health‐related quality of life: overall quality‐of‐life score (e.g. SF‐36, EQ5D, EQ‐VAS).
-
Participant global assessment of success, as measured by a participant‐reported global impression of clinical change (improvement), or similar measure.
-
Proportion of withdrawals.
-
Proportion with adverse events (any).
-
Proportion with tendon rupture.
Minor outcomes
-
Return to sport.
Time points
Follow‐up times were expected to be between three months and two years. We planned to extract data on pain, function, quality of life, global success and adverse events at six months and 12 months. If data were reported at multiple time points within each of these periods, we planned to extract data at the latest possible time point up to six months and up to 12 months.
Search methods for identification of studies
Electronic searches
We searched the Cochrane Central Register of Controlled Trials (CENTRAL), Ovid MEDLINE and Ovid Embase. We also conducted a search of ClinicalTrials.gov (www.ClinicalTrials.gov) and the WHO trials portal (www.who.int/ictrp/en/). We searched all databases from their inception until 17 July 2018 and we imposed no restriction on language of publication. See Appendix 1 for the MEDLINE search strategy; Appendix 2 for CENTRAL, Appendix 3 for Embase and Appendix 4 for trial registries.
Searching other resources
We checked the reference lists of all primary studies and review articles for potential additional studies.
Data collection and analysis
Selection of studies
Two review authors (MD, AP) independently screened titles and abstracts of all potentially relevant studies from the search for inclusion and coded them as 'retrieve' (eligible or potentially eligible/unclear) or 'do not retrieve'. We retrieved the full‐text reports and two review authors (MD, AP) independently screened the full text, identified studies for inclusion and identified and recorded reasons for exclusion of the ineligible studies. We resolved any disagreement through discussion or, if required, we consulted a third person (IH). We identified and excluded duplicates and collated multiple reports of the same study so that each study, rather than each report, was the unit of interest in the review. We recorded the selection process in sufficient detail to complete a PRISMA flow diagram (PRISMA Group 2009, prisma‐statement.org/PRISMAStatement/Default.aspx) and Characteristics of excluded studies table.
Data extraction and management
We used a data collection form for study characteristics and outcome data. Data were independently extracted by two review authors (MD and AP) and disagreements settled by discussion or referral to the senior author (IH). We extracted the following study characteristics.
-
Methods: study design, total duration of study, details of any 'run‐in' period, number of study centres, location, study setting, withdrawals and year of study.
-
Participants: number, mean age, age range, sex, socioeconomic status, disease duration, severity of condition, diagnostic criteria, important condition‐specific and general health baseline data, inclusion criteria and exclusion criteria.
-
Interventions: intervention, comparison, concomitant medications, concomitant physical treatments and excluded treatments.
-
Outcomes: primary and secondary outcomes specified and collected and time points reported.
-
Characteristics of the design of the trial, as outlined below in Assessment of risk of bias in included studies.
-
Notes: funding for trial and notable declarations of interest of trial authors.
Two review authors (MD, AP) independently extracted the outcome data from the included studies. We extracted the number of events and the number of participants per treatment group for dichotomous outcomes, and means and standard deviations and number of participants per treatment group for continuous outcomes. We noted in the Characteristics of included studies table if outcome data were not reported in a usable way and when data were transformed or estimated from a graph. We resolved disagreements by consensus or by involving a third person (IH). One review author (MD) transferred the data into the Review Manager 5 file (RevMan 2014). We confirmed the accuracy of data by comparing those presented in the systematic review with the study reports. We used Web Plot Digitizer website to extract data from graphs or figures. These data were also extracted in duplicate.
We applied the following a priori decision rules to select which data to extract in the event of multiple outcome reporting.
-
Pain: overall pain was selected preferentially over pain related to activity, followed by pain at rest. We preferentially selected pain on a VAS scale over pain reported on numerical or categorical rating scales, and over pain reported on other scales, such as a subscore of a knee score.
-
Knee functional outcome scores: VISA score was preferred, followed by Lysholm Knee Score, Knee injury and Osteoarthritis Outcome score (KOOS), Western Ontario and McMaster Universities Osteoarthritis Index (WOMAC) and Oxford Knee scores.
-
If both final values and change‐from‐baseline values were reported for the same outcome, we preferentially extracted change‐from‐baseline values.
-
If both unadjusted and adjusted values for the same outcome were reported, we preferentially extracted adjusted values.
-
In accordance with Consolidated Standards Of Reporting Trials (CONSORT) guidelines, we reported on both intention‐to‐treat and per‐protocol analysis, using the per‐protocol to explore 'efficacy' of the intervention versus intention‐to‐treat to reflect the 'effectiveness' of the intervention.
-
If there were multiple time points, we extracted outcomes reported up to six months and up to 12 months.
Main planned comparisons
-
Surgery versus placebo.
-
Surgery versus exercise which is a commonly used first‐line therapy.
-
Surgery versus other non‐operative interventions, including but not limited to glucocorticoid injection; other injections including autologous blood products, stem cells and sclerosing agents; or pharmacological treatments (we planned to present the results by common comparisons).
Assessment of risk of bias in included studies
Two review authors (MD, AP) independently assessed the risk of bias for each study using the criteria outlined in the Cochrane Handbook for Systematic Reviews of Interventions (Higgins 2017). Risk of bias included selection, performance, detection, attrition and reporting bias. We resolved any disagreements by discussion or by involving another review author (IH).
We considered blinding separately for different key outcomes, where necessary (e.g. for unblinded outcome assessment, risk of bias for tendon rupture may be different than for a participant‐reported pain scale). We also considered the impact of missing data by key outcomes.
Where information on risk of bias was obtained from unpublished data or correspondence with an author, we noted this in the 'Risk of bias' table.
When considering treatment effects, we took into account the risk of bias for the studies that contributed to that outcome.
We presented the figures generated by the 'Risk of bias' tool to provide summary assessments of the risk of bias.
Assesment of bias in conducting the systematic review
We conducted the review according to the published protocol and report any deviations from it in Differences between protocol and review.
Measures of treatment effect
We analysed dichotomous data as risk ratios or Peto odds ratios when the outcome was a rare event (less than 10%), and used 95% confidence intervals (CIs). Continuous data were analysed as mean difference (MD) or standardised mean difference (SMD), depending on whether the same scale was used to measure an outcome, and 95% CIs. We entered data presented as a scale with a consistent direction of effect across studies.
When different scales were used to measure the same conceptual outcome (e.g. disability), SMDs were calculated, with corresponding 95% CIs. SMDs were back‐translated to a typical scale (e.g. zero to 10 for pain) by multiplying the SMD by a typical among‐person standard deviation (e.g. the standard deviation of the control group at baseline from the most representative trial), in accordance with Chapter 12 of theCochrane Handbook for Systematic Reviews of Interventions (Schünemann 2017b).
If return to sport was measured at intervals outside the three‐, six‐ or 12‐month time points, we analysed time‐to‐event data as hazard ratios. Rate data were to be analysed using Poisson methods.
In Effects of interventions, summary of findings Table for the main comparison and summary of findings Table 2, we provide the absolute per cent difference and the relative per cent change from baseline. Where the outcome showed a clinically significant difference, we also provide the number needed to treat for an additional beneficial outcome (NNTB) or number needed to treat for an additional harmful outcome (NNTH). For dichotomous outcomes, the NNTB or NNTH was calculated from the control group event rate and the relative risk, using the Visual Rx NNT calculator (Cates 2008). The NNTB or NNTH for continuous measures was calculated using the Wells calculator (available at the Cochrane Musculoskeletal editorial office).
When interpreting results, we assumed a minimal clinically important difference of 1.5 points on a 10‐point pain scale or 15 points on a 100‐point scale (Hawker 2011); and 13 points on the zero‐to‐100 VISA scale (Hernandez‐Sanchez 2014).
For dichotomous outcomes, the absolute risk difference was calculated using the risk difference statistic in Review Manager software (RevMan 2014), and the result expressed as a percentage. For continuous outcomes, the absolute benefit was calculated as the improvement in the intervention group minus the improvement in the control group, in the original units, expressed as a percentage.
The relative per cent change for dichotomous data was calculated as the risk ratio minus one, expressed as a percentage. For continuous outcomes, the relative difference in the change from baseline was calculated as the absolute benefit divided by the baseline mean of the control group, expressed as a percentage.
Unit of analysis issues
Where multiple trial arms were reported in a single trial, we included only the relevant arms. We planned to halve the control group if two comparisons (e.g. arthroscopic surgery versus placebo and open surgery versus placebo) were combined in the same meta‐analysis.
Dealing with missing data
We contacted investigators or study sponsors in order to verify key study characteristics and obtain missing numerical outcome data, where possible (e.g. when a study was identified as abstract only or when data were not available for all participants). Where this was not possible, and the missing data were thought to introduce serious bias, we explored the impact of including such studies in the overall assessment of results by a sensitivity analysis.
For dichotomous outcomes (e.g. number of withdrawals due to adverse events), we calculated the withdrawal rate using the number of participants randomised in the group as the denominator.
For continuous outcomes (e.g. mean change in pain score), we calculated the MD or SMD based on the number of participants analysed at that time point. We planned to use the number of randomised participants in each group at baseline, if the number of participants analysed was not presented for each time point.
Where possible, we computed missing standard deviations from other statistics such as standard errors, CIs or P values, according to the methods recommended in the Cochrane Handbook for Systematic Reviews of Interventions (Li 2019). If we could not calculate standard deviations, we imputed them (e.g. from other studies in the meta‐analysis) (Li 2019).
Assessment of heterogeneity
Clinical and methodological diversity were assessed in terms of participants, interventions, outcomes, and study characteristics for the included studies, to determine whether a meta‐analysis was appropriate. This was done by observing the data in the data extraction tables. Statistical heterogeneity was assessed by visual inspection of the forest plot to assess for obvious differences in results between the studies, and by using the I² and Chi² statistical tests.
As recommended in Deeks 2017, we interpreted I² values as follows: 0% to 40% 'might not be important'; 30% to 60% may represent 'moderate' heterogeneity; 50% to 90% may represent 'substantial' heterogeneity; and 75% to 100% may represent 'considerable' heterogeneity. As noted in the Cochrane Handbook for Systematic Reviews of Interventions, we understood that the importance of I2 depends on the magnitude and direction of effects and the strength of evidence for heterogeneity.
The Chi² test values were interpreted as follows: a P value of 0.10 or less indicates evidence of statistical heterogeneity.
If we identified substantial heterogeneity (greater than 50%), we planned to report it and investigate possible causes by following the recommendations in Deeks 2017.
Assessment of reporting biases
We planned to create and examine a funnel plot to explore possible small‐study biases. In interpreting funnel plots, we planned to examine the different possible reasons for funnel plot asymmetry as outlined in Sterne 2017. If we are able to pool more than 10 trials, we planned to undertake formal statistical tests to investigate funnel plot asymmetry, and planned to follow the recommendations in Sterne 2017.
To assess outcome reporting bias, we checked trial protocols against published reports. For studies published after 1 July 2005, we screened the WHO trial search at the International Clinical Trials Registry Platform of the World Health Organization (http://apps.who.int/trialssearch/) for the a priori trial protocol. We evaluated whether selective reporting of outcomes was present.
Data synthesis
We planned to undertake meta‐analyses only where this would be meaningful, i.e. if the treatments, participants, and the underlying clinical question were similar enough for pooling to make sense. We planned to use a random‐effects model.
GRADE and 'Summary of findings' tables
We created a 'Summary of findings' table using the following outcomes: pain; knee function; quality of life; participant global assessment of success; withdrawal rate; adverse events (total); and tendon rupture.
The comparison in the first 'Summary of findings' table is eccentric exercise, followed by pooled non‐operative interventions in the second table. The main time point is 12 months.
Two review authors(MD, AP) independently assessed the certainty of the evidence. We used the five GRADE considerations (study limitations, consistency of effect, imprecision, indirectness, and publication bias) to assess the quality of a body of evidence as it relates to the studies which contribute data to the meta‐analyses for the prespecified outcomes, and reported the certainty of evidence as high, moderate, low, or very low. We considered the following criteria for upgrading the certainty of evidence, if appropriate: large effect, dose‐response gradient and plausible confounding effect. We used the methods and recommendations described in section 8.5 and 8.7, and chapters 11 and 12, of the Cochrane Handbook for Systematic Reviews of Interventions (Higgins 2017; Schünemann 2017a; Schünemann 2017b). We used GRADEpro GDT software to prepare the 'Summary of findings' tables (GRADEpro GDT 2015). We justified all decisions to downgrade or upgrade the certainty of studies using footnotes and comments to aid the reader's understanding of the review, where necessary. We provided the NNTB or NNTH, and the absolute and relative per cent change, in the 'Comments' column of the tables, as described in Measures of treatment effect.
Subgroup analysis and investigation of heterogeneity
We planned to carry out the following subgroup analyses, for the outcomes knee pain and function.
-
Open surgery versus arthroscopic surgery.
-
Secondary analysis combining non‐operative comparators.
We planned to use the formal test for subgroup interactions in Review Manager 5 (RevMan 2014) and to use caution in the interpretation of subgroup analyses, as advised in Deeks 2017.
Sensitivity analysis
We planned to carry out sensitivity analyses to investigate the robustness of the treatment effect for pain and function in terms of selection and detection biases.
-
Selection bias: we planned to remove trials at risk of selection bias (i.e. with inadequate or unclear allocation concealment) from the meta‐analysis.
-
Detection bias: we planned to remove trials with unclear or inadequate blinding of the participants from the meta‐analysis.
Results
Description of studies
Results of the search
The search strategy identified 225 unique citations. After screening titles and abstracts, we excluded 217 studies and assessed the full text of eight citations. Six of these were excluded (reasons listed below), and two studies met the inclusion criteria. We did not identify any ongoing studies or studies awaiting classification. The results of the search are presented in Figure 1.
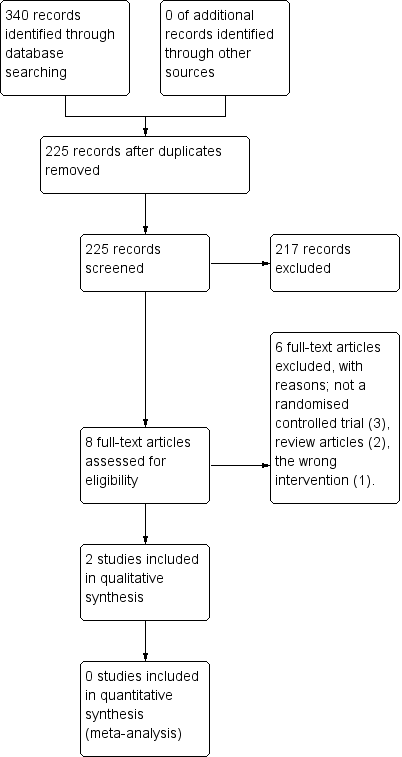
Study flow diagram.
Included studies
Trial design, setting and characteristics
We included two RCTs in the review. Both were parallel trials. Participants, inclusion and exclusion criteria, interventions, comparators and outcomes are described in the Characteristics of included studies table, along with any clinical characteristics a reader (i.e. patient or surgeon) might wish to know (e.g. so they can see whether the characteristics of participants in the trial match their own). Participants in both trials were followed for a total of 12 months. One trial compared open surgical excision with eccentric exercises (Bahr 2006), and the other compared arthroscopic surgery with sclerosing injections (Willberg 2011). No errata or retractions were noted at the time of the search.
Trial participants
The two trials included a total of 92 randomised participants; trial sizes varied from 40 to 52 participants. In general, the inclusion criteria for both trials were similar and included a clinical history, examination and imaging findings consistent with a presentation of patella tendinopathy, patient complaints of pain and tenderness at the inferior pole of the patella. In both studies participants had failed a minimum of three months of non‐surgical treatment, including rest, analgesia and physical therapy.
Across both trials the majority of participants were male (less than 10% of participants in each study were female) with a mean age of 26 to 31 years. Symptom duration varied but there was a mean of 20 to 30 months' duration in symptoms.
One study did not report training volume at baseline (Willberg 2011). Similar loads were reported in Bahr 2006, with means of 12.2 hours per week in the open surgical excision group compared with 11.2 hours per week in the eccentric exercises group.
The studies used different scales for measuring pain; in one study the surgical group had a baseline score of 4.3/10 pain with jumping, compared to 3.9/10 in the eccentric exercises group. In the other study the surgical group had higher baseline pain levels, with activity‐related pain scores of 76.5/100 compared to 69.0/100 in the sclerosing injection group. It is not clear what these activities were, and therefore we cannot draw conclusions as to why the difference existed.
One study (Bahr 2006) reported similar levels of function between the open surgical excision group and the eccentric exercises group at baseline (scores of 31/100 and 29/100, respectively). The other study (Willberg 2011) did not report on functional outcomes.
Interventions
Surgery was performed differently in the two studies. In one study, open surgical excision was carried out by two orthopaedic surgeons, whereas the details of who performed the arthroscopic surgery in the other study not disclosed.
Open surgical excision involved a 5 cm longitudinal midline incision from the inferior pole of the patella distally. A tourniquet was not used. The paratenon was split longitudinally and any pathologic paratenon tissue was removed. The tendon was split longitudinally in the midline to expose the deepest layers and all tissue that appeared abnormal was removed, or if not seen macroscopically the area calculated from the MRI was removed. Once the sutures were removed the participants were exposed to the same physiotherapist and eccentric exercises as the non‐operative group (Bahr 2006).
Arthroscopic surgery was performed under local anaesthetic, using anterolateral and anteromedial portals. No tourniquet was used. The patella tendon insertion into the patella was identified following a routine arthroscopic examination of the knee. A 4.5 mm shaver was utilised to destroy only the region with high blood flow and nerves adjacent to the tendinosis changes on the dorsal side of the tendon identified with ultrasound. No tendon tissue was resected and the Hoffa (Infrapatellar) fat pad was saved. Portals were closed with tape. No information was given on who performed the surgeries. Postoperatively, participants were allowed to weight bear as tolerated; from two weeks, gradual increase in loading of the tendon as tolerated was allowed, with no specific instructions on what exercises to do. This was the same as the sclerosing injection group (Willberg 2011).
Non‐operative comparisons involved eccentric exercises and sclerosing injections. Eccentric exercises were performed by the participants themselves with weekly supervision provided by the same physiotherapist. The exercises involved using a 25‐degree decline board at home, where the downward (eccentric) component was performed on the affected leg and the upward (concentric) component was performed on the asymptomatic leg. The participant was instructed to perform the squat to 90 degrees with the back in a vertical position. The participant was instructed to take two seconds for the eccentric component. The exercises involved twice‐daily sessions of three sets of 15 repetitions for a total duration of 12 weeks, with weekly supervision by a physiotherapist. No warm‐up was performed (Bahr 2006).
Sclerosing injections were performed using Polidocanol. A 0.7 mm x 50 mm needle, connected to a 2 mL syringe, was utilised. Volumes of 0.1 mL to 0.2 mL were injected into the regions with local neovascularisation/high blood flow dorsal to the proximal patellar tendon under ultrasound guidance. A maximum of three injections were given at six‐week intervals. All injections were performed by the same, single sonographer. Post‐injection, participants were allowed to weight bear as tolerated; from two weeks, gradual increase in loading of the tendon as tolerated was allowed, with no specific instructions on what exercises to do. This was the same as the arthroscopic surgery group (Willberg 2011).
Outcomes
Pain
All studies assessed at least one measure of pain, but measurement varied across trials. In one study, knee pain was measured by pain with standing jump (Bahr 2006). This was recorded on a zero‐ to 10‐point VAS at 12 months only. A lower score meant less pain. The other study (Willberg 2011) utilised a visual analogue scale for pain, with values of zero to 100, where a lower score meant less pain.
Function
Only one of the two studies (Bahr 2006) reported functional outcomes. It utilised the Victorian Institute of Sport Assessment (VISA) score for patella tendinopathy to measure functional response. The VISA score is a patient‐reported outcome score on a zero‐ to 100‐point scale, with higher scores indicating better function. The second study (Willberg 2011) appeared to measure the VISA score, but did not report it at baseline or follow‐up.
Participant global assessment of success
Both studies measured participant global assessment of success. One study (Bahr 2006) did this using both a dichotomous and continuous outcome. The dichotomous outcome looked at the proportion of participants with no pain at 12 months, whereas the continuous outcome was a self‐report VAS on an 11‐point scale from ‐5 to +5, with positive scores indicating an improvement in the condition.
The other study (Willberg 2011) also utilised a VAS, however it was a zero‐ to 100‐point scale, with higher scores indicating better satisfaction with treatment. The study reported the mean satisfaction score.
Withdrawal rate
Both studies included the number of participants who withdrew and the qualitative reason for the withdrawal.
Outcomes not measured
Neither study measured participants' quality of life or adverse events, including the proportion of participants who developed a tendon rupture. Personal communication with the corresponding author of Bahr 2006 indicated that there were no tendon ruptures noted in clinical follow‐up. Attempts to contact the authors of Willberg 2011 failed, so we cannot comment on whether there were any tendon ruptures or not. The authors of Willberg 2011 directly commented that they chose not to use a functional outcome (like VISA) as they felt it was not reflective of the improvement gained in the trial participants, as they were not elite athletes.
Excluded studies
Six studies were excluded after intially being screened, as they failed to meet the inclusion criteria. Three studies were not RCTs (Coleman 2000; Cuellar 2007; Sunding 2015), two studies were review articles (Gaida 2011; MarcheggianiMuccioli 2013), and one study was of the wrong intervention (Dragoo 2011).
Risk of bias in included studies
The 'Risk of bias' assessment for each study is reported in the Characteristics of included studies table and summarised in Figure 2 and Figure 3.
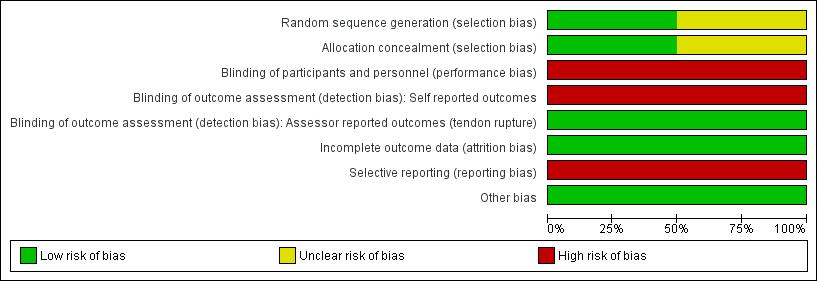
Risk of bias graph: review authors' judgements about each risk of bias item presented as percentages across all included studies.

Risk of bias summary: review authors' judgements about each risk of bias item for each included study.
Allocation
One trial (Bahr 2006) described adequate allocation concealment (through sealed opaque envelopes) and random sequence generation to intervention or comparator prior to the start of the study, so was likely to be at low risk of selection bias.
Methodology for sequence generation was not provided in Willberg 2011, and although concealed envelopes were used for allocation, the participants selected their own envelope. Therefore, there was a possibility of selection bias.
Blinding
We assessed both studies as being at high risk of both performance and detection bias. The participants were not blinded with regard to the group allocation, therefore there was potential for detection bias for self‐reported outcomes (pain, function, global evaluation) and performance‐related outcomes due to knowledge of the allocated interventions by participants. The assistant collecting the outcome scores was blinded to group allocation, however the data were recorded by participants who were not blinded and therefore there is a high risk of detection bias.
Incomplete outcome data
Attrition bias was minimised in both studies. In Bahr 2006, five out of 20 participants from the eccentric exercises group crossed over to the open surgical excision group, however the final score prior to surgery was carried over to the 12‐month follow‐up. In the other study (Willberg 2011), only one out of 26 participants from both groups withdrew from the study due to reasons unrelated to the treatment.
Selective reporting
We judged both studies to have a high risk of reporting bias. Both failed to report any measures of quality‐of‐life assessment or adverse events, including the presence or absence of tendon ruptures. One study (Willberg 2011) actively chose not to report validated functional scores (VISA scores), although it may have collected these data.
Other potential sources of bias
There were no other sources of bias. Cointerventions, including analgesics for pain relief, were allowed freely in both treatment groups.
Effects of interventions
See: Summary of findings for the main comparison Open surgical excision compared to eccentric exercises for patella tendinopathy; Summary of findings 2 Arthroscopic surgery compared to sclerosing injection for patella tendinopathy
Meta‐analysis
The interventions in the trials were considered too diverse to pool outcomes in a meta‐analysis: Bahr 2006 compared open surgical incision of the patellar tendon, followed by rehabilitation progressing to eccentric exercise, with eccentric exercise alone; Willberg 2011 compared arthroscopic shaving of the tendon with sclerosing injection.
Benefits
1. Open surgical excision compared with eccentric exercises
Bahr 2006 compared open surgical excision with eccentric exercises in 40 participants (20 participants in each group). At the completion of follow‐up (12 months), five of the 20 participants from the eccentric exercises group had crossed over to the surgical group. An intention‐to‐treat analysis was performed to include these participants in the final comparison. The five participants who crossed over from the eccentric exercises group to the open surgery group had no improvement in baseline values, i.e. these participants experienced no improvement after three months of eccentric exercises, and again no improvement 12 months after surgery.
The certainty of evidence was low for knee pain, function and global assessment of success (downgraded for imprecision, detection and reporting bias) and the results found that open surgical excision provides no clinically important benefits for these outcomes. Quality of life, adverse events and tendon ruptures were not reported. Major outcomes are reported in summary of findings Table for the main comparison.
Knee pain
At 12 months, mean pain scores with standing jump (measured on a 10‐point VAS scale, where a lower score indicates less pain) were 1.7 (SD 1.6) in the eccentric training group and 1.3 (SD 0.8) in the surgical group (one study, 40 participants). This equates to a mean difference of ‐0.4 points (95% CI ‐1.2 to 0.4), or an absolute pain reduction of 4% (4% worse to 12% better, the minimal clinically important difference being 1.5%) and a relative change in pain of 10% better (30% better to 10% worse) in the treatment group. As the 95% CIs included both clinically significant and non‐significant values, there was no clinically important difference in pain between eccentric training and surgery at 12 months (low‐certainty evidence). Pain at six months was not reported. Analysis 1.1
Function
At six months, mean function on the 100‐point VISA scale (where a higher score indicates better function) was 55.7 (SD 16.6) in the eccentric training group and 58.9 (SD 22.7) in the surgical group (one study, 40 participants). This equates to a mean difference of 3.2 points (95% CI ‐9.5 to 16.0), an absolute change of 3% better function in the treatment group (9.5% worse to 16% better, the minimal clinically important difference being 13%).
At 12 months, mean function on the VISA scale was 65.7 (23.8) in the eccentric training group and 72.9 (11.7) in the surgical group. This equates to a mean difference of 7.2 points (95% CI ‐4.5 to 18.8), an absolute change of 7% better function (4% worse to 19% better) and a relative change of 25% better function (15% worse to 65% better) in the treatment group. Low‐certainty evidence showed there was no clinically important difference in function between eccentric training and surgery; the 95% CIs indicate that a clinically important change cannot be confirmed or excluded. Analysis 1.2
Participant global assessment of success
Global assessment of success was assessed as a dichotomous and continuous variable.
Success, defined as no pain at 12 months, was achieved in 7/20 participants (or 350 per 1000) in the eccentric exercises group and 5/20 (or 250 per 1000) in the surgical group: risk ratio (RR) 0.71 (95% CI 0.27 to 1.88; one trial, 40 participants). This equates to an absolute change of 10% less success (38% less to 18% more) and a relative change of 29% less success (73% fewer to 88% more) in the treatment group. Analysis 1.3
At six months, the mean global assessment of success (on a scale of ‐5 to +5, where a positive score indicates greater perceived benefit) was 2.0 (SD 1.3) in the eccentric training group, and 1.0 (SD 2.25) in the surgical group, a mean difference of ‐1.1 points (95% CI ‐2.2 to 0.1) or an absolute reduction, or worsening of, symptoms of 10% (1% better to 22% worse). At 12 months, the mean global assessment of success was 3.0 (SD 1.6) in the eccentric training group and 3.2 (SD 1.8) in the surgical group, a mean improvement of 0.2 points (95% CI ‐0.8 to 1.7) or an absolute improvement of 2% (8% worse to 17% better). Based on low‐certainty evidence (one study, 40 participants), there was no clinically important difference between eccentric training and surgery in the proportion of participants who rated treatment as successful at six or 12 months. Analysis 1.4
Return to sport
For return to sport, 6/20 (or 300 per 1000) in the eccentric group and 5/20 (or 250 per 1000) in the open surgical excision group returned to pre‐injury participation levels with no pain: RR 0.83 (95% CI 0.30 to 2.29). This equates to an absolute risk difference of 5% less success (33% less to 23% more) and a relative change of 17% less success (70% fewer to 129% more) in the open surgical excision group. Analysis 1.5
2. Arthroscopic surgery compared to sclerosing injections
Willberg 2011 compared arthroscopic surgery with sclerosing injections in 52 participants (26 in each group). Compared with sclerosing injection, low‐certainty evidence (downgraded for imprecision, detection and reporting bias) shows that arthroscopic surgery reduces pain and improves participant global assessment of success. Functional outcome scores were not reported, and quality of life was not measured in the trial. The proportion of participants with adverse events, and specifically the proportion with tendon rupture, was not reported. The minor outcome (return to sport) was also not reported. As there was no trial protocol we cannot confirm if any of the outcomes not reported were measured. See summary of findings Table 2.
Knee pain
Low‐certainty evidence shows that, compared to sclerosing injections, surgery results in a clinically important reduction in pain (one study, 52 participants). At 12 months, mean pain during activity on a 100‐point scale (where a lower score indicates less pain) was 41.1 (SD 28.5) in the sclerosing injection group and 12.8 (SD 19.3) in the arthroscopic surgery group. The absolute change was 28% better (15% to 42% better, the minimal clinically important difference being 15%) and the relative change was 41% better (21% to 61% better). No data were reported at six months, although outcomes were measured at this time point. Analysis 2.1
Participant global assessment of success
At 12 months, the mean participant global assessment of success on a 100‐point scale (where a higher score indicates greater satisfaction) was 52.9 (SD 32.6) in the sclerosing injection group and 86.8 (SD 20.8) in the arthroscopic surgery group. This equates to a mean improvement of 33.9 points (95% CI 18.7 to 49.1), an absolute improvement of 34% (19% better to 49% better) in the treatment group (one study, 50 participants). This is likely a clinically important difference between groups (assuming 10% is clinically important), however the evidence is of low certainty.Analysis 2.2
Proportion of withdrawals
The withdrawal rate was the same in each treatment arm (1/26, or 4% of participants).Analysis 2.3
Harms
Neither study reported on adverse outcomes.
Subgroup analysis and sensitivity analysis
Our planned subgroup analysis to assess if any differences in outcome occurred with arthroscopic or open surgical excision could not be performed as we did not identify more than one study with a common comparator. As we were unable to conduct a meta‐analysis, we did not perform any sensitivity analyses.
Discussion
Summary of main results
There is a limited number of randomised controlled trials assessing the benefit of surgical intervention for patellar tendinopathy. We identified two studies, which were at risk of several biases. The evidence underpinning the major outcomes was of low or very low certainty, due to risk of bias in the trials and imprecision resulting from small sample sizes.
Low‐certainty evidence from a single trial comparing open surgical excision with eccentric exercises over 12 months (Bahr 2006) indicates that there may be no difference between interventions at 12 months in terms of pain, functional outcomes or participant‐perceived benefit.
Low‐certainty evidence from a single trial comparing arthroscopic surgical debridement with sclerosing injections over 12 months (Willberg 2011) indicates possible greater improvements in pain with activity, and higher participant satisfaction levels, with arthroscopic surgery. Functional outcome was not reported, possibly due to selective reporting.
Neither trial reported quality‐of‐life assessment or adverse events, including tendon ruptures.
Overall completeness and applicability of evidence
As we did not identify any placebo‐controlled trials, we cannot draw any conclusions regarding the benefit of surgery.
One study (Willberg 2011) reported an improvement in pain on activity with arthroscopic surgery compared to sclerosing injections, not a placebo and therefore there is no standard comparator in this trial.
Patella tendinopathy is primarily a condition affecting athletes; the authors of Willberg 2011 chose not to use a validated outcome score, such as VISA score or Blazina grading, and did not report all recorded time points. A lack of blinding was also evident. This bias, and lack of a standard comparator, likely overestimates the findings of this study to support arthroscopic surgery.
Willberg and colleagues reported on athletes who were non‐elite but had high activity levels, whilst Bahr and colleagues reported on elite athletes; therefore the applicability of the evidence is limited to these patient populations. However, the condition is not normally seen in the non‐athletic population.
Eccentric exercises are currently considered the mainstay of treatment for patella tendinopathy, although the benefits are uncertain (Lopes 2018). In Bahr 2006, 25% of the participants showed no improvement with eccentric exercises and crossed over to surgery during the study. This subset of participants had poorer outcome scores than the rest of the participants in the trial. An intention‐to‐treat analysis accounted for this. However, the rest of the participants' outcomes improved with time, and both groups were exposed to eccentric exercises, which could mean the eccentric exercises alone may have provided the treatment benefit.
Despite a paucity of evidence, surgery is still utilised in clinical practice once all other mechanisms have been exhausted in refractory cases. The two trials included in this review used different surgical techniques, targeting different areas of the presumed pathology. This highlights the lack of consensus on the pathophysiology of the injury and treatment.
Optimal treatments for patellar tendinopathy are still unknown, however prospective studies suggest that athletes are more likely to be forced to retire with the condition if left untreated (Kettunen 2002).
Quality of the evidence
We identified only two randomised controlled trials comparing surgery to non‐operative interventions. Evidence for each outcome was downgraded at least twice, due to the potential for bias and imprecision. Studies were hampered by the potential for performance and detection bias (due to the difficulty in blinding participants and investigators to the intervention), attrition bias (due to missing data), and use of non‐validated outcome measures in one study (Willberg 2011), which resulted in potential reporting bias. Both trials failed to report adverse events, including tendon rupture, which also contributed to the high risk of reporting bias, and meant we could not calculate any risk estimates for this events. Data for each outcome came from single, small studies, which resulted in imprecision.
One study (Bahr 2006) compared surgical excision to eccentric exercises. Knee pain, functional outcome (VISA score), global assessment score and withdrawal rate were downgraded to low‐certainty due to bias and imprecision. There was no inconsistency of effect as outcomes came from a single study, and no indirectness or publication bias. Quality‐of‐life measures, adverse events and tendon rupture were not reported.
Evidence comparing arthroscopic surgery to sclerosing injections also came from a single study (Willberg 2011). Knee pain and global assessment score were downgraded to low‐certainty due to imprecision and the risk of detection and performance bias. Due to very low event rates, we further downgraded the evidence on withdrawal rates to very low certainty. We did not downgrade for consistency of effect, indirectness or publication bias. Functional outcome (VISA score), quality‐of‐life measures, adverse events and tendon rupture were not reported.
Overall the quality of evidence can be considered low according the GRADE recommendations, which means the true effect might be markedly different from the estimated effect.
Potential biases in the review process
We feel the lack of studies is a reflection of the paucity of the research on the topic and is not necessarily due to publication bias, as no ongoing studies were identified.
Two review authors independently assessed the trials for inclusion, extracted data and assessed the risk of bias, and a third review author adjudicated whenever there was any discrepancy. This approach minimises any biases in data extraction and management.
There is the potential for performance and detection bias in open studies when the main outcomes are self‐reported. As we did not identify any trials comparing surgery with placebo (sham) we chose the most common therapy, eccentric exercises, as our primary comparator.
Agreements and disagreements with other studies or reviews
High rates of satisfaction and clinical improvement are reported with case series publications that utilise retrospective data collection and subjective outcome measures, given the natural history of the condition (Ogon 2006).
A systematic review of all treatments for patellar tendinopathy has been performed (Larsson 2012). This was a systematic review exploring all treatment options, however it did not include Willberg 2011 due to the search date (it only included Bahr 2006). The review concluded that there was a lack of evidence to support surgery and further research is needed (Larsson 2012). A review of surgical interventions (Khan 2016) did identify both the trials included in our review, but the authors only extracted data from the surgically treated group, and did not compare the outcomes of surgery to non‐surgical interventions. Khan 2016 concluded that surgery results in good success rates, but acknowledged that higher‐level evidence was needed. This is in accordance with the findings of our review, which identified only two eligible trials and low‐certainty evidence around the benefit of surgery.

Study flow diagram.

Risk of bias graph: review authors' judgements about each risk of bias item presented as percentages across all included studies.

Risk of bias summary: review authors' judgements about each risk of bias item for each included study.

Comparison 1 Open surgical excision vs eccentric exercises, Outcome 1 Knee Pain‐ standing jump.
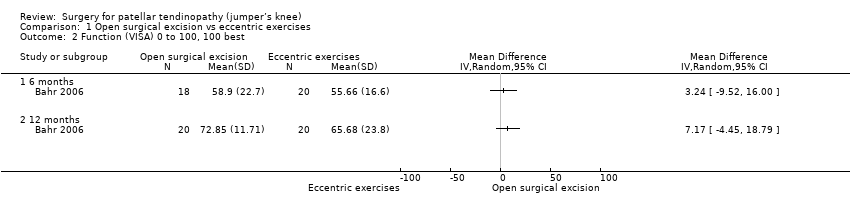
Comparison 1 Open surgical excision vs eccentric exercises, Outcome 2 Function (VISA) 0 to 100, 100 best.

Comparison 1 Open surgical excision vs eccentric exercises, Outcome 3 Global success ‐ Proportion with no symptoms at 12 months.

Comparison 1 Open surgical excision vs eccentric exercises, Outcome 4 Global assessment of success.
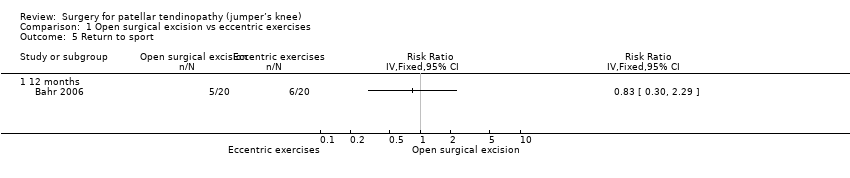
Comparison 1 Open surgical excision vs eccentric exercises, Outcome 5 Return to sport.
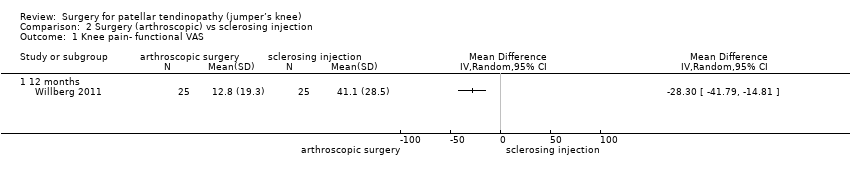
Comparison 2 Surgery (arthroscopic) vs sclerosing injection, Outcome 1 Knee pain‐ functional VAS.

Comparison 2 Surgery (arthroscopic) vs sclerosing injection, Outcome 2 Global outcome of success‐ Satisfaction VAS.

Comparison 2 Surgery (arthroscopic) vs sclerosing injection, Outcome 3 Withdrawal rate.
| Open surgical excision compared to eccentric exercises for patella tendinopathy | ||||||
| Patient or population: adult participants with patellar tendinopathy | ||||||
| Outcomes | Anticipated absolute effects* (95% CI) | Relative effect | № of participants | Certainty of the evidence | Comments | |
| Risk with eccentric exercises | Risk with open surgical excision | |||||
| Knee pain Scale from: 0 to 10 (0 is no pain) | The mean pain was 1.7 points | The mean pain in the intervention group was 0.4 points better | ‐ | 40 | ⊕⊕⊝⊝ | Absolute change 4% better (4% worse to 12% better); relative change 10% better (30% better to 10% worse)3,4 |
| Function | The mean function in the control group was 65.7 | The mean function was 7.2 points higher | ‐ | 40 | ⊕⊕⊝⊝ | Absolute change 7% better (4% worse to 19% better); relative change 25% better (15% worse to 65% better)3,4 |
| Participant global assessment of success | 350 per 1000 | 250 per 1000 (95 to 658) | RR 0.71 (0.27 to 1.88) | 40 | ⊕⊕⊝⊝ | Absolute risk difference of 10% less success (38% less to 18% more); relative change 29% fewer experience no pain at 12 months (73% fewer to 88% more)4 |
| Quality of life | not measured | not measured | ‐ | ‐ | Not measured | |
| Withdrawal rate | 5/20 crossed over to surgery | No withdrawals or cross‐overs were possible from surgery | No estimate | 40 | ⊕⊕⊝⊝ | We cannot estimate comparative withdrawal rates, as no or cross‐overs were possible from surgery to exercise. |
| Adverse event | None | One participant developed chronic quadriceps pain | 40 | ⊕⊕⊕⊝ | Not estimable | |
| Tendon rupture | Not reported | Not reported | ‐ | ‐ | ‐ | Not reported, unclear if this outcome was measured |
| *The risk in the intervention group (and its 95% confidence interval) is based on the assumed risk in the comparison group and the relative effect of the intervention (and its 95% CI). | ||||||
| GRADE Working Group grades of evidence | ||||||
| 1 Downgraded one level for significant detection bias and reporting bias | ||||||
| Arthroscopic surgery compared to sclerosing injection for patella tendinopathy | ||||||
| Patient or population: adult participants with patellar tendinopathy | ||||||
| Outcomes | Anticipated absolute effects* (95% CI) | Relative effect | № of participants | Certainty of the evidence | Comments | |
| Risk with sclerosing injection | Risk with arthroscopic surgery | |||||
| Knee pain Scale from: 0 to 100 (0 is no pain) | Mean pain was 41.1 points. | The mean pain was 28.3 points better in the intervention group (14.8 to 41.8 points better). | ‐ | 50 | ⊕⊕⊝⊝ | Absolute difference 28% better (15% to 42% better); relative change 41% better (21% to 61% better)3, NNTB 2 (1 to 4) |
| Function | Not reported | Not reported | ‐ | ‐ | ‐ | Not reported |
| Participant global assessment of success Follow‐up: 12 months | Mean satisfaction was 52.9 points. | The mean patient satisfaction was 33.9 points better (18.7 to 49.1 points better). | ‐ | 50 | ⊕⊕⊝⊝ | Absolute improvement of 34% (19% to 49%)4 |
| Quality of life | Not measured | Not measured | ‐ | Not measured | ||
| Withdrawal rate | 1 event | 1 event, no reliable estimate | ‐ | 40 | ⊕⊝⊝⊝ VERY LOW1,2 | Not related to treatment (pregnancy) |
| Adverse event | Not reported | Not reported | ‐ | ‐ | ‐ | Not reported, unclear if this outcome was measured |
| Tendon rupture | Not reported | Not reported | ‐ | ‐ | ‐ | Not reported, unclear if this outcome was measured |
| *The risk in the intervention group (and its 95% confidence interval) is based on the assumed risk in the comparison group and the relative effect of the intervention (and its 95% CI). | ||||||
| GRADE Working Group grades of evidence | ||||||
| 1 Downgraded one level for significant detection bias and reporting bias | ||||||
| Outcome or subgroup title | No. of studies | No. of participants | Statistical method | Effect size |
| 1 Knee Pain‐ standing jump Show forest plot | 1 | Mean Difference (IV, Fixed, 95% CI) | Totals not selected | |
| 1.1 12 months | 1 | Mean Difference (IV, Fixed, 95% CI) | 0.0 [0.0, 0.0] | |
| 2 Function (VISA) 0 to 100, 100 best Show forest plot | 1 | Mean Difference (IV, Random, 95% CI) | Totals not selected | |
| 2.1 6 months | 1 | Mean Difference (IV, Random, 95% CI) | 0.0 [0.0, 0.0] | |
| 2.2 12 months | 1 | Mean Difference (IV, Random, 95% CI) | 0.0 [0.0, 0.0] | |
| 3 Global success ‐ Proportion with no symptoms at 12 months Show forest plot | 1 | Risk Ratio (M‐H, Random, 95% CI) | Totals not selected | |
| 4 Global assessment of success Show forest plot | 1 | Mean Difference (IV, Fixed, 95% CI) | Totals not selected | |
| 4.1 6 months | 1 | Mean Difference (IV, Fixed, 95% CI) | 0.0 [0.0, 0.0] | |
| 4.2 12 months | 1 | Mean Difference (IV, Fixed, 95% CI) | 0.0 [0.0, 0.0] | |
| 5 Return to sport Show forest plot | 1 | Risk Ratio (IV, Fixed, 95% CI) | Totals not selected | |
| 5.1 12 months | 1 | Risk Ratio (IV, Fixed, 95% CI) | 0.0 [0.0, 0.0] | |
| Outcome or subgroup title | No. of studies | No. of participants | Statistical method | Effect size |
| 1 Knee pain‐ functional VAS Show forest plot | 1 | Mean Difference (IV, Random, 95% CI) | Totals not selected | |
| 1.1 12 months | 1 | Mean Difference (IV, Random, 95% CI) | 0.0 [0.0, 0.0] | |
| 2 Global outcome of success‐ Satisfaction VAS Show forest plot | 1 | Mean Difference (IV, Fixed, 95% CI) | Totals not selected | |
| 2.1 12 months | 1 | Mean Difference (IV, Fixed, 95% CI) | 0.0 [0.0, 0.0] | |
| 3 Withdrawal rate Show forest plot | 1 | Odds Ratio (M‐H, Fixed, 95% CI) | Totals not selected | |
| 3.1 12 months | 1 | Odds Ratio (M‐H, Fixed, 95% CI) | 0.0 [0.0, 0.0] | |