Cirugía para la tendinopatía rotuliana (rodilla de saltador)
Referencias
Referencias de los estudios incluidos en esta revisión
Referencias de los estudios excluidos de esta revisión
Referencias adicionales
Characteristics of studies
Characteristics of included studies [ordered by study ID]
Ir a:
| Methods | Study design: randomised controlled trial, two groups Study grouping: parallel group Setting: participants were recruited from physicians and physical therapists referring participants to the Health Department at the Olympic Training Center in Oslo, Norway Timing: March 2001 to September 2004 Sample size: 15 participants required per group to have 90% power to detect a difference of mean difference of 13 points on the Victorian Institute of Sport Assessment (VISA) score between groups in the primary endpoint; overall type‐1 error rate was set at 5% Analysis: intention‐to‐treat analysis planned and executed | |
| Participants | Number of participants
Inclusion criteria
Exclusion criteria
Baseline characteristics: there was no demographic difference between groups. Listed recorded demographics include age, gender, height, weight, baseline VISA score, duration of symptoms, length of participation in sport and the amount or type of training. Open surgical excision group
Eccentric exercises group
| |
| Interventions | Open surgical excision Surgery involved a 5 cm longitudinal midline incision from the inferior pole of the patella distally. A tourniquet was not used. The paratenon was split longitudinally and any pathologic paratenon tissue was removed. The tendon was split longitudinally in the midline to expose the deepest layers, and tissue that appeared abnormal was removed, or if not seen macroscopically the area calculated from the MRI was removed. Once the sutures were removed the participants were exposed to the same physiotherapist and eccentric exercises as the non‐operative group. Two surgeons performed the operations. Prior to starting the eccentric exercises participants gradually increased activities, focusing on knee range‐of‐motion and walking without crutches. Eccentric exercise group Involved use of a 25‐degree decline board at home, where the downward (eccentric) component was performed on the affected leg and the upward (concentric) component was performed on the asymptomatic leg. The participant was instructed to perform the squat to 90 degrees with the back in a vertical position. The patient was instructed to take two seconds for the eccentric component. It involved twice‐daily sessions of three sets of 15 repetitions for a total duration of 12 weeks, with weekly supervision by a physiotherapist. No warm‐up was performed. Six weeks after surgery, participants were exposed to the same rehabilitation/eccentric exercises programme as the eccentric exercise group, except they were not allowed to tolerate pain. Both groups were allowed pain relief freely. | |
| Outcomes | Outcomes were assessed at baseline, 12 weeks, 6 months and 12 months by the trial authors. We report 6‐ and 12‐month outcomes in this review. Outcomes included in the trial
Outcomes included in this review
| |
| Identification | Sponsorship source: one or more of the authors received grants or outside funding from Norwegian Eastern Health Corporate, Royal Norwegian Ministry of Culture, Norwegian Olympic Committee and Confederation of Sport, Norsk Tipping AS, and Pfizer AS. Author's name: Roald Bahr Institution: Norwegian School of Sport Sciences Email: [email protected] Address: Oslo Sports Trauma Research Center, Department of Sports Medicine, Norwegian School of Sport Sciences, P.O. Box 4014 Ullevaal Stadion, 0806 Oslo, Norway. | |
| Notes | Trial registration: none found Data analysis: mean (95% confidence interval (CI)) function and participant global assessment of success at 6 and 12 months were extracted from the graph using PlotDigitizer (automeris.io/WebPlotDigitizer/). Adverse events: one participant in the surgery group developed chronic quadriceps pain. Tendon rupture did not appear to be measured. Withdrawals: none Cross‐overs: 5/20 in the eccentric exercise group had surgery. | |
| Risk of bias | ||
| Bias | Authors' judgement | Support for judgement |
| Random sequence generation (selection bias) | Low risk | "A randomisation sequence to surgical treatment or eccentric training (in blocks of four) was created by our statistician prior to the start of the study". It is likely this was adequate. |
| Allocation concealment (selection bias) | Low risk | "Sealed opaque envelopes used", and opened after a participant was enrolled in the study. This was probably sufficient to conceal treatment allocation. |
| Blinding of participants and personnel (performance bias) | High risk | Neither the participants or the investigators were blinded with regard to the group allocation. There is potential for performance bias. |
| Blinding of outcome assessment (detection bias) | High risk | Given that participants were allocated to surgery or exercises, blinding would be difficult, thus there is a potential for detection bias in reporting pain, function, and global evaluation. |
| Blinding of outcome assessment (detection bias) | Low risk | This outcome was not measured in the study. |
| Incomplete outcome data (attrition bias) | Low risk | 5/20 participants from the eccentric exercises group crossed over to open surgical excision, but final score before surgery was carried forward to 12 months in the eccentric exercise group, which had the potential to attenuate any benefit of surgery if one existed. Post hoc analysis in the trial suggests no change in outcome over time with these participants. |
| Selective reporting (reporting bias) | High risk | Multiple outcomes reported. VISA score is the primary outcome and reported as such. Pain was only reported at the 12‐month time point. There is no protocol publication and it is unclear if adverse events, including tendon rupture, were measured. |
| Other bias | Low risk | None apparent |
| Methods | Study design: randomised controlled trial, two groups Study grouping: parallel group Setting: participants were recruited from Capio Artro Clinic in Stockholm, Sweden Timing: not reported Sample size: 15 participants required per group to have 90% power to detect a difference of mean difference of 13 points on the VISA score between groups in the primary endpoint; overall type‐1 error rate was set at 5% Analysis: intention‐to‐treat analysis | |
| Participants | Number of participants
Inclusion criteria
Exclusion criteria: acute presentation of pain Baseline characteristics: there were no demographic differences. Arthroscopic surgery group
Sclerosing injection (Polidocanol) group
| |
| Interventions | Both interventions were performed under ultrasound and were doppler‐guided. Arthroscopic surgery Arthroscopy was performed under local anaesthetic, using anterolateral and anteromedial portals. No tourniquet was used. The patella tendon insertion into the patella was identified following a routine arthroscopic examination of the knee. A 4.5 mm shaver was utilised to destroy only the region with high blood flow and nerves adjacent to the tendinosis changes on the dorsal side of the tendon. No tendon tissue was resected and the Hoffa fat pad was saved. Portals were closed with tape. No information was given on who performed the surgeries. Sclerosing injection (Polidocanol) A 0.7 mm x 50 mm needle, connected to a 2 mL syringe, was utilised. Volumes of 0.1 mL to 0.2 mL were injected into the regions with local neovascularisation/high blood flow dorsal to the proximal patellar tendon. A maximum of three injections were given at six‐week intervals. All injections were performed by the same, single sonographer. Cointerventions Both groups were allowed to weightbear fully post‐treatment, and there was no specific rehabilitation protocol or preclusion of activities. | |
| Outcomes | Outcomes were assessed at baseline, 2 weeks, 3 weeks, 6 months and 12 months by the trial authors, but reported at only 12 months. We report outcomes at 12 months in this review. Outcomes included in the trial Pain ‐ rest
Outcomes included in this review
| |
| Identification | Sponsorship source: nil reported Country: Sweden Setting: Capio Artro Clinic, Stockholm Author's name: Dr Lotta Willberg Institution: Capio Artro Clinic, Stockholm Email: [email protected] Address: CapioArtro Clinic, StockholmSports Trauma Research Centre, Karolinska Institutet, Sophiahemmet, Valhallavägen91, S‐114 86 Stockholm, Sweden | |
| Notes | Trial registration: none found. Data analysis: mean (SD) pain and participant global assessment of success at 12 months was extracted from the study table. Adverse events: no adverse events were reported. Withdrawals: 1/26 participants withdrew in both groups. Cross‐overs: none | |
| Risk of bias | ||
| Bias | Authors' judgement | Support for judgement |
| Random sequence generation (selection bias) | Unclear risk | The method of sequence generation was not provided. |
| Allocation concealment (selection bias) | Unclear risk | Concealed envelopes were used, but participants selected their own envelope. |
| Blinding of participants and personnel (performance bias) | High risk | Study participants and investigators were not blinded and were aware of the treatment; therefore there is a risk of performance bias. |
| Blinding of outcome assessment (detection bias) | High risk | The participants were not blinded with regard to the group allocation. There is potential for detection bias for self‐reported outcomes (pain, function, global evaluation) and performance‐related outcomes (e.g. standing jump) due to knowledge of the allocated interventions by participants. The assistant collecting outcome scores was blinded to group allocation, however the data was recorded by participants who were not blinded, therefore there is a risk of detection bias. |
| Blinding of outcome assessment (detection bias) | Low risk | Not relevant as none measured |
| Incomplete outcome data (attrition bias) | Low risk | 1/26 participants from both groups withdrew. |
| Selective reporting (reporting bias) | High risk | Complete data set not available for all mentioned time points. The study did not report known outcome scores for patella tendinopathy (i.e. VISA) but may have recorded these. |
| Other bias | Low risk | None apparent |
Characteristics of excluded studies [ordered by study ID]
Ir a:
| Study | Reason for exclusion |
| Not a randomised controlled trial | |
| Not a randomised controlled trial | |
| Not a surgical intervention | |
| Not a randomised controlled trial (review article) | |
| Not a randomised controlled trial (review article) | |
| Not a randomised controlled trial |
Data and analyses
| Outcome or subgroup title | No. of studies | No. of participants | Statistical method | Effect size |
| 1 Knee Pain‐ standing jump Show forest plot | 1 | Mean Difference (IV, Fixed, 95% CI) | Totals not selected | |
| Analysis 1.1  Comparison 1 Open surgical excision vs eccentric exercises, Outcome 1 Knee Pain‐ standing jump. | ||||
| 1.1 12 months | 1 | Mean Difference (IV, Fixed, 95% CI) | 0.0 [0.0, 0.0] | |
| 2 Function (VISA) 0 to 100, 100 best Show forest plot | 1 | Mean Difference (IV, Random, 95% CI) | Totals not selected | |
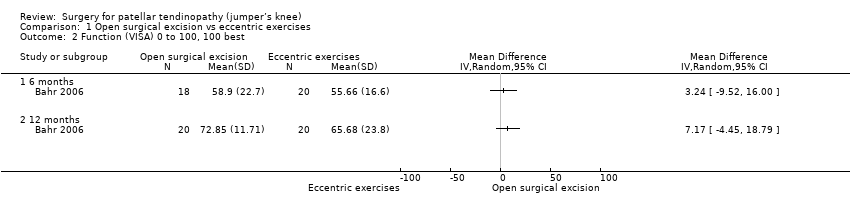
| Analysis 1.2  Comparison 1 Open surgical excision vs eccentric exercises, Outcome 2 Function (VISA) 0 to 100, 100 best. | ||||
| 2.1 6 months | 1 | Mean Difference (IV, Random, 95% CI) | 0.0 [0.0, 0.0] | |
| 2.2 12 months | 1 | Mean Difference (IV, Random, 95% CI) | 0.0 [0.0, 0.0] | |
| 3 Global success ‐ Proportion with no symptoms at 12 months Show forest plot | 1 | Risk Ratio (M‐H, Random, 95% CI) | Totals not selected | |
| Analysis 1.3  Comparison 1 Open surgical excision vs eccentric exercises, Outcome 3 Global success ‐ Proportion with no symptoms at 12 months. | ||||
| 4 Global assessment of success Show forest plot | 1 | Mean Difference (IV, Fixed, 95% CI) | Totals not selected | |
| Analysis 1.4  Comparison 1 Open surgical excision vs eccentric exercises, Outcome 4 Global assessment of success. | ||||
| 4.1 6 months | 1 | Mean Difference (IV, Fixed, 95% CI) | 0.0 [0.0, 0.0] | |
| 4.2 12 months | 1 | Mean Difference (IV, Fixed, 95% CI) | 0.0 [0.0, 0.0] | |
| 5 Return to sport Show forest plot | 1 | Risk Ratio (IV, Fixed, 95% CI) | Totals not selected | |
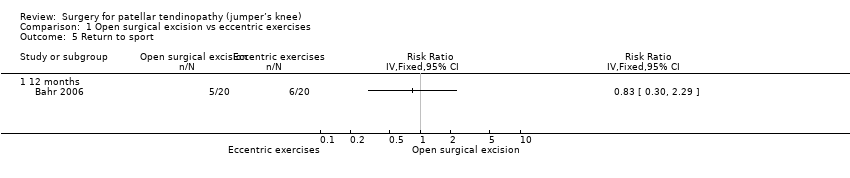
| Analysis 1.5  Comparison 1 Open surgical excision vs eccentric exercises, Outcome 5 Return to sport. | ||||
| 5.1 12 months | 1 | Risk Ratio (IV, Fixed, 95% CI) | 0.0 [0.0, 0.0] | |
| Outcome or subgroup title | No. of studies | No. of participants | Statistical method | Effect size |
| 1 Knee pain‐ functional VAS Show forest plot | 1 | Mean Difference (IV, Random, 95% CI) | Totals not selected | |
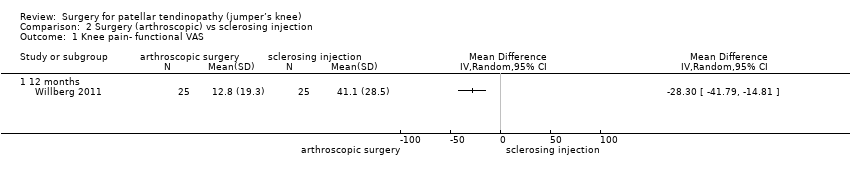
| Analysis 2.1  Comparison 2 Surgery (arthroscopic) vs sclerosing injection, Outcome 1 Knee pain‐ functional VAS. | ||||
| 1.1 12 months | 1 | Mean Difference (IV, Random, 95% CI) | 0.0 [0.0, 0.0] | |
| 2 Global outcome of success‐ Satisfaction VAS Show forest plot | 1 | Mean Difference (IV, Fixed, 95% CI) | Totals not selected | |
| Analysis 2.2  Comparison 2 Surgery (arthroscopic) vs sclerosing injection, Outcome 2 Global outcome of success‐ Satisfaction VAS. | ||||
| 2.1 12 months | 1 | Mean Difference (IV, Fixed, 95% CI) | 0.0 [0.0, 0.0] | |
| 3 Withdrawal rate Show forest plot | 1 | Odds Ratio (M‐H, Fixed, 95% CI) | Totals not selected | |
| Analysis 2.3  Comparison 2 Surgery (arthroscopic) vs sclerosing injection, Outcome 3 Withdrawal rate. | ||||
| 3.1 12 months | 1 | Odds Ratio (M‐H, Fixed, 95% CI) | 0.0 [0.0, 0.0] | |

Study flow diagram.

Risk of bias graph: review authors' judgements about each risk of bias item presented as percentages across all included studies.

Risk of bias summary: review authors' judgements about each risk of bias item for each included study.

Comparison 1 Open surgical excision vs eccentric exercises, Outcome 1 Knee Pain‐ standing jump.
Comparison 1 Open surgical excision vs eccentric exercises, Outcome 2 Function (VISA) 0 to 100, 100 best.

Comparison 1 Open surgical excision vs eccentric exercises, Outcome 3 Global success ‐ Proportion with no symptoms at 12 months.

Comparison 1 Open surgical excision vs eccentric exercises, Outcome 4 Global assessment of success.
Comparison 1 Open surgical excision vs eccentric exercises, Outcome 5 Return to sport.
Comparison 2 Surgery (arthroscopic) vs sclerosing injection, Outcome 1 Knee pain‐ functional VAS.

Comparison 2 Surgery (arthroscopic) vs sclerosing injection, Outcome 2 Global outcome of success‐ Satisfaction VAS.

Comparison 2 Surgery (arthroscopic) vs sclerosing injection, Outcome 3 Withdrawal rate.
| Open surgical excision compared to eccentric exercises for patella tendinopathy | ||||||
| Patient or population: adult participants with patellar tendinopathy | ||||||
| Outcomes | Anticipated absolute effects* (95% CI) | Relative effect | № of participants | Certainty of the evidence | Comments | |
| Risk with eccentric exercises | Risk with open surgical excision | |||||
| Knee pain Scale from: 0 to 10 (0 is no pain) | The mean pain was 1.7 points | The mean pain in the intervention group was 0.4 points better | ‐ | 40 | ⊕⊕⊝⊝ | Absolute change 4% better (4% worse to 12% better); relative change 10% better (30% better to 10% worse)3,4 |
| Function | The mean function in the control group was 65.7 | The mean function was 7.2 points higher | ‐ | 40 | ⊕⊕⊝⊝ | Absolute change 7% better (4% worse to 19% better); relative change 25% better (15% worse to 65% better)3,4 |
| Participant global assessment of success | 350 per 1000 | 250 per 1000 (95 to 658) | RR 0.71 (0.27 to 1.88) | 40 | ⊕⊕⊝⊝ | Absolute risk difference of 10% less success (38% less to 18% more); relative change 29% fewer experience no pain at 12 months (73% fewer to 88% more)4 |
| Quality of life | not measured | not measured | ‐ | ‐ | Not measured | |
| Withdrawal rate | 5/20 crossed over to surgery | No withdrawals or cross‐overs were possible from surgery | No estimate | 40 | ⊕⊕⊝⊝ | We cannot estimate comparative withdrawal rates, as no or cross‐overs were possible from surgery to exercise. |
| Adverse event | None | One participant developed chronic quadriceps pain | 40 | ⊕⊕⊕⊝ | Not estimable | |
| Tendon rupture | Not reported | Not reported | ‐ | ‐ | ‐ | Not reported, unclear if this outcome was measured |
| *The risk in the intervention group (and its 95% confidence interval) is based on the assumed risk in the comparison group and the relative effect of the intervention (and its 95% CI). | ||||||
| GRADE Working Group grades of evidence | ||||||
| 1 Downgraded one level for significant detection bias and reporting bias | ||||||
| Arthroscopic surgery compared to sclerosing injection for patella tendinopathy | ||||||
| Patient or population: adult participants with patellar tendinopathy | ||||||
| Outcomes | Anticipated absolute effects* (95% CI) | Relative effect | № of participants | Certainty of the evidence | Comments | |
| Risk with sclerosing injection | Risk with arthroscopic surgery | |||||
| Knee pain Scale from: 0 to 100 (0 is no pain) | Mean pain was 41.1 points. | The mean pain was 28.3 points better in the intervention group (14.8 to 41.8 points better). | ‐ | 50 | ⊕⊕⊝⊝ | Absolute difference 28% better (15% to 42% better); relative change 41% better (21% to 61% better)3, NNTB 2 (1 to 4) |
| Function | Not reported | Not reported | ‐ | ‐ | ‐ | Not reported |
| Participant global assessment of success Follow‐up: 12 months | Mean satisfaction was 52.9 points. | The mean patient satisfaction was 33.9 points better (18.7 to 49.1 points better). | ‐ | 50 | ⊕⊕⊝⊝ | Absolute improvement of 34% (19% to 49%)4 |
| Quality of life | Not measured | Not measured | ‐ | Not measured | ||
| Withdrawal rate | 1 event | 1 event, no reliable estimate | ‐ | 40 | ⊕⊝⊝⊝ VERY LOW1,2 | Not related to treatment (pregnancy) |
| Adverse event | Not reported | Not reported | ‐ | ‐ | ‐ | Not reported, unclear if this outcome was measured |
| Tendon rupture | Not reported | Not reported | ‐ | ‐ | ‐ | Not reported, unclear if this outcome was measured |
| *The risk in the intervention group (and its 95% confidence interval) is based on the assumed risk in the comparison group and the relative effect of the intervention (and its 95% CI). | ||||||
| GRADE Working Group grades of evidence | ||||||
| 1 Downgraded one level for significant detection bias and reporting bias | ||||||
| Outcome or subgroup title | No. of studies | No. of participants | Statistical method | Effect size |
| 1 Knee Pain‐ standing jump Show forest plot | 1 | Mean Difference (IV, Fixed, 95% CI) | Totals not selected | |
| 1.1 12 months | 1 | Mean Difference (IV, Fixed, 95% CI) | 0.0 [0.0, 0.0] | |
| 2 Function (VISA) 0 to 100, 100 best Show forest plot | 1 | Mean Difference (IV, Random, 95% CI) | Totals not selected | |
| 2.1 6 months | 1 | Mean Difference (IV, Random, 95% CI) | 0.0 [0.0, 0.0] | |
| 2.2 12 months | 1 | Mean Difference (IV, Random, 95% CI) | 0.0 [0.0, 0.0] | |
| 3 Global success ‐ Proportion with no symptoms at 12 months Show forest plot | 1 | Risk Ratio (M‐H, Random, 95% CI) | Totals not selected | |
| 4 Global assessment of success Show forest plot | 1 | Mean Difference (IV, Fixed, 95% CI) | Totals not selected | |
| 4.1 6 months | 1 | Mean Difference (IV, Fixed, 95% CI) | 0.0 [0.0, 0.0] | |
| 4.2 12 months | 1 | Mean Difference (IV, Fixed, 95% CI) | 0.0 [0.0, 0.0] | |
| 5 Return to sport Show forest plot | 1 | Risk Ratio (IV, Fixed, 95% CI) | Totals not selected | |
| 5.1 12 months | 1 | Risk Ratio (IV, Fixed, 95% CI) | 0.0 [0.0, 0.0] | |
| Outcome or subgroup title | No. of studies | No. of participants | Statistical method | Effect size |
| 1 Knee pain‐ functional VAS Show forest plot | 1 | Mean Difference (IV, Random, 95% CI) | Totals not selected | |
| 1.1 12 months | 1 | Mean Difference (IV, Random, 95% CI) | 0.0 [0.0, 0.0] | |
| 2 Global outcome of success‐ Satisfaction VAS Show forest plot | 1 | Mean Difference (IV, Fixed, 95% CI) | Totals not selected | |
| 2.1 12 months | 1 | Mean Difference (IV, Fixed, 95% CI) | 0.0 [0.0, 0.0] | |
| 3 Withdrawal rate Show forest plot | 1 | Odds Ratio (M‐H, Fixed, 95% CI) | Totals not selected | |
| 3.1 12 months | 1 | Odds Ratio (M‐H, Fixed, 95% CI) | 0.0 [0.0, 0.0] | |