Cirugía para la tendinopatía rotuliana (rodilla de saltador)
Resumen
Antecedentes
La tendinopatía rotuliana es una afección por sobreuso que habitualmente afecta a los atletas. Por lo general, si las terapias médicas y físicas no logran tratarla de manera efectiva, se ofrece la cirugía. Existe una variación en el tipo de cirugía que se realiza para esta afección.
Objetivos
Evaluar los efectos beneficiosos y perjudiciales de la cirugía para la tendinopatía rotuliana en pacientes adultos.
Métodos de búsqueda
Se hicieron búsquedas en las siguientes bases de datos, hasta el 17 de julio de 2018: el Registro Cochrane Central de Ensayos Controlados (Cochrane Central Register of Controlled Trials, CENTRAL) a través de la Cochrane Library, OVID MEDLINE, OVID Embase, los registros de ensayos clínicos (www.ClinicalTrials.gov) y el portal de ensayos de la OMS (www.who.int/ictrp/en/).
Criterios de selección
Se incluyeron todos los ensayos controlados aleatorizados (ECA) que compararon las técnicas quirúrgicas (abiertas o artroscópicas) con el tratamiento no quirúrgico (incluida la cirugía placebo, el ejercicio u otras modalidades no quirúrgicas) en pacientes adultos con tendinopatía rotuliana.
Las medidas de resultado principales evaluadas fueron: dolor de rodilla, funcionalidad, calidad de vida, evaluación global del éxito de los participantes, tasa de retiro, proporción con eventos adversos y proporción con rotura de tendones.
Obtención y análisis de los datos
Dos autores de la revisión seleccionaron los estudios para inclusión, extrajeron las características de los ensayos y los datos de los resultados, evaluaron el riesgo de sesgo y evaluaron la calidad de la evidencia mediante GRADE.
Resultados principales
Dos ensayos (92 participantes) cumplieron los criterios de inclusión. A los participantes de ambos ensayos se les dio seguimiento durante 12 meses. Ningún ensayo comparó cirugía con cirugía placebo. Un ensayo (40 participantes asignados al azar) comparó la escisión quirúrgica abierta con ejercicios excéntricos, y el otro comparó la cirugía artroscópica con las inyecciones esclerosantes (52 participantes asignados al azar). Debido a la naturaleza de las intervenciones, ni los participantes ni los investigadores estuvieron cegados a la asignación a los grupos, lo que resultó en un potencial sesgo de realización y detección. Algunos resultados no se registraron de forma selectiva, lo que dio lugar a sesgo de informe. En general, la certeza de la evidencia de estos estudios fue baja para todos los resultados debido a la posibilidad de sesgo y a la imprecisión debido a los tamaños pequeños de la muestra.
En comparación con los ejercicios excéntricos, evidencia de baja certeza indica que la escisión quirúrgica abierta no tiene efectos beneficiosos clínicamente importantes con respecto al dolor de rodilla, la funcionalidad o la evaluación global del éxito. A los 12 meses, el dolor medio de rodilla (medido por el dolor al saltar de pie en una escala de 10 puntos [puntuaciones menores indican menos dolor]) fue 1,7 puntos (desviación estándar [DE] 1,6) en el grupo de entrenamiento excéntrico y 1,3 (DE 0,8) en el grupo quirúrgico (un ensayo, 40 participantes). Esto equivale a una reducción absoluta del dolor del 4% (que varía entre el 4% peor y el 12% mejor, siendo la diferencia mínima clínicamente importante del 15%) y una reducción relativa del dolor del 10% mejor (que varía entre el 30% mejor y el 10% peor) en el grupo de tratamiento. A los 12 meses, la funcionalidad en la escala del Victorian Institute of Sport Assessment (VISA) de cero a 100 puntos fue 65,7 (DE 23,8) en el grupo de entrenamiento excéntrico y 72,9 (DE 11,7) en el grupo quirúrgico (un ensayo, 40 participantes). Esto equivale a un cambio absoluto del 7% en una mejor funcionalidad (que varía entre el 4% peor y el 19% mejor) y un cambio relativo del 25% mejor (que varía entre el 15% peor y el 65% mejor, siendo la diferencia mínima clínicamente importante del 13%). La evaluación global del éxito de los participantes se midió por el número de pacientes sin dolor a los 12 meses: 7/20 participantes del grupo de entrenamiento excéntrico no informaron dolor, en comparación con 5/20 del grupo de cirugía abierta (cociente de riesgos [CR] 0,71 [IC del 95%: 0,27 a 1,88]; un ensayo, 40 participantes). No hubo retiros, pero cinco de 20 pacientes del grupo de ejercicio excéntrico pasaron a la escisión quirúrgica abierta. No se midió la calidad de vida, los eventos adversos ni las roturas de tendones.
En comparación con la inyección esclerosante, evidencia de baja certeza indica que la cirugía artroscópica puede proporcionar una reducción del dolor y una mejoría en la evaluación global del éxito de los participantes; sin embargo, es probable que otros estudios cambien estos resultados. A los 12 meses, el dolor medio con las actividades, medido en una escala de 100 puntos (puntuaciones menores que indican menos dolor), fue 41,1 (DE 28,5) en el grupo de inyección esclerosante y 12,8 (DE 19,3) en el grupo de cirugía artroscópica (un ensayo, 52 participantes). Esto equivale a una reducción absoluta del dolor del 28% mejor (que varía entre el 15% y el 42% mejor, siendo la diferencia mínima clínicamente importante del 15%), y un cambio relativo del 41% mejor (que varía entre el 21% y el 61% mejor). A los 12 meses, la evaluación global media del éxito de los participantes, medida por la satisfacción en una escala de 100 puntos (escala de cero a 100, puntuaciones más altas que indican mayor satisfacción), fue 52,9 (DE 32,6) en el grupo de inyección esclerosante y 86,8 (DE 20,8) en el grupo de cirugía artroscópica (un ensayo, 52 participantes). Esto equivale a una mejora absoluta del 34% (que varía entre el 19% y el 49%). En ambos grupos, un participante (4%) se retiró del estudio. No se informaron las puntuaciones del resultado funcional, incluida la puntuación VISA. No se informó la evaluación de la calidad de vida, los eventos adversos ni, específicamente, la proporción de rotura de tendones.
No se realizó un análisis de subgrupos para evaluar las diferencias en el resultado entre la escisión artroscópica o la escisión quirúrgica abierta, ya que no se identificó más de un estudio con un comparador común.
Conclusiones de los autores
No se sabe si la cirugía es beneficiosa en comparación con otras intervenciones terapéuticas, como los ejercicios excéntricos o los inyectables. Evidencia de baja certeza muestra que la cirugía para la tendinopatía rotuliana puede no tener efectos beneficios clínicamente importantes sobre el ejercicio excéntrico en cuanto al dolor, la funcionalidad o el éxito del tratamiento informado por el participante, pero puede dar lugar a una reducción del dolor clínicamente significativa y a un éxito del tratamiento en comparación con las inyecciones esclerosantes. Sin embargo, es probable que los estudios de investigación adicionales cambien estos resultados. La evidencia se disminuyó dos niveles debido al pequeño tamaño de la muestra y a la susceptibilidad al sesgo. No se sabe si existen riesgos adicionales asociados con la cirugía, ya que los autores del estudio no informaron los eventos adversos. La cirugía parece estar incorporada en la práctica clínica para la tendinopatía de la rótula en estadio tardío, debido al agotamiento de otros métodos terapéuticos en lugar de porque exista evidencia de efectos beneficiosos.
PICO
Resumen en términos sencillos
Cirugía para la tendinopatía de la rótula (rodilla de saltador)
Antecedentes
La tendinopatía de la rótula es una afección dolorosa que afecta habitualmente a los atletas que entrenan mucho con actividades de salto, por ejemplo, los que juegan voleibol y baloncesto. Muchos pacientes con esta afección no pueden continuar con el deporte elegido con el mismo nivel de competición o intensidad de entrenamiento. Existen muchos tratamientos para esta afección y el más frecuente es un tipo particular de ejercicio llamado ejercicio excéntrico (donde el tendón está bajo tensión mientras el músculo se alarga).
Otros tratamientos para la tendinopatía de la rótula incluyen analgesia oral y tópica (medicación analgésica tomada por vía oral o aplicada a la piel), varios inyectables (p.ej., corticosteroides) y cirugía. La cirugía se utiliza si los otros tratamientos fracasan y es el tratamiento evaluado en esta revisión.
Características de los estudios
Esta revisión Cochrane está actualizada hasta julio de 2018. Se realizaron búsquedas en las bases de datos en línea de todos los estudios (específicamente ensayos controlados aleatorizados) que compararan el tratamiento quirúrgico con el tratamiento no quirúrgico en pacientes adultos con tendinopatía rotuliana. Se encontraron dos estudios que compararon la extracción quirúrgica abierta con ejercicios excéntricos (un estudio con 40 pacientes) y la cirugía artroscópica con inyecciones esclerosantes (estas cicatrizan y bloquean los vasos sanguíneos que irrigan fibras nerviosas hasta el tendón enfermo) (un estudio con 56 pacientes). Los estudios se realizaron en ámbitos ambulatorios en dos países (Noruega y Suecia). La mayoría de los pacientes de los estudios fueron hombres, con una edad media que varió entre 27 y 31 años, y una duración media de los síntomas de 24 a 33 meses. Los ensayos se realizaron sin patrocinio (apoyo financiero) de la industria (compañías médicas o de dispositivos), pero algunos autores del único estudio recibieron financiamiento de compañías farmacéuticas además del financiamiento para la investigación de fuentes no relacionadas con la industria.
Resultados clave
En comparación con los ejercicios excéntricos, la cirugía abierta ofreció pocos efectos beneficiosos a los 12 meses (los resultados individuales son los siguientes).
Dolor (puntuaciones menores significan menos dolor)
Mejoró en el 4% (varió desde el 4% peor al 12% mejor) o en 0,4 puntos en una escala de cero a 10 puntos.
Los pacientes sometidos a cirugía calificaron el dolor con 1,3 puntos.
Los pacientes que realizaron ejercicios excéntricos calificaron el dolor con 1,7 puntos.
Evaluación global del éxito (pacientes que no informaron dolor a los 12 meses)
El 10% menos de los pacientes no presentaron dolor (entre 38% menos y 18% más) o diez pacientes menos de 100.
Veinticinco de 100 pacientes no presentaron dolor con la cirugía.
Treinta y cinco de 100 pacientes no presentaron dolor con los ejercicios excéntricos.
Retiros
Ningún participante de los dos grupos se retiró del estudio.
El estudio no informó sobre mejorías en la calidad de vida ni los eventos adversos (incluidas las roturas de tendones).
En comparación con las inyecciones esclerosantes, la cirugía artroscópica (mínimamente invasiva) dio lugar a alguna reducción del dolor y mejoría en la evaluación global del éxito de los participantes a los 12 meses (los resultados individuales son los siguientes; es probable que otros estudios cambien estos resultados).
Dolor (puntuaciones menores significan menos dolor)
Mejoría en el 28% (entre el 15% y el 42% mejor) o en 28 puntos en una escala de cero a 100 puntos.
Los pacientes sometidos a cirugía calificaron el dolor con 12,8 puntos.
Los pacientes que recibieron la inyección esclerosante calificaron el dolor con 41,1 puntos.
Evaluación global del éxito (éxito informado por los participantes, una puntuación más alta es mejor)
Mejoró en el 34% (entre el 19% y el 49%) o en 33,9 puntos en una escala de cero a 100 puntos.
Los pacientes sometidos a cirugía calificaron el dolor con 86,8 puntos.
Los pacientes que recibieron la inyección esclerosante calificaron el dolor con 52,9 puntos.
Retiros
Un paciente de cada grupo (4%) se retiró del estudio por motivos no relacionados con el tratamiento.
El estudio no informó sobre mejorías en la calidad de vida, mejorías en la puntuación funcional ni los eventos adversos (incluidas las roturas de tendones).
Calidad de la evidencia
Se decidió que la evidencia fue de baja certeza debido a las deficiencias en el diseño de los estudios que pueden sobrestimar los efectos beneficiosos del tratamiento. Por ejemplo, los pacientes involucrados en el estudio sabían qué tratamiento recibían, los estudios informaron selectivamente algunos resultados pero no otros y hubo imprecisión en los resultados debido al escaso número de participantes y ensayos. Por lo tanto, no se sabe si la cirugía tiene algún efecto beneficioso sobre los ejercicios excéntricos o las inyecciones esclerosantes en el tratamiento de la tendinopatía rotuliana en pacientes adultos. Es probable que estudios adicionales cambien los resultados.
Conclusiones de los autores
Summary of findings
| Open surgical excision compared to eccentric exercises for patella tendinopathy | ||||||
| Patient or population: adult participants with patellar tendinopathy | ||||||
| Outcomes | Anticipated absolute effects* (95% CI) | Relative effect | № of participants | Certainty of the evidence | Comments | |
| Risk with eccentric exercises | Risk with open surgical excision | |||||
| Knee pain Scale from: 0 to 10 (0 is no pain) | The mean pain was 1.7 points | The mean pain in the intervention group was 0.4 points better | ‐ | 40 | ⊕⊕⊝⊝ | Absolute change 4% better (4% worse to 12% better); relative change 10% better (30% better to 10% worse)3,4 |
| Function | The mean function in the control group was 65.7 | The mean function was 7.2 points higher | ‐ | 40 | ⊕⊕⊝⊝ | Absolute change 7% better (4% worse to 19% better); relative change 25% better (15% worse to 65% better)3,4 |
| Participant global assessment of success | 350 per 1000 | 250 per 1000 (95 to 658) | RR 0.71 (0.27 to 1.88) | 40 | ⊕⊕⊝⊝ | Absolute risk difference of 10% less success (38% less to 18% more); relative change 29% fewer experience no pain at 12 months (73% fewer to 88% more)4 |
| Quality of life | not measured | not measured | ‐ | ‐ | Not measured | |
| Withdrawal rate | 5/20 crossed over to surgery | No withdrawals or cross‐overs were possible from surgery | No estimate | 40 | ⊕⊕⊝⊝ | We cannot estimate comparative withdrawal rates, as no or cross‐overs were possible from surgery to exercise. |
| Adverse event | None | One participant developed chronic quadriceps pain | 40 | ⊕⊕⊕⊝ | Not estimable | |
| Tendon rupture | Not reported | Not reported | ‐ | ‐ | ‐ | Not reported, unclear if this outcome was measured |
| *The risk in the intervention group (and its 95% confidence interval) is based on the assumed risk in the comparison group and the relative effect of the intervention (and its 95% CI). | ||||||
| GRADE Working Group grades of evidence | ||||||
| 1 Downgraded one level for significant detection bias and reporting bias | ||||||
| Arthroscopic surgery compared to sclerosing injection for patella tendinopathy | ||||||
| Patient or population: adult participants with patellar tendinopathy | ||||||
| Outcomes | Anticipated absolute effects* (95% CI) | Relative effect | № of participants | Certainty of the evidence | Comments | |
| Risk with sclerosing injection | Risk with arthroscopic surgery | |||||
| Knee pain Scale from: 0 to 100 (0 is no pain) | Mean pain was 41.1 points. | The mean pain was 28.3 points better in the intervention group (14.8 to 41.8 points better). | ‐ | 50 | ⊕⊕⊝⊝ | Absolute difference 28% better (15% to 42% better); relative change 41% better (21% to 61% better)3, NNTB 2 (1 to 4) |
| Function | Not reported | Not reported | ‐ | ‐ | ‐ | Not reported |
| Participant global assessment of success Follow‐up: 12 months | Mean satisfaction was 52.9 points. | The mean patient satisfaction was 33.9 points better (18.7 to 49.1 points better). | ‐ | 50 | ⊕⊕⊝⊝ | Absolute improvement of 34% (19% to 49%)4 |
| Quality of life | Not measured | Not measured | ‐ | Not measured | ||
| Withdrawal rate | 1 event | 1 event, no reliable estimate | ‐ | 40 | ⊕⊝⊝⊝ VERY LOW1,2 | Not related to treatment (pregnancy) |
| Adverse event | Not reported | Not reported | ‐ | ‐ | ‐ | Not reported, unclear if this outcome was measured |
| Tendon rupture | Not reported | Not reported | ‐ | ‐ | ‐ | Not reported, unclear if this outcome was measured |
| *The risk in the intervention group (and its 95% confidence interval) is based on the assumed risk in the comparison group and the relative effect of the intervention (and its 95% CI). | ||||||
| GRADE Working Group grades of evidence | ||||||
| 1 Downgraded one level for significant detection bias and reporting bias | ||||||
Antecedentes
Descripción de la afección
La tendinopatía rotuliana es una afección por sobreuso que habitualmente afecta a los atletas, con una incidencia general del 14% en un estudio (Lian 2005). La tendinopatía rotuliana es más frecuente en los deportes de salto, con una incidencia de hasta el 40% en los jugadores de voleibol (Ferretti 1986); por lo tanto, Blazina acuñó el término "rodilla de saltador" en la descripción original de la afección (Blazina 1973). El pronóstico es malo: un informe indica que más de un tercio de los atletas que solicitan tratamiento no regresan al deporte en el transcurso de seis meses (Cook 1997), y otro estudio informó que hasta el 53% de los atletas se retiran del deporte debido a la afección, en comparación con el 7% de los atletas que se retiran sin la afección (Kettunen 2002).
La "rodilla de saltador" es un término más amplio que la tendinopatía rotuliana e incluye a los pacientes con dolor en la inserción del tendón en el cuádriceps (25% de los casos), la inserción en el polo distal (inferior) de la rótula (rodilla) (65%) y la inserción en el tubérculo tibial (área elevada del hueso sobre la tibia superior) (10%) (Ferretti 1985). Sin embargo, la tendinopatía rotuliana se limita a los síntomas en los que el tendón rotuliano (también conocido como ligamento rotuliano) se inserta en el polo distal de la rótula (Ferretti 1985).
La afección se llamaba anteriormente tendinitis, lo que implica que está asociada con la inflamación, pero la histología muestra que es degenerativa en lugar de inflamatoria. Se caracteriza por degeneración, muerte celular y microdesgarros en el tendón, junto con evidencia de formación de nuevos vasos sanguíneos (Khan 2002). El diagnóstico suele ser clínico, pero el ultrasonido muestra un engrosamiento del tendón (Mourad 1988), y tanto el ultrasonido como la resonancia magnética (RM) indican anomalías en la unión del tendón rotuliano proximal y márgenes borrosos del ligamento (Khan 1996).
El sistema de clasificación primaria utilizado para clasificar la gravedad de la tendinopatía de la rótula fue formalizado por Blazina, que dividió la afección en fases (Blazina 1973). Esto proporcionó una descripción cualitativa de la progresión clínica de la enfermedad. La fase 1 es dolor después del ejercicio, la fase 2 se caracteriza por un dolor que está presente al principio y al final de la actividad pero ausente después del "calentamiento", y la fase 3 es dolor durante y después de la actividad (Blazina 1973). La fase 4 fue una adición posterior de Roels y otros que representa la rotura completa del tendón (Roels 1978).
Para cuantificar mejor la gravedad y la respuesta al tratamiento, se desarrolló la escala VISA (Victorian Institute of Sport Assessment). Diseñada en 1998, es una serie de ocho preguntas con una puntuación total de 100, y una puntuación más alta representa menos síntomas. Ejemplos de puntuaciones medias son 95 (desviación estándar [DE] 8) en los individuos asintomáticos; 55 (DE 12) en aquellos con la enfermedad que participan en deportes; 22 (DE 17) como puntuación preoperatoria; 49 (DE 15) para la recuperación posoperatoria a los seis meses; y 75 (DE 17) para la recuperación posoperatoria a los 12 meses (Visentini 1998).
Descripción de la intervención
Los tratamientos no quirúrgicos para la tendinopatía rotuliana incluyen la reducción de la actividad deportiva y de otro tipo, el ejercicio, los fármacos antiinflamatorios, las cintas adhesivas, el masaje, las modalidades de fisioterapia y las terapias de inyección; hay evidencia limitada o consenso sobre el tratamiento óptimo (Cook 2001). Lo más común es que se utilicen ejercicios de fuerza en particular, ejercicios excéntricos (cuando el músculo se alarga a medida que se contrae). En el caso de la tendinopatía de rodilla, los ejercicios excéntricos habitualmente incluyen entrenamiento con cuclillas o ejercicios similares (Larsson 2012; Malliaras 2013).
Aproximadamente el 10% de los atletas con tendinopatía rotuliana, por lo general aquellos en las últimas etapas de la afección en los que las intervenciones no quirúrgicas han fracasado, se someten a cirugía (Ogon 2006). La cirugía se puede realizar con una incisión abierta o artroscópica (con un endoscopio o un tubo óptico iluminado, a través de una pequeña incisión o mínimo acceso). Los procedimientos incluyen el desbridamiento quirúrgico o la escisión de las áreas degeneradas del tendón; la perforación del polo inferior de la rótula en el sitio de la unión del tendón para estimular un nuevo flujo sanguíneo y promover la curación (Blazina 1973; Romeo 1999); y la tenotomía, que consiste en una incisión para exponer el tendón, seguida de la incisión o desconexión del tendón para permitir una mayor amplitud de movimiento del tendón y de la articulación (Khan 1999); o una combinación de los procedimientos.
De qué manera podría funcionar la intervención
Existen diferentes mecanismos de acción según el tipo de intervención quirúrgica. Durante el desbridamiento quirúrgico, el cirujano retira la parte enferma del tendón. Se cree que la perforación del hueso en el sitio de la fijación del tendón estimula una respuesta curativa al inducir el flujo sanguíneo al área (Blazina 1973; Romeo 1999). La tenotomía implica cortar a través del tendón, y se cree que 'libera' el tendón para permitir un mayor rango de movimiento a través del tendón y el músculo (Khan 1999). No se comprende bien cómo la cirugía mejora la funcionalidad del tendón rotuliano, ya que parece haber poca correlación entre la aparición de anomalías en el diagnóstico por imagen del tendón y la evaluación clínica con el uso de puntuaciones funcionales después de la cirugía (Khan 1999).
Por qué es importante realizar esta revisión
Por lo general, la cirugía se ofrece para la tendinopatía de la rótula después del fracaso de los tratamientos médicos y físicos, pero hay variación en el tipo de cirugía realizada para la afección y poco consenso sobre los efectos beneficiosos de la cirugía (Figueroa 2016; Kaeding 2006; Khan 2016). De hecho, se ha cuestionado el efecto clínico beneficioso de la cirugía; un ensayo controlado aleatorizado informó poca diferencia en el resultado entre los participantes que se sometieron a cirugía en comparación con los que recibieron entrenamiento con ejercicios excéntricos, y ambos grupos de tratamiento informaron mejoría durante el seguimiento durante 12 meses (Bahr 2006). Sin embargo, se siguen publicando grandes series de casos que informan sobre la utilidad de la cirugía para la enfermedad (Brockmeyer 2015), y los artículos de revisión que resumen la evidencia de las series de casos también concluyen que la cirugía es beneficiosa (Figueroa 2016; Khan 2016). No existe una revisión sistemática actual que resuma y evalúe la calidad y la solidez de la evidencia de los ensayos controlados aleatorizados que comparan las intervenciones quirúrgicas y no quirúrgicas.
Objetivos
Evaluar los efectos beneficiosos y perjudiciales de la cirugía para la tendinopatía de la rótula en pacientes adultos.
Las medidas de resultado principales fueron el dolor, la funcionalidad, la calidad de vida, la evaluación global del éxito de los participantes, la tasa de retiro, los eventos adversos totales y la rotura del tendón. El resultado menor fue el regreso al deporte.
Métodos
Criterios de inclusión de estudios para esta revisión
Tipos de estudios
Todos los estudios incluidos se describieron como ensayos controlados aleatorizados (ECA). Se incluyeron los estudios informados como texto completo, los publicados como resumen solamente y con datos no publicados. No se aplicaron restricciones de idioma ni de fecha en la búsqueda.
Tipos de participantes
Se incluyeron los ensayos con pacientes adultos con un diagnóstico de tendinopatía de la rótula, como se definió en los ensayos.
Tipos de intervenciones
Los ensayos fueron elegibles si compararon técnicas quirúrgicas (abiertas o artroscópicas) con cirugía placebo, ejercicio u otras modalidades no quirúrgicas.
Tipos de medida de resultado
Resultados principales
-
Dolor de rodilla: dolor medio general, evaluado mediante una escala analógica visual (EAV), escalas de calificación numéricas o categóricas u otras medidas.
-
Funcionalidad: funcionalidad media, evaluada mediante la Victorian Insitute of Sport Assessment (Visentini 1998) o Lysholm u otras puntuaciones específicas de la región o de la afección.
-
Calidad de vida relacionada con la salud: puntuación global de calidad de vida (p.ej., SF‐36, EQ5D, EQ‐VAS).
-
Evaluación global del éxito del participante, medida por una impresión global informada por el participante sobre el cambio clínico (mejoría), o una medida similar.
-
Proporción de retiros.
-
Proporción con eventos adversos (cualquiera).
-
Proporción con roturas de tendones.
Resultados secundarios
-
Retorno al deporte.
Puntos temporales
Se esperaba que los tiempos de seguimiento estuvieran comprendidos entre los tres meses y los dos años. Se planificó extraer datos sobre el dolor, la funcionalidad, la calidad de vida, el éxito global y los eventos adversos a los seis y 12 meses. Si los datos se informaron en múltiples puntos temporales dentro de cada uno de estos períodos, se planificó extraer los datos en el último punto temporal posible hasta los seis meses y hasta los 12 meses.
Métodos de búsqueda para la identificación de los estudios
Búsquedas electrónicas
We searched the Cochrane Central Register of Controlled Trials (CENTRAL), Ovid MEDLINE and Ovid Embase. We also conducted a search of ClinicalTrials.gov (www.ClinicalTrials.gov) and the WHO trials portal (www.who.int/ictrp/en/). We searched all databases from their inception until 17 July 2018 and we imposed no restriction on language of publication. See Appendix 1 for the MEDLINE search strategy; Appendix 2 for CENTRAL, Appendix 3 for Embase and Appendix 4 for trial registries.
Búsqueda de otros recursos
We checked the reference lists of all primary studies and review articles for potential additional studies.
Obtención y análisis de los datos
Selección de los estudios
Two review authors (MD, AP) independently screened titles and abstracts of all potentially relevant studies from the search for inclusion and coded them as 'retrieve' (eligible or potentially eligible/unclear) or 'do not retrieve'. We retrieved the full‐text reports and two review authors (MD, AP) independently screened the full text, identified studies for inclusion and identified and recorded reasons for exclusion of the ineligible studies. We resolved any disagreement through discussion or, if required, we consulted a third person (IH). We identified and excluded duplicates and collated multiple reports of the same study so that each study, rather than each report, was the unit of interest in the review. We recorded the selection process in sufficient detail to complete a PRISMA flow diagram (PRISMA Group 2009, prisma‐statement.org/PRISMAStatement/Default.aspx) and Characteristics of excluded studies table.
Extracción y manejo de los datos
We used a data collection form for study characteristics and outcome data. Data were independently extracted by two review authors (MD and AP) and disagreements settled by discussion or referral to the senior author (IH). We extracted the following study characteristics.
-
Methods: study design, total duration of study, details of any 'run‐in' period, number of study centres, location, study setting, withdrawals and year of study.
-
Participants: number, mean age, age range, sex, socioeconomic status, disease duration, severity of condition, diagnostic criteria, important condition‐specific and general health baseline data, inclusion criteria and exclusion criteria.
-
Interventions: intervention, comparison, concomitant medications, concomitant physical treatments and excluded treatments.
-
Outcomes: primary and secondary outcomes specified and collected and time points reported.
-
Characteristics of the design of the trial, as outlined below in Assessment of risk of bias in included studies.
-
Notes: funding for trial and notable declarations of interest of trial authors.
Two review authors (MD, AP) independently extracted the outcome data from the included studies. We extracted the number of events and the number of participants per treatment group for dichotomous outcomes, and means and standard deviations and number of participants per treatment group for continuous outcomes. We noted in the Characteristics of included studies table if outcome data were not reported in a usable way and when data were transformed or estimated from a graph. We resolved disagreements by consensus or by involving a third person (IH). One review author (MD) transferred the data into the Review Manager 5 file (RevMan 2014). We confirmed the accuracy of data by comparing those presented in the systematic review with the study reports. We used Web Plot Digitizer website to extract data from graphs or figures. These data were also extracted in duplicate.
We applied the following a priori decision rules to select which data to extract in the event of multiple outcome reporting.
-
Pain: overall pain was selected preferentially over pain related to activity, followed by pain at rest. We preferentially selected pain on a VAS scale over pain reported on numerical or categorical rating scales, and over pain reported on other scales, such as a subscore of a knee score.
-
Knee functional outcome scores: VISA score was preferred, followed by Lysholm Knee Score, Knee injury and Osteoarthritis Outcome score (KOOS), Western Ontario and McMaster Universities Osteoarthritis Index (WOMAC) and Oxford Knee scores.
-
If both final values and change‐from‐baseline values were reported for the same outcome, we preferentially extracted change‐from‐baseline values.
-
If both unadjusted and adjusted values for the same outcome were reported, we preferentially extracted adjusted values.
-
In accordance with Consolidated Standards Of Reporting Trials (CONSORT) guidelines, we reported on both intention‐to‐treat and per‐protocol analysis, using the per‐protocol to explore 'efficacy' of the intervention versus intention‐to‐treat to reflect the 'effectiveness' of the intervention.
-
If there were multiple time points, we extracted outcomes reported up to six months and up to 12 months.
Main planned comparisons
-
Surgery versus placebo.
-
Surgery versus exercise which is a commonly used first‐line therapy.
-
Surgery versus other non‐operative interventions, including but not limited to glucocorticoid injection; other injections including autologous blood products, stem cells and sclerosing agents; or pharmacological treatments (we planned to present the results by common comparisons).
Evaluación del riesgo de sesgo de los estudios incluidos
Two review authors (MD, AP) independently assessed the risk of bias for each study using the criteria outlined in the Cochrane Handbook for Systematic Reviews of Interventions (Higgins 2017). Risk of bias included selection, performance, detection, attrition and reporting bias. We resolved any disagreements by discussion or by involving another review author (IH).
We considered blinding separately for different key outcomes, where necessary (e.g. for unblinded outcome assessment, risk of bias for tendon rupture may be different than for a participant‐reported pain scale). We also considered the impact of missing data by key outcomes.
Where information on risk of bias was obtained from unpublished data or correspondence with an author, we noted this in the 'Risk of bias' table.
When considering treatment effects, we took into account the risk of bias for the studies that contributed to that outcome.
We presented the figures generated by the 'Risk of bias' tool to provide summary assessments of the risk of bias.
Assesment of bias in conducting the systematic review
We conducted the review according to the published protocol and report any deviations from it in Differences between protocol and review.
Medidas del efecto del tratamiento
We analysed dichotomous data as risk ratios or Peto odds ratios when the outcome was a rare event (less than 10%), and used 95% confidence intervals (CIs). Continuous data were analysed as mean difference (MD) or standardised mean difference (SMD), depending on whether the same scale was used to measure an outcome, and 95% CIs. We entered data presented as a scale with a consistent direction of effect across studies.
When different scales were used to measure the same conceptual outcome (e.g. disability), SMDs were calculated, with corresponding 95% CIs. SMDs were back‐translated to a typical scale (e.g. zero to 10 for pain) by multiplying the SMD by a typical among‐person standard deviation (e.g. the standard deviation of the control group at baseline from the most representative trial), in accordance with Chapter 12 of the Cochrane Handbook for Systematic Reviews of Interventions (Schünemann 2017b).
If return to sport was measured at intervals outside the three‐, six‐ or 12‐month time points, we analysed time‐to‐event data as hazard ratios. Rate data were to be analysed using Poisson methods.
In Effects of interventions, Summary of findings table 1 and Summary of findings table 2, we provide the absolute per cent difference and the relative per cent change from baseline. Where the outcome showed a clinically significant difference, we also provide the number needed to treat for an additional beneficial outcome (NNTB) or number needed to treat for an additional harmful outcome (NNTH). For dichotomous outcomes, the NNTB or NNTH was calculated from the control group event rate and the relative risk, using the Visual Rx NNT calculator (Cates 2008). The NNTB or NNTH for continuous measures was calculated using the Wells calculator (available at the Cochrane Musculoskeletal editorial office).
When interpreting results, we assumed a minimal clinically important difference of 1.5 points on a 10‐point pain scale or 15 points on a 100‐point scale (Hawker 2011); and 13 points on the zero‐to‐100 VISA scale (Hernandez‐Sanchez 2014).
For dichotomous outcomes, the absolute risk difference was calculated using the risk difference statistic in Review Manager software (RevMan 2014), and the result expressed as a percentage. For continuous outcomes, the absolute benefit was calculated as the improvement in the intervention group minus the improvement in the control group, in the original units, expressed as a percentage.
The relative per cent change for dichotomous data was calculated as the risk ratio minus one, expressed as a percentage. For continuous outcomes, the relative difference in the change from baseline was calculated as the absolute benefit divided by the baseline mean of the control group, expressed as a percentage.
Cuestiones relativas a la unidad de análisis
Where multiple trial arms were reported in a single trial, we included only the relevant arms. We planned to halve the control group if two comparisons (e.g. arthroscopic surgery versus placebo and open surgery versus placebo) were combined in the same meta‐analysis.
Manejo de los datos faltantes
We contacted investigators or study sponsors in order to verify key study characteristics and obtain missing numerical outcome data, where possible (e.g. when a study was identified as abstract only or when data were not available for all participants). Where this was not possible, and the missing data were thought to introduce serious bias, we explored the impact of including such studies in the overall assessment of results by a sensitivity analysis.
For dichotomous outcomes (e.g. number of withdrawals due to adverse events), we calculated the withdrawal rate using the number of participants randomised in the group as the denominator.
For continuous outcomes (e.g. mean change in pain score), we calculated the MD or SMD based on the number of participants analysed at that time point. We planned to use the number of randomised participants in each group at baseline, if the number of participants analysed was not presented for each time point.
Where possible, we computed missing standard deviations from other statistics such as standard errors, CIs or P values, according to the methods recommended in the Cochrane Handbook for Systematic Reviews of Interventions (Li 2019). If we could not calculate standard deviations, we imputed them (e.g. from other studies in the meta‐analysis) (Li 2019).
Evaluación de la heterogeneidad
Clinical and methodological diversity were assessed in terms of participants, interventions, outcomes, and study characteristics for the included studies, to determine whether a meta‐analysis was appropriate. This was done by observing the data in the data extraction tables. Statistical heterogeneity was assessed by visual inspection of the forest plot to assess for obvious differences in results between the studies, and by using the I² and Chi² statistical tests.
As recommended in Deeks 2017, we interpreted I² values as follows: 0% to 40% 'might not be important'; 30% to 60% may represent 'moderate' heterogeneity; 50% to 90% may represent 'substantial' heterogeneity; and 75% to 100% may represent 'considerable' heterogeneity. As noted in the Cochrane Handbook for Systematic Reviews of Interventions, we understood that the importance of I2 depends on the magnitude and direction of effects and the strength of evidence for heterogeneity.
The Chi² test values were interpreted as follows: a P value of 0.10 or less indicates evidence of statistical heterogeneity.
If we identified substantial heterogeneity (greater than 50%), we planned to report it and investigate possible causes by following the recommendations in Deeks 2017.
Evaluación de los sesgos de notificación
We planned to create and examine a funnel plot to explore possible small‐study biases. In interpreting funnel plots, we planned to examine the different possible reasons for funnel plot asymmetry as outlined in Sterne 2017. If we are able to pool more than 10 trials, we planned to undertake formal statistical tests to investigate funnel plot asymmetry, and planned to follow the recommendations in Sterne 2017.
To assess outcome reporting bias, we checked trial protocols against published reports. For studies published after 1 July 2005, we screened the WHO trial search at the International Clinical Trials Registry Platform of the World Health Organization (http://apps.who.int/trialssearch/) for the a priori trial protocol. We evaluated whether selective reporting of outcomes was present.
Síntesis de los datos
We planned to undertake meta‐analyses only where this would be meaningful, i.e. if the treatments, participants, and the underlying clinical question were similar enough for pooling to make sense. We planned to use a random‐effects model.
GRADE and 'Summary of findings' tables
We created a 'Summary of findings' table using the following outcomes: pain; knee function; quality of life; participant global assessment of success; withdrawal rate; adverse events (total); and tendon rupture.
The comparison in the first 'Summary of findings' table is eccentric exercise, followed by pooled non‐operative interventions in the second table. The main time point is 12 months.
Two review authors (MD, AP) independently assessed the certainty of the evidence. We used the five GRADE considerations (study limitations, consistency of effect, imprecision, indirectness, and publication bias) to assess the quality of a body of evidence as it relates to the studies which contribute data to the meta‐analyses for the prespecified outcomes, and reported the certainty of evidence as high, moderate, low, or very low. We considered the following criteria for upgrading the certainty of evidence, if appropriate: large effect, dose‐response gradient and plausible confounding effect. We used the methods and recommendations described in section 8.5 and 8.7, and chapters 11 and 12, of the Cochrane Handbook for Systematic Reviews of Interventions (Higgins 2017; Schünemann 2017a; Schünemann 2017b). We used GRADEpro GDT software to prepare the 'Summary of findings' tables (GRADEpro GDT 2015). We justified all decisions to downgrade or upgrade the certainty of studies using footnotes and comments to aid the reader's understanding of the review, where necessary. We provided the NNTB or NNTH, and the absolute and relative per cent change, in the 'Comments' column of the tables, as described in Measures of treatment effect.
Análisis de subgrupos e investigación de la heterogeneidad
We planned to carry out the following subgroup analyses, for the outcomes knee pain and function.
-
Open surgery versus arthroscopic surgery.
-
Secondary analysis combining non‐operative comparators.
We planned to use the formal test for subgroup interactions in Review Manager 5 (RevMan 2014) and to use caution in the interpretation of subgroup analyses, as advised in Deeks 2017.
Análisis de sensibilidad
We planned to carry out sensitivity analyses to investigate the robustness of the treatment effect for pain and function in terms of selection and detection biases.
-
Selection bias: we planned to remove trials at risk of selection bias (i.e. with inadequate or unclear allocation concealment) from the meta‐analysis.
-
Detection bias: we planned to remove trials with unclear or inadequate blinding of the participants from the meta‐analysis.
Results
Description of studies
Results of the search
The search strategy identified 225 unique citations. After screening titles and abstracts, we excluded 217 studies and assessed the full text of eight citations. Six of these were excluded (reasons listed below), and two studies met the inclusion criteria. We did not identify any ongoing studies or studies awaiting classification. The results of the search are presented in Figure 1.
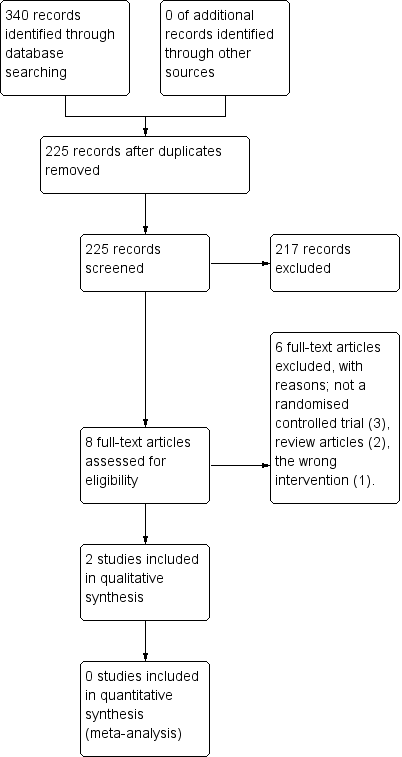
Study flow diagram.
Included studies
Trial design, setting and characteristics
We included two RCTs in the review. Both were parallel trials. Participants, inclusion and exclusion criteria, interventions, comparators and outcomes are described in the Characteristics of included studies table, along with any clinical characteristics a reader (i.e. patient or surgeon) might wish to know (e.g. so they can see whether the characteristics of participants in the trial match their own). Participants in both trials were followed for a total of 12 months. One trial compared open surgical excision with eccentric exercises (Bahr 2006), and the other compared arthroscopic surgery with sclerosing injections (Willberg 2011). No errata or retractions were noted at the time of the search.
Trial participants
The two trials included a total of 92 randomised participants; trial sizes varied from 40 to 52 participants. In general, the inclusion criteria for both trials were similar and included a clinical history, examination and imaging findings consistent with a presentation of patella tendinopathy, patient complaints of pain and tenderness at the inferior pole of the patella. In both studies participants had failed a minimum of three months of non‐surgical treatment, including rest, analgesia and physical therapy.
Across both trials the majority of participants were male (less than 10% of participants in each study were female) with a mean age of 26 to 31 years. Symptom duration varied but there was a mean of 20 to 30 months' duration in symptoms.
One study did not report training volume at baseline (Willberg 2011). Similar loads were reported in Bahr 2006, with means of 12.2 hours per week in the open surgical excision group compared with 11.2 hours per week in the eccentric exercises group.
The studies used different scales for measuring pain; in one study the surgical group had a baseline score of 4.3/10 pain with jumping, compared to 3.9/10 in the eccentric exercises group. In the other study the surgical group had higher baseline pain levels, with activity‐related pain scores of 76.5/100 compared to 69.0/100 in the sclerosing injection group. It is not clear what these activities were, and therefore we cannot draw conclusions as to why the difference existed.
One study (Bahr 2006) reported similar levels of function between the open surgical excision group and the eccentric exercises group at baseline (scores of 31/100 and 29/100, respectively). The other study (Willberg 2011) did not report on functional outcomes.
Interventions
Surgery was performed differently in the two studies. In one study, open surgical excision was carried out by two orthopaedic surgeons, whereas the details of who performed the arthroscopic surgery in the other study not disclosed.
Open surgical excision involved a 5 cm longitudinal midline incision from the inferior pole of the patella distally. A tourniquet was not used. The paratenon was split longitudinally and any pathologic paratenon tissue was removed. The tendon was split longitudinally in the midline to expose the deepest layers and all tissue that appeared abnormal was removed, or if not seen macroscopically the area calculated from the MRI was removed. Once the sutures were removed the participants were exposed to the same physiotherapist and eccentric exercises as the non‐operative group (Bahr 2006).
Arthroscopic surgery was performed under local anaesthetic, using anterolateral and anteromedial portals. No tourniquet was used. The patella tendon insertion into the patella was identified following a routine arthroscopic examination of the knee. A 4.5 mm shaver was utilised to destroy only the region with high blood flow and nerves adjacent to the tendinosis changes on the dorsal side of the tendon identified with ultrasound. No tendon tissue was resected and the Hoffa (Infrapatellar) fat pad was saved. Portals were closed with tape. No information was given on who performed the surgeries. Postoperatively, participants were allowed to weight bear as tolerated; from two weeks, gradual increase in loading of the tendon as tolerated was allowed, with no specific instructions on what exercises to do. This was the same as the sclerosing injection group (Willberg 2011).
Non‐operative comparisons involved eccentric exercises and sclerosing injections. Eccentric exercises were performed by the participants themselves with weekly supervision provided by the same physiotherapist. The exercises involved using a 25‐degree decline board at home, where the downward (eccentric) component was performed on the affected leg and the upward (concentric) component was performed on the asymptomatic leg. The participant was instructed to perform the squat to 90 degrees with the back in a vertical position. The participant was instructed to take two seconds for the eccentric component. The exercises involved twice‐daily sessions of three sets of 15 repetitions for a total duration of 12 weeks, with weekly supervision by a physiotherapist. No warm‐up was performed (Bahr 2006).
Sclerosing injections were performed using Polidocanol. A 0.7 mm x 50 mm needle, connected to a 2 mL syringe, was utilised. Volumes of 0.1 mL to 0.2 mL were injected into the regions with local neovascularisation/high blood flow dorsal to the proximal patellar tendon under ultrasound guidance. A maximum of three injections were given at six‐week intervals. All injections were performed by the same, single sonographer. Post‐injection, participants were allowed to weight bear as tolerated; from two weeks, gradual increase in loading of the tendon as tolerated was allowed, with no specific instructions on what exercises to do. This was the same as the arthroscopic surgery group (Willberg 2011).
Outcomes
Pain
All studies assessed at least one measure of pain, but measurement varied across trials. In one study, knee pain was measured by pain with standing jump (Bahr 2006). This was recorded on a zero‐ to 10‐point VAS at 12 months only. A lower score meant less pain. The other study (Willberg 2011) utilised a visual analogue scale for pain, with values of zero to 100, where a lower score meant less pain.
Function
Only one of the two studies (Bahr 2006) reported functional outcomes. It utilised the Victorian Institute of Sport Assessment (VISA) score for patella tendinopathy to measure functional response. The VISA score is a patient‐reported outcome score on a zero‐ to 100‐point scale, with higher scores indicating better function. The second study (Willberg 2011) appeared to measure the VISA score, but did not report it at baseline or follow‐up.
Participant global assessment of success
Both studies measured participant global assessment of success. One study (Bahr 2006) did this using both a dichotomous and continuous outcome. The dichotomous outcome looked at the proportion of participants with no pain at 12 months, whereas the continuous outcome was a self‐report VAS on an 11‐point scale from ‐5 to +5, with positive scores indicating an improvement in the condition.
The other study (Willberg 2011) also utilised a VAS, however it was a zero‐ to 100‐point scale, with higher scores indicating better satisfaction with treatment. The study reported the mean satisfaction score.
Withdrawal rate
Both studies included the number of participants who withdrew and the qualitative reason for the withdrawal.
Outcomes not measured
Neither study measured participants' quality of life or adverse events, including the proportion of participants who developed a tendon rupture. Personal communication with the corresponding author of Bahr 2006 indicated that there were no tendon ruptures noted in clinical follow‐up. Attempts to contact the authors of Willberg 2011 failed, so we cannot comment on whether there were any tendon ruptures or not. The authors of Willberg 2011 directly commented that they chose not to use a functional outcome (like VISA) as they felt it was not reflective of the improvement gained in the trial participants, as they were not elite athletes.
Excluded studies
Six studies were excluded after intially being screened, as they failed to meet the inclusion criteria. Three studies were not RCTs (Coleman 2000; Cuellar 2007; Sunding 2015), two studies were review articles (Gaida 2011; MarcheggianiMuccioli 2013), and one study was of the wrong intervention (Dragoo 2011).
Risk of bias in included studies
The 'Risk of bias' assessment for each study is reported in the Characteristics of included studies table and summarised in Figure 2 and Figure 3.
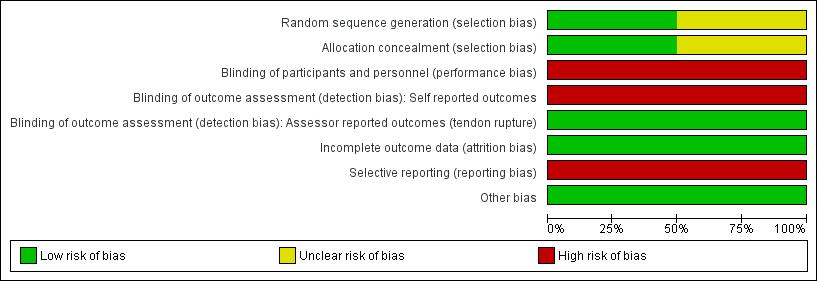
Risk of bias graph: review authors' judgements about each risk of bias item presented as percentages across all included studies.

Risk of bias summary: review authors' judgements about each risk of bias item for each included study.
Allocation
One trial (Bahr 2006) described adequate allocation concealment (through sealed opaque envelopes) and random sequence generation to intervention or comparator prior to the start of the study, so was likely to be at low risk of selection bias.
Methodology for sequence generation was not provided in Willberg 2011, and although concealed envelopes were used for allocation, the participants selected their own envelope. Therefore, there was a possibility of selection bias.
Blinding
We assessed both studies as being at high risk of both performance and detection bias. The participants were not blinded with regard to the group allocation, therefore there was potential for detection bias for self‐reported outcomes (pain, function, global evaluation) and performance‐related outcomes due to knowledge of the allocated interventions by participants. The assistant collecting the outcome scores was blinded to group allocation, however the data were recorded by participants who were not blinded and therefore there is a high risk of detection bias.
Incomplete outcome data
Attrition bias was minimised in both studies. In Bahr 2006, five out of 20 participants from the eccentric exercises group crossed over to the open surgical excision group, however the final score prior to surgery was carried over to the 12‐month follow‐up. In the other study (Willberg 2011), only one out of 26 participants from both groups withdrew from the study due to reasons unrelated to the treatment.
Selective reporting
We judged both studies to have a high risk of reporting bias. Both failed to report any measures of quality‐of‐life assessment or adverse events, including the presence or absence of tendon ruptures. One study (Willberg 2011) actively chose not to report validated functional scores (VISA scores), although it may have collected these data.
Other potential sources of bias
There were no other sources of bias. Cointerventions, including analgesics for pain relief, were allowed freely in both treatment groups.
Effects of interventions
See: Summary of findings for the main comparison Open surgical excision compared to eccentric exercises for patella tendinopathy; Summary of findings 2 Arthroscopic surgery compared to sclerosing injection for patella tendinopathy
Meta‐analysis
The interventions in the trials were considered too diverse to pool outcomes in a meta‐analysis: Bahr 2006 compared open surgical incision of the patellar tendon, followed by rehabilitation progressing to eccentric exercise, with eccentric exercise alone; Willberg 2011 compared arthroscopic shaving of the tendon with sclerosing injection.
Benefits
1. Open surgical excision compared with eccentric exercises
Bahr 2006 compared open surgical excision with eccentric exercises in 40 participants (20 participants in each group). At the completion of follow‐up (12 months), five of the 20 participants from the eccentric exercises group had crossed over to the surgical group. An intention‐to‐treat analysis was performed to include these participants in the final comparison. The five participants who crossed over from the eccentric exercises group to the open surgery group had no improvement in baseline values, i.e. these participants experienced no improvement after three months of eccentric exercises, and again no improvement 12 months after surgery.
The certainty of evidence was low for knee pain, function and global assessment of success (downgraded for imprecision, detection and reporting bias) and the results found that open surgical excision provides no clinically important benefits for these outcomes. Quality of life, adverse events and tendon ruptures were not reported. Major outcomes are reported in summary of findings Table for the main comparison.
Knee pain
At 12 months, mean pain scores with standing jump (measured on a 10‐point VAS scale, where a lower score indicates less pain) were 1.7 (SD 1.6) in the eccentric training group and 1.3 (SD 0.8) in the surgical group (one study, 40 participants). This equates to a mean difference of ‐0.4 points (95% CI ‐1.2 to 0.4), or an absolute pain reduction of 4% (4% worse to 12% better, the minimal clinically important difference being 1.5%) and a relative change in pain of 10% better (30% better to 10% worse) in the treatment group. As the 95% CIs included both clinically significant and non‐significant values, there was no clinically important difference in pain between eccentric training and surgery at 12 months (low‐certainty evidence). Pain at six months was not reported. Analysis 1.1
Function
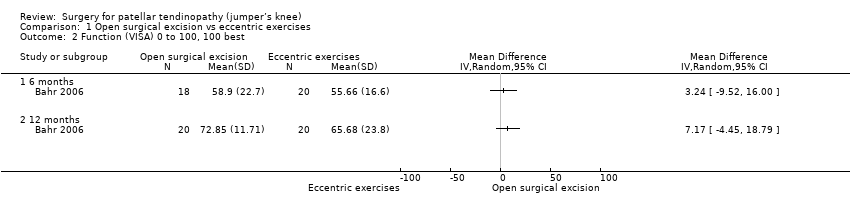
At six months, mean function on the 100‐point VISA scale (where a higher score indicates better function) was 55.7 (SD 16.6) in the eccentric training group and 58.9 (SD 22.7) in the surgical group (one study, 40 participants). This equates to a mean difference of 3.2 points (95% CI ‐9.5 to 16.0), an absolute change of 3% better function in the treatment group (9.5% worse to 16% better, the minimal clinically important difference being 13%).
At 12 months, mean function on the VISA scale was 65.7 (23.8) in the eccentric training group and 72.9 (11.7) in the surgical group. This equates to a mean difference of 7.2 points (95% CI ‐4.5 to 18.8), an absolute change of 7% better function (4% worse to 19% better) and a relative change of 25% better function (15% worse to 65% better) in the treatment group. Low‐certainty evidence showed there was no clinically important difference in function between eccentric training and surgery; the 95% CIs indicate that a clinically important change cannot be confirmed or excluded. Analysis 1.2
Participant global assessment of success
Global assessment of success was assessed as a dichotomous and continuous variable.
Success, defined as no pain at 12 months, was achieved in 7/20 participants (or 350 per 1000) in the eccentric exercises group and 5/20 (or 250 per 1000) in the surgical group: risk ratio (RR) 0.71 (95% CI 0.27 to 1.88; one trial, 40 participants). This equates to an absolute change of 10% less success (38% less to 18% more) and a relative change of 29% less success (73% fewer to 88% more) in the treatment group. Analysis 1.3
At six months, the mean global assessment of success (on a scale of ‐5 to +5, where a positive score indicates greater perceived benefit) was 2.0 (SD 1.3) in the eccentric training group, and 1.0 (SD 2.25) in the surgical group, a mean difference of ‐1.1 points (95% CI ‐2.2 to 0.1) or an absolute reduction, or worsening of, symptoms of 10% (1% better to 22% worse). At 12 months, the mean global assessment of success was 3.0 (SD 1.6) in the eccentric training group and 3.2 (SD 1.8) in the surgical group, a mean improvement of 0.2 points (95% CI ‐0.8 to 1.7) or an absolute improvement of 2% (8% worse to 17% better). Based on low‐certainty evidence (one study, 40 participants), there was no clinically important difference between eccentric training and surgery in the proportion of participants who rated treatment as successful at six or 12 months. Analysis 1.4
Return to sport
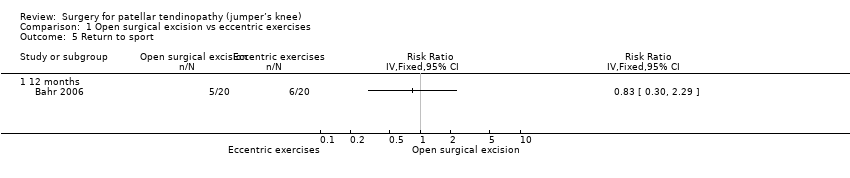
For return to sport, 6/20 (or 300 per 1000) in the eccentric group and 5/20 (or 250 per 1000) in the open surgical excision group returned to pre‐injury participation levels with no pain: RR 0.83 (95% CI 0.30 to 2.29). This equates to an absolute risk difference of 5% less success (33% less to 23% more) and a relative change of 17% less success (70% fewer to 129% more) in the open surgical excision group. Analysis 1.5
2. Arthroscopic surgery compared to sclerosing injections
Willberg 2011 compared arthroscopic surgery with sclerosing injections in 52 participants (26 in each group). Compared with sclerosing injection, low‐certainty evidence (downgraded for imprecision, detection and reporting bias) shows that arthroscopic surgery reduces pain and improves participant global assessment of success. Functional outcome scores were not reported, and quality of life was not measured in the trial. The proportion of participants with adverse events, and specifically the proportion with tendon rupture, was not reported. The minor outcome (return to sport) was also not reported. As there was no trial protocol we cannot confirm if any of the outcomes not reported were measured. See summary of findings Table 2.
Knee pain
Low‐certainty evidence shows that, compared to sclerosing injections, surgery results in a clinically important reduction in pain (one study, 52 participants). At 12 months, mean pain during activity on a 100‐point scale (where a lower score indicates less pain) was 41.1 (SD 28.5) in the sclerosing injection group and 12.8 (SD 19.3) in the arthroscopic surgery group. The absolute change was 28% better (15% to 42% better, the minimal clinically important difference being 15%) and the relative change was 41% better (21% to 61% better). No data were reported at six months, although outcomes were measured at this time point. Analysis 2.1
Participant global assessment of success
At 12 months, the mean participant global assessment of success on a 100‐point scale (where a higher score indicates greater satisfaction) was 52.9 (SD 32.6) in the sclerosing injection group and 86.8 (SD 20.8) in the arthroscopic surgery group. This equates to a mean improvement of 33.9 points (95% CI 18.7 to 49.1), an absolute improvement of 34% (19% better to 49% better) in the treatment group (one study, 50 participants). This is likely a clinically important difference between groups (assuming 10% is clinically important), however the evidence is of low certainty.Analysis 2.2
Proportion of withdrawals
The withdrawal rate was the same in each treatment arm (1/26, or 4% of participants).Analysis 2.3
Harms
Neither study reported on adverse outcomes.
Subgroup analysis and sensitivity analysis
Our planned subgroup analysis to assess if any differences in outcome occurred with arthroscopic or open surgical excision could not be performed as we did not identify more than one study with a common comparator. As we were unable to conduct a meta‐analysis, we did not perform any sensitivity analyses.
Discusión
Resumen de los resultados principales
Existe un número limitado de ensayos controlados aleatorizados que evalúan el efecto beneficioso de la intervención quirúrgica para la tendinopatía rotuliana. Se identificaron dos estudios con riesgo de varios sesgos. La evidencia que sustenta los resultados principales fue de baja o muy baja certeza, debido al riesgo de sesgo en los ensayos y a la imprecisión resultante de los tamaños pequeños de la muestra.
Evidencia de baja certeza de un único ensayo que comparó la escisión quirúrgica abierta con ejercicios excéntricos durante 12 meses (Bahr 2006) indica que puede no haber diferencias entre las intervenciones a los 12 meses en cuanto al dolor, los resultados funcionales o el beneficio percibido por los participantes.
Evidencia de baja certeza de un único ensayo que comparó el desbridamiento quirúrgico artroscópico con inyecciones esclerosantes durante 12 meses (Willberg 2011) indica posibles mejorías mayores en el dolor con la actividad, y mayores niveles de satisfacción de los participantes con la cirugía artroscópica. No se informó el resultado funcional, posiblemente debido al informe selectivo.
Ningún ensayo informó la evaluación de la calidad de vida ni los eventos adversos, incluidas las roturas de tendones.
Compleción y aplicabilidad general de las pruebas
Como no se identificaron ensayos controlados con placebo, no se pueden establecer conclusiones con respecto al beneficio de la cirugía.
Un estudio (Willberg 2011) informó una mejoría del dolor en la actividad con la cirugía artroscópica en comparación con las inyecciones esclerosantes, sin un placebo y, por lo tanto, no existe un comparador estándar en este ensayo.
La tendinopatía de la rótula es principalmente una afección que afecta a los atletas; los autores de Willberg 2011 eligieron no utilizar una puntuación de resultado validada, como la puntuación VISA o la calificación Blazina, y no informaron todos los puntos temporales registrados. La falta de cegamiento también fue evidente. Este sesgo, y la falta de un comparador estándar, probablemente sobreestima los resultados de este estudio para apoyar la cirugía artroscópica.
Willberg y colegas informaron sobre atletas que no eran de élite pero tenían altos niveles de actividad, mientras que Bahr y colegas informaron sobre atletas de élite; por lo tanto, la aplicabilidad de la evidencia se limita a estas poblaciones de pacientes. Sin embargo, la afección normalmente no se observa en la población que no es atleta.
Los ejercicios excéntricos actualmente se consideran el pilar del tratamiento para la tendinopatía de la rótula, aunque los efectos beneficiosos no están claros (Lopes 2018). En Bahr 2006, el 25% de los participantes no mostraron mejoría con los ejercicios excéntricos y pasaron a la cirugía durante el estudio. Este subgrupo de participantes tuvo peores resultados que el resto de los participantes del ensayo. Un análisis del tipo intención de tratar (intention‐to‐treat analysis) consideró lo anterior. Sin embargo, los resultados del resto de los participantes mejoraron con el tiempo, y ambos grupos fueron expuestos a ejercicios excéntricos, lo que podría significar que los ejercicios excéntricos solos podrían haber proporcionado el beneficio del tratamiento.
A pesar de la escasez de evidencia, la cirugía todavía se utiliza en la práctica clínica una vez que todos los demás mecanismos se han agotado en los casos que no responden al tratamiento. Los dos ensayos incluidos en esta revisión utilizaron diferentes técnicas quirúrgicas, dirigidas a diferentes áreas de la presunta patología. Esto pone de relieve la falta de consenso sobre la fisiopatología de la lesión y el tratamiento.
Todavía se desconocen los tratamientos óptimos para la tendinopatía rotuliana; sin embargo, estudios prospectivos indican que los atletas son más propensos a ser forzados al retiro por esta afección si no reciben tratamiento (Kettunen 2002).
Calidad de la evidencia
Se identificaron solo dos ensayos controlados aleatorizados que compararon la cirugía con intervenciones no quirúrgicas. La evidencia para cada resultado se disminuyó al menos dos veces, debido a la posibilidad de sesgo e imprecisión. Los estudios se vieron perjudicados por el potencial sesgo de realización y detección (debido a la dificultad para cegar a los participantes e investigadores a la intervención), el sesgo de deserción (debido a la falta de datos) y al uso de medidas de resultado no validadas en un estudio (Willberg 2011), lo que dio lugar a un posible sesgo de informe. Ambos ensayos no informaron eventos adversos, incluida la rotura de tendones, lo que también contribuyó al alto riesgo de sesgo de informe e hizo que no se pudieran calcular las estimaciones de riesgo de estos eventos. Los datos de cada medida de resultado provinieron de estudios únicos y pequeños, lo que dio lugar a imprecisión.
Un estudio (Bahr 2006) comparó la escisión quirúrgica con los ejercicios excéntricos. El dolor de rodilla, el resultado funcional (puntuación VISA), la puntuación de evaluación global y la tasa de retiro se redujeron a baja certeza debido al sesgo y la imprecisión. No hubo inconsistencia del efecto ya que los resultados provenían de un solo estudio, así como tampoco falta de direccionalidad ni sesgo de publicación. No se informaron medidas de calidad de vida, eventos adversos ni roturas de tendones.
La evidencia que comparó la cirugía artroscópica con las inyecciones esclerosantes también provino de un solo estudio (Willberg 2011). El dolor de rodilla y la puntuación de la evaluación global se disminuyeron a certeza baja debido a la imprecisión y al riesgo de sesgo de detección y realización. Debido a las tasas de eventos muy bajas, la evidencia sobre las tasas de retiro se disminuyó aún más a certeza muy baja. La calificación no se disminuyó por la consistencia del efecto, la falta de direccionalidad ni el sesgo de publicación. No se informaron el resultado funcional (puntuación VISA), las medidas de calidad de vida, los eventos adversos ni las roturas de tendones.
En general, la calidad de la evidencia se puede considerar baja de acuerdo con las recomendaciones GRADE, lo que significa que el efecto real puede ser marcadamente diferente del efecto estimado.
Sesgos potenciales en el proceso de revisión
Se considera que la falta de estudios es un reflejo de la escasez de la investigación sobre el tema y no se debe necesariamente al sesgo de publicación, ya que no se identificaron estudios en curso.
Dos autores de la revisión evaluaron de forma independiente los ensayos para su inclusión en la revisión, extrajeron los datos y evaluaron el riesgo de sesgo, y un tercer autor de la revisión actuó de árbitro cuando hubo alguna discrepancia. Este enfoque minimiza cualquier sesgo en la extracción y el procesamiento de los datos.
En los estudios abiertos existe la posibilidad de sesgo de realización y detección cuando los resultados principales son autoinformados. Como no se identificaron ensayos que compararan la cirugía con placebo (simulación), se eligió como comparador primario el tratamiento más habitual, los ejercicios excéntricos,.
Acuerdos y desacuerdos con otros estudios o revisiones
En las publicaciones de series de casos que utilizan la recolección retrospectiva de los datos y medidas de resultado subjetivas se informan altas tasas de satisfacción y mejoría clínica debido a la historia natural de la afección (Ogon 2006).
Se ha realizado una revisión sistemática de todos los tratamientos para la tendinopatía rotuliana (Larsson 2012). Esta fue una revisión sistemática que exploró todas las opciones de tratamiento; sin embargo, no incluyó Willberg 2011 debido a la fecha de búsqueda (solo incluyó Bahr 2006). La revisión concluyó que faltaba evidencia para apoyar la cirugía y que se necesitan estudios de investigación adicionales (Larsson 2012). Una revisión de las intervenciones quirúrgicas (Khan 2016) identificó los dos ensayos incluidos en esta revisión, pero los autores solo extrajeron los datos del grupo tratado quirúrgicamente y no compararon los resultados de la cirugía con las intervenciones no quirúrgicas. Khan 2016 concluyó que la cirugía tiene buenas tasas de éxito, pero reconoció que se necesita evidencia de mayor nivel. Este resultado coincide con los hallazgos de la presente revisión, que identificó solo dos ensayos elegibles y evidencia de baja certeza en torno al efecto beneficioso de la cirugía.

Study flow diagram.

Risk of bias graph: review authors' judgements about each risk of bias item presented as percentages across all included studies.

Risk of bias summary: review authors' judgements about each risk of bias item for each included study.

Comparison 1 Open surgical excision vs eccentric exercises, Outcome 1 Knee Pain‐ standing jump.
Comparison 1 Open surgical excision vs eccentric exercises, Outcome 2 Function (VISA) 0 to 100, 100 best.

Comparison 1 Open surgical excision vs eccentric exercises, Outcome 3 Global success ‐ Proportion with no symptoms at 12 months.

Comparison 1 Open surgical excision vs eccentric exercises, Outcome 4 Global assessment of success.
Comparison 1 Open surgical excision vs eccentric exercises, Outcome 5 Return to sport.
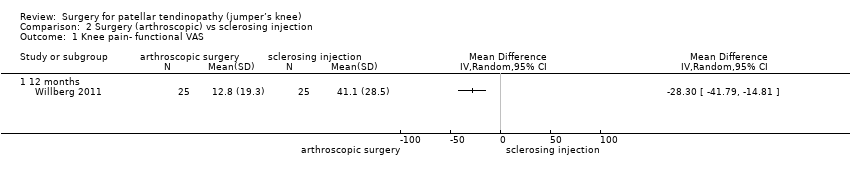
Comparison 2 Surgery (arthroscopic) vs sclerosing injection, Outcome 1 Knee pain‐ functional VAS.

Comparison 2 Surgery (arthroscopic) vs sclerosing injection, Outcome 2 Global outcome of success‐ Satisfaction VAS.

Comparison 2 Surgery (arthroscopic) vs sclerosing injection, Outcome 3 Withdrawal rate.
| Open surgical excision compared to eccentric exercises for patella tendinopathy | ||||||
| Patient or population: adult participants with patellar tendinopathy | ||||||
| Outcomes | Anticipated absolute effects* (95% CI) | Relative effect | № of participants | Certainty of the evidence | Comments | |
| Risk with eccentric exercises | Risk with open surgical excision | |||||
| Knee pain Scale from: 0 to 10 (0 is no pain) | The mean pain was 1.7 points | The mean pain in the intervention group was 0.4 points better | ‐ | 40 | ⊕⊕⊝⊝ | Absolute change 4% better (4% worse to 12% better); relative change 10% better (30% better to 10% worse)3,4 |
| Function | The mean function in the control group was 65.7 | The mean function was 7.2 points higher | ‐ | 40 | ⊕⊕⊝⊝ | Absolute change 7% better (4% worse to 19% better); relative change 25% better (15% worse to 65% better)3,4 |
| Participant global assessment of success | 350 per 1000 | 250 per 1000 (95 to 658) | RR 0.71 (0.27 to 1.88) | 40 | ⊕⊕⊝⊝ | Absolute risk difference of 10% less success (38% less to 18% more); relative change 29% fewer experience no pain at 12 months (73% fewer to 88% more)4 |
| Quality of life | not measured | not measured | ‐ | ‐ | Not measured | |
| Withdrawal rate | 5/20 crossed over to surgery | No withdrawals or cross‐overs were possible from surgery | No estimate | 40 | ⊕⊕⊝⊝ | We cannot estimate comparative withdrawal rates, as no or cross‐overs were possible from surgery to exercise. |
| Adverse event | None | One participant developed chronic quadriceps pain | 40 | ⊕⊕⊕⊝ | Not estimable | |
| Tendon rupture | Not reported | Not reported | ‐ | ‐ | ‐ | Not reported, unclear if this outcome was measured |
| *The risk in the intervention group (and its 95% confidence interval) is based on the assumed risk in the comparison group and the relative effect of the intervention (and its 95% CI). | ||||||
| GRADE Working Group grades of evidence | ||||||
| 1 Downgraded one level for significant detection bias and reporting bias | ||||||
| Arthroscopic surgery compared to sclerosing injection for patella tendinopathy | ||||||
| Patient or population: adult participants with patellar tendinopathy | ||||||
| Outcomes | Anticipated absolute effects* (95% CI) | Relative effect | № of participants | Certainty of the evidence | Comments | |
| Risk with sclerosing injection | Risk with arthroscopic surgery | |||||
| Knee pain Scale from: 0 to 100 (0 is no pain) | Mean pain was 41.1 points. | The mean pain was 28.3 points better in the intervention group (14.8 to 41.8 points better). | ‐ | 50 | ⊕⊕⊝⊝ | Absolute difference 28% better (15% to 42% better); relative change 41% better (21% to 61% better)3, NNTB 2 (1 to 4) |
| Function | Not reported | Not reported | ‐ | ‐ | ‐ | Not reported |
| Participant global assessment of success Follow‐up: 12 months | Mean satisfaction was 52.9 points. | The mean patient satisfaction was 33.9 points better (18.7 to 49.1 points better). | ‐ | 50 | ⊕⊕⊝⊝ | Absolute improvement of 34% (19% to 49%)4 |
| Quality of life | Not measured | Not measured | ‐ | Not measured | ||
| Withdrawal rate | 1 event | 1 event, no reliable estimate | ‐ | 40 | ⊕⊝⊝⊝ VERY LOW1,2 | Not related to treatment (pregnancy) |
| Adverse event | Not reported | Not reported | ‐ | ‐ | ‐ | Not reported, unclear if this outcome was measured |
| Tendon rupture | Not reported | Not reported | ‐ | ‐ | ‐ | Not reported, unclear if this outcome was measured |
| *The risk in the intervention group (and its 95% confidence interval) is based on the assumed risk in the comparison group and the relative effect of the intervention (and its 95% CI). | ||||||
| GRADE Working Group grades of evidence | ||||||
| 1 Downgraded one level for significant detection bias and reporting bias | ||||||
| Outcome or subgroup title | No. of studies | No. of participants | Statistical method | Effect size |
| 1 Knee Pain‐ standing jump Show forest plot | 1 | Mean Difference (IV, Fixed, 95% CI) | Totals not selected | |
| 1.1 12 months | 1 | Mean Difference (IV, Fixed, 95% CI) | 0.0 [0.0, 0.0] | |
| 2 Function (VISA) 0 to 100, 100 best Show forest plot | 1 | Mean Difference (IV, Random, 95% CI) | Totals not selected | |
| 2.1 6 months | 1 | Mean Difference (IV, Random, 95% CI) | 0.0 [0.0, 0.0] | |
| 2.2 12 months | 1 | Mean Difference (IV, Random, 95% CI) | 0.0 [0.0, 0.0] | |
| 3 Global success ‐ Proportion with no symptoms at 12 months Show forest plot | 1 | Risk Ratio (M‐H, Random, 95% CI) | Totals not selected | |
| 4 Global assessment of success Show forest plot | 1 | Mean Difference (IV, Fixed, 95% CI) | Totals not selected | |
| 4.1 6 months | 1 | Mean Difference (IV, Fixed, 95% CI) | 0.0 [0.0, 0.0] | |
| 4.2 12 months | 1 | Mean Difference (IV, Fixed, 95% CI) | 0.0 [0.0, 0.0] | |
| 5 Return to sport Show forest plot | 1 | Risk Ratio (IV, Fixed, 95% CI) | Totals not selected | |
| 5.1 12 months | 1 | Risk Ratio (IV, Fixed, 95% CI) | 0.0 [0.0, 0.0] | |
| Outcome or subgroup title | No. of studies | No. of participants | Statistical method | Effect size |
| 1 Knee pain‐ functional VAS Show forest plot | 1 | Mean Difference (IV, Random, 95% CI) | Totals not selected | |
| 1.1 12 months | 1 | Mean Difference (IV, Random, 95% CI) | 0.0 [0.0, 0.0] | |
| 2 Global outcome of success‐ Satisfaction VAS Show forest plot | 1 | Mean Difference (IV, Fixed, 95% CI) | Totals not selected | |
| 2.1 12 months | 1 | Mean Difference (IV, Fixed, 95% CI) | 0.0 [0.0, 0.0] | |
| 3 Withdrawal rate Show forest plot | 1 | Odds Ratio (M‐H, Fixed, 95% CI) | Totals not selected | |
| 3.1 12 months | 1 | Odds Ratio (M‐H, Fixed, 95% CI) | 0.0 [0.0, 0.0] | |