Probiotics for people with cystic fibrosis
Abstract
Background
Cystic fibrosis (CF) is a multisystem disease and the importance of growth and nutrition has been well established, given its implications for lung function and overall survival. It has been established that intestinal dysbiosis (i.e. microbial imbalance) and inflammation is present in people with CF. Probiotics are commercially available (over‐the‐counter) and may improve both intestinal and overall health.
Objectives
To assess the efficacy and safety of probiotics for improving health outcomes in children and adults with CF.
Search methods
We searched the Cochrane Cystic Fibrosis Trials Register, compiled from electronic database searches and handsearching of journals and conference abstract books. Date of last register search: 20 January 2020.
We also searched ongoing trials registries and the reference lists of relevant articles and reviews. Date of last search: 29 January 2019.
Selection criteria
Randomised or quasi‐randomised controlled trials (RCTs) assessing efficacies and safety of probiotics in children and adults with CF. Cross‐over RCTs with a washout phase were included and for those without a washout period, only the first phase of each trial was analysed.
Data collection and analysis
We independently extracted data and assessed the risk of bias of the included trials; we used GRADE to assess the certainty of the evidence. We contacted trial authors for additional data. Meta‐analyses were undertaken on outcomes at several time points.
Main results
We identified 17 trials and included 12 RCTs (11 completed and one trial protocol ‐ this trial was terminated early) (464 participants). Eight trials included only children, whilst four trials included both children and adults. Trial duration ranged from one to 12 months. Nine trials compared a probiotic (seven single strain and three multistrain preparations) with a placebo preparation, two trials compared a synbiotic (multistrain) with a placebo preparation and one trial compared two probiotic preparations.
Overall we judged the risk of bias in the 12 trials to be low. Three trials had a high risk of performance bias, two trials a high risk of attrition bias and six trials a high risk of reporting bias. Only two trials were judged to have low or unclear risk of bias for all domains. Four trials were sponsored by grants only, two trials by industry only, two trials by both grants and industry and three trials had an unknown funding source.
Combined data from four trials (225 participants) suggested probiotics may reduce the number of pulmonary exacerbations during a four to 12 month time‐frame, mean difference (MD) ‐0.32 episodes per participant (95% confidence interval (CI) ‐0.68 to 0.03; P = 0.07) (low‐certainty evidence); however, the 95% CI includes the possibility of both an increased and a reduced number of exacerbations. Additionally, two trials (127 participants) found no evidence of an effect on the duration of antibiotic therapy during the same time period. Combined data from four trials (177 participants) demonstrated probiotics may reduce faecal calprotectin, MD ‐47.4 µg/g (95% CI ‐93.28 to ‐1.54; P = 0.04) (low‐certainty evidence), but the results for other biomarkers mainly did not show any difference between probiotics and placebo. Two trials (91 participants) found no evidence of effect on height, weight or body mass index (low‐certainty evidence). Combined data from five trials (284 participants) suggested there was no difference in lung function (forced expiratory volume at one second (FEV1) % predicted) during a three‐ to 12‐month time frame, MD 1.36% (95% CI ‐1.20 to 3.91; P = 0.30) (low‐certainty evidence). Combined data from two trials (115 participants) suggested there was no difference in hospitalisation rates during a three‐ to 12‐month time frame, MD ‐0.44 admissions per participant (95% CI ‐1.41 to 0.54; P = 0.38) (low‐certainty evidence). One trial (37 participants) reported health‐related quality of life and while the parent report favoured probiotics, SMD 0.87 (95% CI 0.19 to 1.55) the child self‐report did not identify any effect, SMD 0.59 (95% CI ‐0.07 to 1.26) (low‐certainty evidence). There were limited results for gastrointestinal symptoms and intestinal microbial profile which were not analysable.
Only four trials and one trial protocol (298 participants) reported adverse events as a priori hypotheses. No trials reported any deaths. One terminated trial (12 participants and available as a protocol only) reported a severe allergic reaction (severe urticaria) for one participant in the probiotic group. Two trials reported a single adverse event each (vomiting in one child and diarrhoea in one child). The estimated number needed to harm for any adverse reaction (serious or not) is 52 people (low‐certainty evidence).
Authors' conclusions
Probiotics significantly reduce faecal calprotectin (a marker of intestinal inflammation) in children and adults with CF, however the clinical implications of this require further investigation. Probiotics may make little or no difference to pulmonary exacerbation rates, however, further evidence is required before firm conclusions can be made. Probiotics are associated with a small number of adverse events including vomiting, diarrhoea and allergic reactions. In children and adults with CF, probiotics may be considered by patients and their healthcare providers. Given the variability of probiotic composition and dosage, further adequately‐powered multicentre RCTs of at least 12 months duration are required to best assess the efficacy and safety of probiotics for children and adults with CF.
PICO
Plain language summary
Probiotics for people with cystic fibrosis
Review question
We reviewed the evidence for the use of probiotics in people with cystic fibrosis.
Background
Cystic fibrosis leads to thick mucus which affects the lungs, gut and other organs. People with cystic fibrosis often have altered gut bacteria and inflammation. Gut inflammation may be linked to growth, with worse inflammation linked to worse growth measures. This is relevant as optimal nutrition and growth is important for lung function and survival in CF.
Probiotics are live bacteria which will provide a health benefit to the individual. Probiotics are available over‐the‐counter, commonly used by people with cystic fibrosis and may improve gut inflammation and overall health.
Search date
The evidence is current to: 20 January 2020.
Study characteristics
The review included 12 randomised controlled trials (11 completed and one trial protocol (plan) ‐ this trial was terminated early but reported some results on side effects) with 464 people with cystic fibrosis. Eight trials included only children, whilst four trials included both children and adults. The trials lasted between one and 12 months. Eight trials used a probiotic with a single type of bacteria and four trials used a probiotic with two or more types of bacteria. Only one trial compared different bacteria and the others compared probiotics to a placebo (dummy treatment with no active medication).
Key results
Probiotics may reduce the rate of pulmonary exacerbations, however, this is not definite; pulmonary exacerbations are events where breathing symptoms are worsened (e.g. increased cough, sputum or shortness of breath) and lung function declines. Probiotics may reduce a marker of gut inflammation called calprotectin, however, the benefit of this to an individual is unknown. There were no differences between probiotics and placebo for height, weight or body mass index (BMI). Results did not show that probiotics affect lung function, need for admission to hospital or abdominal symptoms. One small trial measured quality of life and the parents questionnaire favoured probiotics, but the children's self report did not show a difference between probiotics and placebo. Probiotics may cause vomiting, diarrhoea and allergic reactions. We estimate 52 people need to take probiotics for one person to have an adverse event.
We could not analyse the results of the trial comparing different probiotics because of its design.
Future trials should look into the use of probiotics for at least 12 months and assess measures of lung and gut health, growth, abdominal symptoms, quality of life and adverse events. Given the wide range or probiotics (single and multi‐strain combinations), doses used and degree of effectiveness, determining the best regimen(s) to investigate further will be challenging.
Certainty of the evidence
There were several issues with the overall certainty of the evidence which affects our confidence in the results from these trials. We think the fact that some participants did not complete their treatment or were not included in the reports may affect the results on weight. We think the fact that not all planned outcomes were reported in four trials may affect the results of intestinal inflammation, growth and abdominal symptoms. We think the fact that the pharmaceutical industry sponsored at least four of the trials should be considered when looking at the results of this review. As most trials only included children we are not certain that the results would also apply to adults and there were also some issues related to whether people taking part in the trial knew which treatment they were receiving.
We judged the certainty of evidence for changes in pulmonary exacerbations, intestinal inflammation, lung function, hospital admissions, weight and health‐related quality of life to be low. Adverse events were only recorded by four trials and the protocol for the terminated trial and the certainty of the evidence was also judged to be low.
Authors' conclusions
Summary of findings
| Probiotics compared to placebo for children and adults with CF | ||||||
| Patient or population: children and adults with CF | ||||||
| Outcomes | Anticipated absolute effects* (95% CI) | Relative effect | No. of participants | Certainty of the evidence | Comments | |
| Risk with placebo | Risk with probiotics | |||||
| Number of pulmonary exacerbations | The mean (range) number of pulmonary exacerbations in the placebo group was 1.42 (0.37 to 2.2) episodes per participant. | The mean number of pulmonary exacerbations in the probiotics group was 0.32 episodes per participant lower (0.68 lower to 0.03 higher). | NA | 225 | ⊕⊕⊝⊝ | Probiotics probably reduce pulmonary exacerbations (mean number per participant) slightly. |
| Faecal calprotectin | The mean (range) faecal calprotectin in the placebo group was 132.9 µg/g (67 µg/g to 182.1 µg/g). | The mean faecal calprotectin in the probiotics group was 47.4 µg/g lower (93.28 lower to 1.54 lower). | NA | 177 | ⊕⊕⊝⊝ | Probiotics result in a reduction in faecal calprotectin. |
| Adverse events (serious adverse reaction and adverse reaction) | There were 0 adverse events in the placebo group. | There were 4 adverse events in the probiotics group. | RR 3.00 | 310 | ⊕⊕⊝⊝ | Probiotics result in a small number of adverse events. The terminated RCT reported a serious adverse event (severe urticaria) in 1 participant on probiotics. No mortalities were reported in any included RCTs. |
| Weight (z score) | The mean (range) weight (z score) in the placebo group was ‐1.2 (‐1.79 to ‐0.81). | The mean weight (z score) in the probiotics group was0.24 SD lower (0.52 lower to 0.05 higher). | NA | 91 | ⊕⊕⊝⊝ | Insufficient evidence to determine if probiotics result in little to no difference in weight. A third RCT (n = 38) reported weight in kg and also reported no significant difference in weight. |
| Lung function (FEV1 % predicted) | The mean (range) FEV1 (% predicted) in the placebo group was 84.8% (52.7% to 104%) | The mean FEV1 (% predicted) in the probiotics group was 1.36% higher (1.20 lower to 3.91 higher). | NA | 284 | ⊕⊕⊝⊝ | Insufficient evidence to determine if probiotics result in little to no difference in lung function (FEV1 % predicted). |
| Hospitalisations (all causes) | The mean number of hospitalisations (all causes) in the placebo group was 0.53 admissions per participant. | The mean number of hospitalisations in the probiotics group was 0.44 admissions per participant lower (1.41 lower to 0.54 higher). | NA | 115 | ⊕⊕⊝⊝ | Insufficient evidence to determine if probiotics result in little to no difference in hospitalisation rates. |
| HRQoL (PedsQLTM 4.0 SF 15 (Scale from: 0 to 100)) | The mean HRQoL score from the PedsQLTM 4.0 SF 15 ‐ Parent Report in the placebo group was 81.4. | The standardised mean HRQoL score from the PedsQLTM 4.0 SF 15 ‐ Parent Report in the probiotics group was 0.87 SD higher (0.19 higher to 1.55 higher). | NA | 37 | ⊕⊕⊝⊝ | Insufficient evidence to determine if probiotics result in a small effect in HRQoL. |
| The mean HRQoL score from the PedsQLTM 4.0 SF 15 ‐ Child Report in the placebo group was 85.9. | The standardised mean HRQoL score from the PedsQLTM 4.0 SF 15 ‐ Child Report in the probiotics group was 0.59 SD higher (0.07 lower to 1.26 higher). | NA | 37 | ⊕⊕⊝⊝ | Insufficient evidence to determine if probiotics result in a small effect in HRQoL. | |
| *The risk in the intervention group (and its 95% CI) is based on the assumed risk in the comparison group and the relative effect of the intervention (and its 95% CI). | ||||||
| GRADE Working Group grades of evidence | ||||||
| a Downgraded once due to high risk of bias due to selective reporting. b Downgraded due to high risk of bias due to incomplete outcome data. c Downgraded due to lack of generalisability as majority of the studies only include children. d Downgraded due to high risk of bias due to blinding. | ||||||
Background
Description of the condition
Cystic fibrosis (CF) is a life‐limiting genetic disease caused by mutations in the cystic fibrosis transmembrane conductance regulator (CFTR) gene affecting approximately 70,000 children and adults worldwide (CF Foundation 2017). It is a multisystem disease which results in thick secretions and predominantly affects the lungs, gastrointestinal tract, pancreas and liver. The growth and nutritional status of people with CF is of paramount importance as they are major determinants of lung function and therefore survival (Corey 1988; Jadin 2011). Currently only around half of people with CF achieve an adequate nutritional status (McCormick 2010; Turck 2016). In the era of newborn screening, and despite improvements in nutrition and pulmonary care, many children with CF fail to achieve catch‐up weight gain to a level comparable with their birth weight z score within two years of CF diagnosis (Jadin 2011; Shoff 2006).
Intestinal dysbiosis (i.e. microbial imbalance) is well‐documented in people with CF (Burke 2017; de Freitas 2018a; Duytschaever 2011; Madan 2012; Nielsen 2016; Ooi 2018; Rogers 2016; Schippa 2013; Vernocchi 2018) and emerging evidence suggests that it occurs within the first year of life and then progresses further from normal with increasing age compared to healthy controls (Nielsen 2016). By three years of age, the intestinal microbiota fully resembles that of an adult in terms of composition and diversity, and once established the adult microbiome is stable and relatively difficult to disturb (Faith 2013; Yatsunenko 2012). Currently there is a paucity of data about the developmental trajectory of intestinal microbiota in early CF years (Antosca 2019; Hoen 2015; Madan 2012). The gastrointestinal microbiota plays an important role in health and disease as it contributes to metabolic function and immunity (Quigley 2013). The alteration in gut microbiota in CF is hypothesised to be due to the dehydrated, acidic luminal environment and inspissated (thick) slow‐to‐clear mucus within the gut (Lee 2012). High‐caloric, high‐fat diets (Sutherland 2018; Tomas 2016) and frequent antibiotic therapy (Duytschaever 2011) also contribute to this dysbiosis. Intestinal inflammation has been identified in people with CF and this may be due to the altered composition of the gut bacterial ecosystem (Antosca 2019; de Freitas 2018b; Dhaliwal 2015; Garg 2017; Garg 2018; Lee 2012; Smyth 2000; Werlin 2010). Faecal calprotectin, measured using commercially available ELISA kits, is commonly reported as a marker of intestinal inflammation in CF, with levels greater than 50 µg/g considered inflamed (Fallahi 2013; Garg 2017; von Roon 2007). It has recently been observed that intestinal inflammation is inversely correlated with growth in children with CF (Dhaliwal 2015). Additional biomarkers of intestinal inflammation reported in people with CF include M2‐pyruvate kinase (M2‐PK) (Garg 2018) and rectal nitric oxide (rNO) (Bruzzese 2014).
Compared to healthy controls, the intestinal milieu in CF (beyond bacterial communities) is altered with different metabolomic* (Fouhy 2017; Kaakoush 2016; Vernocchi 2018) and proteomic profiles* (Debyser 2016). Furthermore, intestinal dysbiosis may also be associated with impaired innate (inherent) immunity in CF children (Ooi 2015a). Three recent longitudinal studies on the developing respiratory and intestinal microbiomes of infants and young children with CF suggested that:
-
colonisation of the gut by potentially pathogenic bacteria (Escherichia and Enterococcus species (spp)) appeared to precede colonisation of the lungs; and
-
increased gut microbiota diversity was associated with prolonged periods of health, with delays in time to initial Pseudomonas aeruginosa colonisation and first CF exacerbation (Hoen 2015; Madan 2012);
-
Bacteroides spp were significantly decreased in CF over the first year of life, and these bacteria have the potential to reduce intestinal inflammation through a reduction of interleukin 9 (IL‐8) (Antosca 2019).
*Metabolomics is the study of small‐molecule metabolites which provides insights into cellular processes and metabolic pathways, whereas proteomics is the study of host and microbial proteins which provides insights into functional pathways.
Description of the intervention
Probiotics were first described in 1907 by Elie Metchnikoff (Metchnikoff 1908), and are now often defined as "live microorganisms which when consumed in adequate amounts confer a health benefit on the host" (FAO/WHO 2002). Probiotics have been commercially available since the 1930s and have been used both prophylactically and therapeutically to improve gut microbial profiles, as well as to improve mucosal, epithelial, intestinal and systemic immune activity. Prebiotics are defined as a substrate that is selectively utilised by host microorganisms conferring a health benefit (Gibson 2017), whilst synbiotic preparations refer to a combination of prebiotics and probiotics.
Oral probiotic supplements are usually in the form of either a tablet, capsule, powder, yogurt, milk or food product. Several probiotic strains including Lactobacillus and Bifidobacterium spp are 'Generally Recognized as Safe' by the United States Food and Drug Administration (US FDA) (www.fda.gov). Probiotic strains of Lactobacillus, Bifidobacterium and Saccharomyces have a long‐standing record of being used safely, however, newer probiotics, including Roseburia spp, Akkermansia spp, Propionibacterium spp and Faecalibacterium spp are promising for the future (Sanders 2019).
In many countries, probiotics are not regulated as drugs, but rather classified as food supplements which have different regulations. In the USA, if a probiotic is intended to treat or prevent a human disease, it is regulated as a drug and a biological product by the US FDA (www.fda.gov). Probiotics commonly administered in clinical trials of CF include Lactabacillus spp, Bifidobacterium spp, Saccharomyces spp and Streptococcus spp. Knowledge regarding the optimal strains, dose and duration of therapy is still lacking for many conditions including CF. Microbial viability of probiotic preparations may be assessed by plating and culture to determine the colony forming units (CFU) of that preparation at that point in time. The impact of a probiotic preparation on an individual's microflora is often assessed via metagenomic sequencing of stool samples, whilst the functional alterations may also be assessed using metabolomics or proteomics techniques.
How the intervention might work
The presence of intestinal dysbiosis and inflammation is well‐established in CF (Dhaliwal 2015; Kaakoush 2016; Nielsen 2016; Ooi 2015a; Pang 2015; de Freitas 2018b) and probiotics are hypothesised to correct these alterations by restoring the gut microbial profile towards 'normal'. A large and progressive number of metabolic, immune‐mediated and inflammatory diseases, such as obesity, atopic and allergic disorders, type I diabetes and inflammatory bowel disease have been linked with intestinal dysbiosis and probiotics have shown beneficial effects on the gastrointestinal environment in some of these diseases (Arrieta 2014). Probiotics have also been beneficial in managing Clostridium difficile infections (Goldenberg 2013) and antibiotic‐associated diarrhoea (Goldenberg 2015) as well as preventing acute upper respiratory tract infections (Hao 2015). These conditions commonly affect people with CF. Additionally, probiotics may be beneficial in specific circumstances for people with inflammatory bowel disease:
-
VSL#3 may induce remission in ulcerative colitis (UC), and
-
probiotics may be as effective as 5‐aminosalicylates in preventing relapse of quiescent UC (Derwa 2017).
Probiotics act through a variety of means, including modulation of immune functions, improving gut barrier integrity, production of organic acids and antimicrobial compounds, enzyme formation and interactions with the host and resident microbiota (Sanders 2019), Although the exact mechanisms are unclear, probiotics promote benefits in CF by correcting dysbiosis, inhibiting potentially pathogenic bacteria, promoting beneficial metabolic pathways, improving intestinal motility and barrier function whilst also conferring positive local and systemic immune effects (Bruzzese 2014; del Campo 2014; Li 2014; Quigley 2013). Probiotic strains may reduce the expression of pro‐inflammatory cytokines via an action principally mediated by Toll‐like receptors (Plaza‐Diaz 2017). Consequently, a reduction in intestinal inflammation has been observed in people with CF (Bruzzese 2014; del Campo 2014). Intestinal health and homeostasis also likely confers direct, indirect and systemic benefits on:
-
lung health (gut‐lung axis potentially through immune‐mediated cross‐talk) (Hoen 2015; Marsland 2015);
-
brain health (gut‐brain axis) (de Clercq 2017); and
-
general health outcomes such as growth (Dhaliwal 2015).
Why it is important to do this review
Intestinal inflammation, unlike airway inflammation, in CF has largely been understudied as a therapeutic target. Probiotics are commercially available over‐the‐counter and a survey from a CF clinic in the USA found that 60% of paediatric patients were self‐medicated with probiotics (Sullivan 2015). In 2016, European consensus guidelines stated that further studies were required before a recommendation on probiotics could be made (Turck 2016); and several studies have been published since that time. Given the prevalence and life‐long burden of CF disease, the potential benefit of probiotics on intestinal, respiratory and general health should be further explored and reviewed.
A systematic review on probiotics for people with CF is important given the emerging evidence and a synthesis of this data will provide useful to the wider community. To date five systematic reviews on probiotics in children or adults (or both) with CF have been performed (Anathan 2016; Anderson 2017; Neri 2019; Nikniaz 2017; Van Biervliet 2017). This review will differ by only including randomised controlled trials (RCTs) and will evaluate both children and adults. A meta‐analysis on probiotics in children and adults with CF is yet to be performed.
Objectives
To assess the efficacy and safety of probiotics for improving health outcomes in children and adults with CF.
Methods
Criteria for considering studies for this review
Types of studies
We have included RCTs and quasi‐RCTs which assess efficacies of probiotics in children and adults with CF. Cross‐over RCTs were included; however, only results from the first phase of each trial was analysed when no 'washout' period was included in the trial design. A washout phase is designed to limit potential residual treatment effects and as there is no consensus on duration, we have not defined a minimum duration for the washout. Trials were not excluded for failure to conceal treatment allocation or blind the outcome assessor.
Types of participants
We have included trials involving participants who fulfil consensus diagnostic criteria for CF (e.g. Farrell 2008). No restrictions for included participants were placed on age, gender, genotype, pancreatic exocrine sufficiency status, disease severity, co‐morbidities, antibiotic use or CFTR modulator therapy.
Types of interventions
Any oral probiotic formulation (any strain(s), dose or formulation, with or without a prebiotic) compared to any other probiotic formulation, placebo or no treatment control.
Types of outcome measures
Primary outcomes
-
Pulmonary exacerbation defined using consensus criteria, e.g. Fuch's criteria (Fuchs 1994)
-
number of pulmonary exacerbations
-
duration of antibiotic therapy (any route) for pulmonary exacerbations (days)
-
-
Inflammatory biomarkers (mean change from baseline and post treatment absolute mean)
-
intestinal
-
calprotectin (µg/g)
-
M2‐PK (U/mL)
-
rNO (µmol/L)
-
-
serum
-
C‐reactive protein (CRP) (mg/L)
-
cytokines (pg/mL))
-
-
sputum
-
C‐reactive protein (mg/L)
-
cytokines (pg/mL)
-
-
-
Adverse events
-
serious adverse reactions defined as any untoward medical occurrence which results in death, is life‐threatening, requires hospitalisation or prolongation of hospitalisation, or results in persistent or significant disability or incapacity (e.g. sepsis (bacteraemia))
-
adverse reaction defined as any untoward medical occurrence with reasonable causal relationships (e.g. nausea and abdominal bloating)
-
mortality (all causes)
-
Secondary outcomes
-
Growth and nutrition (mean change from baseline and post treatment absolute mean)
-
height (cm and z score)
-
weight (kg and z score)
-
body mass index (BMI) (kg/m² and z score)
-
-
Lung function (mean change from baseline and post treatment absolute mean)
-
forced expiratory volume in one second % predicted (FEV1%)
-
forced expiratory volume (FEV) (L)
-
lung clearance index (LCI)
-
-
Hospitalisations (all causes)
-
number
-
duration (days)
-
-
Health‐related quality of life (HRQoL) measured using a validated questionnaire (e.g. CFQ‐R (Quittner 2009))
-
Gastrointestinal symptoms measured using a validated symptom score (e.g. JenAbdomen‐CF Score (Tabori 2017))
-
Intestinal microbial profile assessed using next‐generation sequencing of stool samples
-
alpha diversity (richness or Shannon index)
-
beta diversity (Bray‐Curtis dissimilarity)
-
Search methods for identification of studies
We searched for all relevant published and unpublished trials without restrictions on language, year or publication status.
Electronic searches
The Cochrane Cystic Fibrosis and Genetic Disorders Group's Information Specialist conducted a systematic search of the Group's Cystic Fibrosis Trials Register for relevant trials using the following terms: probiotics.
The Cystic Fibrosis Trials Register is compiled from electronic searches of the Cochrane Central Register of Controlled Trials (CENTRAL) (updated each new issue of the Cochrane Library), weekly searches of MEDLINE, a search of Embase to 1995 and the prospective handsearching of two journals ‐ Pediatric Pulmonology and the Journal of Cystic Fibrosis. Unpublished work is identified by searching the abstract books of three major cystic fibrosis conferences: the International Cystic Fibrosis Conference; the European Cystic Fibrosis Conference and the North American Cystic Fibrosis Conference. For full details of all searching activities for the register, please see the relevant section of the Cochrane Cystic Fibrosis and Genetic Disorders Group's website.
Date of latest search: 20 January 2020.
In addition to the above, we searched the following databases and trials registers:
-
PubMed (www.ncbi.nlm.nih.gov/sites/entrez; 1946 to 29 January 2019);
-
US National Institutes of Health Ongoing Trials Register ClinicalTrials.gov (www.ClinicalTrials.gov; searched 29 Januray 2019);
-
World Health Organization International Clinical Trials Registry Platform (WHO ICTRP) (apps.who.int/trialsearch/; searched 29 January 2019);
-
Open Grey (www.opengrey.eu/; searched 29 January 2019).
For details of our search strategies, please see Appendix 1.
Searching other resources
We checked the bibliographies of included trials and any relevant systematic reviews identified for further references to relevant trials. We contacted trial authors, experts and organisations in the field to obtain additional information on relevant trials and ongoing trials.
Data collection and analysis
We employed the standard methods of the Cochrane Cystic Fibrosis and Genetic Disorders Group and of the Cochrane Handbook of Systematic Reviews of Interventions (Higgins 2011a).
Selection of studies
Once we identified a complete list of references, one author (MC) checked for and removed duplicates and entered the list into the Covidence online software product (Covidence 2019). Two review authors (MC and MG) independently assessed abstracts and, as necessary, the full text of each trial to determine which trials satisfied the inclusion criteria. We resolved discrepancies by discussion and consensus with a third review author (CO).
Data extraction and management
Two review authors (MC and MG) independently extracted data using a standard data extraction form in Covidence online software product (Covidence 2019), piloting this on three articles. No trials required translation into English before assessment. We collected data on:
-
participant characteristics;
-
trial characteristics and design;
-
interventions and comparator;
-
outcome data ‐ reported separately for each outcome.
We resolved discrepancies by discussion and consensus with a third review author (CO). When data were incomplete, we contacted the primary investigator to request further information and clarification. When multiple publications from the one trial were identified, we grouped reports together.
We entered the extracted data into RevMan for analysis (Review Manager 2014). We grouped outcome data (based on the duration of intervention) into three‐monthly intervals for the first 12 months and then annually there‐after. Since we identified multiple probiotic strains, we performed a combined analysis (i.e. all probiotics versus placebo) followed by subgroup analyses at the genus level for outcomes with sufficient data.
Assessment of risk of bias in included studies
To assess the risk of bias we used the risk of bias tool described in the Cochrane Handbook of Systematic Reviews for Interventions (Higgins 2011b). Two review authors (MC and MG) independently assessed the risk of bias for each included trial across the six domains:
-
sequence generation;
-
allocation concealment;
-
blinding (self‐reported and objective);
-
incomplete outcome data;
-
selective reporting; and
-
other potential sources of bias.
We resolved discrepancies by discussion and consensus with a third review author (CO).
If a trial described the randomisation and allocation processes, including concealment from the researchers and at least two review authors deemed these to be adequate, then we considered the trial to have a low risk of bias. When these processes were inadequate or unclear, we deemed the trial as having a high risk of bias or unclear risk of bias, respectively. To assess blinding, we looked at who was blinded and the method used to determine the risk of bias. We examined missing data, the distribution of missing data between groups and how the investigators managed withdrawals and loss to follow‐up. We considered an intention‐to‐treat (ITT) analysis to be highly favourable in minimising the risk of bias. We assessed outcome reporting by reviewing the outcomes to be measured, either in the trial paper or a published protocol. If trial investigators measured relevant outcomes but did not report these, we deemed the trial of be at high risk of bias. We searched for any other potential sources of bias.
We entered the data into individual trial and summary 'Risk of bias' tables. We did not exclude trials on the basis of risk of bias. We aimed to perform a sensitivity analysis to explore the synthesis of evidence with variable quality; however, this was not performed due to the limited number of trials for each outcome and our assessment in those instances that the risk of bias judgements were not likely to influence the results.
Measures of treatment effect
For the dichotomous outcome of 'adverse events', we recorded the number of participants with the event and the number of participants analysed in each group. We calculated a pooled estimate of the treatment effect for each outcome across trials using a risk ratio (RR) with 95% confidence intervals (CI), where appropriate. We presented absolute treatment effects and calculated the number needed to treat for an additional beneficial (NNTB) or harmful outcome (NNTH) for all outcome measures regardless of statistical significance.
For continuous outcomes, we recorded the mean change and standard deviation (SD) from baseline for each group or mean post‐treatment or intervention values and SD or standard error (SE) for each group. We calculated a pooled estimate of treatment effect for each outcome using the mean difference (MD) with 95% CI or standardised mean difference (SMD) with 95% CI depending on the variability of outcome measures.
Unit of analysis issues
The unit of analysis in trials with a parallel group design was the individual participant.
We reviewed the five included trials with a cross‐over design. If a 'washout' period was included in the trial design and investigators perform an appropriate paired analysis, then we included the effect estimate of the intervention for each outcome in a meta‐analysis using the generic inverse‐variance method (Higgins 2011c). If a 'washout' period was not included or investigators did not analyse the data appropriately (i.e. paired analyses), we included data from the first phase of the cross‐over and analysed these as if the trial had a parallel group design.
Dealing with missing data
If the reported trial data were insufficient or unclear for our purposes, we contacted the trial author(s) or sponsor(s) (or both) through written correspondence. We requested data and additional information to complete our assessment. We assessed whether investigators have performed an ITT analysis and reported the number of participants missing from each trial arm where possible. We imputed missing SDs for the mean change from baseline results using a correlation coefficient calculated from another trial that presented means and SDs for change as well as for baseline and final measurements, according to the Cochrane Handbook of Systematic Reviews of Interventions (Higgins 2011c). If only the means and P value were available for a trial, we estimated the SDs using the RevMan Calculator (Higgins 2011c).
Assessment of heterogeneity
We assessed heterogeneity between trials using the Chi² and I² statistics and by visual inspection of the overlap in CIs on the forest plots (Higgins 2003). Regarding the Chi² test, a P value of less than 0.1 is of interest. Regarding the I² statistic, we defined our interpretation as in the Cochrane Handbook for Systematic Reviews of Interventions (Deeks 2011):
-
0% to 40%: might not be important;
-
30% to 60%: may represent moderate heterogeneity;
-
50% to 90%: may represent substantial heterogeneity;
-
75% to 100%: considerable heterogeneity.
In the presence of heterogeneity, we investigated possible sources of heterogeneity through subgroup and sensitivity analyses.
Assessment of reporting biases
We minimised reporting bias from the non‐publication of trials or selective outcome reporting by using a broad search strategy, searching trial registries and contacting regulatory agencies. Given no outcome had at least 10 trials identified, we did not create any funnel plots to assess for publication bias (Sterne 2011). Therefore, the risk of publication bias could not be ruled out. To assess for selective reporting, we compared trial protocols (if available) with the reported outcomes in the trial publication. If a trial protocol was unavailable, we compared the methods section and outcomes reported in the results section. We record information on the sponsors and funding sources for trials and conflicts of interest of authors to assess for external bias.
Data synthesis
When possible we combined trials in a meta‐analysis using the Review Manager software (Review Manager 2014). Given multiple probiotic strains were used in trials, then irrespective of the statistical heterogeneity, a random‐effects model was used as it does not assume that all intervention effects are the same.
Subgroup analysis and investigation of heterogeneity
When possible we performed subgroup analyses to assess treatment effect for:
-
age (adults (18 years of age and over) versus children (up to 18 years of age)).
If we identified heterogeneity with a Chi² P value less than 0.1 or an I² statistic greater than 40%, we investigated this by undertaking the following subgroup analyses:
-
probiotic strain(s) (grouped by genus): Lactobacillus, Bifidobacterium, Streptococcus, Saccharomyces, and combinations;
-
probiotic dose (CFU per day): ≤ 108, > 108 to 109, > 109 to 1010, > 1010 to 1011, or > 1011;
-
duration of washout included in cross‐over RCTs: up to and including two weeks, between two and four weeks, between four and six weeks, between six and 12 weeks, or over 12 weeks.
Sensitivity analysis
For our meta‐analysis, we planned on conducting sensitivity analyses to assess for effect of the risk of bias by including or not including trials with an overall high risk of bias; however, we did not perform this analysis due to the limited number of trials available for each outcome. For individual outcomes included in this review, we conducted a sensitivity analysis when a high risk of bias for any domain was thought to have a plausible confounding effect on the result. We planned on assessing the inclusion or exclusion of cross‐over trials when data from only the first phase of treatment was unavailable; we did not undertake this analysis due to the limited number of trials available for each outcome.
We also undertook sensitivity analyses where we had imputed data or combined results for the change from baseline with post treatment results in order to see the effect that these assumptions had made.
Summary of findings table
We generated a 'Summary of findings' table and reported each of the following outcomes:
-
number of pulmonary exacerbations;
-
change in intestinal calprotectin (µg/g);
-
adverse events;
-
change in weight (kg);
-
change in lung function (FEV1%);
-
number of hospitalisations;
-
health‐related QoL score(s).
We chose these outcomes based on relevance to clinicians and consumers. We determined the overall certainty of the evidence for each outcome using the GRADE approach (Schünemann 2011a). For each outcome we reported the population, setting, intervention, comparison, illustrative comparative risks, magnitude of effect (RR or MD or SMD), number of participants and trials, GRADE score and comments.
Results
Description of studies
Results of the search
The searches identified a total of 143 references which was reduced to 136 unique references after duplicates were removed. At initial screening, 109 references were excluded and 27 references (relating to 19 individual trials) were assessed more closely. We included 12 trials (20 references) (Bruzzese 2007; Bruzzese 2014; Bruzzese 2018; de Freitas 2018a; del Campo 2009; del Campo 2014; Di Benedetto 1998; Di Nardo 2014; Fallahi 2013; Jafari 2013; NCT01201434; Van Biervliet 2018) and excluded one trial (one reference) (Bruzzese 2004); we have listed four trials (one reference each), identified from online trials registries as ongoing (ACTRN12616000797471; IRCT2017011732004N1; NCT01837355; RBR‐5byrsc). One of the included trials fits the inclusion criteria but was terminated early in December 2013 due to a severe allergic reaction (severe urticaria) in one participant on probiotic supplementation; the trial provides no data other than the number of enrolled participants and the adverse event as a reason for termination (NCT01201434). Two trials are listed as 'Awaiting classification' pending further information (IRCT201201258778N3; IRCT201205219823N1). The flow of trials through the screening process of the review is presented in the PRISMA diagram (Figure 1).
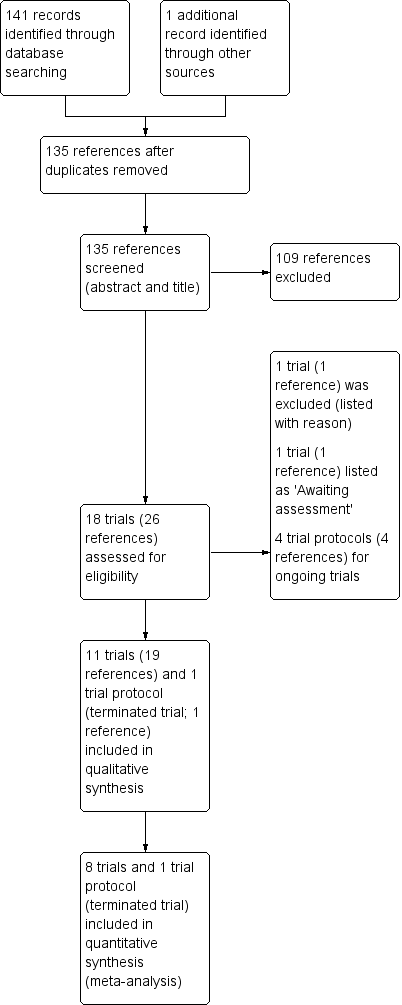
Study flow diagram.
Included studies
Please refer to the Characteristics of included studies.
Design
There were 12 trials included which comprised of nine RCTs comparing a probiotic with a placebo preparation (Bruzzese 2007; Bruzzese 2014; Bruzzese 2018; del Campo 2014; Di Benedetto 1998; Di Nardo 2014; Jafari 2013; NCT01201434; Van Biervliet 2018), two RCTs comparing a synbiotic with a placebo preparation (de Freitas 2018a; Fallahi 2013) and one RCT comparing two probiotic preparations (del Campo 2009). Seven trials employed a parallel design (Bruzzese 2014; Bruzzese 2018; de Freitas 2018a; del Campo 2009; Di Nardo 2014; Fallahi 2013; Jafari 2013). Five trials employed a cross‐over design, but only one of which included a washout period (Van Biervliet 2018), whilst four did not (Bruzzese 2007; del Campo 2014; Di Benedetto 1998; NCT01201434). Nine trials were available as full texts and two were only available as abstracts (del Campo 2009; Di Benedetto 1998). One trial is available only via an online trials registry and provides no data other than the number of enrolled participants and the adverse event as a reason for termination (NCT01201434).
The duration of the included trials ranged from one month (Bruzzese 2014; Fallahi 2013; Jafari 2013) to 12 months (Bruzzese 2018).
Sample sizes
A total of 464 randomised participants were included in this review; 12 of whom were enrolled in the terminated trial (NCT01201434). Sample sizes ranged from 22 participants (Bruzzese 2014) to 81 participants (Bruzzese 2018). Six trials reported a sample size calculation (Bruzzese 2007; Bruzzese 2018; de Freitas 2018a; Di Nardo 2014; Jafari 2013; Van Biervliet 2018).
Setting
Nine trials were performed at single centres; four in Italy (Bruzzese 2007; Bruzzese 2014; Di Benedetto 1998; Di Nardo 2014), one in Spain (del Campo 2009), two in Iran (Fallahi 2013; Jafari 2013), one in Brazil (de Freitas 2018a) and one in Israel (NCT01201434). Three trials were conducted at multiple centres including two sites in Spain (del Campo 2014), three sites in Belguim (Van Biervliet 2018) and five sites in Italy (Bruzzese 2018).
Participants
Of the 464 participants included in this review, 321 participated in eight trials involving children aged two to 18 years (Bruzzese 2007; Bruzzese 2014; Bruzzese 2018; de Freitas 2018a; Di Benedetto 1998; Fallahi 2013; Jafari 2013; Van Biervliet 2018) and 131 participated in three trials involving both children and adults, age range four to 44 years (del Campo 2009; del Campo 2014; Di Nardo 2014). The remaining 12 participants (age range five to 40 years) were enrolled in the terminated trial and no further data are available (NCT01201434). Males comprised between 42% and 70% of populations in all trials except one, which did not report gender (Fallahi 2013). In four trials, all participants were pancreatic insufficient (PI) (Bruzzese 2007; Bruzzese 2018; Fallahi 2013; Jafari 2013), in another trial 84% were PI (Van Biervliet 2018) and in a further trial 37% were PI (del Campo 2014); this characteristic was not reported in five trials (Bruzzese 2014; de Freitas 2018a; del Campo 2009; Di Benedetto 1998; Di Nardo 2014). Five trials reported that between 39% and 55% of participants were homozygous F508del (Bruzzese 2007; Bruzzese 2014; Bruzzese 2018; Di Nardo 2014; Van Biervliet 2018). Baseline FEV1 % predicted was reported in six trials and ranged between 45% and 100% (Bruzzese 2007; Bruzzese 2018; de Freitas 2018a; del Campo 2014; Di Nardo 2014; Van Biervliet 2018). Baseline BMI was reported in four trials and ranged between 16.3 and 19.9 (Bruzzese 2018; del Campo 2014); this was reported as a z score and ranged between ‐1.21 and ‐0.50 (de Freitas 2018a; Van Biervliet 2018).
Two trials reported on healthy controls who provided a reference for normal, but contributed no data to this review (Bruzzese 2014; de Freitas 2018a).
Interventions
Seven trials employed a single‐strain intervention; Lactobacillus rhamnosus GG in four trials (Bruzzese 2007; Bruzzese 2014; Bruzzese 2018; Di Benedetto 1998) and Lactobacillus reuteri in three trials (DSM 17938 in two trials (del Campo 2009; del Campo 2014) and ATCC55730 in one trial (Di Nardo 2014). One trial used a two‐strain intervention with L rhamnosus SP1 (DSM 21690) and Bifidobacterium animalis lactis spp BLC1 (LMG 23512) (Van Biervliet 2018). Five trials used a multi‐strain combination containing Lactobacillus (L acidophilus, L bulgaricus, L casei, L paracasei, L plantarum or L rhamnosus), Bifidobacterium (B breve, B infantis or B longum) or Streptococcus thermophilus species, or both (del Campo 2009; de Freitas 2018a; Fallahi 2013; Jafari 2013; NCT01201434). Two trials used a synbiotic (i.e. prebiotic and probiotic) formulation containing fructooligosaccharides (FOS) combined with (i) L casei, L rhamnosus, S thermophilus, B breve, L acidophilus, B infantis, L bulgaricus and FOS (Fallahi 2013) and (ii) L paracasei, L rhamnosus, L acidophilus, B lactis (de Freitas 2018a). The prebiotic FOS were not used in the placebo formulations in either trial (Fallahi 2013; de Freitas 2018a).
Preparations varied across trials; capsules were used in five trials (Bruzzese 2014; Bruzzese 2018; del Campo 2009; Jafari 2013; NCT01201434), a chewable tablet in one trial (del Campo 2014), sachets in three trials (de Freitas 2018a; del Campo 2009; Fallahi 2013), drops in one trial (Di Nardo 2014), oral rehydration solution (ORS) in two trials (Bruzzese 2007; Di Benedetto 1998) and was not specified in one trial (Van Biervliet 2018).
The placebo formulation was reported in six trials and comprised of ORS in two trials (Bruzzese 2007; Di Benedetto 1998), maltodextrin in two trials (de Freitas 2018a; Fallahi 2013) or maltodextrin with magnesium stearate in the remaining two trials (Bruzzese 2014; Bruzzese 2018). The amounts of maltodextrin used in the placebo formulations would be unlikely to have any appreciable prebiotic effect.
Doses of probiotic formulations in the order of 108 CFU/day were used in two trials (del Campo 2009; del Campo 2014), 109 CFU/day in seven trials (Bruzzese 2007; Bruzzese 2014; Bruzzese 2018; de Freitas 2018a; Di Benedetto 1998; Fallahi 2013; Jafari 2013), 1010 CFU/day in three trials (Di Nardo 2014; NCT01201434; Van Biervliet 2018) and 1011 CFU/day in one trial (del Campo 2009).
The duration of the intervention period was one month in three trials (Bruzzese 2014; Fallahi 2013; Jafari 2013), three months in one trial (de Freitas 2018a), four months in one trial (Van Biervliet 2018), six months in six trials (Bruzzese 2007; del Campo 2009; del Campo 2014; Di Benedetto 1998; Di Nardo 2014; NCT01201434) and 12 months in one trial (Bruzzese 2018).
Outcomes
Primary outcomes of this review were reported as follows. Five trials reported on pulmonary exacerbations (Bruzzese 2007; Bruzzese 2018; Di Nardo 2014; Jafari 2013; Van Biervliet 2018). Inflammatory biomarkers were reported in terms of faecal calprotectin by five trials (Bruzzese 2014; del Campo 2014; Di Nardo 2014; Fallahi 2013; Van Biervliet 2018), serum cytokines (IL‐8 and TNF‐α) by two trials (de Freitas 2018a; Di Nardo 2014) and sputum cytokines (IL‐8 and TNF‐α) by one trial (Di Nardo 2014). Adverse events were recorded in four trials (Bruzzese 2007; del Campo 2014; Di Nardo 2014; Van Biervliet 2018); the remaining trials did not comment on the presence or absence of any adverse events. Intestinal M2‐PK, rNO, serum CRP and sputum CRP were also not reported in any trials.
With regards to the review's secondary outcomes, height was reported in three trials (de Freitas 2018a; del Campo 2014; Van Biervliet 2018), weight in five trials (Bruzzese 2007; de Freitas 2018a; del Campo 2014; Di Benedetto 1998; Van Biervliet 2018) and BMI in five trials (Bruzzese 2007; Bruzzese 2018; de Freitas 2018a; del Campo 2014; Van Biervliet 2018). Lung function (FEV1 % predicted) was reported in six trials (Bruzzese 2007; Bruzzese 2018; de Freitas 2018a; del Campo 2014; Di Nardo 2014; Van Biervliet 2018) but FEV (L) and LCI were not reported in any trial. Three trials reported on hospitalisations (Bruzzese 2007; Bruzzese 2018; Jafari 2013). HRQoL was measured using the Short Form 12 (SF‐12) in two trials (del Campo 2009; del Campo 2014) and the PedsQLTM 4.0 SF 15 in one trial (Jafari 2013); gastrointestinal symptoms were measured using the Gastrointestinal Quality of Life Index (GIQLI) in one trial (del Campo 2014). Three trials generated intestinal microbial profiles using 16S rRNA gene sequencing (Bruzzese 2014; del Campo 2014; Van Biervliet 2018).
The terminated trial had planned to report the effect of probiotics on pulmonary infection rates, sputum bacteria, sputum inflammatory markers and gastrointestinal inflammation (NCT01201434).
Additional reported outcomes not included in this review include:
-
pulmonary function measured by maximal mid‐expiratory flow (MMEF) 25% ‐ 75% (Bruzzese 2018; del Campo 2014) and forced vital capacity (FVC) % of predicted (Van Biervliet 2018);
-
faecal fat absorption measured by near‐infrared reflectance analysis (NIRA) (gr%) and an absorption coefficient (%) (del Campo 2014);
-
steatorrhoea measured using the steatocrit method (Di Benedetto 1998);
-
serum iron levels (Di Benedetto 1998);
-
number of upper respiratory tract infections (defined as rhinitis, pharyngitis, sinusitis and otitis, and confirmed by CF physicians) (Di Nardo 2014);
-
number of gastrointestinal tract infections (defined as diarrhoea with three loose or watery stools within 24 hours with or without vomiting, and confirmed by CF physicians) (Di Nardo 2014);
-
change in qualitative and quantitative bacteria present in sputum (Di Nardo 2014);
-
gut permeability measured using the lactulose/mannitol test (Van Biervliet 2018); and
-
nutritional status measured using upper‐arm fat area, upper‐arm muscle area and body fat percentage (de Freitas 2018a).
Excluded studies
We excluded one trial after screening as it was a case‐control study (Bruzzese 2004).
Studies awaiting classification
There are two trials listed as 'Awaiting assessment' pending further information (IRCT201201258778N3; IRCT201205219823N1). Both are single‐centre RCTs which are being conducted in Iran. Both are of parallel design and the intervention period is one month; however, one trial is due to report follow‐up data at up to six months. The number of participants is 37 in one trial and 50 in the second. Participants in both trials are children; in one trial the age range is from four to 18 years and in the second trial the age range is two to 12 years. Both trials used the same probiotic as the active intervention (protexin), but exact dose levels are not clear from the registry entries. In one trial maltodextrin is used as a placebo, but in the second trial the control is no intervention. One trial only plans to measure fecal calprotectin, but the second trial lists lung function, QoL, height, weight and circumference of head and arm as outcomes. Details are presented in the tables (Characteristics of studies awaiting classification).
Ongoing studies
There are four ongoing placebo‐controlled trials listed in Australia (ACTRN12616000797471), Brazil (RBR‐5byrsc), Iran (IRCT2017011732004N1) and Switzerland (NCT01837355). The 12‐month Australian trial in children (aged up to six years) is using 2 ‐ 3x 10¹⁰ CFU/day combination of B lactis, L rhamnosus GG, L paracasei, L plantarum, L rhamnosus HN001, L rhamnosus Lr32, L salivarius, S thermophiles, B breve, L gasseri, B longum, B infantis, L reuteri andL bulgaricus (ACTRN12616000797471). The Brazilian trial in children (aged up to 15 years) is using 6 g of a combination of FOS, L paracasei, L rhamnosus, L acidophilus andB lactis for three months (RBR‐5byrsc). The Iranian study in children (aged five to 12 years) is using 2x 10⁹ CFU/day combination of L casei, L rhamnosus, L bulgaricus, S thermophilus, B longum and FOS for six months (IRCT2017011732004N1). The three‐month Swiss trial is in children and adults (aged six to 20 years) and is using L rhamnosus (NCT01837355). Further details regarding ongoing studies are listed in Characteristics of ongoing studies.
Risk of bias in included studies
We have summarised our risk of bias judgements in the figures (Figure 2; Figure 3).

Risk of bias summary: review authors' judgements about each risk of bias item for each included study.

Risk of bias graph: review authors' judgements about each risk of bias item presented as percentages across all included studies.
Allocation
Sequence generation
We judged four trials to have a low risk of bias, as they used either computer‐generated block randomisation (Bruzzese 2007; de Freitas 2018a; Di Nardo 2014) or Pocock‐Simon covariate‐adaptive randomisation scheme (Bruzzese 2018). The remaining seven trials did not report details of the random sequence generation and have been judged as having an unclear risk of bias (Bruzzese 2014; del Campo 2009; del Campo 2014; Di Benedetto 1998; Fallahi 2013; Jafari 2013; Van Biervliet 2018).
Allocation concealment
We judged two trials to have a low risk of bias as they described an allocation concealment process (Bruzzese 2018; Di Nardo 2014). The remaining nine trials did not report methods to conceal group allocation and were judged as having an unclear risk of bias (Bruzzese 2007; Bruzzese 2014; de Freitas 2018a; del Campo 2009; del Campo 2014; Di Benedetto 1998; Fallahi 2013; Jafari 2013; Van Biervliet 2018).
Blinding
We judged seven trials to have a low risk of performance and detection bias (Bruzzese 2007; Bruzzese 2014; de Freitas 2018a; del Campo 2014; Di Nardo 2014; Fallahi 2013; Van Biervliet 2018).
Of the remaining four trials, in one trial performance bias was judged to be low; however, blinding of outcome assessors was not described (unclear risk) (Bruzzese 2018). In a further trial, published as an abstract only, investigators and outcome assessors were not clearly blinded and this was judged to have a high and unclear risk of performance and detection bias, respectively (Di Benedetto 1998). The protocol for a third trial stated that investigators were not blinded which may have implications regarding the diagnosis of pulmonary exacerbations and judged to be high risk for performance bias (Jafari 2013). In the final trial, again only published to date as an abstract, two different probiotic preparations (a capsule and a sachet) were assessed and no clear blinding processes were described, therefore performance bias was judged to be high risk and detection bias judged to be unclear risk (del Campo 2009).
Incomplete outcome data
We judged seven trials to have a low risk of attrition bias (Bruzzese 2014; Bruzzese 2018; de Freitas 2018a; Di Benedetto 1998; Di Nardo 2014; Fallahi 2013; Jafari 2013).
Of the remaining four trials, we judged one trial published as an abstract only to have an unclear risk of attrition bias as it was unclear how many participants were enrolled and how many completed the trial (del Campo 2009). We judged a second trial to have an unclear risk of attrition bias given a dropout rate of 20% (without clear reasons specified) and a lack of ITT analysis (Van Biervliet 2018). A third trial was judged to have a high risk of attrition bias given four out of 43 participants (9%) were excluded from the analysis and this may skew their primary outcome measures (Bruzzese 2007). Finally, we judged one trial to have a high risk of attrition bias given nine out of 39 participants (23%) did not complete the trial and there was no ITT analysis (del Campo 2014).
Selective reporting
We judged three trials to have a low risk of reporting bias (Bruzzese 2007; Di Benedetto 1998; Fallahi 2013).
We judged two trials to have an unclear risk of reporting bias (del Campo 2009; Di Nardo 2014). One trial (published as an abstract only) did not report the specific results of outcomes (del Campo 2009). Investigators in the second trial did not present the number of days for treatment of pulmonary exacerbations (primary outcome) (Di Nardo 2014).
The remaining six trials were judged to have a high risk of bias (Bruzzese 2014; Bruzzese 2018; de Freitas 2018a; del Campo 2014; Jafari 2013; Van Biervliet 2018). One trial had a high risk of reporting bias since faecal calprotectin levels were analysed within probiotic and placebo groups rather than compared between groups (Bruzzese 2014). In a further trial by the same investigators the protocol included outcome measures not reported in the full‐text article, e.g. intestinal inflammation, abdominal pain and intestinal microbiota (Bruzzese 2018). Similarly, in a third trial, not all outcome measures in the protocol were included in the final trial report; these included serum inflammatory markers (IL‐17A, TGF‐beta, INF‐gamma), faecal calprotectin and measures of intestinal microbiota (de Freitas 2018a). We judged another trial to have a high risk of reporting bias given the article included two Spanish centres although an earlier abstract included three Spanish centres (del Campo 2014). We contacted the trial's primary author and the decision to include only two centres was based on the third centre recruiting only three participants who had considerably different results, attributed to a different nutritional status. We judged a further trial to have a high risk of reporting bias given growth outcomes (weight, height, head circumference and arm circumference) were included in their protocol but not reported in the final paper; furthermore, it was unclear why pulmonary exacerbations results were not reported as a comparison between probiotic and placebo groups during the intervention period, but rather exacerbation rates of probiotic participants before and after the intervention period (Jafari 2013). We judged the final trial to have a high risk of reporting bias given that the methods state a blood sample was taken for analysis of CRP and total IgG, yet the results were not reported (Van Biervliet 2018).
Other potential sources of bias
We judged eight trials to have a low risk of potential bias from other sources (Bruzzese 2007; Bruzzese 2014; Bruzzese 2018; de Freitas 2018a; Di Benedetto 1998; Di Nardo 2014; Fallahi 2013; Van Biervliet 2018). We judged the remaining three trials to have an unclear risk of bias (del Campo 2009; del Campo 2014; Jafari 2013). One trial published as an abstract only did not report funding source(s) or conflicts (del Campo 2009). In a second trial by this author team post‐placebo data were pooled and treated as baseline data (the trial was not powered or designed to assess for carry‐over effects of the probiotic) (del Campo 2014). Finally, in one trial it was not specified if Probiotics International Company, UK (who provided the probiotic) had any influence on the trial (Jafari 2013).
Effects of interventions
The certainty of the evidence has been graded for those outcomes included in the summary of findings table. For the definitions of these gradings, please refer to the summary of findings tables (summary of findings Table for the main comparison).
We present the results of the 10 trials on 412 participants (children and adults) investigating probiotics (including synbiotics) versus placebo (Bruzzese 2007; Bruzzese 2014; Bruzzese 2018; de Freitas 2018a; del Campo 2014; Di Benedetto 1998; Di Nardo 2014; Fallahi 2013; Jafari 2013; Van Biervliet 2018) in the summary of findings tables (summary of findings Table for the main comparison). In the summary of findings tables, the certainty of evidence has been graded for pre‐defined outcomes (see above) and definitions of these gradings provided. The certainty of the evidence for all key parameters was graded as low.
Probiotics versus placebo
Primary outcomes
1. Pulmonary exacerbations
a. number of pulmonary exacerbations
Four trials (225 participants) contributed data to this outcome (Bruzzese 2007; Bruzzese 2018; Di Nardo 2014; Van Biervliet 2018). One cross‐over trial did not utilise a washout period, so only results from the first phase of the trial are included (Bruzzese 2007). Overall, the result for probiotics reducing pulmonary exacerbations came close to statistical significance and was regarded by the review authors as clinically significant, MD ‐0.32 episodes per participant (95% CI ‐0.68 to 0.03), during a four to 12‐month time‐frame (Analysis 1.1) (low‐certainty evidence). In trials of between three and six months duration (n = 148), the result for probiotics reducing pulmonary exacerbations similarly came close to statistical significance, MD ‐0.39 episodes per participant (95% CI ‐0.80 to 0.02) (Bruzzese 2007; Di Nardo 2014; Van Biervliet 2018); the 12‐month trial showed no evidence of an effect, MD 0.10 episodes per participant (95% CI ‐0.75 to 0.95) (Bruzzese 2018). Two trials reported a significant reduction in pulmonary exacerbation rates (Bruzzese 2007; Di Nardo 2014), whilst two trials reported no evidence of an effect (Bruzzese 2018; Van Biervliet 2018). In the Jafari trial, no participants on probiotic supplementation were reported to have a pulmonary exacerbation during the one‐month intervention period, however, the number of pulmonary exacerbations in the placebo group was not reported so we are not able to present this result in our analysis (Jafari 2013). We have attempted, as yet unsuccessfully to obtain further information from the authors.
A priori subgroups
Combining the three trials involving only children (n = 165) also suggested no evidence of an effect, MD ‐0.30 episodes per participant (95% CI ‐0.99 to 0.38) (Bruzzese 2007; Bruzzese 2018; Van Biervliet 2018). We were unable to obtain trial data for one trial and thus were unable to subset adults for comparison (Di Nardo 2014).
Post hoc subgroups
There was moderate heterogeneity in the primary meta‐analysis (I² = 41%) (Analysis 1.1). Combining two trials which used L rhamnosus GG suggested no evidence of an effect (Bruzzese 2007; Bruzzese 2018); however, one trial which used L reuteri reported a significant reduction in pulmonary exacerbation rates, MD ‐0.34 episodes per participant (95% CI ‐0.53 to ‐0.15) (Di Nardo 2014). The Van Biervliet trial used a multistrain combination and reported no evidence of an effect (Van Biervliet 2018).
Combing three trials using a dose of over 108 to 109 CFU/day suggested no evidence of an effect (Bruzzese 2007; Bruzzese 2018; Van Biervliet 2018). The Di Nardo trial using a dose of over 109 to 1010 CFU/day reported a significant reduction in pulmonary exacerbation rates, MD ‐0.34 episodes per participant (95% CI ‐0.53 to ‐0.15) (Di Nardo 2014).
Only one cross‐over RCT used a washout period of four weeks and reported no evidence of an effect (Van Biervliet 2018).
Sensitivity analysis
Removing one trial which was judged to have a high risk of attrition bias (for not including four clinically unstable participants at the end of their probiotic or placebo period) (Bruzzese 2007) suggests that probiotics significantly reduce pulmonary exacerbation rates, MD ‐0.30 episodes per participant (95% CI ‐0.47 to ‐0.12; P = 0.0009).
b. duration of antibiotic therapy (any route)
Two trials (127 participants) contributed data to this outcome (Bruzzese 2018; Van Biervliet 2018). Overall probiotics showed no evidence of an effect, MD ‐0.45 days of antibiotic therapy (95% CI ‐9.04 to 8.14), during a four‐ to 12‐month time‐frame; this was also true at the individual time points (Analysis 1.2). We were not able to obtain further information from the authors of three trials (Bruzzese 2007; Di Nardo 2014; Jafari 2013). In the Jafari trial, no participants on probiotic supplementation (one‐month intervention period) required intravenous or oral antibiotics for a pulmonary exacerbation, however, data for the placebo cohort were not reported, therefore results could not be included (Jafari 2013).
A priori subgroups
Both trials included only children (Bruzzese 2018; Van Biervliet 2018).
2. Inflammatory biomarkers
a. intestinal
i. calprotectin
Four trials (177 participants) contributed data (Bruzzese 2014; Di Nardo 2014; Fallahi 2013; Van Biervliet 2018). Results from one trial could not be included given the cross‐over design without a washout period and we were unsuccessful in obtaining results for the first phase only (del Campo 2014). The Bruzzese trial reported baseline and final means (SD), but did not report mean change from baseline SDs, which would have been optimal given the baseline differences in the probiotic and placebo groups, 164 (70) and 251 (174), respectively (Bruzzese 2014). The Fallahi trial reported post treatment mean faecal calprotectin without SDs or CIs (Fallahi 2013). We were unsuccessful in obtaining the SDs for these results from the trial investigators. The SDs for the mean change from baseline in the Bruzzese trial were imputed using a correlation coefficient calculated from another trial reporting this outcome (Van Biervliet 2018) and according to the Cochrane Handbook of Systematic Reviews of Interventions (Higgins 2011c). The SD for the Fallahi trial was estimated using the RevMan Calculator as only the means and P value were available ('Finding standard deviations by using numbers calculated from between groups' (Higgins 2011c)). For the main analysis, results for the mean change from baseline from three trials (Bruzzese 2014; Di Nardo 2014; Van Biervliet 2018) were combined with the post treatment results from the fourth trial (Fallahi 2013). Overall, probiotics significantly reduce faecal calprotectin, MD ‐47.41 µg/g (95% CI ‐93.28 to ‐1.54) (Analysis 1.3) (low‐certainty evidence). Combined data from two trials at one month show probiotics significantly reduced faecal calprotectin, MD ‐105.02 µg/g (95% CI ‐205.23 to ‐4.81) (Bruzzese 2014; Fallahi 2013); however, in trials of over three and up to six months duration probiotics showed no evidence of an effect, MD ‐32.14 µg/g (95% CI ‐83.73 to ‐19.45) (Di Nardo 2014; Van Biervliet 2018).
A priori subgroups
Combining the three trials involving only children (n = 119) suggested probiotics significantly reduced faecal calprotectin across all time periods, MD ‐94.6 µg/g (95% CI ‐173.58 to ‐15.61) (Bruzzese 2014; Fallahi 2013; Van Biervliet 2018). We were unable to obtain trial data for two trials, thus we were unable to subset adults for comparison (del Campo 2014; Di Nardo 2014).
Sensitivity analysis
A sensitivity analysis of only the mean change from baseline results suggested no evidence of an effect on calprotectin (Bruzzese 2014; Di Nardo 2014; Van Biervliet 2018); this was true both when the Bruzzese trial was included, MD ‐31.17 (95% CI ‐81.56 to 19.22) (Bruzzese 2014; Analysis 1.4) and when it was excluded from this analysis (given SDs were imputed), MD ‐32.14 (95% CI ‐83.73 to 19.45). A sensitivity analysis of only post‐treatment means suggested no evidence of an effect on calprotectin (Bruzzese 2014; Fallahi 2013; Van Biervliet 2018); this was true both when the Bruzzese trial was included, MD ‐45.46 (95% CI ‐176.25 to 85.32) (Bruzzese 2014; Analysis 1.5) and when it was excluded from this analysis (given significant baseline differences), MD ‐20.08 (95% CI ‐218.73 to 178.57). The conclusions regarding calprotectin change with both sensitivity analyses, as the statistically significant reduction in faecal calprotectin identified in the main analysis (Analysis 1.3), differs from the two sensitivity analyses which show no statistically significant difference (Analysis 1.4; Analysis 1.5).
ii. M2 PK
No trial reported this outcome measure.
iii. rNO
No trial reported this outcome measure.
b. serum
i. C‐reactive protein
No trial reported this outcome measure.
ii. cytokines
Two trials (89 participants) contributed data, one trial lasted three months in duration (de Freitas 2018a), whilst the second trial was of six months duration (Di Nardo 2014). The Di Nardo trial reported data for the mean change from baseline (Di Nardo 2014), whilst the de Freitas trial reported post‐treatment data (de Freitas 2018a); the results for TNF‐α and serum IL‐8 were combined for the main analysis. Overall, serum TNF‐α was not significantly different between groups taking either a probiotic or a placebo, MD 0.20 pg/mL (95% CI ‐0.72 to 1.13) (Analysis 1.6). Overall, serum IL‐8 was also not significantly different between probiotic or placebo groups, MD 26.93 pg/mL (95% CI ‐46.25 to 100.11) (Analysis 1.6). Only one trial measured post treatment serum IL‐1β, IL‐6, IL‐10 and nitric oxide metabolites (NOx) and reported no evidence of an effect (de Freitas 2018a); MD 0.30 pg/mL (95% CI ‐0.28 to 0.88), MD ‐0.29 pg/mL (95% CI ‐0.68 to 0.10), MD ‐0.05 pg/mL (95% CI ‐0.43 to 0.33) and MD 0.08 pg/mL (95% CI ‐0.26 to 0.42), respectively (Analysis 1.6). The same trial measured post‐treatment serum IL‐12 and myeloperoxidase (MPO) (de Freitas 2018a) and reported a significant difference in IL‐12 between groups in favour of placebo (when analysed using a repeated‐measures generalised linear model adjusted for age, sex and energy intake), MD 0.53 pg/mL (95% CI 0.10 to 0.96), but no difference between groups in MPO, MD 0.05 pg/mL (95% CI ‐0.14 to 0.24) (Analysis 1.6).
A priori subgroups
The de Freitas trial included only children, whilst the Di Nardo trial included both children and adults (de Freitas 2018a; Di Nardo 2014). We were unable to obtain trial data for the mixed population trial (Di Nardo 2014), thus we were unable to subset adults for comparison.
Post hoc subgroups
There was moderate heterogeneity in the meta‐analysis of serum TNF‐α (I² = 53%) and substantial heterogeneity in the meta‐analysis of serum IL‐8 (I² = 69%). The Di Nardo trial used L reuteri whilst the de Freitas trial used a multistrain synbiotic; neither trial reported a significant difference in serum TNF‐α nor IL‐8 (de Freitas 2018a; Di Nardo 2014). The Di Nardo trial used a dose of 109 CFU/day, whilst the de Freitas trial a dose of 1010 CFU/day (de Freitas 2018a; Di Nardo 2014). Both trials were parallel RCTs (de Freitas 2018a; Di Nardo 2014).
Sensitivity analysis
A sensitivity analysis of only mean change from baseline results for TNF‐α suggested no evidence of an effect, MD 0.78 pg/mL (95% CI ‐0.31 to 1.87) (Di Nardo 2014). A sensitivity analysis of only post‐treatment results for TNF‐α suggested no evidence of an effect, MD ‐0.18 pg/mL (95% CI ‐0.87 to 0.51) (de Freitas 2018a). A sensitivity analysis of only mean change from baseline results for serum IL‐8 suggested no evidence of an effect, MD 78.60 pg/mL (95% CI ‐7.76 to 164.96) (Di Nardo 2014). A sensitivity analysis of only post‐treatment results for serum IL‐8 suggested no evidence of an effect, MD ‐0.05 pg/mL (95% CI ‐0.33 to 0.23) (de Freitas 2018a).
c. sputum
i. C‐reactive protein
No trial reported this outcome measure.
ii. cytokines
One trial reported this outcome measure for sputum TNF‐α (48 participants) and IL‐8 (54 participants) (Di Nardo 2014). Sputum TNF‐α was not significantly different between groups on either a probiotic or a placebo, MD ‐0.20 pg/ml (95% CI ‐0.94 to 0.54) (Analysis 1.7). Sputum IL‐8 was also not significantly different between groups, MD ‐0.20 pg/ml (95% CI ‐0.92 to 0.52) (Analysis 1.7).
3. Adverse events
a. mortality (all causes)
Only four completed trials and one terminated trial (298 participants) reported adverse events as a priori hypotheses and contributed data (Bruzzese 2007; del Campo 2014; Di Nardo 2014; NCT01201434; Van Biervliet 2018). No mortalities were reported in any trial (Analysis 1.8).
b. serious adverse reactions
One trial was terminated due to a severe allergic reaction (severe urticaria) for one participant in the probiotic group (total of 12 participants enrolled) (NCT01201434). None of the remaining four trials reported a serious adverse reaction (Bruzzese 2007; del Campo 2014; Di Nardo 2014; Van Biervliet 2018). The estimated NNTH (serious adverse reaction) is 155 people (Analysis 1.8).
c. adverse reaction defined as any untoward medical occurrence with reasonable causal relationships
Two trials reported a single adverse event each, vomiting in one child on probiotics (Bruzzese 2007) and diarrhoea in one child on probiotics (Van Biervliet 2018), RR 3.00 (95% CI 0.32 to 28.18) (Analysis 1.8) (low‐certainty evidence). No adverse reactions were reported for participants on placebo. For people consuming probiotics, the estimated NNTH (adverse reaction) is 73 people.
For people consuming probiotics, the overall NNTH for any adverse reaction (serious or not) is 52 people.
Secondary outcomes
1. Growth and nutrition
a. height
Two trials (91 participants) contributed data (de Freitas 2018a; Van Biervliet 2018). Results from one trial could not be included given the cross‐over design of the trial and the absence of a washout period; we were unsuccessful in obtaining results for the first phase only from the investigators (del Campo 2014). Both included trials reported post‐treatment values and there were no significant baseline differences between the probiotic and placebo groups in either trial (de Freitas 2018a; Van Biervliet 2018). Overall, probiotics showed no evidence of an effect in height z score, MD 0.10 z score (95% CI ‐0.27 to 0.47), during a three‐ to four‐month time frame (Analysis 1.9). Neither the three‐month results or the four‐months results were significant, MD 0.21 z score (95% CI ‐0.62 to 1.04) and MD 0.07 z score (95% CI ‐0.34 to 0.48), respectively (de Freitas 2018a; Van Biervliet 2018).
A priori subgroups
Both trials included only children (de Freitas 2018a; Van Biervliet 2018).
b. weight
Three trials (129 participants) contributed data (Bruzzese 2007; de Freitas 2018a; Van Biervliet 2018). Results from only the first phase of one trial were included given this employed a cross‐over design without a washout period (Bruzzese 2007). Results from two further trials could not be included given their cross‐over design, absence of a washout period and we were unsuccessful in obtaining results for the first phase of the trial (del Campo 2014; Di Benedetto 1998). In the de Freitas trial, there was a significant difference in the mean (SD) baseline weight z scores for participants receiving probiotics and placebo, ‐0.67 (1.09) versus ‐1.89 (0.92), respectively (P = 0.003) (de Freitas 2018a). Therefore, the mean change from baseline (z score) was calculated and the SDs were imputed using a correlation coefficient calculated from another trial (Van Biervliet 2018) according to the Cochrane Handbook of Systematic Reviews of Interventions (Higgins 2011c). An overall analysis is problematic since two trials reported post‐treatment z scores (de Freitas 2018a; Van Biervliet 2018) and one trial reported kg (Bruzzese 2007). In the two trials reporting z scores (de Freitas 2018a; Van Biervliet 2018), there was no evidence of an overall effect on mean change from baseline, MD ‐0.24 z score (95% CI ‐0.52 to 0.05) (Analysis 1.10); although one trial (imputed values) did favour placebo at up to three months, MD ‐0.40 (95% CI ‐0.70 to ‐0.10) (de Freitas 2018a) and the second at three to six months showed no effect, MD ‐0.11 (95% CI ‐0.30 to 0.08) (Van Biervliet 2018). There was no evidence of an effect on weight in the trial reporting mean change in kg from baseline at between three and six months (Bruzzese 2007), MD 1.20 kg (95% CI ‐0.04 to 2.44) (Analysis 1.11). In the three‐month trial, change in weight z scores were significantly worse in the probiotic cohort, MD ‐0.40 (95% CI ‐0.70 to ‐0.10) (de Freitas 2018a). Neither trial lasting between three and six months showed any evidence of an effect (Bruzzese 2007; Van Biervliet 2018).
A priori subgroups
All three trials included only children (Bruzzese 2007; de Freitas 2018a; Van Biervliet 2018).
Sensitivity analysis
A sensitivity analysis where we excluded the de Freitas trial (given the SDs were imputed) suggested no evidence of an effect of probiotics on weight, MD ‐0.11 z score (95% CI ‐0.33 to 0.11) (Van Biervliet 2018). A sensitivity analysis excluding Bruzzese, given the high risk of attrition bias (four clinically unstable participants were not included at the end of their probiotic or placebo period) (Bruzzese 2007), left only the two trials reporting z scores (de Freitas 2018a; Van Biervliet 2018).
c. BMI
Two trials (91 participants) contributed data (de Freitas 2018a; Van Biervliet 2018). Results from the first phase of one cross‐over trial were not reported and we were unsuccessful in obtaining these results (Bruzzese 2007). Results from a further cross‐over trial were also not included given the lack of a washout period and our unsuccessful attempt to obtain results for the first phase only (del Campo 2014). One 12‐month trial reported median (min, max) BMI, so the mean (SD) could not be calculated and included in the analysis (Bruzzese 2018). In one trial, there were significant differences in the baseline BMI z scores for the probiotic and placebo groups (‐0.58 (1.22) versus ‐1.21 (1.12), respectively, P < 0.001) (de Freitas 2018a); therefore, the mean change from baseline (z score) was calculated and the SDs were imputed using a correlation coefficient calculated from a further trial (Van Biervliet 2018) according to the Cochrane Handbook of Systematic Reviews of Interventions (Higgins 2011c).
Overall, there was no evidence of an effect of probiotics on change in BMI z score, MD ‐0.02 z score (95% CI ‐0.25 to 0.22) (Analysis 1.12). This was also true for the individual time points of up to three months, MD ‐0.11 (95% CI ‐0.54 to 0.32) (de Freitas 2018a) or at four months, MD 0.02 (95% CI ‐0.26 to 0.31) (Van Biervliet 2018).
A priori subgroups
Both trials included only children (de Freitas 2018a; Van Biervliet 2018).
Sensitivity analysis
A sensitivity analysis excluding the de Freitas trial (given the SDs were imputed) suggested no evidence of an effect of probiotics on BMI, MD 0.02 (95% CI ‐0.26 to 0.31) (Van Biervliet 2018).
2. Lung function
a. FEV1 (% predicted)
Five trials (284 participants) contributed data (Bruzzese 2007; Bruzzese 2018; de Freitas 2018a; Di Nardo 2014; Van Biervliet 2018). Results from one cross‐over trial could not be included given its cross‐over design, lack of a washout period and our unsuccessful attempt to obtain results for the first phase only (del Campo 2014). Results from two trials were estimated via measurement of published figures as we were unsuccessful in obtaining data from the authors (Bruzzese 2007; Bruzzese 2018). The SDs for the mean change from baseline in the de Freitas trial were imputed using a correlation coefficient calculated from the Van Biervliet trial according to the Cochrane Handbook of Systematic Reviews of Interventions (Bruzzese 2007; Higgins 2011c; Van Biervliet 2018). For the main analysis, results reporting the mean change from baseline from four trials (Bruzzese 2007; de Freitas 2018a; Di Nardo 2014; Van Biervliet 2018) were combined with the post‐treatment results from a fifth trial (Bruzzese 2018). Overall after 12 months, probiotics showed no evidence of an effect on FEV1 % predicted, MD 1.36% (95% CI ‐1.20 to 3.91) (Analysis 1.13) (low‐certainty evidence). At the individual time points there were no differences found between probiotic and control groups; one trial (n = 41) reported at up to three months, MD ‐8.07% (95% CI ‐19.87 to 3.73) (de Freitas 2018a); three trials (n = 166) reported at between three and six months, MD 2.22% (95% CI ‐0.51 to 4.94) (Bruzzese 2007; Di Nardo 2014; Van Biervliet 2018); and one trial (n = 77) reported at 12 months, MD ‐2.80% (95% CI ‐12.13 to 6.53) (Bruzzese 2018).
A priori subgroups
Combining four trials involving only children (n = 226) suggested no evidence of an effect, MD 0.85% (95% CI ‐2.87 to 4.56) (Bruzzese 2007; Bruzzese 2018; de Freitas 2018a; Van Biervliet 2018). We were unable to obtain trial data for the fifth trial (Di Nardo 2014), thus we were unable to subset adults for comparison.
Sensitivity analysis
Removing trials for which results were estimated from figures (Bruzzese 2007; Bruzzese 2018) also suggested no evidence of an effect on FEV1 % predicted, MD 0.65% (95% CI ‐4.65 to 5.95). A sensitivity analysis of trials presenting results for the mean change from baseline (Bruzzese 2007; Di Nardo 2014; Van Biervliet 2018) (i.e. excluding one trial where the SDs were imputed (de Freitas 2018a) and a further trial where only post‐treatment results were available (Bruzzese 2018)), also suggested no evidence of an effect on FEV1 % predicted, MD 2.22% (95% CI ‐0.51 to 4.94) (Analysis 1.14). A sensitivity analysis of three trials with post‐treatment results available (Bruzzese 2018; de Freitas 2018a; Van Biervliet 2018), also suggested no evidence of an effect on FEV1 % predicted, MD ‐1.31% (95% CI ‐7.10 to 4.48) (Analysis 1.15).
b. FEV (L)
No trial reported this outcome measure.
c. LCI
No trial reported this outcome measure.
2. Hospitalisations
a. number
Two trials (115 participants) contributed data (Bruzzese 2007; Bruzzese 2018). Results from only the first phase of one trial were included since this trial employed a cross‐over design but without a washout period (Bruzzese 2007). Overall after 12 months, probiotics show no evidence of an effect on hospitalisations, MD ‐0.44 admissions per participant (95% CI ‐1.41 to 0.54) (Analysis 1.16) (low‐certainty evidence). The six‐month trial (n = 38) reported a significantly lower number of admissions for people on probiotics, MD ‐1.00 admissions per participant (95% CI ‐1.74 to ‐0.26) (Bruzzese 2007). However, the 12‐month trial reported no evidence of an effect, MD 0.00 admissions per participant (95% CI ‐0.25, 0.25) (Bruzzese 2018).
It was stated in one trial that none of the 20 participants on a probiotic supplement required a hospital admission during their one‐month intervention period; however, the rate of hospitalisation for those on placebo was not reported and we were unsuccessful in obtaining data from the authors, so are not able to included this trial in our analysis (Jafari 2013).
A priori subgroups
Both trials included only children (Bruzzese 2007; Bruzzese 2018).
Post hoc subgroups
There was substantial heterogeneity in the primary meta‐analysis (I² = 84%) (Analysis 1.16). Both studies used the same probiotic and dose, L rhamnosus GG at a dose of 109 CFU/day (Bruzzese 2007; Bruzzese 2018). However, the trials differed in design; one trial was of a cross‐over design without a washout period (although we did only use data from the first phase in the analysis) and reported a significant reduction in the number of hospital admissions (Bruzzese 2007), whilst the second trial was a parallel RCT (Bruzzese 2018).
b. duration
No trial reported analysable data for this outcome measure. The six‐month trial reported no evidence of a difference in the duration of hospitalisation for participants on probiotics, however the data were not reported (Bruzzese 2007).
3. HRQoL
One trial (37 participants) contributed data for this outcome (Jafari 2013). In the Jafari trial, the PedsQL Parent Report suggested an improved quality of life at three months after the one‐month intervention period for those on a probiotic, SMD 0.87 (95% CI 0.19 to 1.55) (Analysis 1.17) (low‐certainty evidence). The PedsQL Child Self Report for the trial reported no evidence of an effect, MD 0.59 (95% CI ‐0.07 to 1.26) (Analysis 1.17) (low‐certainty evidence). Results from one cross‐over trial could not be included due to the lack of a washout period and we were unsuccessful in obtaining results for the first phase only (del Campo 2014).
4. Gastrointestinal symptoms
No trial reported analysable data for this outcome. Results from one trial could not be included due to the cross‐over design, the lack of a washout period and our unsuccessful attempt to obtain results for the first phase only (del Campo 2014).
5. Intestinal microbial profile
a. alpha diversity
No trial reported analysable data for this outcome. Two trials reported on the intestinal microbial profile, however, did not report alpha diversity and we were unsuccessful in obtaining data for this outcome from the trial investigators (Bruzzese 2014; Van Biervliet 2018). Results from one trial could not be included due to the cross‐over design, the lack of a washout period and our unsuccessful attempt to obtain results for the first phase only (del Campo 2014).
b. beta diversity
No trial reported analysable data for this outcome. As stated above, two trials reported on the intestinal microbial profile, however, we were not able to obtain relevant data for this outcome (Bruzzese 2014; Van Biervliet 2018); and we were also not able to obtain relevant data from the cross‐over trial (del Campo 2014).
Probiotics compared
One trial involving 40 participants investigated probiotics versus probiotics and was available only as an abstract (del Campo 2009). This six‐month trial reported no difference in GIQLI and SF‐12 (change from baseline scores) between the two probiotic groups. No data were presented in this abstract so we have not explored this comparison further.
Discussion
Summary of main results
The primary objective of this review was to determine if the administration of probiotics was safe and improved health outcomes in children and adults with CF. A total of 11 trials and one trial protocol (terminated trial) with 464 participants met the inclusion criteria for this review; nine trials compared a probiotic to placebo (Bruzzese 2007; Bruzzese 2014; Bruzzese 2018; del Campo 2014; Di Benedetto 1998; Di Nardo 2014; Jafari 2013; NCT01201434; Van Biervliet 2018), two compared a synbiotic (probiotic plus prebiotic) to placebo (de Freitas 2018a; Fallahi 2013) and one trial compared two probiotic formulations (del Campo 2009).
Probiotic versus placebo
At this point in time, probiotics may be beneficial to the health of children and adults with CF, however, they are associated with a small number of adverse events (summary of findings Table for the main comparison).
There was low‐certainty evidence with a difference approaching statistical significance (and considered by the authors to be clinically significant) between probiotics and placebo in terms of a reduction in the number of pulmonary exacerbations after 12 months, MD ‐0.32 episodes per participant (95% CI ‐0.68 to 0.03) (P = 0.07) (Analysis 1.1). The largest, least‐biased trials reported no difference and a significant reduction in pulmonary exacerbations (Bruzzese 2018; Di Nardo 2014). There was no evidence of effect of probiotics on the duration of antibiotic therapy for pulmonary exacerbations (Analysis 1.2). Probiotics significantly reduced faecal calprotectin after six months, MD ‐47.41 µg/g, 95% CI ‐93.28 to ‐1.54) (P = 0.04) (Analysis 1.3) (low‐certainty evidence); although, both sensitivity analyses suggested no evidence of an effect (Analysis 1.4; Analysis 1.5), and the largest, least‐biased trial reported no significant difference (Di Nardo 2014). Additionally, the clinical implications of a reduction in faecal calprotectin are not fully understood. Our analysis showed no difference between probiotics or placebo in serum cytokines (Analysis 1.6) or sputum cytokines (Analysis 1.7). No trial reported any deaths. One trial was abandoned after one participant experienced a severe allergic reaction (severe urticaria) whilst on probiotic supplementation (NCT01201434). Only four trials reported adverse events (Bruzzese 2007; del Campo 2014; Di Nardo 2014; Van Biervliet 2018), which included vomiting (one child) and diarrhoea (one child), with an estimated number need to harm (NNTH) of 73 people (Analysis 1.8) (low‐certainty evidence). For people consuming probiotics, the overall NNTH for any adverse reaction (serious or not) is 52 people.
With regards to the review's secondary outcomes, our analysis found no difference in parameters of growth and nutrition, including height (Analysis 1.9), weight (Analysis 1.10; Analysis 1.11; summary of findings Table for the main comparison) or BMI (Analysis 1.12) (low‐certainty evidence). Currently there is low‐certainty evidence from data up to one year that probiotics result in no difference in FEV1 % predicted (Analysis 1.13). No other measures of lung function were reported in the included trials. Data on hospitalisation rates (all causes) showed no evidence of an effect of probiotics compared to placebo over a 12‐month period (Analysis 1.16). Only one small trial contributed data on HRQoL and demonstrated an improvement in the parent report but no difference in the child's report (Analysis 1.17) (low‐certainty evidence). No trial reported analysable data on gastrointestinal symptoms or intestinal microbial profile.
Probiotics compared
One six‐month trial compared probiotics versus probiotics and was available only as an abstract (del Campo 2009). This trial reported no difference in gastrointestinal symptoms (GIQLI) or HRQoL (SF‐12) change from baseline scores between the two probiotic groups, but no data were available for analysis.
Overall completeness and applicability of evidence
The findings of this review should be interpreted with caution, as inferences for any and all probiotics in children and adults with CF are problematic. The heterogeneity in probiotic formulation, dose and duration of therapy limit the implications of this review for clinical practice. Several different probiotic formulations were used amongst the various studies, ranging from single strain L rhamnosus GG (Bruzzese 2007; Bruzzese 2014; Bruzzese 2018; Di Benedetto 1998) or L reuteri (del Campo 2009; del Campo 2014; Di Nardo 2014) to multistrain formulations with prebiotic FOS (de Freitas 2018a; Fallahi 2013) or without (del Campo 2009; Jafari 2013; Van Biervliet 2018). The dosing of probiotic formulations ranged from 108 CFU/day (del Campo 2009; del Campo 2014) to 1011 CFU/day (del Campo 2009). Furthermore, the duration of intervention ranged from one month (Bruzzese 2014; Fallahi 2013; Jafari 2013) to 12 months (Bruzzese 2018). The terminated trial compared a multistrain probiotic without FOS (2.5×10¹⁰ CFU/day) to placebo for six months (NCT01201434).
There are currently no trials (or data available) including only adults; eight of the included trials included only children (Bruzzese 2007; Bruzzese 2014; Bruzzese 2018; de Freitas 2018a; Di Benedetto 1998; Fallahi 2013; Jafari 2013; Van Biervliet 2018) and the remaining four trials randomised both children and adults (del Campo 2009; del Campo 2014; Di Nardo 2014; NCT01201434).
Despite our best and repeated efforts, we were unable to obtain the unpublished data for several trials which would have strengthened the applicability of this review (Bruzzese 2007; Bruzzese 2014; Bruzzese 2018; del Campo 2009; del Campo 2014; Di Benedetto 1998; Di Nardo 2014; Fallahi 2013; Jafari 2013). The authors would like to thank two author teams for providing additional and unpublished information to improve the quality of this review (del Campo 2014; NCT01201434; Van Biervliet 2018). The authors of the del Campo trial provided additional information about the trial, but no additional results (del Campo 2014). Consideration should be given to the contribution of the Italian group from the University Federico II, Naples, who have published four of the included trials involving 165 participants (37% total participants) (Bruzzese 2007; Bruzzese 2014; Bruzzese 2018; Di Benedetto 1998). Furthermore, the data for the outcome of pulmonary exacerbations were largely contributed by a single trial (weight 50.7%) (Di Nardo 2014).
Quality of the evidence
Using the GRADE criteria, the certainty of the evidence for outcomes of interest was judged to be low for all outcomes assessed (summary of findings Table for the main comparison).
The certainty of the evidence for pulmonary exacerbations was downgraded due to: (i) a high risk of bias due to selective reporting; (ii) a high risk of bias due to incomplete outcome data; and (iii) a lack of generalisability as the majority of trials only included children. Specifically, there were conflicting results between two trials which reported a significant reduction (Bruzzese 2007; Di Nardo 2014) and two trials which reported no evidence of an effect (Bruzzese 2018; Van Biervliet 2018). We downgraded the certainty of evidence for faecal calprotectin due to: (i) a high risk of bias due to selective reporting; and (ii) a lack of generalisability as the majority of studies only included children. Additionally, we estimated the SDs for one trial using the RevMan calculator (Fallahi 2013), we imputed the SDs for a further trial (Bruzzese 2014) and sample sizes were generally small (ranging from 14 to 58 participants). We downgraded the certainty of the evidence for adverse reactions due to: (i) a high risk of bias due to selective reporting; (ii) a high risk of bias due to incomplete outcome data; and (iii) a lack of generalisability as the majority of studies only included children. Specifically, only four trials reported this outcome as an a priori hypothesis. For the outcome of weight, the certainty of the evidence was downgraded due to: (i) a high risk of bias due to selective reporting; (ii) a high risk of bias due to incomplete outcome data; and (iii) a lack of generalisability as the majority of studies only included children. Specifically, there was plausible confounding for one trial which was judged to have a high risk of attrition bias for not including four clinically unstable participants at the end of their probiotic or placebo period (Bruzzese 2007). Additionally, we imputed the SDs for one trial (de Freitas 2018a).
The certainty of the evidence for FEV1 % predicted was downgraded due to: (i) a high risk of bias due to selective reporting; (ii) a high risk of bias due to incomplete outcome data; and (iii) a lack of generalisability as the majority of studies only included children. Specifically, given that results from two trials were estimated via measurement of published figures as we were unsuccessful in obtaining data from the authors (Bruzzese 2007; Bruzzese 2018). Additionally, we imputed the SDs for one trial (de Freitas 2018a). We downgraded the certainty of the evidence for hospitalisations due to: (i) a high risk of bias due to selective reporting; (ii) a high risk of bias due to incomplete outcome data; and (iii) a lack of generalisability as the majority of studies only included children. Specifically, there were conflicting results between two trials for hospitalisations; one trial reported a significant reduction in hospitalisations (Bruzzese 2007), whilst a second reported no evidence of an effect (Bruzzese 2018). Finally, the certainty of the evidence for HRQoL was downgraded due to: (i) a high risk of bias due to selective reporting; (ii) a high risk of bias due to incomplete outcome data; and (iii) a high risk of bias due to blinding. Additionally, it was only reported by one trial where the PedsQL was performed three months post the one‐month intervention period (Jafari 2013).
Results from only the first phase of cross‐over trials without a 'washout' period were included given the potential residual treatment effects (Bruzzese 2007; del Campo 2014; Di Benedetto 1998). Unfortunately we were unable to obtain the unpublished data for these trials which would allow for a more accurate meta‐analysis of all trial data and the ability to perform sensitivity analyses for washout periods. Only one cross‐over RCT included a washout period which lasted one month (Van Biervliet 2018).
The overall risk of bias across the included trials was judged to be moderate (Figure 2; Figure 3). Two trials were judged to have low or unclear risk of bias for all domains (Di Nardo 2014; Fallahi 2013). All trials were judged to have a low or unclear risk of bias for both generation of sequence and concealment of allocation. Blinding of participants and personnel (performance bias) was judged to be of low risk in eight trials but high risk in three trials: one trial investigated two probiotic preparations (without a placebo) and reported no clear blinding process (del Campo 2009); and two trials reported that investigators were not blinded (Di Benedetto 1998; Jafari 2013). Incomplete outcome data (attrition bias) was judged to be of low risk in seven trials an unclear in a further two trials. However, the judgement was high risk in two trials: in one trial investigators removed four clinically unstable participants from the analysis (Bruzzese 2007) and in a second trial 23% of participants did not complete the trial (del Campo 2014). Selective reporting (reporting bias) was judged to be of low risk in three trials and unclear in a further two trials; however, it was judged to be high risk in six trials (Bruzzese 2014; Bruzzese 2018; de Freitas 2018a; del Campo 2014; Jafari 2013; Van Biervliet 2018). The earlier of the two Bruzzese trials compared changes in faecal calprotectin within groups rather than between groups (Bruzzese 2014) and two further trials stated in their protocols that faecal calprotectin and intestinal microbiota would be reported, however, these results were not published (Bruzzese 2018; de Freitas 2018a). One trial reported on two Spanish centres, even though a preceding abstract included a third Spanish centre which was later not included because only three participants were recruited and their results were considerably different (attributed to a different nutritional status) (del Campo 2014). The protocol for one trial included growth outcomes (weight, height, head circumference and arm circumference) which were not published; this trial also compared pulmonary exacerbations in the probiotic group with the number of exacerbations they experienced in the previous year, rather than comparing with the placebo group (Jafari 2013). Finally one trial stated in their methods section that serum CRP and IgG would be recorded, however these outcomes were not reported in the results section (Van Biervliet 2018). Four trials received funding or sponsorship by grant(s) only (Bruzzese 2007; Bruzzese 2014; Fallahi 2013; Jafari 2013); two trials were solely funded by industry (Di Nardo 2014; Van Biervliet 2018); and two trials by both grant(s) and industry (Bruzzese 2018; Van Biervliet 2018). The risk of bias for the terminated trial was not assessed as only the protocol was available and the only available data were the number of enrolled participants and the serious adverse event (NCT01201434).
Potential biases in the review process
The authors performed a thorough search for this review so there is unlikely to be any bias due to non‐identification of relevant trials. Additionally, two authors independently assessed trial eligibility and performed the data extraction. This review has assessed all available published trial data. Trial investigators were contacted for relevant unpublished information and individual participant data. The quality of this review and meta‐analysis would have been greatly improved if unpublished trial data were provided by investigators. There were an insufficient number of trials for any single outcome to generate a funnel plot and evaluate publication bias.
Agreements and disagreements with other studies or reviews
We are aware of five non‐Cochrane systematic reviews (Anathan 2016; Anderson 2017; Neri 2019; Nikniaz 2017; Van Biervliet 2017). This Cochrane Review differed from these other reviews by only including RCTs. We only included cross‐over RCTs with a washout period (or the first phase of those cross‐over RCTs without a washout period). Furthermore, we evaluated both children and adults and this was the only review to perform a meta‐analysis on probiotics in children and adults with CF.

Study flow diagram.
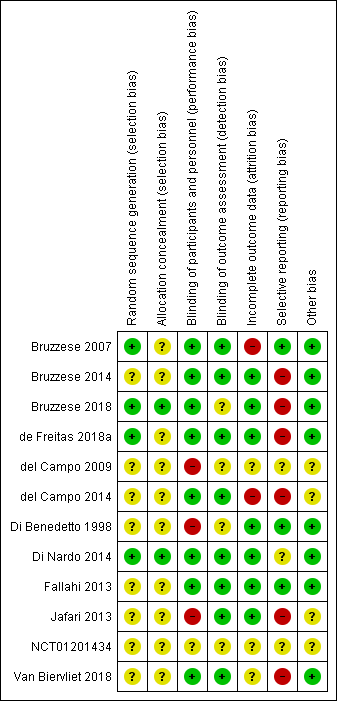
Risk of bias summary: review authors' judgements about each risk of bias item for each included study.

Risk of bias graph: review authors' judgements about each risk of bias item presented as percentages across all included studies.

Comparison 1 Probiotic versus placebo, Outcome 1 Pulmonary exacerbation (mean number per participant).

Comparison 1 Probiotic versus placebo, Outcome 2 Pulmonary exacerbation (duration of antibiotic therapy ‐ any route).
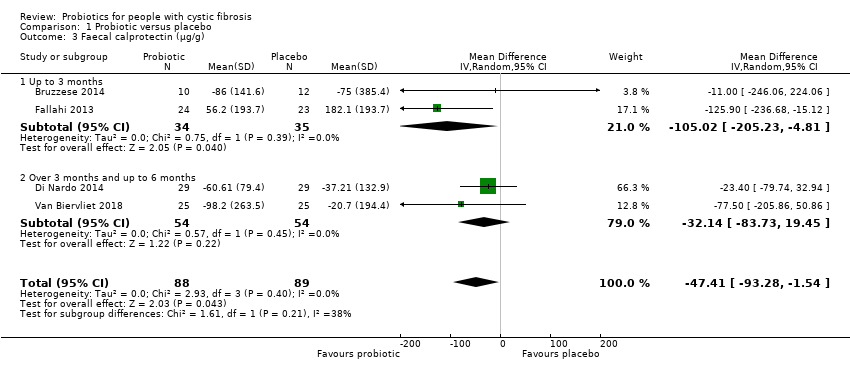
Comparison 1 Probiotic versus placebo, Outcome 3 Faecal calprotectin (µg/g).

Comparison 1 Probiotic versus placebo, Outcome 4 Faecal calprotectin (µg/g) ‐ change from baseline ‐ sensitivity analysis.

Comparison 1 Probiotic versus placebo, Outcome 5 Faecal calprotectin (µg/g) ‐ post treatment ‐ sensitivity analysis.

Comparison 1 Probiotic versus placebo, Outcome 6 Serum cytokines.

Comparison 1 Probiotic versus placebo, Outcome 7 Sputum cytokines ‐ change from baseline.

Comparison 1 Probiotic versus placebo, Outcome 8 Adverse events.

Comparison 1 Probiotic versus placebo, Outcome 9 Height (z score) ‐ post treatment.
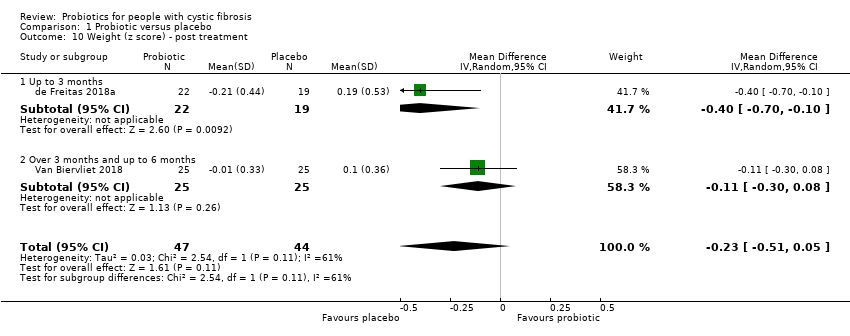
Comparison 1 Probiotic versus placebo, Outcome 10 Weight (z score) ‐ post treatment.
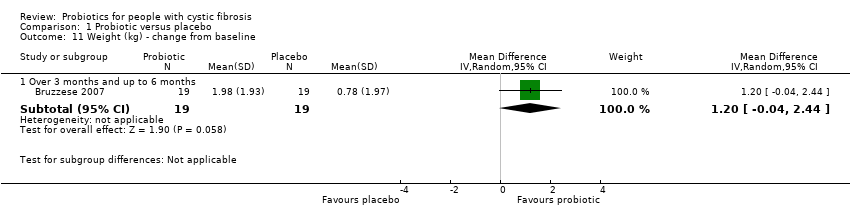
Comparison 1 Probiotic versus placebo, Outcome 11 Weight (kg) ‐ change from baseline.

Comparison 1 Probiotic versus placebo, Outcome 12 BMI (z score).

Comparison 1 Probiotic versus placebo, Outcome 13 Lung function (FEV1 % predicted).

Comparison 1 Probiotic versus placebo, Outcome 14 Lung function (FEV1 % predicted) ‐ change from baseline ‐ sensitivity analysis.

Comparison 1 Probiotic versus placebo, Outcome 15 Lung function (FEV1 % predicted) ‐ post treatment ‐ sensitivity analysis.

Comparison 1 Probiotic versus placebo, Outcome 16 Hospitalisations (number ‐ all causes).

Comparison 1 Probiotic versus placebo, Outcome 17 HRQoL (validated questionnaire).
| Probiotics compared to placebo for children and adults with CF | ||||||
| Patient or population: children and adults with CF | ||||||
| Outcomes | Anticipated absolute effects* (95% CI) | Relative effect | No. of participants | Certainty of the evidence | Comments | |
| Risk with placebo | Risk with probiotics | |||||
| Number of pulmonary exacerbations | The mean (range) number of pulmonary exacerbations in the placebo group was 1.42 (0.37 to 2.2) episodes per participant. | The mean number of pulmonary exacerbations in the probiotics group was 0.32 episodes per participant lower (0.68 lower to 0.03 higher). | NA | 225 | ⊕⊕⊝⊝ | Probiotics probably reduce pulmonary exacerbations (mean number per participant) slightly. |
| Faecal calprotectin | The mean (range) faecal calprotectin in the placebo group was 132.9 µg/g (67 µg/g to 182.1 µg/g). | The mean faecal calprotectin in the probiotics group was 47.4 µg/g lower (93.28 lower to 1.54 lower). | NA | 177 | ⊕⊕⊝⊝ | Probiotics result in a reduction in faecal calprotectin. |
| Adverse events (serious adverse reaction and adverse reaction) | There were 0 adverse events in the placebo group. | There were 4 adverse events in the probiotics group. | RR 3.00 | 310 | ⊕⊕⊝⊝ | Probiotics result in a small number of adverse events. The terminated RCT reported a serious adverse event (severe urticaria) in 1 participant on probiotics. No mortalities were reported in any included RCTs. |
| Weight (z score) | The mean (range) weight (z score) in the placebo group was ‐1.2 (‐1.79 to ‐0.81). | The mean weight (z score) in the probiotics group was0.24 SD lower (0.52 lower to 0.05 higher). | NA | 91 | ⊕⊕⊝⊝ | Insufficient evidence to determine if probiotics result in little to no difference in weight. A third RCT (n = 38) reported weight in kg and also reported no significant difference in weight. |
| Lung function (FEV1 % predicted) | The mean (range) FEV1 (% predicted) in the placebo group was 84.8% (52.7% to 104%) | The mean FEV1 (% predicted) in the probiotics group was 1.36% higher (1.20 lower to 3.91 higher). | NA | 284 | ⊕⊕⊝⊝ | Insufficient evidence to determine if probiotics result in little to no difference in lung function (FEV1 % predicted). |
| Hospitalisations (all causes) | The mean number of hospitalisations (all causes) in the placebo group was 0.53 admissions per participant. | The mean number of hospitalisations in the probiotics group was 0.44 admissions per participant lower (1.41 lower to 0.54 higher). | NA | 115 | ⊕⊕⊝⊝ | Insufficient evidence to determine if probiotics result in little to no difference in hospitalisation rates. |
| HRQoL (PedsQLTM 4.0 SF 15 (Scale from: 0 to 100)) | The mean HRQoL score from the PedsQLTM 4.0 SF 15 ‐ Parent Report in the placebo group was 81.4. | The standardised mean HRQoL score from the PedsQLTM 4.0 SF 15 ‐ Parent Report in the probiotics group was 0.87 SD higher (0.19 higher to 1.55 higher). | NA | 37 | ⊕⊕⊝⊝ | Insufficient evidence to determine if probiotics result in a small effect in HRQoL. |
| The mean HRQoL score from the PedsQLTM 4.0 SF 15 ‐ Child Report in the placebo group was 85.9. | The standardised mean HRQoL score from the PedsQLTM 4.0 SF 15 ‐ Child Report in the probiotics group was 0.59 SD higher (0.07 lower to 1.26 higher). | NA | 37 | ⊕⊕⊝⊝ | Insufficient evidence to determine if probiotics result in a small effect in HRQoL. | |
| *The risk in the intervention group (and its 95% CI) is based on the assumed risk in the comparison group and the relative effect of the intervention (and its 95% CI). | ||||||
| GRADE Working Group grades of evidence | ||||||
| a Downgraded once due to high risk of bias due to selective reporting. b Downgraded due to high risk of bias due to incomplete outcome data. c Downgraded due to lack of generalisability as majority of the studies only include children. d Downgraded due to high risk of bias due to blinding. | ||||||
| Outcome or subgroup title | No. of studies | No. of participants | Statistical method | Effect size |
| 1 Pulmonary exacerbation (mean number per participant) Show forest plot | 4 | 225 | Mean Difference (IV, Random, 95% CI) | ‐0.32 [‐0.68, 0.03] |
| 1.1 Over 3 months and up to 6 months | 3 | 148 | Mean Difference (IV, Random, 95% CI) | ‐0.39 [‐0.80, 0.02] |
| 1.2 Over 9 months and up to 12 months | 1 | 77 | Mean Difference (IV, Random, 95% CI) | 0.10 [‐0.75, 0.95] |
| 2 Pulmonary exacerbation (duration of antibiotic therapy ‐ any route) Show forest plot | 2 | 127 | Mean Difference (IV, Random, 95% CI) | ‐0.45 [‐9.04, 8.14] |
| 2.1 Over 3 months and up to 6 months | 1 | 50 | Mean Difference (IV, Random, 95% CI) | ‐2.0 [‐12.89, 8.89] |
| 2.2 Over 9 months and up to 12 months | 1 | 77 | Mean Difference (IV, Random, 95% CI) | 2.10 [‐11.88, 16.08] |
| 3 Faecal calprotectin (µg/g) Show forest plot | 4 | 177 | Mean Difference (IV, Random, 95% CI) | ‐47.41 [‐93.28, ‐1.54] |
| 3.1 Up to 3 months | 2 | 69 | Mean Difference (IV, Random, 95% CI) | ‐105.02 [‐205.23, ‐4.81] |
| 3.2 Over 3 months and up to 6 months | 2 | 108 | Mean Difference (IV, Random, 95% CI) | ‐32.14 [‐83.73, 19.45] |
| 4 Faecal calprotectin (µg/g) ‐ change from baseline ‐ sensitivity analysis Show forest plot | 3 | 130 | Mean Difference (IV, Random, 95% CI) | ‐31.17 [‐81.56, 19.22] |
| 4.1 Up to 3 months | 1 | 22 | Mean Difference (IV, Random, 95% CI) | ‐11.0 [‐246.06, 224.06] |
| 4.2 Over 3 months and up to 6 months | 2 | 108 | Mean Difference (IV, Random, 95% CI) | ‐32.14 [‐83.73, 19.45] |
| 5 Faecal calprotectin (µg/g) ‐ post treatment ‐ sensitivity analysis Show forest plot | 3 | 119 | Mean Difference (IV, Random, 95% CI) | ‐45.46 [‐176.25, 85.32] |
| 5.1 Up to 3 months | 2 | 69 | Mean Difference (IV, Random, 95% CI) | ‐107.29 [‐171.20, ‐43.38] |
| 5.2 Over 3 months and up to 6 months | 1 | 50 | Mean Difference (IV, Random, 95% CI) | 77.0 [3.11, 150.89] |
| 6 Serum cytokines Show forest plot | 2 | Mean Difference (IV, Random, 95% CI) | Subtotals only | |
| 6.1 TNF‐α (pg/ml) | 2 | 89 | Mean Difference (IV, Random, 95% CI) | 0.20 [‐0.72, 1.13] |
| 6.2 IL‐8 (pg/ml) | 2 | 95 | Mean Difference (IV, Random, 95% CI) | 26.93 [‐46.25, 100.11] |
| 6.3 IL‐1β (pg/ml) | 1 | 41 | Mean Difference (IV, Random, 95% CI) | 0.30 [‐0.28, 0.88] |
| 6.4 IL‐6 (pg/ml) | 1 | 41 | Mean Difference (IV, Random, 95% CI) | ‐0.29 [‐0.68, 0.10] |
| 6.5 IL‐10 (pg/ml) | 1 | 41 | Mean Difference (IV, Random, 95% CI) | ‐0.05 [‐0.43, 0.33] |
| 6.6 NOx (μmol/L) | 1 | 41 | Mean Difference (IV, Random, 95% CI) | 0.08 [‐0.26, 0.42] |
| 6.7 IL‐12 (pg/ml) | 1 | 41 | Mean Difference (IV, Random, 95% CI) | 0.53 [0.10, 0.96] |
| 6.8 MPO (mU/ml) | 1 | 41 | Mean Difference (IV, Random, 95% CI) | 0.05 [‐0.14, 0.24] |
| 7 Sputum cytokines ‐ change from baseline Show forest plot | 1 | Mean Difference (IV, Random, 95% CI) | Subtotals only | |
| 7.1 TNF‐α (pg/ml) | 1 | 48 | Mean Difference (IV, Random, 95% CI) | ‐0.20 [‐0.94, 0.54] |
| 7.2 IL‐8 (pg/ml) | 1 | 54 | Mean Difference (IV, Random, 95% CI) | ‐0.20 [‐0.92, 0.52] |
| 8 Adverse events Show forest plot | 5 | Risk Ratio (IV, Random, 95% CI) | Subtotals only | |
| 8.1 Mortality (all causes) | 5 | 310 | Risk Ratio (IV, Random, 95% CI) | 0.0 [0.0, 0.0] |
| 8.2 Serious adverse reaction | 5 | 310 | Risk Ratio (IV, Random, 95% CI) | 3.0 [0.13, 67.06] |
| 8.3 Adverse reaction | 5 | 310 | Risk Ratio (IV, Random, 95% CI) | 3.0 [0.49, 18.46] |
| 9 Height (z score) ‐ post treatment Show forest plot | 2 | 91 | Mean Difference (IV, Random, 95% CI) | 0.10 [‐0.27, 0.47] |
| 9.1 Up to 3 months | 1 | 41 | Mean Difference (IV, Random, 95% CI) | 0.21 [‐0.62, 1.04] |
| 9.2 Over 3 months and up to 6 months | 1 | 50 | Mean Difference (IV, Random, 95% CI) | 0.07 [‐0.34, 0.48] |
| 10 Weight (z score) ‐ post treatment Show forest plot | 2 | 91 | Mean Difference (IV, Random, 95% CI) | ‐0.23 [‐0.51, 0.05] |
| 10.1 Up to 3 months | 1 | 41 | Mean Difference (IV, Random, 95% CI) | ‐0.4 [‐0.70, ‐0.10] |
| 10.2 Over 3 months and up to 6 months | 1 | 50 | Mean Difference (IV, Random, 95% CI) | ‐0.11 [‐0.30, 0.08] |
| 11 Weight (kg) ‐ change from baseline Show forest plot | 1 | Mean Difference (IV, Random, 95% CI) | Subtotals only | |
| 11.1 Over 3 months and up to 6 months | 1 | 38 | Mean Difference (IV, Random, 95% CI) | 1.2 [‐0.04, 2.44] |
| 12 BMI (z score) Show forest plot | 2 | 91 | Mean Difference (IV, Random, 95% CI) | ‐0.02 [‐0.25, 0.22] |
| 12.1 Up to 3 months | 1 | 41 | Mean Difference (IV, Random, 95% CI) | ‐0.11 [‐0.54, 0.32] |
| 12.2 Over 3 months and up to 6 months | 1 | 50 | Mean Difference (IV, Random, 95% CI) | 0.02 [‐0.26, 0.31] |
| 13 Lung function (FEV1 % predicted) Show forest plot | 5 | 284 | Mean Difference (IV, Random, 95% CI) | 1.36 [‐1.20, 3.91] |
| 13.1 Up to 3 months | 1 | 41 | Mean Difference (IV, Random, 95% CI) | ‐8.07 [‐19.87, 3.73] |
| 13.2 Over 3 months and up to 6 months | 3 | 166 | Mean Difference (IV, Random, 95% CI) | 2.22 [‐0.51, 4.94] |
| 13.3 Over 9 months and up to 12 months | 1 | 77 | Mean Difference (IV, Random, 95% CI) | ‐2.80 [‐12.13, 6.53] |
| 14 Lung function (FEV1 % predicted) ‐ change from baseline ‐ sensitivity analysis Show forest plot | 3 | 166 | Mean Difference (IV, Random, 95% CI) | 2.22 [‐0.51, 4.94] |
| 14.1 Over 3 months and up to 6 months | 3 | 166 | Mean Difference (IV, Random, 95% CI) | 2.22 [‐0.51, 4.94] |
| 15 Lung function (FEV1 % predicted) ‐ post treatment ‐ sensitivity analysis Show forest plot | 3 | 168 | Mean Difference (IV, Random, 95% CI) | ‐1.31 [‐7.10, 4.48] |
| 15.1 Up to 3 months | 1 | 41 | Mean Difference (IV, Random, 95% CI) | ‐1.40 [‐14.48, 11.68] |
| 15.2 Over 3 months and up to 6 months | 1 | 50 | Mean Difference (IV, Random, 95% CI) | 0.10 [‐8.85, 9.05] |
| 15.3 Over 9 months and up to 12 months | 1 | 77 | Mean Difference (IV, Random, 95% CI) | ‐2.80 [‐12.13, 6.53] |
| 16 Hospitalisations (number ‐ all causes) Show forest plot | 2 | 115 | Mean Difference (IV, Random, 95% CI) | ‐0.44 [‐1.41, 0.54] |
| 16.1 Over 3 months and up to 6 months | 1 | 38 | Mean Difference (IV, Random, 95% CI) | ‐1.0 [‐1.74, ‐0.26] |
| 16.2 Over 9 months and up to 12 months | 1 | 77 | Mean Difference (IV, Random, 95% CI) | 0.0 [‐0.25, 0.25] |
| 17 HRQoL (validated questionnaire) Show forest plot | 1 | Std. Mean Difference (IV, Random, 95% CI) | Subtotals only | |
| 17.1 PedsQLTM 4.0 SF 15 ‐ Parent Report (performed 3 months post 1 month intervention period) | 1 | 37 | Std. Mean Difference (IV, Random, 95% CI) | 0.87 [0.19, 1.55] |
| 17.2 PedsQLTM 4.0 SF 15 ‐ Child Report (performed 3 months post 1 month intervention period) | 1 | 37 | Std. Mean Difference (IV, Random, 95% CI) | 0.59 [‐0.07, 1.26] |