Probióticos para pacientes con fibrosis quística
Appendices
Appendix 1. Search methods – electronic searching
| Database/ Resource | Strategy |
| PubMed | (cystic fibrosis OR mucoviscidosis) AND (probiotic* OR prebiotic* OR symbiotic* OR Lactobacillus OR Bifidobacterium OR Streptococcus OR Saccharyomyces) AND (randomized controlled trial [pt] OR controlled clinical trial [pt] OR randomized [tiab] OR placebo [tiab] OR drug therapy [sh] OR randomly [tiab] OR trial [tiab] OR groups [tiab] NOT (animals [mh] NOT humans [mh])) |
| ClinicalTrials.gov | Condition/ Disease: Cystic fibrosis Other terms: probiotic OR prebiotic OR synbiotic OR Lactobacillus OR Bifidobacterium OR Streptococcus OR Saccharomyces |
| WHO International Clinical Trials Registry Platform (ICTRP) | [Advanced Search Form] Condition: cystic fibrosis Intervention: probiotic OR prebiotic OR synbiotic OR Lactobacillus OR Bifidobacterium OR Streptococcus OR Saccharomyces Recruitment Status: All |
| Open Grey | cystic fibrosis AND (probiotic* OR prebiotic* OR symbiotic* OR Lactobacillus OR Bifidobacterium OR Streptococcus OR Saccharomyces) |

Study flow diagram.
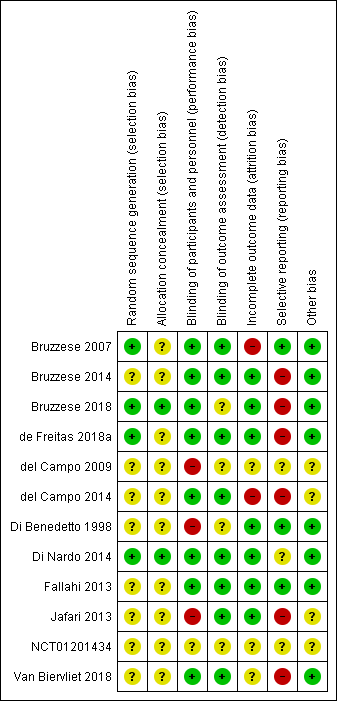
Risk of bias summary: review authors' judgements about each risk of bias item for each included study.

Risk of bias graph: review authors' judgements about each risk of bias item presented as percentages across all included studies.

Comparison 1 Probiotic versus placebo, Outcome 1 Pulmonary exacerbation (mean number per participant).

Comparison 1 Probiotic versus placebo, Outcome 2 Pulmonary exacerbation (duration of antibiotic therapy ‐ any route).
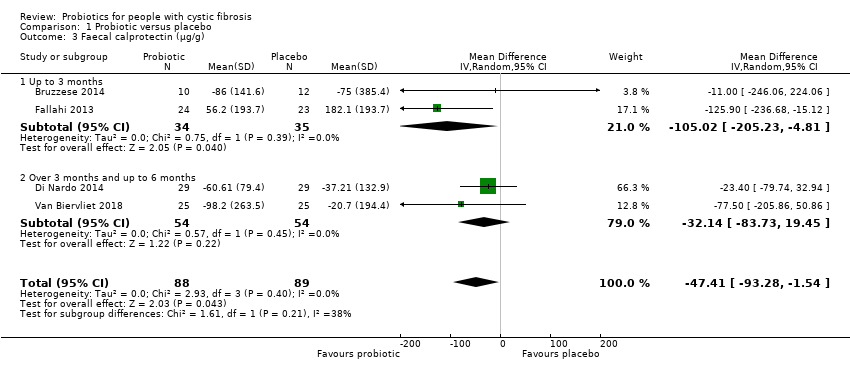
Comparison 1 Probiotic versus placebo, Outcome 3 Faecal calprotectin (µg/g).

Comparison 1 Probiotic versus placebo, Outcome 4 Faecal calprotectin (µg/g) ‐ change from baseline ‐ sensitivity analysis.

Comparison 1 Probiotic versus placebo, Outcome 5 Faecal calprotectin (µg/g) ‐ post treatment ‐ sensitivity analysis.

Comparison 1 Probiotic versus placebo, Outcome 6 Serum cytokines.

Comparison 1 Probiotic versus placebo, Outcome 7 Sputum cytokines ‐ change from baseline.

Comparison 1 Probiotic versus placebo, Outcome 8 Adverse events.

Comparison 1 Probiotic versus placebo, Outcome 9 Height (z score) ‐ post treatment.
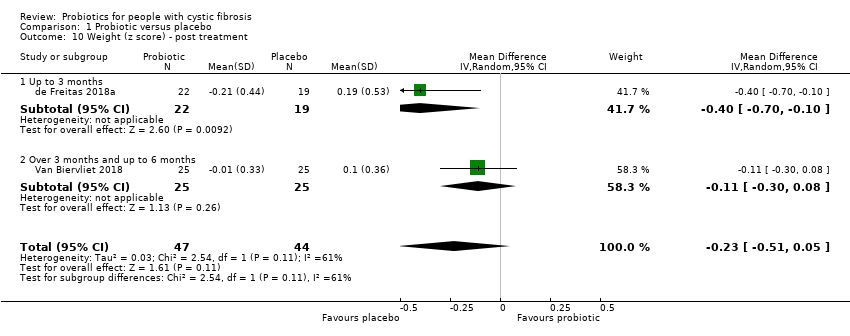
Comparison 1 Probiotic versus placebo, Outcome 10 Weight (z score) ‐ post treatment.
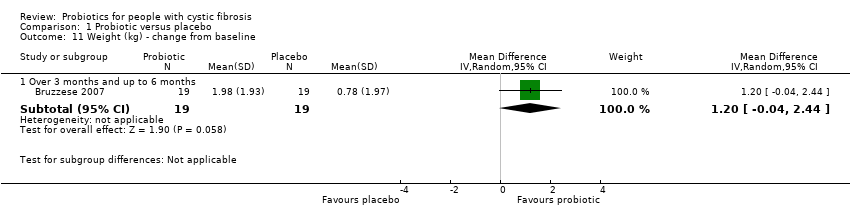
Comparison 1 Probiotic versus placebo, Outcome 11 Weight (kg) ‐ change from baseline.

Comparison 1 Probiotic versus placebo, Outcome 12 BMI (z score).

Comparison 1 Probiotic versus placebo, Outcome 13 Lung function (FEV1 % predicted).

Comparison 1 Probiotic versus placebo, Outcome 14 Lung function (FEV1 % predicted) ‐ change from baseline ‐ sensitivity analysis.

Comparison 1 Probiotic versus placebo, Outcome 15 Lung function (FEV1 % predicted) ‐ post treatment ‐ sensitivity analysis.

Comparison 1 Probiotic versus placebo, Outcome 16 Hospitalisations (number ‐ all causes).

Comparison 1 Probiotic versus placebo, Outcome 17 HRQoL (validated questionnaire).
| Probiotics compared to placebo for children and adults with CF | ||||||
| Patient or population: children and adults with CF | ||||||
| Outcomes | Anticipated absolute effects* (95% CI) | Relative effect | No. of participants | Certainty of the evidence | Comments | |
| Risk with placebo | Risk with probiotics | |||||
| Number of pulmonary exacerbations | The mean (range) number of pulmonary exacerbations in the placebo group was 1.42 (0.37 to 2.2) episodes per participant. | The mean number of pulmonary exacerbations in the probiotics group was 0.32 episodes per participant lower (0.68 lower to 0.03 higher). | NA | 225 | ⊕⊕⊝⊝ | Probiotics probably reduce pulmonary exacerbations (mean number per participant) slightly. |
| Faecal calprotectin | The mean (range) faecal calprotectin in the placebo group was 132.9 µg/g (67 µg/g to 182.1 µg/g). | The mean faecal calprotectin in the probiotics group was 47.4 µg/g lower (93.28 lower to 1.54 lower). | NA | 177 | ⊕⊕⊝⊝ | Probiotics result in a reduction in faecal calprotectin. |
| Adverse events (serious adverse reaction and adverse reaction) | There were 0 adverse events in the placebo group. | There were 4 adverse events in the probiotics group. | RR 3.00 | 310 | ⊕⊕⊝⊝ | Probiotics result in a small number of adverse events. The terminated RCT reported a serious adverse event (severe urticaria) in 1 participant on probiotics. No mortalities were reported in any included RCTs. |
| Weight (z score) | The mean (range) weight (z score) in the placebo group was ‐1.2 (‐1.79 to ‐0.81). | The mean weight (z score) in the probiotics group was0.24 SD lower (0.52 lower to 0.05 higher). | NA | 91 | ⊕⊕⊝⊝ | Insufficient evidence to determine if probiotics result in little to no difference in weight. A third RCT (n = 38) reported weight in kg and also reported no significant difference in weight. |
| Lung function (FEV1 % predicted) | The mean (range) FEV1 (% predicted) in the placebo group was 84.8% (52.7% to 104%) | The mean FEV1 (% predicted) in the probiotics group was 1.36% higher (1.20 lower to 3.91 higher). | NA | 284 | ⊕⊕⊝⊝ | Insufficient evidence to determine if probiotics result in little to no difference in lung function (FEV1 % predicted). |
| Hospitalisations (all causes) | The mean number of hospitalisations (all causes) in the placebo group was 0.53 admissions per participant. | The mean number of hospitalisations in the probiotics group was 0.44 admissions per participant lower (1.41 lower to 0.54 higher). | NA | 115 | ⊕⊕⊝⊝ | Insufficient evidence to determine if probiotics result in little to no difference in hospitalisation rates. |
| HRQoL (PedsQLTM 4.0 SF 15 (Scale from: 0 to 100)) | The mean HRQoL score from the PedsQLTM 4.0 SF 15 ‐ Parent Report in the placebo group was 81.4. | The standardised mean HRQoL score from the PedsQLTM 4.0 SF 15 ‐ Parent Report in the probiotics group was 0.87 SD higher (0.19 higher to 1.55 higher). | NA | 37 | ⊕⊕⊝⊝ | Insufficient evidence to determine if probiotics result in a small effect in HRQoL. |
| The mean HRQoL score from the PedsQLTM 4.0 SF 15 ‐ Child Report in the placebo group was 85.9. | The standardised mean HRQoL score from the PedsQLTM 4.0 SF 15 ‐ Child Report in the probiotics group was 0.59 SD higher (0.07 lower to 1.26 higher). | NA | 37 | ⊕⊕⊝⊝ | Insufficient evidence to determine if probiotics result in a small effect in HRQoL. | |
| *The risk in the intervention group (and its 95% CI) is based on the assumed risk in the comparison group and the relative effect of the intervention (and its 95% CI). | ||||||
| GRADE Working Group grades of evidence | ||||||
| a Downgraded once due to high risk of bias due to selective reporting. b Downgraded due to high risk of bias due to incomplete outcome data. c Downgraded due to lack of generalisability as majority of the studies only include children. d Downgraded due to high risk of bias due to blinding. | ||||||
| Outcome or subgroup title | No. of studies | No. of participants | Statistical method | Effect size |
| 1 Pulmonary exacerbation (mean number per participant) Show forest plot | 4 | 225 | Mean Difference (IV, Random, 95% CI) | ‐0.32 [‐0.68, 0.03] |
| 1.1 Over 3 months and up to 6 months | 3 | 148 | Mean Difference (IV, Random, 95% CI) | ‐0.39 [‐0.80, 0.02] |
| 1.2 Over 9 months and up to 12 months | 1 | 77 | Mean Difference (IV, Random, 95% CI) | 0.10 [‐0.75, 0.95] |
| 2 Pulmonary exacerbation (duration of antibiotic therapy ‐ any route) Show forest plot | 2 | 127 | Mean Difference (IV, Random, 95% CI) | ‐0.45 [‐9.04, 8.14] |
| 2.1 Over 3 months and up to 6 months | 1 | 50 | Mean Difference (IV, Random, 95% CI) | ‐2.0 [‐12.89, 8.89] |
| 2.2 Over 9 months and up to 12 months | 1 | 77 | Mean Difference (IV, Random, 95% CI) | 2.10 [‐11.88, 16.08] |
| 3 Faecal calprotectin (µg/g) Show forest plot | 4 | 177 | Mean Difference (IV, Random, 95% CI) | ‐47.41 [‐93.28, ‐1.54] |
| 3.1 Up to 3 months | 2 | 69 | Mean Difference (IV, Random, 95% CI) | ‐105.02 [‐205.23, ‐4.81] |
| 3.2 Over 3 months and up to 6 months | 2 | 108 | Mean Difference (IV, Random, 95% CI) | ‐32.14 [‐83.73, 19.45] |
| 4 Faecal calprotectin (µg/g) ‐ change from baseline ‐ sensitivity analysis Show forest plot | 3 | 130 | Mean Difference (IV, Random, 95% CI) | ‐31.17 [‐81.56, 19.22] |
| 4.1 Up to 3 months | 1 | 22 | Mean Difference (IV, Random, 95% CI) | ‐11.0 [‐246.06, 224.06] |
| 4.2 Over 3 months and up to 6 months | 2 | 108 | Mean Difference (IV, Random, 95% CI) | ‐32.14 [‐83.73, 19.45] |
| 5 Faecal calprotectin (µg/g) ‐ post treatment ‐ sensitivity analysis Show forest plot | 3 | 119 | Mean Difference (IV, Random, 95% CI) | ‐45.46 [‐176.25, 85.32] |
| 5.1 Up to 3 months | 2 | 69 | Mean Difference (IV, Random, 95% CI) | ‐107.29 [‐171.20, ‐43.38] |
| 5.2 Over 3 months and up to 6 months | 1 | 50 | Mean Difference (IV, Random, 95% CI) | 77.0 [3.11, 150.89] |
| 6 Serum cytokines Show forest plot | 2 | Mean Difference (IV, Random, 95% CI) | Subtotals only | |
| 6.1 TNF‐α (pg/ml) | 2 | 89 | Mean Difference (IV, Random, 95% CI) | 0.20 [‐0.72, 1.13] |
| 6.2 IL‐8 (pg/ml) | 2 | 95 | Mean Difference (IV, Random, 95% CI) | 26.93 [‐46.25, 100.11] |
| 6.3 IL‐1β (pg/ml) | 1 | 41 | Mean Difference (IV, Random, 95% CI) | 0.30 [‐0.28, 0.88] |
| 6.4 IL‐6 (pg/ml) | 1 | 41 | Mean Difference (IV, Random, 95% CI) | ‐0.29 [‐0.68, 0.10] |
| 6.5 IL‐10 (pg/ml) | 1 | 41 | Mean Difference (IV, Random, 95% CI) | ‐0.05 [‐0.43, 0.33] |
| 6.6 NOx (μmol/L) | 1 | 41 | Mean Difference (IV, Random, 95% CI) | 0.08 [‐0.26, 0.42] |
| 6.7 IL‐12 (pg/ml) | 1 | 41 | Mean Difference (IV, Random, 95% CI) | 0.53 [0.10, 0.96] |
| 6.8 MPO (mU/ml) | 1 | 41 | Mean Difference (IV, Random, 95% CI) | 0.05 [‐0.14, 0.24] |
| 7 Sputum cytokines ‐ change from baseline Show forest plot | 1 | Mean Difference (IV, Random, 95% CI) | Subtotals only | |
| 7.1 TNF‐α (pg/ml) | 1 | 48 | Mean Difference (IV, Random, 95% CI) | ‐0.20 [‐0.94, 0.54] |
| 7.2 IL‐8 (pg/ml) | 1 | 54 | Mean Difference (IV, Random, 95% CI) | ‐0.20 [‐0.92, 0.52] |
| 8 Adverse events Show forest plot | 5 | Risk Ratio (IV, Random, 95% CI) | Subtotals only | |
| 8.1 Mortality (all causes) | 5 | 310 | Risk Ratio (IV, Random, 95% CI) | 0.0 [0.0, 0.0] |
| 8.2 Serious adverse reaction | 5 | 310 | Risk Ratio (IV, Random, 95% CI) | 3.0 [0.13, 67.06] |
| 8.3 Adverse reaction | 5 | 310 | Risk Ratio (IV, Random, 95% CI) | 3.0 [0.49, 18.46] |
| 9 Height (z score) ‐ post treatment Show forest plot | 2 | 91 | Mean Difference (IV, Random, 95% CI) | 0.10 [‐0.27, 0.47] |
| 9.1 Up to 3 months | 1 | 41 | Mean Difference (IV, Random, 95% CI) | 0.21 [‐0.62, 1.04] |
| 9.2 Over 3 months and up to 6 months | 1 | 50 | Mean Difference (IV, Random, 95% CI) | 0.07 [‐0.34, 0.48] |
| 10 Weight (z score) ‐ post treatment Show forest plot | 2 | 91 | Mean Difference (IV, Random, 95% CI) | ‐0.23 [‐0.51, 0.05] |
| 10.1 Up to 3 months | 1 | 41 | Mean Difference (IV, Random, 95% CI) | ‐0.4 [‐0.70, ‐0.10] |
| 10.2 Over 3 months and up to 6 months | 1 | 50 | Mean Difference (IV, Random, 95% CI) | ‐0.11 [‐0.30, 0.08] |
| 11 Weight (kg) ‐ change from baseline Show forest plot | 1 | Mean Difference (IV, Random, 95% CI) | Subtotals only | |
| 11.1 Over 3 months and up to 6 months | 1 | 38 | Mean Difference (IV, Random, 95% CI) | 1.2 [‐0.04, 2.44] |
| 12 BMI (z score) Show forest plot | 2 | 91 | Mean Difference (IV, Random, 95% CI) | ‐0.02 [‐0.25, 0.22] |
| 12.1 Up to 3 months | 1 | 41 | Mean Difference (IV, Random, 95% CI) | ‐0.11 [‐0.54, 0.32] |
| 12.2 Over 3 months and up to 6 months | 1 | 50 | Mean Difference (IV, Random, 95% CI) | 0.02 [‐0.26, 0.31] |
| 13 Lung function (FEV1 % predicted) Show forest plot | 5 | 284 | Mean Difference (IV, Random, 95% CI) | 1.36 [‐1.20, 3.91] |
| 13.1 Up to 3 months | 1 | 41 | Mean Difference (IV, Random, 95% CI) | ‐8.07 [‐19.87, 3.73] |
| 13.2 Over 3 months and up to 6 months | 3 | 166 | Mean Difference (IV, Random, 95% CI) | 2.22 [‐0.51, 4.94] |
| 13.3 Over 9 months and up to 12 months | 1 | 77 | Mean Difference (IV, Random, 95% CI) | ‐2.80 [‐12.13, 6.53] |
| 14 Lung function (FEV1 % predicted) ‐ change from baseline ‐ sensitivity analysis Show forest plot | 3 | 166 | Mean Difference (IV, Random, 95% CI) | 2.22 [‐0.51, 4.94] |
| 14.1 Over 3 months and up to 6 months | 3 | 166 | Mean Difference (IV, Random, 95% CI) | 2.22 [‐0.51, 4.94] |
| 15 Lung function (FEV1 % predicted) ‐ post treatment ‐ sensitivity analysis Show forest plot | 3 | 168 | Mean Difference (IV, Random, 95% CI) | ‐1.31 [‐7.10, 4.48] |
| 15.1 Up to 3 months | 1 | 41 | Mean Difference (IV, Random, 95% CI) | ‐1.40 [‐14.48, 11.68] |
| 15.2 Over 3 months and up to 6 months | 1 | 50 | Mean Difference (IV, Random, 95% CI) | 0.10 [‐8.85, 9.05] |
| 15.3 Over 9 months and up to 12 months | 1 | 77 | Mean Difference (IV, Random, 95% CI) | ‐2.80 [‐12.13, 6.53] |
| 16 Hospitalisations (number ‐ all causes) Show forest plot | 2 | 115 | Mean Difference (IV, Random, 95% CI) | ‐0.44 [‐1.41, 0.54] |
| 16.1 Over 3 months and up to 6 months | 1 | 38 | Mean Difference (IV, Random, 95% CI) | ‐1.0 [‐1.74, ‐0.26] |
| 16.2 Over 9 months and up to 12 months | 1 | 77 | Mean Difference (IV, Random, 95% CI) | 0.0 [‐0.25, 0.25] |
| 17 HRQoL (validated questionnaire) Show forest plot | 1 | Std. Mean Difference (IV, Random, 95% CI) | Subtotals only | |
| 17.1 PedsQLTM 4.0 SF 15 ‐ Parent Report (performed 3 months post 1 month intervention period) | 1 | 37 | Std. Mean Difference (IV, Random, 95% CI) | 0.87 [0.19, 1.55] |
| 17.2 PedsQLTM 4.0 SF 15 ‐ Child Report (performed 3 months post 1 month intervention period) | 1 | 37 | Std. Mean Difference (IV, Random, 95% CI) | 0.59 [‐0.07, 1.26] |