Sequencing of anthracyclines and taxanes in neoadjuvant and adjuvant therapy for early breast cancer
Abstract
Background
Anthracyclines and taxanes are chemotherapeutic agents widely used in a sequential regimen in the adjuvant and neoadjuvant treatment of early breast cancer to reduce the risk of cancer recurrence. Standard practice is to administer anthracycline‐based chemotherapy followed by a taxane. Anthracyclines tend to be administered first as they were established before taxanes for treatment of early breast cancer.
Objectives
To assess whether the sequence in which anthracyclines and taxanes are administered affects outcomes for people with early breast cancer receiving adjuvant or neoadjuvant therapy.
Search methods
We searched Cochrane Breast Cancer's Specialised Register, CENTRAL, MEDLINE, Embase, the World Health Organization's International Clinical Trials Registry Platform (WHO ICTRP) and ClinicalTrials.gov on 1 February 2018.
Selection criteria
Randomised controlled trials comparing administering a taxane prior to an anthracycline with taxane following anthracycline to people with early breast cancer receiving chemotherapy. The studies needed to have reported on at least one of our outcomes of interest, which included overall survival, disease‐free survival, pathological response, treatment adherence, toxicity and quality of life.
Data collection and analysis
Two review authors independently extracted data, assessed risk of bias and quality of the evidence. The primary outcome measure was overall survival. Secondary outcomes included disease‐free survival, pathological response (in the neoadjuvant setting only), adverse events, treatment adherence and quality of life. For time‐to‐event outcomes of overall survival and disease‐free survival, we derived hazard ratios (HRs) with 95% confidence intervals (CI) where possible. For dichotomous outcomes of pathological complete response, treatment adherence and adverse events, we reported the treatment effect as a risk ratio (RR) with 95% CI where possible. We used GRADE to assess the certainty of the evidence separately for the neoadjuvant and adjuvant settings.
Main results
There were 1415 participants in five neoadjuvant studies and 280 participants in four adjuvant studies involving five treatment comparisons. Four of the five neoadjuvant studies collected data for the primary outcome (overall survival) and two studies had data available; one of the four adjuvant studies collected overall survival data.
The neoadjuvant studies suggested that the administration of taxanes first probably resulted in little to no difference in overall survival (HR 0.80, 95% CI 0.60 to 1.08; 947 participants; 2 studies; moderate‐certainty evidence) and disease‐free survival (HR 0.84, 95% CI 0.65 to 1.09; 828 participants; 1 study; moderate‐certainty evidence). Administration of taxanes first also resulted in little to no difference in pathological complete response (absence of cancer in the breast and axilla: RR 1.15, 95% CI 0.96 to 1.38; 1280 participants; 4 studies; high‐certainty evidence). However, there appeared to be a trend in favour of taxanes first. Studies reported treatment adherence using a range of measures. Administration of taxanes first probably did not increase the likelihood of requiring dose reductions compared to administration of anthracyclines first (RR 0.81, 95% CI 0.59 to 1.11; 280 participants; 1 study; moderate‐certainty evidence). There was probably little to no difference in the risk of grade 3/4 neutropenia (RR 1.25, 95% CI 0.86 to 1.82; 280 participants, 1 study; moderate‐certainty evidence) or grade 3/4 neurotoxicity (RR 0.95, 95% CI 0.55 to 1.65; 1108 participants; 2 studies; low‐certainty evidence) when taxanes were given first. There were no data on quality of life.
Only one adjuvant study collected data on overall survival and disease‐free survival but did not report data. Administration of taxanes first reduced the risk of grade 3/4 neutropenia (RR 0.62, 95% CI 0.40 to 0.97; 279 participants; 4 studies, 5 treatment comparisons; high‐certainty evidence) and appeared to result in little to no difference in grade 3/4 neurotoxicity (RR 0.78, 95% CI 0.25 to 2.46; 162 participants; 3 studies; low‐certainty evidence). There was probably little to no difference in the proportions experiencing dose delays when taxanes are given first compared to anthracyclines given first (RR 0.76, 95% CI 0.52 to 1.12; 238 participants; 3 studies, 4 treatment comparisons; moderate‐certainty evidence). One study reported on quality of life and indicated that scores (using the Functional Assessment of Cancer Therapy – Breast Cancer (FACT‐B) validated questionnaire) were similar in both groups though did not provide numerical data.
Authors' conclusions
In the neoadjuvant setting, there is high‐ to low‐certainty evidence of equivalent outcomes for the sequence in which taxanes are delivered. In the adjuvant setting, none of the studies reported on overall survival or disease‐free survival. In most institutions, standard practice would be to deliver anthracycline followed by taxane, and currently available data do not support a change in this practice. We wait for the full‐text publication of a relevant neoadjuvant study for women with HER2‐negative breast cancer for inclusion in an update of this review.
PICO
Plain language summary
Taxane chemotherapy before or after anthracycline chemotherapy in early breast cancer
Anthracyclines and taxanes are active classes of chemotherapeutic agents used before or after surgery for early breast cancer.
What is the aim of this review?
We aimed to find out if giving people with early breast cancer (where the cancer has not spread beyond the lymph nodes near the breast) taxane chemotherapy before anthracycline chemotherapy (instead of after) would change outcomes.
While the benefits of adding taxanes to anthracyclines are well established, it is unknown whether giving taxane chemotherapy before or after anthracycline chemotherapy has an impact on how long people live, how long they remain free of breast cancer, their completion of treatment, the side effects of treatment and their quality of life.
Key messages from the review
The order in which taxane and anthracycline chemotherapies are given may have had little to no impact on:
– how long participants lived;
– how long they remained free of breast cancer;
– completion of treatment and
– side effects of treatment.
None of the studies reported data on quality of life. Many of the studies did not report information on important outcomes such as how long people will live or remain free of breast cancer. We await the publication of one relevant study involving 112 participants who receive chemotherapy before breast cancer surgery for inclusion in an update of this review.
In summary, the results found no sufficient evidence of benefit or harm due to the order in which taxane and anthracycline chemotherapies are given. In most institutions, standard practice would be to deliver anthracycline followed by taxane. Based on this review of the evidence, the currently available data do not support a change in this practice.
What was studied in the review?
For women with early breast cancer who have a higher risk of cancer returning, combination chemotherapy with anthracycline and taxane is often offered either before or after surgery to reduce the risk of cancer returning and prolong life. Traditionally, anthracyclines are given first followed by taxanes but there is no strong evidence for this order. We compared the possibility of giving taxanes first followed by anthracyclines compared to the standard treatment with anthracycline first.
What are the main results of the review?
All participants in the studies were women. We found five studies involving 1415 participants in which chemotherapy was given prior to surgery. The taxane medicine used in three of these studies was paclitaxel, while the other two studies used docetaxel. Two studies used a single agent anthracycline (epirubicin), while three studies used a combination of epirubicin, cyclophosphamide and fluorouracil. There were also four studies involving 280 participants that compared the order of giving taxanes and anthracyclines to participants who were receiving chemotherapy after breast cancer surgery. The taxane used in all four studies was docetaxel, while the anthracyclines used were a combination of epirubicin or adriamycin plus either cyclophosphamide or fluorouracil (or both).
The main results were that the order in which taxane chemotherapy is given:
– probably resulted in little to no difference in survival or risk of cancer coming back for participants who receive chemotherapy before surgery;
– probably resulted in little or no difference in the degree by which the tumour may have shrunk in response to chemotherapy for participants who received chemotherapy before surgery;
– may have resulted in little or no difference in having side effects for participants receiving chemotherapy before surgery but giving taxanes first reduced the risk of neutropenia (low white blood cell count) in those who received chemotherapy after surgery. The side effects that were examined were neutropenia and neurotoxicity (damage to the nerves);
– probably resulted in little to no difference in the proportion of participants receiving chemotherapy after breast cancer surgery experiencing delays in chemotherapy doses.
Many studies did not collect or report data on survival, the risk of cancer coming back or overall well‐being (quality of life). In some cases, the studies did not report data that could be used in the review and we wait for responses from the investigators who conducted the trials.
How up‐to‐date is this review?
The review authors searched for studies that had been published up to February 2018.
Authors' conclusions
Summary of findings
| Taxane followed by anthracyclines compared to anthracyclines followed by taxane in neoadjuvant therapy for early breast cancer | ||||||
| Patient or population: neoadjuvant therapy for early breast cancer | ||||||
| Outcomes | Anticipated absolute effects* (95% CI) | Relative effect | № of participants | Certainty of the evidence | Comments | |
| Risk with anthracyclines followed by taxane | Risk with taxane followed by anthracyclines | |||||
| Overall survival | 3‐year risk of deatha | HR 0.80 | 947 | ⊕⊕⊕⊝ | — | |
| 702 per 1000 | 620 per 1000 | |||||
| Disease‐free survival | 3‐year risk of recurrencea | HR 0.84 | 828 | ⊕⊕⊕⊝ | — | |
| 616 per 1000 | 552 per 1000 | |||||
| Pathological complete response (no invasive cancer in breast or axilla) (follow‐up: up to 5 years for 2 studies; unreported in 2 studies) | Study population | RR 1.15 | 1280 | ⊕⊕⊕⊕ | — | |
| 228 per 1000 | 262 per 1000 | |||||
| Adverse events: neutropenia (grade 3/4) (follow‐up: up to 6 months based on number of chemotherapy cycles) | Study population | RR 1.25 | 280 | ⊕⊕⊕⊝ | — | |
| 254 per 1000 | 317 per 1000 | |||||
| Adverse events: neurotoxicity (grade 3/4) (follow‐up: up to 5 or 6 months based on number of chemotherapy cycles) | Study population | RR 0.95 | 1108 | ⊕⊕⊝⊝ | — | |
| 45 per 1000 | 43 per 1000 | |||||
| Treatment adherence (defined as dose reduction) (follow‐up: up to 6 months based on number of chemotherapy cycles) | Study population | RR 0.81 | 280 | ⊕⊕⊕⊝ | — | |
| 399 per 1000 | 323 per 1000 | |||||
| Quality of life | — | — | — | — | Not measured | |
| *The risk in the intervention group (and its 95% confidence interval) is based on the assumed risk in the comparison group and the relative effect of the intervention (and its 95% CI). CI: confidence interval; HR: hazard ratio; RCT: randomised controlled trial; RR: risk ratio. | ||||||
| GRADE Working Group grades of evidence | ||||||
| aThe baseline risk in the anthracycline followed by taxane group was based on risk estimates provided in Neo‐TAnGo 2014 (Figure 2D for overall survival; Figure 2B for disease‐free survival). | ||||||
| Taxane followed by anthracyclines compared to anthracyclines followed by taxane in adjuvant therapy for early breast cancer | ||||||
| Patient or population: adjuvant therapy for early breast cancer | ||||||
| Outcomes | Anticipated absolute effects* (95% CI) | Relative effect | № of participants | Certainty of the evidence | Comments | |
| Risk with anthracyclines followed by taxane | Risk with taxane followed by anthracyclines | |||||
| Overall survival | — | — | — | — | — | Not reported |
| Disease‐free survival | — | — | — | — | — | Not reported |
| Adverse events: neutropenia (grade 3/4) (follow‐up: up to 3.5 or 4.5 months) | Study population | RR 0.62 | 279 | ⊕⊕⊕⊝ | — | |
| 255 per 1000 | 158 per 1000 | |||||
| Adverse events: neurotoxicity (grade 3/4) (follow‐up: up to 4 or 4.5 months) | Study population | RR 0.78 | 162 | ⊕⊕⊝⊝ | — | |
| 63 per 1000 | 49 per 1000 | |||||
| Treatment adherence (defined as dose delay) (follow‐up: up to 3.5 or 4.5 months) | Study population | RR 0.76 | 238 | ⊕⊕⊕⊝ | — | |
| 333 per 1000 | 253 per 1000 | |||||
| Quality of life (follow‐up: up to 4 months) | 1 study reported quality of life data using the FACT‐B version 4 questionnaire (Puhalla 2008). Scores were similar in both groups for a subset of 20 participants who were assessed before, during and after treatment. Numerical or further details were not provided in the trial publication. | — | 20 | ⊕⊕⊕⊝ | — | |
| *The risk in the intervention group (and its 95% confidence interval) is based on the assumed risk in the comparison group and the relative effect of the intervention (and its 95% CI). CI: confidence interval; RCT: randomised controlled trial; RR: risk ratio. | ||||||
| GRADE Working Group grades of evidence | ||||||
| aWe did not downgrade the certainty of the evidence. A lack of blinding was judged to be unlikely to influence physician assessment of grade 3/4 neutropenia (blood tests) and there was no heterogeneity detected across studies. | ||||||
Background
Description of the condition
Breast cancer is the most common malignancy and the second leading cause of cancer‐related mortality among women worldwide, and thus represents a significant healthcare burden (Ferlay 2015). Over the past few decades there have been substantial improvements in survival for women with early breast cancer following the introduction of adjuvant (after surgery) and neoadjuvant (before surgery) chemotherapy, endocrine therapy and human epidermal growth factor receptor 2 (HER2)‐directed therapy (Cossetti 2015).
Description of the intervention
Anthracyclines and taxanes are active classes of chemotherapeutic agents used in the adjuvant and neoadjuvant treatment of women with early breast cancer.
Anthracyclines (e.g. doxorubicin, epirubicin, liposomal doxorubicin) exert their effect by complexing with DNA and topoisomerase II to induce apoptosis (i.e. cell death) and inhibit DNA and ribonucleic acid (RNA) synthesis. Potential toxicities of anthracyclines include cardiotoxicity, myelosuppression (that results in a reduced number of blood cells) and secondary malignancies (predominantly types of haematological cancer).
Taxanes (e.g. docetaxel, paclitaxel, nab‐paclitaxel) exert their effect by stabilising microtubules (fibrous shafts that assist chromosomes to divide), thereby inhibiting cell division and cell function. Potential toxicities of taxanes include neuropathy (i.e. tingling in the hands and feet), myelosuppression and myalgia (muscle pain).
At present, standard clinical practice for women with early breast cancer is to administer a regimen of anthracycline‐based chemotherapy followed by a taxane. The reason for this established sequence appears to be historical rather than linked to outcomes. Anthracyclines were developed first and the benefit of anthracycline chemotherapy for early breast cancer was established prior to that of taxanes (Jones 2006; Levine 1998). However, one reason to assess the optimal sequence of anthracyclines and taxanes is the finding that outcomes were better when taxanes were given first, in one large retrospective analysis involving approximately 1600 women with breast cancer who received paclitaxel and anthracycline as adjuvant therapy (Alvarez 2010).
How the intervention might work
It is unknown whether the order in which taxanes and anthracyclines are administered results in significantly different outcomes for women with early breast cancer. It remains to be determined if the administration of taxanes first leads to better, worse or no difference in treatment outcomes. The effect may also differ depending on the receptor status of the tumour.
Why it is important to do this review
The aim of this review was to assess whether the sequence in which anthracyclines and taxanes are administered, as adjuvant or neoadjuvant chemotherapy, affects outcomes for women with early breast cancer. The results of this review could potentially guide the management of chemotherapy sequencing for women with early breast cancer requiring adjuvant or neoadjuvant chemotherapy. A previous systematic review examined this important topic, but since it was published further trials have been conducted (Bines 2014). This Cochrane Review complements the review by Bines 2014 by adding more recent trial results and critically appraising the included studies.
Objectives
To assess whether the sequence in which anthracyclines and taxanes are administered affects outcomes for people with early breast cancer receiving adjuvant or neoadjuvant therapy.
Methods
Criteria for considering studies for this review
Types of studies
All randomised controlled trials (RCT) that examined the sequence of administration of anthracyclines and taxanes for people with early breast cancer receiving adjuvant or neoadjuvant chemotherapy.
Types of participants
Aged 18 years or older, with early breast cancer suitable for adjuvant or neoadjuvant chemotherapy.
Types of interventions
Intervention
Taxane (docetaxel, paclitaxel or nab‐paclitaxel) chemotherapy administered before an anthracycline‐based chemotherapy. The same regimen of drugs were administered as the comparator arm in reverse sequence. We included studies in which concurrent interventions with any other non‐anthracycline‐based chemotherapy, granulocyte colony stimulating factor or trastuzumab were administered. We excluded studies in which concurrent interventions with radiotherapy or endocrine therapy were administered. Interventions could include:
-
docetaxel delivered intravenously at any dose weekly, every 14 days or every 21 days for three or four cycles;
-
paclitaxel delivered intravenously at any dose weekly for 12 weeks, every 14 days or 21 days for three or four cycles;
-
nab‐paclitaxel delivered intravenously at any dose weekly or every 21 days for three or four cycles.
Comparator
Anthracycline (doxorubicin, epirubicin or liposomal doxorubicin)‐based chemotherapy administered before taxane chemotherapy. The same regimen of drugs was administered as in the intervention arm but in reverse sequence. We included studies in which concurrent interventions with any non‐taxane chemotherapy or granulocyte colony stimulating factor or trastuzumab were administered. We excluded studies in which concurrent interventions with radiotherapy or endocrine therapy were administered. Comparisons could include:
-
doxorubicin delivered intravenously at any dose every 14 days or every 21 days for three or four cycles;
-
epirubicin delivered intravenously at any dose every 14 days or every 21 days for three or four cycles;
-
liposomal doxorubicin delivered at any dose or frequency for three or four cycles.
Types of outcome measures
Primary outcomes
Neoadjuvant and adjuvant setting
-
Overall survival, defined as the time from randomisation/study entry until death from any cause.
Secondary outcomes
Neoadjuvant setting
-
Disease‐free survival, defined as time from surgery to first recurrence of breast cancer at any site, development of new ipsilateral (same breast as previous breast cancer) or contralateral (different breast to previous breast cancer) breast cancer or second non‐breast malignant disease with the exception of basal cell or squamous cell carcinoma of the skin, haematological cancers or carcinoma in situ of the cervix.
-
Pathological complete response (pCR), defined as no invasive carcinoma in the breast or axillary lymph nodes (ypT0/isypN0 (TNM staging; AJCC 2010)) after neoadjuvant therapy.
-
Standardised Residual Cancer Burden score (RCB; MD Anderson Cancer Center).
-
Degree of response after neoadjuvant therapy:
-
-
no invasive or in situ carcinoma in the breast or axillary lymph nodes (ypT0ypN0);
-
no invasive carcinoma in breast (ypT0/isypN0/+);
-
no invasive carcinoma in axillary lymph nodes (ypN0).
-
Adjuvant setting
-
Disease‐free survival, defined as time from randomisation to first recurrence of breast cancer at any site, development of new ipsilateral or contralateral breast cancer or second non‐breast malignant disease with the exception of basal cell or squamous cell carcinoma of the skin, haematological cancers or carcinoma in situ of the cervix.
Neoadjuvant and adjuvant setting
-
Adverse events classified according to the World Health Organization (WHO) or National Cancer Institute Common Terminology Criteria for Adverse Events (NCI‐CTCAE):
-
-
febrile neutropenia;
-
neutropenia;
-
cardiac toxicity;
-
pulmonary toxicity;
-
neurotoxicity;
-
haematological malignancy;
-
treatment‐related death.
-
-
Treatment adherence, defined as delay in treatment or dose reductions, or both, or early cessation of treatment.
-
Quality of life measured using a validated instrument.
Main outcomes in 'Summary of findings' table for summarising the evidence
The following outcomes were included in a 'Summary of findings' table using the GRADE approach (Schünemann 2011).
-
Overall survival (mortality).
-
Disease‐free survival (recurrence).
-
pCR for neoadjuvant setting.
-
Treatment adherence.
-
Adverse events including grade 3/4 neutropenia and neurotoxicity.
-
Quality of life.
Search methods for identification of studies
Electronic searches
We searched the following databases on 1 February 2018.
-
The Cochrane Breast Cancer's Specialised Register. Details of the search strategies used by the Cochrane Breast Cancer Group (CBCG) for the identification of studies and the procedure used to code references are outlined on the Group's website (Cochrane Breast Cancer Group’s Specialised Register). We extracted and considered for inclusion in the review trials with the key words "breast neoplasm; breast cancer; breast carcinoma; breast adenocarcinoma; breast tumour/tumor; adjuvant; neoadjuvant; anthracycline; taxane; chemotherapy; docetaxel; paclitaxel; nab‐paclitaxel; cabazitaxel; doxorubicin; epirubicin; daunorubicin; idarubicin and valrubicin".
-
Cochrane Central Register of Controlled Trials (CENTRAL; Issue 1, 2018; in the Cochrane Library; Appendix 1).
-
MEDLINE OvidSP (top up search to complement CBCG's Specialised Register; Appendix 2).
-
Embase OvidSP (from 1974; Appendix 3).
-
WHO International Clinical Trials Registry Platform (ICTRP) search portal for all prospectively registered and ongoing trials (apps.who.int/trialsearch/Default.aspx; Appendix 4).
-
ClinicalTrials.gov (clinicaltrials.gov/; Appendix 5).
Searching other resources
-
Bibliographic searching.
We tried to identify further studies from the reference lists of identified relevant trials or reviews. We obtained a copy of the full article for each reference reporting a potentially eligible trial. Where this was not possible, we contacted authors to obtain additional information (as outlined in the 'Notes' section in the Characteristics of included studies table).
-
Searching conference proceedings.
We searched the following conference proceedings in Embase (via OvidSP) from 2006 to 1 February 2018 to identify relevant abstracts:
-
American Society of Clinical Oncology Annual Scientific Meeting;
-
European Society for Medical Oncology Annual Scientific Meeting;
-
San Antonio Breast Cancer Symposium;
-
American Society of Clinical Oncology Breast Cancer Symposium;
-
European Breast Cancer Conference.
Data collection and analysis
Selection of studies
We merged the search results using reference management software (e.g. Endnote) and uploaded the records into Covidence (Covidence). Two review authors (MZ and AG) independently screened titles and abstracts, and assessed full‐text articles for potentially relevant studies for inclusion. We resolved any disagreement about the eligibility of a study by discussion and, if required, by consulting a third review author (NW). We recorded our reasons for the exclusion of any potentially relevant studies in the Characteristics of excluded studies table. We imposed no language restrictions. If required for future review updates, we will obtain translations of relevant studies. We recorded the selection process in a PRISMA flow diagram.
Data extraction and management
Two review authors (MZ and MW) independently extracted data using standard extraction forms tested and refined for this review. We collected the following information: study design, participants, setting, interventions, follow‐up, sources of funding, notable conflicts of interest of trial authors and outcomes.
We extracted at least the following items.
-
General information: title, authors, contact details, location, publication status, language, year of publication, source of funding.
-
Trial characteristics: study design, length of follow‐up.
-
Participants: inclusion and exclusion criteria, sample size, baseline characteristics and similarity at baseline, neoadjuvant/adjuvant setting, hormone receptor status, HER2 in‐situ hybridisation status, withdrawals, losses to follow‐up.
-
Intervention and comparator: drug, dose, timing and number of cycles, dose reductions, dose omissions.
-
Adverse events and toxicities.
-
Outcomes: hazard ratios (HR) and 95% confidence intervals (CI), log rank Chi² statistic, P values from log‐rank test, number of events.
We resolved any disagreement regarding the extraction of quantitative data by discussion and, if required, by consulting a third review author (NW, AG or DO'C). For studies with more than one publication, we collated data from each publication into a single data collection form and considered the final or updated version of each study the primary reference.
Assessment of risk of bias in included studies
Two review authors (MZ and MW) independently assessed the risk of bias for each study using Cochrane's 'Risk of bias' assessment tool, as outlined in the Cochrane Handbook for Systematic Reviews of Interventions (Chapter 8.5; Higgins 2011). We resolved any disagreements by discussion and, if needed, by consulting a third author (AG, NW or DO'C). We assessed the following sources of bias:
-
sequence generation;
-
allocation concealment;
-
blinding of participants, personnel;
-
blinding of outcome assessment for outcomes other than overall survival;
-
incomplete outcome data;
-
selective outcome reporting;
-
other sources of bias.
We described the 'Risk of bias' assessments in a 'Risk of bias' table (see Characteristics of included studies table).
Measures of treatment effect
For dichotomous outcomes (i.e. a variable with only two outcomes such as yes or no) – treatment adherence (i.e. dose delays, dose reductions, one‐dose reduction, did not receive planned number of cycles), pCR and adverse events – we reported the treatment effect as a risk ratio (RR) and 95% CI. We planned to report the number needed to treat for an additional beneficial outcome if there was a significant difference in pCR. RRs less than 1.0 favour the administration of taxanes first for adverse outcomes (i.e. lack of treatment adherence, adverse events) or favour administration of anthracyclines first for beneficial outcomes (i.e. pCR). The reverse is the case for RRs greater than 1.0.
In review updates, for continuous outcomes (where measurement is continuous on a numerical scale) – quality of life – we will report the treatment effect as a standardised mean difference and 95% CI as quality of life is expected to be measured using different scales. If all studies use the same scale, we will report the mean difference. In the current review, only one study measured quality of life but did not report any numerical data. There was a second continuous outcome reported, mean dose intensity for treatment adherence, but a measure of variation was not reported for this outcome. Therefore, the data could not be pooled in a meta‐analysis and are presented in a separate table for completeness (see Table 1 and Table 2).
| Study | Adherence measure reported | Taxane followed by anthracycline (n/N) | Anthracycline followed by taxane (n/N) |
| Number of participants who received ≥ 90% of planned dose of paclitaxel | 121/142 (85.2%) | 124/138 (89.5%) | |
| Number of participants who received ≥ 90% of planned dose of FEC | 123/142 (86.6%) | 103/138 (74.6%) | |
| Received ≥ 20 weeks of the planned 24 weeks of trastuzumaba or ≥ 10 weeks of planned 12 weeks of trastuzumabb | 127/142 (89.4%)a | 126/138 (91.3%)b | |
| Dose reductions | 46/142 (32.4%) | 55/138 (39.9%) | |
| Discontinued due to intolerance (severe toxic effects) | 9/142 (6.3%) | 9/138 (6.5%) | |
| NR | NR | NR | |
| Dose intensityc | Taxane: 97.% Doxorubicin: 94.2% | Doxorubicin: 95.2% Taxane: 89.2% | |
| Cycle delivered dose intensityd | 83% | 86% | |
| Percentage of cycles with dose reductions | Taxane → epirubicin: 3% | Epirubicin → taxane: 6% | |
| Percentage of cycles with dose delays | Taxane → epirubicin: 15% | Epirubicin → taxane: 15% | |
| NR | NR | NR |
FEC: fluorouracil, epirubicin and cyclophosphamide; n: number of participants with delay or dose reduction, etc; N: denominator; NR: not reported.
a≥ 20 weeks of the planned 24 weeks of trastuzumab.
b≥ 10 weeks of planned 12 weeks of trastuzumab.
cCalculated as percentage of planned dose intensity delivered
dCalculated as mean of the individual drug delivered dose intensities planned for that cycle; course drug delivered dose as mean of course drug delivered doses over planned number of cycles, per participant.
| Study | Term used to represent dose intensity | Taxane followed by anthracycline | Anthracycline followed by taxane |
| Mean relative dose intensitya | Docetaxel: 95.2% FEC: 98.9% | Docetaxel: 94.2% FEC: 97.8% | |
| Median relative dose intensity | Docetaxel: 96% (range: 25–104) Epirubicin: 96% (range: 0–102) Cyclophosphamide: 95% (range: 0–102) | Docetaxel: 81% (range: 0–102) Epirubicin: 97% (range: 66–102) Cyclophosphamide: 97% (range: 61–102) | |
| Mean relative dose intensity | Docetaxel: 96% Doxorubicin: 95% | Docetaxel: 82% Doxorubicin: 96% | |
| Mean dose intensityb | Docetaxel: 99% FEC: 97% | Docetaxel: 97% FEC: 97% | |
| Wildiers 2009b (dose‐dense) | Mean dose intensityb | Docetaxel: 111% FEC: 143% | Docetaxel: 108% FEC: 146% |
FEC: fluorouracil, epirubicin, cyclophosphamide.
aData used based on the reporting of findings in the abstract and Table 2 in the trial publication. The docetaxel and FEC percentages were switched in the text in the Results section. Therefore, the consistency of results presented in Table 2 and abstract were considered to be the most accurate reflection of the results.
bDefined as the dose intensity achieved in intervention or comparator arm for a participant who received all intended doses with no cycle delay or dose reduction.
For time‐to‐event outcomes – disease‐free survival and overall survival – we reported the treatment effect as a HR and 95% CI. For those studies that reported overall survival or disease‐free survival data, we extracted the HR and associated variances directly from the trial publications. In review updates, if this is not possible, we will obtain the data indirectly, using methods described by Parmar 1998 or Tierney 2007. We will record the use of indirect methods in the Notes section of the Characteristics of included studies table. We reported the ratios of treatment effects for response so that HRs less than 1.0 favoured the administration of taxanes first and HRs greater than 1.0 favoured the administration of anthracyclines first.
Unit of analysis issues
In the neoadjuvant setting, Neo‐TAnGo 2014 was a four‐arm study that randomised women to anthracycline then paclitaxel or reverse order with or without gemcitabine. For the purpose of this review, we combined the two intervention arms (taxane followed by anthracycline with or without gemcitabine) and the two comparison arms (anthracycline followed by taxane with or without gemcitabine).
In the adjuvant setting, AERO B03 2007 was a three‐arm study and we only included the data relating to treatments with both a taxane and anthracycline. The Wildiers study was a four‐arm study that randomised women to either conventional chemotherapy (taxane followed by anthracycline or in reverse order) or dose‐dense treatment (taxane followed by anthracycline or in reverse order). We used data from all four treatments arms and split them into two treatment comparisons: Wildiers 2009a and Wildiers 2009b.
Dealing with missing data
We contacted authors of some included studies in writing to request missing data (e.g. overall survival, disease‐free survival and relative dose intensity outcome data) (Abe 2013; AERO B03 2007; Alamgeer 2014; Puhalla 2008).
Assessment of heterogeneity
We assessed the degree of heterogeneity by visual inspection of forest plots, the I² statistic (Higgins 2003), and the Chi² test for heterogeneity (Cochran 1954). We considered there to be substantial statistical heterogeneity if the I² statistic was greater than 50% and the P value was less than 0.10 for the Chi² test for heterogeneity. For this initial review, as the expected number of included trials was small and, therefore, we did not expect significant heterogeneity, we used the fixed‐effect model. In review updates, we plan to use the random‐effects model (see Data synthesis) for pooling estimates across trials unless the results are affected by the inclusion of small studies. If this occurs, then we will also use the fixed‐effect model and compare the results.
Assessment of reporting biases
As the review included fewer than 10 studies, we did not formally assess publication bias using funnel plots. If additional studies are available in review updates, we will assess publication or other bias by visual examination of funnel plot symmetry provided there are at least 10 studies in the meta‐analysis (Higgins 2011). Where possible, we will review the protocols of included studies to assess outcome reporting bias.
Data synthesis
We pooled data using the fixed‐effect model as sufficiently similar (in terms of population and intervention) studies were available to provide meaningful results in the neoadjuvant and adjuvant settings. We performed all analyses using Review Manager 5 software (Review Manager 2014).
For dichotomous outcomes, we used the fixed‐effect method (Mantel‐Haenszel; Mantel 1959). In review updates, we will use the random‐effects method (DerSimonian 1986).
Data could not be pooled for continuous outcomes in this review. However, in review updates, for continuous outcomes, we will use the random‐effects with inverse variance method (Deeks 2011).
For time‐to‐event outcomes, we used the fixed‐effect with inverse variance method. In review updates, we will use the random‐effects (DerSimonian and Laird with inverse‐variance) method.
In review updates, if we are concerned about the effect of small studies on the random‐effects meta‐analysis, we will compare the fixed‐effect and random‐effects estimates. If results from the fixed‐effect and random‐effects analysis are different, we will perform sensitivity analyses to consider restricting the meta‐analysis to include the larger studies only.
'Summary of findings' table
Two review authors (MZ and MW) used the GRADE approach to assess the certainty of the evidence for the following outcomes: overall survival (event: risk of death), disease‐free survival (event: risk of recurrence), pCR, treatment adherence, adverse events and quality of life. We used GRADEpro GDT software to develop the 'Summary of findings' tables and followed GRADE guidance (Schünemann 2011).
To calculate the absolute risk for the control group for time‐to‐event outcomes, we derived the event rate at a specific time point (three‐year risk for both overall survival and disease‐free survival) from the Kaplan‐Meier curve in the Neo‐TAnGo 2014 study; only the neoadjuvant studies reported data for overall survival and disease‐free survival. We entered the event rate at three years and the pooled HR into GRADEpro GDT and estimated the corresponding absolute risk for the intervention group at three years by the GRADEpro GDT software.
Subgroup analysis and investigation of heterogeneity
We presented data separately for participants receiving neoadjuvant and adjuvant chemotherapy. We presented data from one or two trials separately for the following prespecified patient subgroups:
-
people with positive versus negative HER2 status;
-
people with positive, negative or triple negative hormone receptor status.
In review updates, we will conduct tests for interaction to determine whether the sequence in which anthracyclines and taxanes are administered has a significantly different effect in subgroups.
Sensitivity analysis
Due to the limited data available, the proposed sensitivity analysis was not undertaken. In review updates, we plan to perform the following sensitivity analysis:
-
risk of bias: low versus high/unclear risk of bias. We will assign an overall unclear/high risk of bias to studies in which we have judged at least four of the seven domains to have unclear/high risk of bias.
Results
Description of studies
Results of the search
We outlined the search process in the PRISMA flow diagram (Figure 1; Moher 2009). We identified 4564 records through searching CBCG's Specialised Register, CENTRAL, MEDLINE and Embase (that included American Society of Clinical Oncology and San Antonio Breast Cancer Symposium conference proceedings), and an additional 914 records from the WHO ICTRP and ClinicalTrials.gov. After removal of duplicate records, from 5478 unique records we excluded 5444 records based on review of the titles and abstracts retrieved. We retrieved 34 full‐text articles, abstracts or clinical trial records and on review excluded 15 records that did not meet the selection criteria (Characteristics of excluded studies table). The predominant reason for exclusion was that studies did not compare the reverse order of taxanes and anthracyclines in two treatment arms. There was one additional record relating to an abstract from a cancer conference and we wait for the results to be published. This record has been added to the Characteristics of studies awaiting classification table. The remaining 20 records related to:
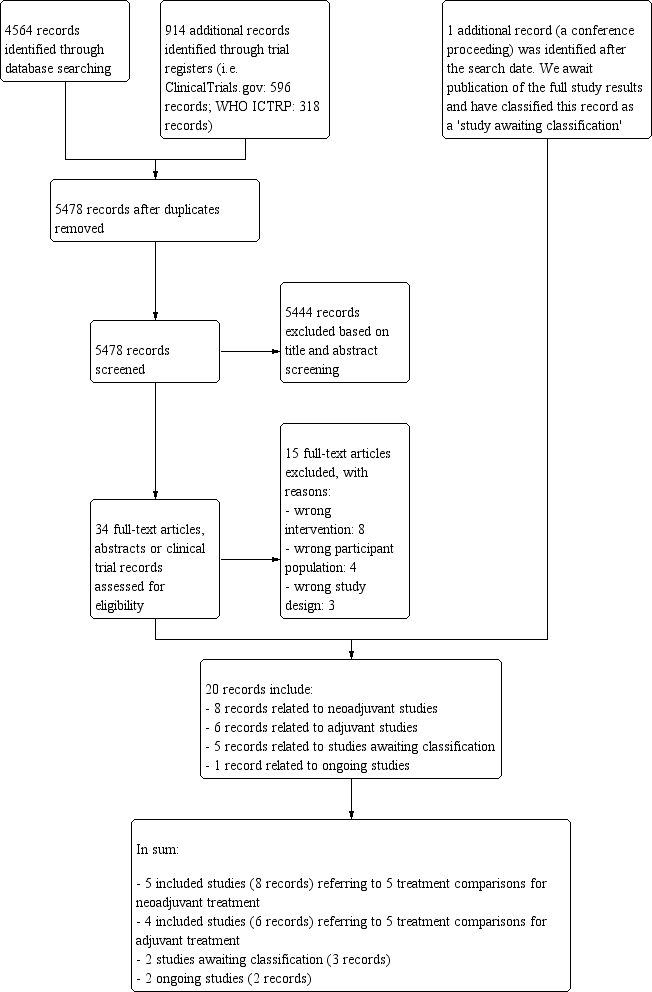
Study flow diagram.
-
five included studies (eight records) referring to five treatment comparisons in the neoadjuvant setting (ACOSOG Z1041 2013; Alamgeer 2014; Miller 2005; Neo‐TAnGo 2014; Stearns 2003);
-
four included studies (six records) referring to five treatment comparisons in the adjuvant setting (Abe 2013; AERO B03 2007; Puhalla 2008; Wildiers (Wildiers 2009a; Wildiers 2009b));
-
three studies awaiting classification (five records: Masuda 2012; NeoSAMBA; Taghian 2005); and
-
one ongoing study (one record: UMIN000003283).
Included studies
See Characteristics of included studies table.
Neoadjuvant studies
The five included studies involved 1415 participants (ACOSOG Z1041 2013; Alamgeer 2014; Miller 2005; Neo‐TAnGo 2014; Stearns 2003). Three studies used paclitaxel (ACOSOG Z1041 2013; Neo‐TAnGo 2014; Stearns 2003), and two studies used docetaxel (Alamgeer 2014; Miller 2005), as taxane chemotherapy. Two studies used single agent doxorubicin (Miller 2005; Stearns 2003), and three studies used epirubicin as anthracycline chemotherapy (ACOSOG Z1041 2013; Alamgeer 2014; Neo‐TAnGo 2014). Two studies used epirubicin with cyclophosphamide and fluorouracil (ACOSOG Z1041 2013; Alamgeer 2014), and one study used epirubicin and cyclophosphamide (Neo‐TAnGo 2014). One study used paclitaxel every two weeks with or without gemcitabine (Neo‐TAnGo 2014).
In terms of the characteristics of trial participants, one study included T1‐3, N0‐3 disease (Alamgeer 2014), one study included only participants with tumour size greater than 20 mm (T2) with or without axillary lymph node involvement (Neo‐TAnGo 2014), and two studies included participants with either tumour size greater than 20 mm (T2) or lymph node involvement (ACOSOG Z1041 2013; Miller 2005). One study included participants with stage IV disease but presented data separately for stage III disease and could be used (Stearns 2003). In all studies, the majority of trial participants had axillary lymph node‐positive disease. One study included HER2‐positive participants only (ACOSOG Z1041 2013), and another study was designed and commenced prior to the introduction of trastuzumab (Neo‐TAnGo 2014). All studies had included participants whose breast cancer was HER2‐positive, hormone receptor‐positive or hormone receptor‐negative and included both premenopausal and postmenopausal women.
In relation to the outcomes assessed in the studies, the primary outcome for two of the studies was to identify a marker that correlated with tumour response to chemotherapy (Alamgeer 2014; Miller 2005). One of these studies also reported overall and disease‐free survival (Alamgeer 2014). All studies used different definitions of pCR. Four studies reported on no invasive cancer in the breast or axilla (ACOSOG Z1041 2013; Miller 2005; Neo‐TAnGo 2014; Stearns 2003). Only one study reported no invasive or in situ carcinoma in the breast or axilla and was included in a separate analysis for pCR (Alamgeer 2014). No studies reported on RCB or quality of life outcomes.
One study was funded solely by a government grant (ACOSOG Z1041 2013), and four studies were supported by a government or cancer society grant combined with a research grant from a pharmaceutical company (Alamgeer 2014; Miller 2005; Neo‐TAnGo 2014; Stearns 2003).
Adjuvant studies
The four included studies involved 280 participants and contributed to five treatment comparisons (Abe 2013; AERO B03 2007; Puhalla 2008; Wildiers (Wildiers 2009a; Wildiers 2009b)). All studies used docetaxel as taxane chemotherapy. Two studies with three treatment comparisons used epirubicin with cyclophosphamide and fluorouracil (Abe 2013; Wildiers (Wildiers 2009a; Wildiers 2009b)), one study used epirubicin with cyclophosphamide (AERO B03 2007), and one study used adriamycin and cyclophosphamide (Puhalla 2008). Three treatment comparisons included dose‐dense regimens (where at least the same amount of chemotherapy was given over a shorter period of time, i.e. 300 mg/m² in total given in four cycles of fortnightly docetaxel at 75 mg/m² rather than three cycles of three‐weekly docetaxel at 100 mg/m²) (AERO B03 2007; Puhalla 2008; Wildiers 2009b). The Wildiers study had two treatment comparisons involving dose dense and conventional regimen (Wildiers 2009a; Wildiers 2009b). There were two treatment comparisons that compared conventional three‐weekly regimens (Abe 2013; Wildiers 2009a).
For two studies, participants had to have axillary lymph node involvement (AERO B03 2007; Puhalla 2008), and for the other two studies they did not (Abe 2013; Wildiers (Wildiers 2009a; Wildiers 2009b)). For two studies, HER2‐positive participants were able to participate if they were ineligible for or chose not to participate in adjuvant trastuzumab trials (Abe 2013; Puhalla 2008). One study did not report the HER2 status of participants (Wildiers (Wildiers 2009a; Wildiers 2009b)). Overall, a small proportion (12%) of the included participants had HER2‐positive disease.
In relation to the outcomes assessed in the studies, all studies were primarily investigating toxicity and treatment adherence. One study collected data on overall and disease‐free survival (AERO B03 2007). One study reported collecting data on quality of life and made a brief statement of the findings in the Discussion section of the published article (Puhalla 2008); numerical data were not provided.
One study provided no information about funding (Abe 2013), one study was supported by a government or cancer society grant combined with a research grant from industry (AERO B03 2007), and two studies were supported with grants from a pharmaceutical company (Puhalla 2008; Wildiers (Wildiers 2009a; Wildiers 2009b)).
Excluded studies
We excluded 15 studies (Characteristics of excluded studies table). The most common reason for exclusion was that they were not evaluating the sequencing of taxanes and anthracyclines (Akashi‐Tanaka 2017; Anonymous 2001; Buzdar 2004; Earl 2003; Skarlos 2012; Thomas 2017; Wildiers 2006). The second most common reason was inclusion of the wrong participant population (Cresta 2001; Focan 2005; SWOG S0800; Zoli 2005). The third most common reason was that they were not RCTs, rather they were either non‐randomised or retrospective studies (Cardoso 2001; Fabiano 2002). One study used different anthracycline regimens in the comparison arms when sequencing taxane (Guarneri 2010), and one study was a meta‐analysis (Albain 2012).
Studies awaiting classification
The Masuda 2012 study reported results in an abstract only. The study examined the sequence of treatments for women with HER2‐positive breast cancer in the neoadjuvant setting. There were insufficient details provided in the abstract and we await the complete trial publication. We contacted the trialists in May 2018 and we received no reply.
The Taghian 2005 study was reported in two publications though neither reported pCR (although this was listed in the clinical trials registry record), or overall survival and disease‐free survival for each treatment group. We contacted trialists in August 2018 and they responded that they have not yet analysed the clinical outcome data for each treatment group, though they intend to do so soon. This will be included in a review update.
The NeoSAMBA study was identified through searches of the clinical trial registry databases and after the search date of this review, it was noted that the study reported preliminary results in the form of a conference abstract. We await the full‐text publication of this study in 2019. The study examined the sequence of treatments for women with locally advanced HER2‐negative breast cancer and the primary outcome was pCR and secondary outcomes included disease‐free survival and overall survival.
Ongoing studies
We identified one ongoing neoadjuvant study through searches of the WHO ICTRP and ClinicalTrials.gov databases (UMIN000003283; Characteristics of ongoing studies table).
Risk of bias in included studies
Figure 2 shows a summary of the risk of bias judgements of the included studies for each 'Risk of bias' domain. For each risk of bias domain, we combined the judgements for neoadjuvant and adjuvant studies. A summary of risk of bias assessments for each treatment setting is provided at the end of this section.

Risk of bias summary: review authors' judgements about each risk of bias item for each included study.
Allocation
Random sequence generation
The nine studies, relating to 10 treatment comparisons in the neoadjuvant and adjuvant settings, were described as randomised. Eight studies reporting nine treatment comparisons described the method of random sequence generation adequately (i.e. with low risk of bias; ACOSOG Z1041 2013; AERO B03 2007; Alamgeer 2014; Miller 2005; Neo‐TAnGo 2014; Puhalla 2008; Stearns 2003; Wildiers (Wildiers 2009a; Wildiers 2009b)). These studies used a biased coin minimisation algorithm, stratified randomisation or minimisation. For one study, there was insufficient information to accurately assess the method of random sequence generation (Abe 2013); the study was at unclear risk of bias.
Allocation concealment
Four studies, reporting five treatment comparisons, were at low risk of bias for allocation concealment. These studies described central randomisation systems (ACOSOG Z1041 2013; Neo‐TAnGo 2014; Puhalla 2008; Wildiers (Wildiers 2009a; Wildiers 2009b)). Five studies did not describe methods of allocation concealment or did not provide sufficient detail in the trial publication and were at unclear risk of bias (Abe 2013; AERO B03 2007; Alamgeer 2014; Miller 2005; Stearns 2003).
Blinding
Blinding of participants and personnel
Five studies, reporting six treatment comparisons, were described as open label (ACOSOG Z1041 2013; Alamgeer 2014; Neo‐TAnGo 2014; Puhalla 2008; Wildiers (Wildiers 2009a; Wildiers 2009b)), while four studies provided no information in the trial publication and were likely to have been open label (Abe 2013; AERO B03 2007; Miller 2005; Stearns 2003). Performance bias was unlikely to be significant given that participants received both drug treatments just in reverse order. Therefore, performance bias was not viewed to be serious and studies were judged at low risk of bias for this domain.
Blinding of outcome assessments
We assessed detection bias for each outcome: overall survival, disease‐free survival, pCR (for neoadjuvant studies only), toxicity and treatment adherence (these outcomes were combined because grade of toxicity is entwined with treatment adherence, i.e. a drug dose is reduced or delayed, etc if high‐grade toxicities occur) and, quality of life.
The assessment of overall survival and disease‐free survival was perceived not be biased by a lack of blinding. Therefore, the five studies that collected or reported (or both) overall survival (ACOSOG Z1041 2013; AERO B03 2007; Alamgeer 2014; Neo‐TAnGo 2014; Stearns 2003), and the five studies that collected or reported (or both) on disease‐free survival (ACOSOG Z1041 2013; AERO B03 2007; Alamgeer 2014; Neo‐TAnGo 2014; Stearns 2003), were at low risk of bias.
For pCR, there was a lack of blinding perceived to be unlikely to lead to material bias given that the assessment of pCR by a pathologist is an objective assessment. In one study, two independent assessors determined pCR (Neo‐TAnGo 2014); in one study, one independent assessor determined pCR (Miller 2005); while the remaining three studies did not use an independent assessor (ACOSOG Z1041 2013; Alamgeer 2014; Stearns 2003). Overall, all studies were at low risk of bias.
For outcome measures that were more likely to be influenced by a lack of blinding, that is, toxicity and treatment adherence, we considered for each study whether outcome assessments were confirmed by independent panels/adjudication committees and how toxicity outcomes were measured (e.g. blood tests). Most studies that assessed one or more of these outcomes had unclear risk of bias as there was no independent clinical review group and the toxicity measure collected (e.g. neuropathy) may have been influenced by the lack of blinding (Abe 2013; ACOSOG Z1041 2013; AERO B03 2007; Miller 2005; Neo‐TAnGo 2014; Puhalla 2008; Stearns 2003). However, one study reporting two treatment comparisons (Wildiers (Wildiers 2009a; Wildiers 2009b)) reported only two toxicity outcomes relevant to this review – febrile neutropenia and neutropenia. These toxicities were diagnosed using blood tests and so were less likely to be influenced by the lack of blinding; therefore, they were at low risk of bias for this domain.
Only one study collected and reported quality of life information (Puhalla 2008). Participants who knew their treatment allocation completed quality of life questionnaires. However, all participants in the same study received the same treatments though in a different order; therefore, the study was at low risk of bias as lack of blinding was unlikely to influence participant‐reported responses.
Incomplete outcome data
All studies described minimal participant loss during the study and accounted for these losses; therefore, they were at low risk of bias (ACOSOG Z1041 2013; Abe 2013; AERO B03 2007; Alamgeer 2014; Miller 2005; Neo‐TAnGo 2014; Puhalla 2008; Stearns 2003; Wildiers (Wildiers 2009a; Wildiers 2009b)).
Selective reporting
Seven studies, reporting eight treatment comparisons, had either reported results for those outcomes listed in the methods section of the trial publication (Abe 2013; Miller 2005; Wildiers (Wildiers 2009a; Wildiers 2009b)) or a trial registration record with the outcomes as included in the methods and results section of the trial publication (ACOSOG Z1041 2013; Alamgeer 2014; Neo‐TAnGo 2014; Puhalla 2008). ACOSOG Z1041 2013 and Neo‐TAnGo 2014 reported some additional toxicity outcomes, while in two trials, there were some changes to the primary or secondary outcomes with both adding new and important outcomes (Alamgeer 2014: pCR; Puhalla 2008: relative dose intensity and quality of life). Overall, we judged these seven studies (eight treatment comparisons) at low risk of bias. AERO B03 2007 was at high risk of bias for this domain as data related to both overall survival and disease‐free survival were not reported despite the study being completed in 2004. We contacted the authors for data and received no response (as of July 2018). Stearns 2003 was at high risk of bias due to having reported important outcomes (overall survival and recurrence) but omitted reporting the data separately for each treatment group and, therefore, the data could not be used for the treatment comparisons.
Other potential sources of bias
All studies were generally free of other sources of bias.
Summary of risk of bias by treatment setting
Neoadjuvant studies
Overall, the risk of bias was low for most domains across the neoadjuvant studies. The two main exceptions related to the lack of, or insufficient details to assess, allocation concealment (in three out of the five studies), and uncertainty in the risk of bias when assessing toxicity/treatment adherence outcomes when studies were unblinded (in all four studies reporting on this outcome). All of the studies collected data on prespecified outcomes. However, one study did not report important efficacy outcome data separately for each treatment group (Stearns 2003).
Adjuvant studies
Overall, the risk of bias was low for most domains with some concern in risk of bias being noted due to unblinding of outcome assessments for toxicity and treatment adherence. Although all studies reported the prespecified outcomes, one study omitted to report important outcome data that were collected in 2004 (AERO B03 2007). We contacted the trial authors in July 2018 and are yet to receive a reply. Therefore, we rated this study at high risk of bias for selective outcome reporting.
Effects of interventions
See: Summary of findings for the main comparison Taxane followed by anthracyclines compared to anthracyclines followed by taxane in neoadjuvant therapy for early breast cancer; Summary of findings 2 Taxane followed by anthracyclines compared to anthracyclines followed by taxane in adjuvant therapy for early breast cancer
Neoadjuvant setting
Five included studies (eight records) referred to five treatment comparisons in the neoadjuvant setting (ACOSOG Z1041 2013; Alamgeer 2014; Miller 2005; Neo‐TAnGo 2014; Stearns 2003). See: summary of findings Table for the main comparison.
Overall survival
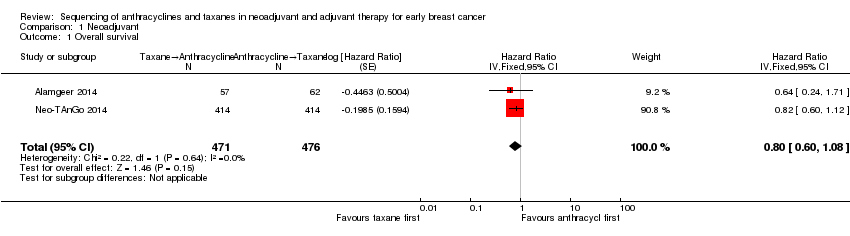
Four studies collected data on overall survival (ACOSOG Z1041 2013; Alamgeer 2014; Neo‐TAnGo 2014; Stearns 2003); however, data from one study are yet to be published (ACOSOG Z1041 2013), and one study did not report data separately for each treatment group (Stearns 2003). Based on data from two studies (947 participants), administering taxanes first probably resulted in little to no difference in overall survival compared to administering anthracyclines first (HR 0.80, 95% CI 0.60 to 1.08; moderate‐certainty evidence; Analysis 1.1; Figure 3). Only one study provided an indication of the number of deaths with Neo‐TAnGo 2014 reporting that more than 120 participants had died over the three‐year median follow‐up period.
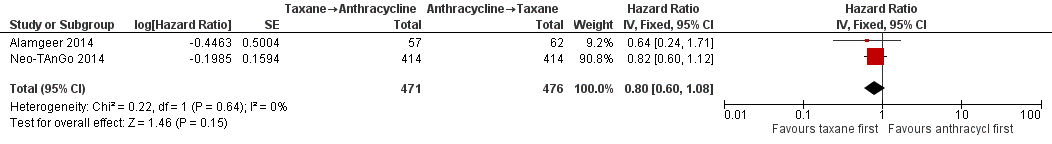
Forest plot of comparison: 1 Neoadjuvant, outcome: 1.1 Overall survival.
Disease‐free survival
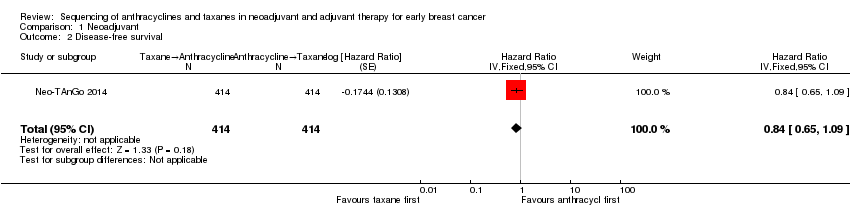
Three studies involving 1132 participants collected data on disease‐free survival (ACOSOG Z1041 2013; Neo‐TAnGo 2014; Stearns 2003), but only one study reported data (Neo‐TAnGo 2014). ACOSOG Z1041 2013 collected data but the data for this type of outcome are not yet mature to present and Stearns 2003 did not report data separately for each treatment group. Based on one study, administering taxanes first probably resulted in little to no difference in disease‐free survival compared to administering anthracyclines first (HR 0.84, 95% CI 0.65 to 1.09; 828 participants; moderate‐certainty evidence; Analysis 1.2; Figure 4).
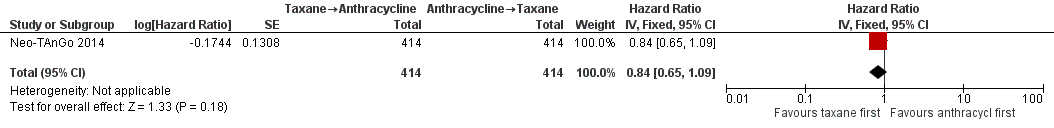
Forest plot of comparison: 1 Neoadjuvant, outcome: 1.2 Disease‐free survival.
Pathological complete response
All five studies provided some data relating to pathological response.
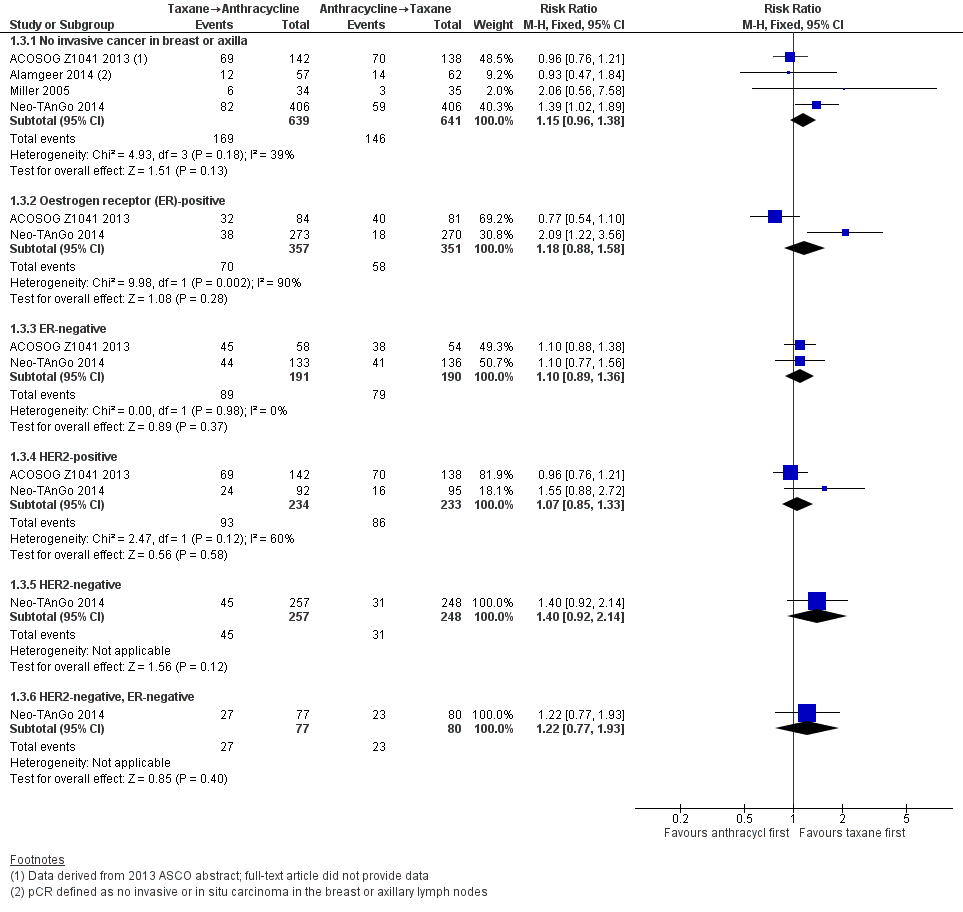
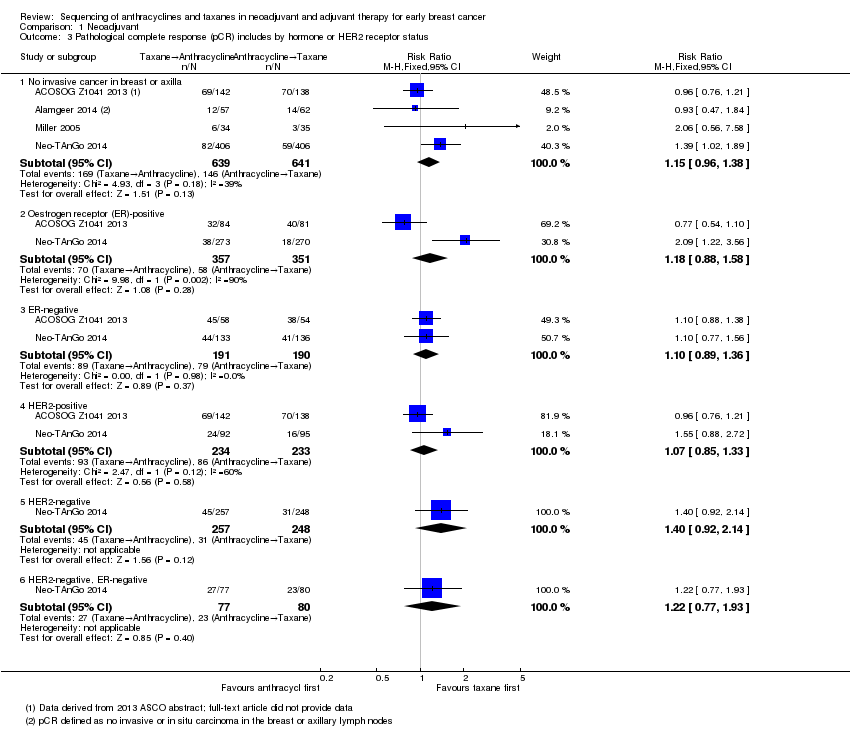
Four studies reported data on pathological response defined as the absence of cancer in the breast and axilla. Administering taxanes first resulted in little to no difference in pCR compared to administering anthracyclines first (RR 1.15, 95% CI 0.96 to 1.38; 1280 participants; 4 studies; high‐certainty evidence; Analysis 1.3; Figure 5); however, there appeared to be a trend in favour of taxanes first.

Forest plot of comparison: 1 Neoadjuvant, outcome: 1.3 Pathological complete response (pCR) includes by hormone or HER2 receptor status.
Two studies provided data by hormone receptor or HER2 (or both) status (ACOSOG Z1041 2013; Neo‐TAnGo 2014). Overall, receptor status did not appear to affect the results (Analysis 1.3); however, ACOSOG Z1041 2013 was confounded with participants receiving trastuzumab throughout the trial period in the taxanes followed by anthracycline treatment arm while the other treatment group received trastuzumab only after receiving anthracyclines. Therefore, results need to be considered cautiously.
One study defined pathological response as the absence of invasive or in situ carcinoma in the breast or axillary lymph nodes (Alamgeer 2014). Based on one study, administering taxanes first probably resulted in little to no difference in pathological response compared to anthracyclines first (RR 0.93, 95% CI 0.47 to 1.84; 119 participants; Analysis 1.4).
Two studies reported data relating to absence of invasive cancer in the breast and found that there was probably little or no difference between groups (RR 0.97, 95% CI 0.79 to 1.20; 306 participants; Analysis 1.4). One study reported data relating to absence of invasive cancer in the axilla and indicated a higher response in the taxane first group compared to anthracycline first group (RR 1.66, 95% CI 1.03 to 2.66; 282 participants; Analysis 1.4).
Standardised Residual Cancer Burden score
None of the studies reported standardised RCB score.
Adverse events
Febrile neutropenia
One study collected data on febrile neutropenia (grade 3) but did not report data separately for each treatment group (Stearns 2003). In total, 5/20 women reported grade 3 neutropenic fever.
Neutropenia
Four studies collected data on neutropenia (ACOSOG Z1041 2013; Miller 2005; Neo‐TAnGo 2014; Stearns 2003); however, only one study reported the data in a useable manner (ACOSOG Z1041 2013). This was because Stearns 2003 did not report data separately for each treatment group (i.e. in total, 6/20 women reported grade 3/4 neutropenia); Miller 2005 and Neo‐TAnGo 2014 presented the incidence of neutropenia for each drug within each treatment arm and accumulating these data across a treatment arm may lead to double‐counting of toxic events.
One study presented usable data (ACOSOG Z1041 2013). Administering taxanes first probably resulted in little to no difference in risk of neutropenia compared to administering anthracyclines first (RR 1.25, 95% CI 0.86 to 1.82; 280 participants; moderate‐certainty evidence; Analysis 1.5). There were 45 events in 142 participants in the taxane first arm and 35 events in 138 participants in the anthracycline first arm.
Cardiac toxicity
One study presented data on cardiac toxicity (ACOSOG Z1041 2013). Administering taxanes first appeared to result in little to no difference in risk of cardiac toxicity compared to administering anthracyclines first (RR 0.97, 95% CI 0.29 to 3.28; 280 participants; data not shown). The study contributed results with 10 events in 280 participants and notably administered trastuzumab and anthracycline concurrently in the intervention arm.
Pulmonary toxicity
One study presented data on pulmonary toxicity (Neo‐TAnGo 2014). Administering taxanes first appeared to result in little to no difference in risk of pulmonary toxicity compared to administering anthracyclines first (RR 3.00, 95% CI 0.12 to 73.43; 828 participants; data not shown). The study reported one event of pneumonia in 828 participants.
Neurotoxicity
Three studies collected data on neurotoxicity (ACOSOG Z1041 2013; Neo‐TAnGo 2014; Stearns 2003). However, two studies contributed data for the analysis (ACOSOG Z1041 2013; Neo‐TAnGo 2014). Stearns 2003 did not report data separately for each treatment group (i.e. there was one case of peripheral neuropathy in 20 trial participants).
Based on two studies, administering taxanes first may have resulted in little to no difference in risk of neurotoxicity compared to administering anthracyclines first (RR 0.95, 95% CI 0.55 to 1.65; 1108 participants; low‐certainty evidence; Analysis 1.5). Time points and method of assessments for neurotoxicity were unclear and, therefore, the ability of these studies to meaningfully detect neurotoxicity remained unclear. Forty‐nine of 1108 participants reported grade 3 or grade 4 neurosensory difficulties.
Haematological malignancy
None of the studies reported haematological malignancy.
Treatment‐related death
Two studies reported treatment‐related death. Administering taxanes first appeared to result in little to no difference in the risk of treatment‐related death (RR 1.00, 95% CI 0.06 to 15.93; 1108 participants; Analysis 1.5). There were two treatment‐related deaths in 1108 participants. One death was due to neutropenic sepsis and pneumonia after the third dose of paclitaxel in the taxanes first arm while the other death was due to venous thromboembolism two days after the third dose of epirubicin and cyclophosphamide in the anthracyclines first arm.
Treatment adherence
Treatment adherence was reported using measures such as number of participants who received at least a certain percentage of the planned dose, received a certain number of weeks of planned cycles, dose reductions, dose intensity and cycle delivered dose intensity (CCDI). Due to the heterogeneity in reporting treatment adherence, Table 1 shows the results for the five studies that reported this outcome. Two studies reported dose intensity (Miller 2005; Neo‐TAnGo 2014), but with different measures (i.e. calculated either as percentage of planned dose intensity delivered (Miller 2005) or CDDI (Neo‐TAnGo 2014)). These two studies did not suggest a difference in dose intensity or in CDDI between the two treatment groups.
Data could be extracted and presented for the dose reduction outcome. One study reported dose reduction and administering taxanes first probably did not increase the risk of requiring dose reductions (RR 0.81, 95% CI 0.59 to 1.11; 280 participants; moderate‐certainty evidence; Analysis 1.6) (ACOSOG Z1041 2013).
Quality of life
None of the studies reported data on quality of life.
Adjuvant setting
Four included studies (six records) referring to five treatment comparisons in the adjuvant setting (Abe 2013; AERO B03 2007; Puhalla 2008; Wildiers (Wildiers 2009a; Wildiers 2009b)). See: summary of findings Table 2.
Overall survival
None of the studies presented data for overall survival. One study collected data but reported no results (AERO B03 2007).
Disease‐free survival
None of the studies presented data for disease‐free survival. One study collected data but reported no results (AERO B03 2007).
Adverse events
Febrile neutropenia
All four studies, involving five treatment comparisons, reported febrile neutropenia. Administration of taxanes first probably resulted in little to no difference in the risk of febrile neutropenia (RR 0.70, 95% CI 0.24 to 2.05; 4 studies with 5 treatment comparisons; 279 participants; moderate‐certainty evidence; Analysis 2.1). There were four cases of febrile neutropenia in 142 participants in the taxanes first arm and six cases of febrile neutropenia in 137 participants in the anthracyclines first arm.
Neutropenia
All four studies, involving five treatment comparisons, reported neutropenia (grade 3/4). Administration of taxanes first reduced the risk of grade 3/4 neutropenia when compared with anthracyclines first (RR 0.62, 95% CI 0.40 to 0.97; 4 studies with 5 treatment comparisons; 279 participants; high‐certainty evidence; Analysis 2.1). There were 23 events in 142 participants in the taxane first arm and 35 events in 137 participants in the anthracyclines first arm.
Cardiac toxicity
Two studies reported cardiac toxicity. Administration of taxanes first probably resulted in little to no difference in the risk of cardiac toxicity (RR 0.30, 95% CI 0.01 to 6.99; 2 studies; 120 participants; moderate‐certainty evidence; data not shown). There were no events in the taxane first group and one event in the anthracyclines first group in a total of 120 participants.
Pulmonary toxicity
One study reported pulmonary toxicity. Administration of taxanes first may have resulted in little to no difference in the risk of pulmonary toxicity (RR 0.33, 95% CI 0.01 to 7.85; 56 participants; moderate‐certainty evidence; data not shown). There were no events in the taxane first arm and one event in the anthracyclines first arm in a total of 56 participants.
Neurotoxicity
Three studies reported data for neurotoxicity. Administration of taxanes first may have resulted in little to no difference in the risk of neurotoxicity (RR 0.78, 95% CI 0.25 to 2.46; 162 participants; 3 studies; low‐certainty evidence; Analysis 2.1). There were four events in 83 participants in the taxane first arm and five events in 79 participants in the anthracyclines first arm.
Haematological malignancy
None of the studies reported haematological malignancy.
Treatment‐related death
One study reported treatment‐related death. There were no events in either group (64 participants; AERO B03 2007).
Treatment adherence
Treatment adherence was reported using a variety of measures. These included dose delays, dose reductions, one‐dose reductions, number of participants who did not receive the planned number of cycles (i.e. six or eight cycles) and dose intensity. The available data have been presented separately below.
Delay in treatment
Three studies involving four treatment comparisons reported delay in treatment (AERO B03 2007; Puhalla 2008; Wildiers (Wildiers 2009a; Wildiers 2009b)). Administration of taxanes first probably resulted in little to no difference in the risk of dose delays (RR 0.76, 95% CI 0.52 to 1.12; 238 participants; 3 studies with 4 treatment comparisons; moderate‐certainty evidence; Analysis 2.2). There were 31 dose delays in 121 participants in the taxane first arm compared to 39 dose delays in 117 participants in the anthracycline first arm.
Dose reduction
Two studies involving three treatment comparisons reported dose reductions (Puhalla 2008; Wildiers (Wildiers 2009a; Wildiers 2009b)). For the taxane component (docetaxel), the taxane first regimen probably reduced the number of dose reductions compared to anthracyclines first regimen (RR 0.33, 95% CI 0.15 to 0.73; 173 participants; 3 treatment comparisons; moderate‐certainty evidence; Analysis 2.3.1). Seven dose reductions occurred in 87 participants in the taxane first arm compared to 21 dose reductions in 86 participants in the anthracycline first taxane arm. For the anthracycline component (fluorouracil, epirubicin, cyclophosphamide), the taxane first regimen probably resulted in little to no difference in the number of dose reductions compared to anthracyclines first regimen (RR 0.98, 95% CI 0.18 to 5.44; 117 participants; 1 study, 2 treatment comparisons; moderate‐certainty evidence; Analysis 2.3.2).
One‐dose reduction
One study reported data on one‐dose reduction (AERO B03 2007). Administration of taxanes first probably resulted in little to no difference in the number of one‐dose reductions compared to the anthracyclines first regimen (RR 0.55, 95% CI 0.14 to 2.10; 65 participants; Analysis 2.4).
Did not receive planned cycles
Three studies reported data on participants who did not receive planned cycles (Abe 2013; AERO B03 2007; Puhalla 2008). Administration of taxanes first probably resulted in little to no difference in the number of planned cycles received (RR 0.45, 95% CI 0.15 to 1.31; 163 participants; Analysis 2.5). There were 4/83 participants who did not receive the planned number of cycles in the taxane first arm compared to 9/80 participants in the anthracycline first arm.
Dose intensity
Four studies involving five treatment comparisons reported data on dose intensity (Abe 2013; AERO B03 2007; Puhalla 2008; Wildiers (Wildiers 2009a; Wildiers 2009b)). However, the presentation of data varied across the studies and only one study reported a measure of precision (in the form of a CI, standard error or standard deviation) (AERO B03 2007; median and range). Therefore, data could not be pooled using meta‐analysis. The results for all studies are provided in Table 2. Overall, the relative dose intensity (a percentage of the absolute dose intensity (actual) divided by the planned dose intensity) indicated that the taxane component within the taxanes first arm was possibly more likely to meet the expected dose compared to the anthracyclines first arm. When examining the anthracycline component of the chemotherapy schedule, the mean relative dose intensity may have been more likely to meet the expected dose in the anthracycline first arm than the taxane first arm.
Quality of life
One study reported quality of life data using the Functional Assessment of Cancer Therapy – Breast Cancer (FACT‐B) version 4 questionnaire (Puhalla 2008). Scores were similar in both groups for a subset of 20 participants who were assessed before, during and after treatment. Numerical or further details were not provided in the trial publication.
Discussion
Summary of main results
In the neoadjuvant setting, there is likely to be no or little difference in survival outcomes, tumour response or toxicity due to the sequence in which anthracyclines and taxanes are delivered. There was no evidence of either significant benefit or harm; however, the number of studies and participants contributing data were small. We expect the collection of data over time to provide further information regarding survival outcomes.
In the adjuvant setting, there were no available survival data. There is high‐ to low‐certainty evidence in regard to the differences in toxicity between the two regimens. Sequencing taxanes first reduced the risk of grade 3 or grade 4 neutropenia with no differences observed for other toxicities. Administering taxane first likely reduced the risk of requiring dose reductions for taxanes. The ability to deliver taxanes with reduced need for dose reductions may result in an important benefit if it improves survival; however, data regarding survival were lacking.
With the available data, there was no strong evidence for harm, benefit or equivalence due to the order in which taxane was delivered and, therefore, the specific clinical situation may take precedence when choosing the chemotherapy regimen.
Overall completeness and applicability of evidence
Only two neoadjuvant studies reported on our primary outcome of overall survival and one on our secondary outcome of disease‐free survival. Two further studies collected survival data (ACOSOG Z1041 2013; Stearns 2003), and the reporting from one is awaited (ACOSOG Z1041 2013). No adjuvant study reported on survival outcomes and only one study collected data (AERO B03 2007). Most were feasibility studies assessing toxicities. We suspect that a wider range of toxicity data, including important and routinely assessed toxicities such as febrile neutropenia and neurotoxicities were probably collected but not reported in the publications. None of the studies included numerical data for quality of life. Some studies had only a small subset of people with reported HER2‐positive or triple negative disease. Overall, the review had limited generalisability as the studies may not have included all relevant types of participants and there was limited information for some important outcomes.
The results of this review do not provide sufficient evidence to recommend a change from current local practice.
Quality of the evidence
Overall, the certainty of the evidence across the two settings was high to low. There were five neoadjuvant studies with 1415 participants and four adjuvant studies with 280 participants. The studies were open‐label, which potentially increases the risk of bias for toxicity and quality of life domains; however, we judged this risk to be small as all arms were receiving the same drugs. Otherwise, methodologically the studies were well conducted overall. Neo‐TAnGo 2014 contributed the most data to the meta‐analysis and was a well‐reported study. In general, due to imprecision it was difficult to judge consistency of results as the CIs were wide and overlapping. Studies did not consistently report or collect data on the review's outcomes and with the smaller number of studies the optimal information size was not met. In addition, in some cases, length of follow‐up was short or not reported.
Potential biases in the review process
The aim of this review was to provide a thorough assessment of any important risks and benefits due to the sequence in which anthracyclines and taxanes are administered, in an adjuvant or neoadjuvant setting. Despite a comprehensive search of the databases and key conferences we may not have identified all potentially relevant studies. Studies may have used a sequenced regimen without investigation of the effect of the sequence in which taxanes are delivered being an objective. These studies potentially may have been excluded in the title and abstract review.
Due to the number of studies, we did not examine the funnel plot to assess reporting bias. Small negative studies are included in this review; however, there may be further such studies that have not been published. Only one study has not reported on collected survival data which should have been available since initial publication (AERO B03 2007). We contacted the study authors to determine if there were data collected but not reported and for clarification of data, but received no response. Overall, we judged the risk of publication bias to be low.
There are a few minor amendments between our protocol and review which we made to include more relevant studies (docetaxel every 14 days) or report on more information (neutropenia) or for ease of organisation of information (pathological response rather than degree of response). We do not believe that these amendments would have introduced bias.
It is possible that not all of the studies that exist on this topic have been included in this review. Many of the titles and abstracts retrieved provided no indication that they examined sequencing of chemotherapy. The reference lists of existing systematic reviews and included studies were used to cross‐check whether all potentially relevant studies were included in this Cochrane Review. We welcome contact from trial authors who note that their trial is missing from this review.
Agreements and disagreements with other studies or reviews
This review complements a prior review that included retrospective and non‐randomised studies and did not pool data (Bines 2014). Since that review, results for one study have become available (Puhalla 2008). In our analysis administering taxane probably did not result in any meaningful difference in pathological response. We agree with the authors that the reverse sequence administering taxane first is an acceptable option.

Study flow diagram.

Risk of bias summary: review authors' judgements about each risk of bias item for each included study.

Forest plot of comparison: 1 Neoadjuvant, outcome: 1.1 Overall survival.

Forest plot of comparison: 1 Neoadjuvant, outcome: 1.2 Disease‐free survival.
Forest plot of comparison: 1 Neoadjuvant, outcome: 1.3 Pathological complete response (pCR) includes by hormone or HER2 receptor status.
Comparison 1 Neoadjuvant, Outcome 1 Overall survival.
Comparison 1 Neoadjuvant, Outcome 2 Disease‐free survival.
Comparison 1 Neoadjuvant, Outcome 3 Pathological complete response (pCR) includes by hormone or HER2 receptor status.

Comparison 1 Neoadjuvant, Outcome 4 Pathological response.
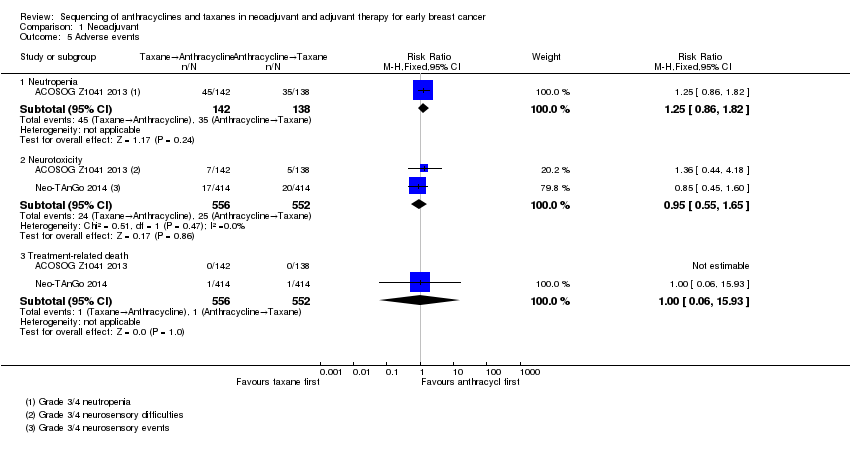
Comparison 1 Neoadjuvant, Outcome 5 Adverse events.

Comparison 1 Neoadjuvant, Outcome 6 Treatment adherence: dose reduction.

Comparison 2 Adjuvant, Outcome 1 Adverse events.

Comparison 2 Adjuvant, Outcome 2 Treatment adherence: delay in treatment.
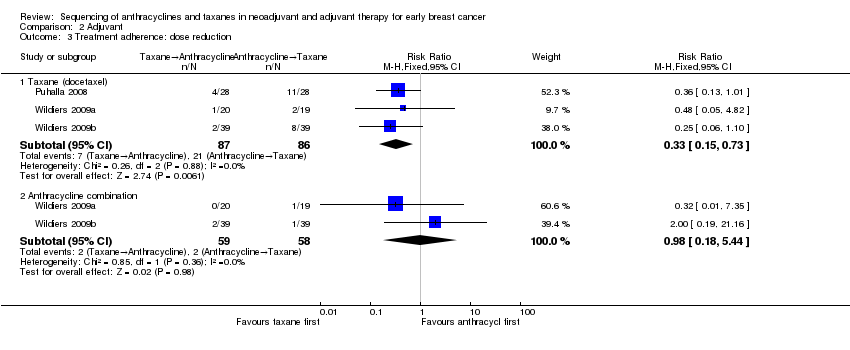
Comparison 2 Adjuvant, Outcome 3 Treatment adherence: dose reduction.

Comparison 2 Adjuvant, Outcome 4 Treatment adherence: one‐dose reduction.
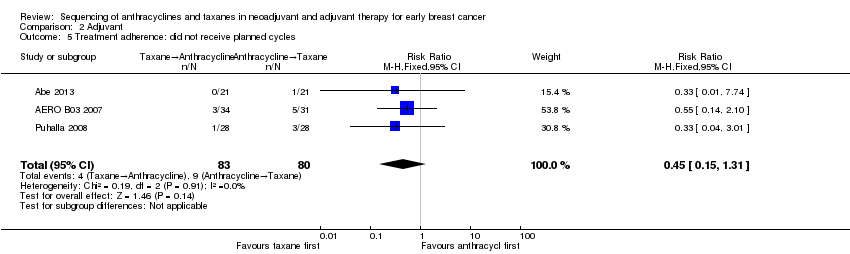
Comparison 2 Adjuvant, Outcome 5 Treatment adherence: did not receive planned cycles.
| Taxane followed by anthracyclines compared to anthracyclines followed by taxane in neoadjuvant therapy for early breast cancer | ||||||
| Patient or population: neoadjuvant therapy for early breast cancer | ||||||
| Outcomes | Anticipated absolute effects* (95% CI) | Relative effect | № of participants | Certainty of the evidence | Comments | |
| Risk with anthracyclines followed by taxane | Risk with taxane followed by anthracyclines | |||||
| Overall survival | 3‐year risk of deatha | HR 0.80 | 947 | ⊕⊕⊕⊝ | — | |
| 702 per 1000 | 620 per 1000 | |||||
| Disease‐free survival | 3‐year risk of recurrencea | HR 0.84 | 828 | ⊕⊕⊕⊝ | — | |
| 616 per 1000 | 552 per 1000 | |||||
| Pathological complete response (no invasive cancer in breast or axilla) (follow‐up: up to 5 years for 2 studies; unreported in 2 studies) | Study population | RR 1.15 | 1280 | ⊕⊕⊕⊕ | — | |
| 228 per 1000 | 262 per 1000 | |||||
| Adverse events: neutropenia (grade 3/4) (follow‐up: up to 6 months based on number of chemotherapy cycles) | Study population | RR 1.25 | 280 | ⊕⊕⊕⊝ | — | |
| 254 per 1000 | 317 per 1000 | |||||
| Adverse events: neurotoxicity (grade 3/4) (follow‐up: up to 5 or 6 months based on number of chemotherapy cycles) | Study population | RR 0.95 | 1108 | ⊕⊕⊝⊝ | — | |
| 45 per 1000 | 43 per 1000 | |||||
| Treatment adherence (defined as dose reduction) (follow‐up: up to 6 months based on number of chemotherapy cycles) | Study population | RR 0.81 | 280 | ⊕⊕⊕⊝ | — | |
| 399 per 1000 | 323 per 1000 | |||||
| Quality of life | — | — | — | — | Not measured | |
| *The risk in the intervention group (and its 95% confidence interval) is based on the assumed risk in the comparison group and the relative effect of the intervention (and its 95% CI). CI: confidence interval; HR: hazard ratio; RCT: randomised controlled trial; RR: risk ratio. | ||||||
| GRADE Working Group grades of evidence | ||||||
| aThe baseline risk in the anthracycline followed by taxane group was based on risk estimates provided in Neo‐TAnGo 2014 (Figure 2D for overall survival; Figure 2B for disease‐free survival). | ||||||
| Taxane followed by anthracyclines compared to anthracyclines followed by taxane in adjuvant therapy for early breast cancer | ||||||
| Patient or population: adjuvant therapy for early breast cancer | ||||||
| Outcomes | Anticipated absolute effects* (95% CI) | Relative effect | № of participants | Certainty of the evidence | Comments | |
| Risk with anthracyclines followed by taxane | Risk with taxane followed by anthracyclines | |||||
| Overall survival | — | — | — | — | — | Not reported |
| Disease‐free survival | — | — | — | — | — | Not reported |
| Adverse events: neutropenia (grade 3/4) (follow‐up: up to 3.5 or 4.5 months) | Study population | RR 0.62 | 279 | ⊕⊕⊕⊝ | — | |
| 255 per 1000 | 158 per 1000 | |||||
| Adverse events: neurotoxicity (grade 3/4) (follow‐up: up to 4 or 4.5 months) | Study population | RR 0.78 | 162 | ⊕⊕⊝⊝ | — | |
| 63 per 1000 | 49 per 1000 | |||||
| Treatment adherence (defined as dose delay) (follow‐up: up to 3.5 or 4.5 months) | Study population | RR 0.76 | 238 | ⊕⊕⊕⊝ | — | |
| 333 per 1000 | 253 per 1000 | |||||
| Quality of life (follow‐up: up to 4 months) | 1 study reported quality of life data using the FACT‐B version 4 questionnaire (Puhalla 2008). Scores were similar in both groups for a subset of 20 participants who were assessed before, during and after treatment. Numerical or further details were not provided in the trial publication. | — | 20 | ⊕⊕⊕⊝ | — | |
| *The risk in the intervention group (and its 95% confidence interval) is based on the assumed risk in the comparison group and the relative effect of the intervention (and its 95% CI). CI: confidence interval; RCT: randomised controlled trial; RR: risk ratio. | ||||||
| GRADE Working Group grades of evidence | ||||||
| aWe did not downgrade the certainty of the evidence. A lack of blinding was judged to be unlikely to influence physician assessment of grade 3/4 neutropenia (blood tests) and there was no heterogeneity detected across studies. | ||||||
| Study | Adherence measure reported | Taxane followed by anthracycline (n/N) | Anthracycline followed by taxane (n/N) |
| Number of participants who received ≥ 90% of planned dose of paclitaxel | 121/142 (85.2%) | 124/138 (89.5%) | |
| Number of participants who received ≥ 90% of planned dose of FEC | 123/142 (86.6%) | 103/138 (74.6%) | |
| Received ≥ 20 weeks of the planned 24 weeks of trastuzumaba or ≥ 10 weeks of planned 12 weeks of trastuzumabb | 127/142 (89.4%)a | 126/138 (91.3%)b | |
| Dose reductions | 46/142 (32.4%) | 55/138 (39.9%) | |
| Discontinued due to intolerance (severe toxic effects) | 9/142 (6.3%) | 9/138 (6.5%) | |
| NR | NR | NR | |
| Dose intensityc | Taxane: 97.% Doxorubicin: 94.2% | Doxorubicin: 95.2% Taxane: 89.2% | |
| Cycle delivered dose intensityd | 83% | 86% | |
| Percentage of cycles with dose reductions | Taxane → epirubicin: 3% | Epirubicin → taxane: 6% | |
| Percentage of cycles with dose delays | Taxane → epirubicin: 15% | Epirubicin → taxane: 15% | |
| NR | NR | NR | |
| FEC: fluorouracil, epirubicin and cyclophosphamide; n: number of participants with delay or dose reduction, etc; N: denominator; NR: not reported. a≥ 20 weeks of the planned 24 weeks of trastuzumab. | |||
| Study | Term used to represent dose intensity | Taxane followed by anthracycline | Anthracycline followed by taxane |
| Mean relative dose intensitya | Docetaxel: 95.2% FEC: 98.9% | Docetaxel: 94.2% FEC: 97.8% | |
| Median relative dose intensity | Docetaxel: 96% (range: 25–104) Epirubicin: 96% (range: 0–102) Cyclophosphamide: 95% (range: 0–102) | Docetaxel: 81% (range: 0–102) Epirubicin: 97% (range: 66–102) Cyclophosphamide: 97% (range: 61–102) | |
| Mean relative dose intensity | Docetaxel: 96% Doxorubicin: 95% | Docetaxel: 82% Doxorubicin: 96% | |
| Mean dose intensityb | Docetaxel: 99% FEC: 97% | Docetaxel: 97% FEC: 97% | |
| Wildiers 2009b (dose‐dense) | Mean dose intensityb | Docetaxel: 111% FEC: 143% | Docetaxel: 108% FEC: 146% |
| FEC: fluorouracil, epirubicin, cyclophosphamide. aData used based on the reporting of findings in the abstract and Table 2 in the trial publication. The docetaxel and FEC percentages were switched in the text in the Results section. Therefore, the consistency of results presented in Table 2 and abstract were considered to be the most accurate reflection of the results. bDefined as the dose intensity achieved in intervention or comparator arm for a participant who received all intended doses with no cycle delay or dose reduction. | |||
| Outcome or subgroup title | No. of studies | No. of participants | Statistical method | Effect size |
| 1 Overall survival Show forest plot | 2 | 947 | Hazard Ratio (Fixed, 95% CI) | 0.80 [0.60, 1.08] |
| 2 Disease‐free survival Show forest plot | 1 | 828 | Hazard Ratio (Fixed, 95% CI) | 0.84 [0.65, 1.09] |
| 3 Pathological complete response (pCR) includes by hormone or HER2 receptor status Show forest plot | 4 | Risk Ratio (M‐H, Fixed, 95% CI) | Subtotals only | |
| 3.1 No invasive cancer in breast or axilla | 4 | 1280 | Risk Ratio (M‐H, Fixed, 95% CI) | 1.15 [0.96, 1.38] |
| 3.2 Oestrogen receptor (ER)‐positive | 2 | 708 | Risk Ratio (M‐H, Fixed, 95% CI) | 1.18 [0.88, 1.58] |
| 3.3 ER‐negative | 2 | 381 | Risk Ratio (M‐H, Fixed, 95% CI) | 1.10 [0.89, 1.36] |
| 3.4 HER2‐positive | 2 | 467 | Risk Ratio (M‐H, Fixed, 95% CI) | 1.07 [0.85, 1.33] |
| 3.5 HER2‐negative | 1 | 505 | Risk Ratio (M‐H, Fixed, 95% CI) | 1.40 [0.92, 2.14] |
| 3.6 HER2‐negative, ER‐negative | 1 | 157 | Risk Ratio (M‐H, Fixed, 95% CI) | 1.22 [0.77, 1.93] |
| 4 Pathological response Show forest plot | 3 | Risk Ratio (M‐H, Fixed, 95% CI) | Subtotals only | |
| 4.1 No invasive or in situ carcinoma in breast or axilla | 1 | 119 | Risk Ratio (M‐H, Fixed, 95% CI) | 0.93 [0.47, 1.84] |
| 4.2 No invasive cancer in breast | 2 | 306 | Risk Ratio (M‐H, Fixed, 95% CI) | 0.97 [0.79, 1.20] |
| 4.3 No invasive cancer in axillary lymph nodes | 1 | 282 | Risk Ratio (M‐H, Fixed, 95% CI) | 1.66 [1.03, 2.66] |
| 5 Adverse events Show forest plot | 2 | Risk Ratio (M‐H, Fixed, 95% CI) | Subtotals only | |
| 5.1 Neutropenia | 1 | 280 | Risk Ratio (M‐H, Fixed, 95% CI) | 1.25 [0.86, 1.82] |
| 5.2 Neurotoxicity | 2 | 1108 | Risk Ratio (M‐H, Fixed, 95% CI) | 0.95 [0.55, 1.65] |
| 5.3 Treatment‐related death | 2 | 1108 | Risk Ratio (M‐H, Fixed, 95% CI) | 1.0 [0.06, 15.93] |
| 6 Treatment adherence: dose reduction Show forest plot | 1 | 280 | Risk Ratio (M‐H, Fixed, 95% CI) | 0.81 [0.59, 1.11] |
| Outcome or subgroup title | No. of studies | No. of participants | Statistical method | Effect size |
| 1 Adverse events Show forest plot | 5 | Risk Ratio (M‐H, Fixed, 95% CI) | Subtotals only | |
| 1.1 Febrile neutropenia | 5 | 279 | Risk Ratio (M‐H, Fixed, 95% CI) | 0.70 [0.24, 2.05] |
| 1.2 Neutropenia | 5 | 279 | Risk Ratio (M‐H, Fixed, 95% CI) | 0.62 [0.40, 0.97] |
| 1.3 Neurotoxicity | 3 | 162 | Risk Ratio (M‐H, Fixed, 95% CI) | 0.78 [0.25, 2.46] |
| 1.4 Treatment‐related death | 1 | 64 | Risk Ratio (M‐H, Fixed, 95% CI) | 0.0 [0.0, 0.0] |
| 2 Treatment adherence: delay in treatment Show forest plot | 4 | 238 | Risk Ratio (M‐H, Fixed, 95% CI) | 0.76 [0.52, 1.12] |
| 3 Treatment adherence: dose reduction Show forest plot | 3 | Risk Ratio (M‐H, Fixed, 95% CI) | Subtotals only | |
| 3.1 Taxane (docetaxel) | 3 | 173 | Risk Ratio (M‐H, Fixed, 95% CI) | 0.33 [0.15, 0.73] |
| 3.2 Anthracycline combination | 2 | 117 | Risk Ratio (M‐H, Fixed, 95% CI) | 0.98 [0.18, 5.44] |
| 4 Treatment adherence: one‐dose reduction Show forest plot | 1 | 65 | Risk Ratio (M‐H, Fixed, 95% CI) | 0.55 [0.14, 2.10] |
| 5 Treatment adherence: did not receive planned cycles Show forest plot | 3 | 163 | Risk Ratio (M‐H, Fixed, 95% CI) | 0.45 [0.15, 1.31] |