Efectividad comparativa del tratamiento continuado y de mantenimiento para el trastorno depresivo persistente en adultos
Resumen
Antecedentes
El trastorno depresivo persistente (TDP) se define como un trastorno depresivo en el que la enfermedad tiene una duración mínima de dos años, e incluye cuatro subgrupos diagnósticos (distimia, depresión grave crónica, depresión grave recurrente con remisión incompleta entre los episodios y depresión doble). Las formas persistentes de depresión representan una proporción apreciable de los trastornos depresivos, con una prevalencia durante toda la vida que varía del 3% al 6% en el mundo occidental. Evidencia cada vez mayor indica que el TDP responde bien a varias intervenciones agudas como las psicoterapias y los tratamientos farmacológicos combinados. No obstante, debido a las altas tasas de recaída y recurrencia de la depresión después de la respuesta al tratamiento agudo, el tratamiento continuado y de mantenimiento a largo plazo es de gran importancia. Hasta la fecha, no se ha realizado una síntesis de la evidencia disponible sobre los tratamientos continuados y mantenimiento de los TDP.
Objetivos
Evaluar los efectos de los tratamientos farmacológicos y las psicoterapias continuados y de mantenimiento (solos o combinados) para el trastorno depresivo persistente, comparados entre sí, con placebo (fármaco/atención placebo/tratamiento control no específico) y con el tratamiento habitual (TH). Los tratamientos continuados se definen como los tratamientos administrados a pacientes que en la actualidad están en remisión (la remisión se define como la disminución de los síntomas depresivos por debajo del nivel de caso) o a pacientes que previamente respondieron a un tratamiento antidepresivo. El tratamiento de mantenimiento se administra durante la recuperación (que se define como la remisión con una duración mayor de seis meses).
Métodos de búsqueda
Se hicieron búsquedas en Ovid MEDLINE (1950‐ ), Embase (1974‐ ), PsycINFO (1967‐ ) y en el Registro Cochrane Central de Ensayos Controlados (Cochrane Central Register of Controlled Trials) (CENTRAL) hasta el 28 de septiembre 2018. También se realizó una búsqueda anterior de ECA en estas bases de datos a través del Registro Cochrane de Ensayos Controlados de Trastornos Mentales Comunes (Cochrane Common Mental Disorders Controlled Trial Register, CCMD‐CTR) (hasta el 11 de diciembre 2015). Además, se realizaron búsquedas en los recursos de la literatura gris y en los registros internacionales de ensayos ClinicalTrials.gov y ICTRP hasta el 28 de septiembre de 2018. Se examinaron las listas de referencias de los estudios incluidos y se estableció contacto con el primer autor de todos los estudios incluidos.
Criterios de selección
Se incluyeron los ensayos controlados aleatorizados (ECA) y no aleatorizados (no ECA) de adultos con TDP formalmente diagnosticado que recibieron intervenciones farmacológicas, psicológicas, o continuadas y de mantenimiento combinadas.
Obtención y análisis de los datos
Dos autores de la revisión, de forma independiente, seleccionaron los estudios y extrajeron y analizaron los datos. El resultado primario de eficacia fue la tasa de recaída/recurrencia de la depresión. El resultado primario de aceptación fue los abandonos debido a cualquier razón diferente de la recaída/la recurrencia. Se realizaron metanálisis de efectos aleatorios con los riesgos relativos (RR) para los resultados dicotómicos y las diferencias de medias (DM) para los resultados continuos, con intervalos de confianza (IC) del 95%.
Resultados principales
En esta revisión se incluyeron diez estudios (siete ECA, tres no ECA) con 840 participantes, de los cuales cinco investigaron tratamientos continuados y cinco investigaron tratamientos de mantenimiento. En general, los estudios incluidos presentaron un riesgo de sesgo bajo a moderado. Para los tres no ECA, el origen más frecuente del riesgo de sesgo fue la selección de los resultados informados. Para los siete ECA, el origen más frecuente del riesgo de sesgo fue la falta de cegamiento de la evaluación del resultado y otros sesgos (en especial conflictos de intereses debido al patrocinio de compañías farmacéuticas).
Tratamientos farmacológicos continuados y de mantenimiento
La comparación más frecuente fue fármacos antidepresivos versus tabletas placebo (cinco estudios). Los participantes que tomaron fármacos antidepresivos tuvieron probablemente menos probabilidades de tener una recaída o presentar un episodio de recurrencia en comparación con los participantes en el grupo placebo al final de la intervención (13,9% versus 33,8%, RR 0,41; IC del 95%: 0,21 a 0,79; participantes = 383; estudios = 4; I² = 54%; evidencia de calidad moderada). Las tasas de abandonos generales pueden ser similares entre los participantes en los grupos medicación y placebo (23,0% versus 25,5%, RR 0,90; IC del 95%: 0,39 a 2,11; ECA = 4; participantes = 386; I² = 64%; evidencia de baja calidad). Sin embargo, los análisis de sensibilidad mostraron que el resultado primario (tasa de recaída/recurrencia) no mostró evidencia de diferencias entre los grupos cuando solo se incluyeron los estudios con bajo riesgo de sesgo.
Ninguno de los estudios comparó los tratamientos farmacológicos o las psicoterapias versus el TH.
Psicoterapias continuadas y de mantenimiento
Un estudio comparó las psicoterapias versus atención placebo/un control no específico. Un estudio comparó la psicoterapia con la medicación. Los resultados de los estudios que incluyeron la psicoterapia podrían indicar que la psicoterapia continuada o de mantenimiento puede ser una intervención útil en comparación con ningún tratamiento o los fármacos antidepresivos. Sin embargo, el grupo de evidencia para estas comparaciones fue demasiado pequeño y poco claro para establecer conclusiones de alta calidad.
Terapias combinadas de continuación y mantenimiento psicológico y farmacológico
Tres estudios compararon las psicoterapias y el tratamiento farmacológico combinados con los tratamientos farmacológicos solos. Un estudio comparó las psicoterapias y el tratamiento farmacológico combinados con las psicoterapias solas. Sin embargo, el grupo de evidencia para estas comparaciones fue demasiado pequeño y poco claro para establecer conclusiones de alta calidad
Comparación de diferentes fármacos antidepresivos
Dos estudios informaron datos sobre la comparación directa de dos antidepresivos. Sin embargo, el grupo de evidencia para esta comparación fue demasiado pequeño y poco claro para establecer conclusiones de alta calidad.
Conclusiones de los autores
En la actualidad no está claro si la farmacoterapia continuada o de mantenimiento (o ambas) con los agentes antidepresivos examinados es un tratamiento consistente para prevenir la recaída y la recurrencia en pacientes con TDP, debido al riesgo de sesgo moderado o alto, así como a la heterogeneidad clínica en los estudios analizados.
Para todas las otras comparaciones, el grupo de evidencia fue demasiado pequeño para establecer conclusiones finales, aunque la psicoterapia continuada o de mantenimiento podría ser más efectiva en comparación con ningún tratamiento. Se necesitan más ensayos de alta calidad de intervenciones psicológicas. Los estudios adicionales deben abordar de una manera más precisa la calidad de vida relacionada con la salud y los eventos adversos, así como evaluar los datos de seguimiento.
PICO
Resumen en términos sencillos
Tratamiento a largo plazo en pacientes con depresión persistente
¿Por qué es importante esta revisión?
Los trastornos depresivos que persisten durante al menos dos años causan considerables problemas. Incluso después del tratamiento exitoso, reaparecen con frecuencia. Los tratamientos habituales son los fármacos antidepresivos y las psicoterapias (terapias de conversación), o una combinación de ambos. Los tratamientos a largo plazo deberían prevenir la recurrencia de los síntomas depresivos.
¿Quién estará interesado en esta revisión?
‐ Los pacientes con depresión persistente (duración mayor de dos años), los amigos, familiares y cuidadores.
‐ Los médicos generales, los psiquiatras, los psicólogos clínicos, los psicoterapeutas y los farmacéuticos.
¿Qué preguntas pretende contestar esta revisión?
En adultos con depresión persistente que mejoró con el tratamiento agudo (a corto plazo):
‐ ¿Recibir fármacos antidepresivos continuados, psicoterapia o una combinación de ambos es más efectivo para prevenir la recurrencia de la depresión en comparación con placebo (un tratamiento simulado) o la atención habitual?
‐ ¿Recibir fármacos antidepresivos continuados, psicoterapia o una combinación de ambos se acepta de igual manera que recibir placebo o atención habitual?
‐ ¿Un tratamiento es más efectivo o más aceptado que otro?
¿Qué estudios incluye la revisión?
Se efectuaron búsquedas en las bases de datos médicas y otras fuentes para encontrar todos los estudios relevantes realizados hasta septiembre de 2018. Los estudios tenían que comparar el tratamiento antidepresivo, la psicoterapia o una combinación de ambos entre sí, con placebo o con la atención habitual para prevenir la recurrencia de la depresión en adultos con diagnóstico de depresión persistente. Se incluyeron diez estudios con 840 participantes. Cinco estudios compararon fármacos antidepresivos con placebo.
Un estudio comparó las psicoterapias versus atención placebo/un control no específico. Un estudio comparó la psicoterapia con la medicación. Tres estudios compararon las psicoterapias y el tratamiento farmacológico combinados con los tratamientos farmacológicos solos. Un estudio comparó las psicoterapias y el tratamiento farmacológico combinados con las psicoterapias solas.
Dos estudios compararon dos antidepresivos diferentes entre sí.
En general, los estudios incluidos presentaron un riesgo de sesgo bajo a moderado.
¿Qué nos dice la evidencia de la revisión?
Según GRADE, hubo evidencia de calidad moderada de que los participantes que recibieron tratamiento farmacológico probablemente tuvieron menos recaídas/recurrencias y pueden haber tenido menos abandonos que los que tomaron placebo. El riesgo de retorno de la depresión en los participantes que recibieron placebo (en lugar de fármacos antidepresivos) fue del 34%. En comparación, los participantes que continuaron con fármacos antidepresivos tuvieron un riesgo menor para la recurrencia del 13%. El tratamiento continuado duró entre cuatro meses y dos años. Los antidepresivos fueron tan bien aceptados como el placebo. Sin embargo, como la mayoría de los estudios incluidos mostraron riesgo de sesgo y hubo algunos resultados inconsistentes entre los diferentes estudios, no fue posible establecer conclusiones con certeza acerca de si la farmacoterapia continuada o de mantenimiento (o ambas) es un tratamiento convincente para los pacientes con TDP. Además, como hay falta de estudios sobre los efectos a largo plazo de la medicación, no fue posible establecer recomendaciones sobre la duración necesaria del tratamiento farmacológico.
Los efectos beneficiosos de las psicoterapias o el tratamiento combinado aún son poco claros debido al número pequeño de estudios.
¿Qué debe suceder a continuación?
Esta revisión no puede aportar evidencia clara y de certeza con respecto a si los fármacos antidepresivos continuados (en comparación con las tabletas placebo) reducen el riesgo de depresión recurrente en adultos con depresión persistente. Sin embargo, solo se han realizado unos pocos estudios. Los estudios adicionales deben abordar en especial las psicoterapias y los tratamientos a largo plazo combinados.
Authors' conclusions
Summary of findings
| Pharmacological continuation and maintenance treatment compared with placebo for persistent depressive disorder | ||||||
| Patient or population: people with persistent depressive disorder Settings: outpatient treatment Intervention: pharmacological continuation or maintenance treatment (sertraline, phenelzine, nefazodone, desipramine) Comparison: tablet placebo | ||||||
| Outcomes | Illustrative comparative risks* (95% CI) | Relative effect | No of participants | Quality of the evidence | Comments | |
| Assumed risk | Corresponding risk | |||||
| Placebo | Pharmacotherapy | |||||
| Relapse/recurrence (end of intervention) | 338 per 1000 | 139 per 1000a | RR 0.41 (0.21 to 0.79) | 383 | ⊕⊕⊕⊝b | See Characteristics of included studies table for the criteria of relapse/recurrence. |
| Dropout due to any reason (end of intervention) | 255 per 1000 | 230 per 1000a | RR 0.90 (0.39 to 2.11) | 386 | ⊕⊕⊝⊝c, d | "Dropout due to any reason" was all reported dropouts due to other reasons than relapse/recurrence. 1 study only reported dropouts in the first month of the maintenance treatment phase (Kocsis 1996). As the maintenance treatment lasted 24 months, the dropout rate in this study was very likely to be underestimated. |
| *The basis for the assumed risk (e.g. the median control group risk across studies) is provided in footnotes. The corresponding risk (and its 95% confidence interval) is based on the assumed risk in the comparison group and the relative effect of the intervention (and its 95% CI). CI: confidence interval; RR: risk ratio. | ||||||
| GRADE Working Group grades of evidence | ||||||
| aAssumed risk calculated as the proportion of participants on placebo with the outcome (relapse/recurrence or dropout any) in the four included studies, multiplied by 1000. bDowngraded due to limitations in the design and implementation of available studies suggesting high likelihood of bias (there were studies with high or unclear risk of bias in almost all RoB‐Domains (except detection bias)). cDowngraded due to unexplained heterogeneity between studies (I² = 64%). Due to the small number of included studies, subgroup or meta‐regression analyses were not performed. In two studies, dropout rates were higher in the intervention group, in two studies they were lower. dDowngraded due to imprecision of results (the overall confidence interval was wide and the confidence intervals of two included studies are also very wide). | ||||||
Background
Description of the condition
Persistent forms of depression that last for two years or longer represent a substantial proportion of depressive disorders (Boland 2002; Gilmer 2005; Keller 1992; Spijker 2002). Within the literature, four subtypes can be distinguished: dysthymia, chronic major depression, recurrent major depression with incomplete remission between episodes, and double depression (Dunner 2005). Dysthymic disorder is defined as a condition with mild depressive symptoms persisting for at least two years. Major depressive episode (MDD), chronic type, refers to a more severe condition that meets full criteria for major depression continuously for a minimum of two years. People who have recovered to the point at which they no longer meet full criteria for an MDD but continue to experience significant symptoms for at least two years are referred to as having recurrent major depression with incomplete remission between episodes. The superimposition of an MDD on antecedent dysthymia is referred to as double depression (Klein 2010). In the Diagnostic and Statistical Manual of Mental Disorders – 5th Edition (DSM‐5), the new diagnostic category of persistent depressive disorder was introduced subsuming dysthymic as well as chronic major depressive disorders (APA 2013).
The mean length of persistent depression is between 17 and 30 years (Gilmer 2005; Kocsis 2008), and the lifetime prevalence for persistent depressive disorders is estimated to range from 3% to 6% in the Western world (Kessler 2005; Klein 2010; Murphy 2012). In comparison to acute forms of depression, persistent depressive disorders are associated with longer treatment duration; increased loss of physical wellbeing; increased comorbidity; more severe impairments in social, psychological, and emotional functioning; increased healthcare utilization; more frequent suicide attempts; and more frequent hospitalizations (Arnow 2003; Gilmer 2005). Thus, persistent depression is likely to make a large contribution to the high burden of disease that is associated with unipolar depression according to disability‐adjusted life years (WHO 2008).
Description of the intervention
Overall, a large number of different interventions exist for the treatment of unipolar depression, including psychological, pharmacological, and combined psychological and pharmacological therapies. Evidence from randomized controlled trials (RCTs) as well as meta‐analyses suggests that these interventions are effective in the acute treatment of depression, including persistent forms of depression (Cuijpers 2010; Cuijpers 2013; Imel 2008; Keller 2000; Kriston 2014; Spijker 2013; von Wolff 2012; von Wolff 2013). Still, there is also evidence that relevant numbers of people do not respond to treatment, do not reach complete remission, and develop persisting residual symptoms long term (Epstein 2014). It is estimated that probably half of people with depressive disorders develop a chronic course (Klein 2011).
Moreover, acute‐phase treatments often fail to prevent relapse (which is defined as the return of symptoms of depression before a full remission has been achieved) and recurrence (which is defined as the appearance of another new episode of depression after full remission of a previous episode has been achieved) in major depression. For example, after scheduled termination of acute‐phase cognitive therapy (CT), relapse/recurrence rates were 29% in the first year and 54% in the second year (Vittengl 2007). In the same study, even when other depression‐specific psychological therapies and even higher doses of pharmacotherapy were used after the acute‐phase treatment, relapse and recurrence rates were still high (Vittengl 2007). Further, there are studies showing that 30% to 50% of people considered to be remitted still have to deal with residual depressive symptoms (Nutt 2007).
Thus, following response to acute treatment, long‐term continuation and maintenance therapy might be required to prevent relapse or recurrence of symptoms. Continuation treatments are defined as treatments given to currently remitted people (remission is defined as depressive symptoms dropping below case level) or to people who previously responded to an antidepressant treatment. Maintenance therapy is given during recovery (which is defined as remission lasting longer than six months; Frank 1991; NICE 2010). The German National Clinical Practice Guideline for Unipolar Depression recommends a combination of pharmacotherapy and psychological therapy as acute‐phase treatment for people with persistent forms of depression (DGPPN 2015). Additionally, a continued psychological therapy or pharmacotherapy (or both) is recommended to prevent relapse and recurrence. Specifically, the type of treatment that was successful in the acute phase is recommended to be continued (APA 2010; DGPPN 2015; NICE 2010). However, the recommendations concerning the continuation of therapy are based on people with unipolar depression in general, specific recommendations regarding people with persistent depressive disorders are lacking.
Hence, a systematic review of evidence regarding the effectiveness of pharmacological, psychological, and combined pharmacological and psychological therapies as continuation and maintenance treatments for people with persistent forms of depression is needed.
How the intervention might work
Acute treatments aim to reduce depressive symptoms and re‐establish psychosocial functioning. In comparison, continuation and maintenance treatments aim to maintain (or improve) the psychofunctional status reached by acute treatment, and to reduce the likelihood of relapse and recurrence in the long‐term (DGPPN 2015). Therefore, continuation and maintenance treatments are considered to be more than a pure extension of acute treatments, because continuation/maintenance treatments differ in frequency and content over the course of the illness in comparison to acute treatments.
Psychological continuation and maintenance interventions are usually offered less frequently than acute psychological therapy, aiming to monitor symptoms and to integrate techniques and strategies into daily life in the long‐term (DGPPN 2015). Different programmes targeting the prevention of relapse and recurrence focus on a range of effect mechanisms. CT approaches focus on the generalization of skills achieved during acute therapy (Jarrett 1998), or the cognitive content of negative thinking (Bockting 2005). Mindfulness‐based cognitive therapy (MBCT) was especially developed to reduce relapse and recurrence in depression (Piet 2011; Segal 2002), and teaches people to deal with negative feelings and thoughts as a part of their lives through becoming aware of negative cognitive patterns. Maintenance interpersonal psychotherapy (IPT) aims to complement skills gained in the acute‐phase therapy and teaches people to take responsibility in the prevention of future episodes by recognizing and preventing stressful environmental and social circumstances (Beshai 2011). Still, it remains challenging to completely understand the mechanisms of preventing relapse and recurrence (Beshai 2011).
The exact therapeutic mechanisms of antidepressants are not yet clear (Pringle 2011). Most antidepressants seem to increase the concentrations of monoamine neurotransmitters (e.g. serotonin or noradrenaline) in the synaptic cleft (Berton 2006). However, the effect of most antidepressants fully develops after some weeks, indicating that neurophysiological changes of brain tissue (e.g. changes in sensitivity and frequency of receptors), occurring in the presence of a constant level of active ingredients, are necessary for permanent improvement. Depending on the type of active ingredient, antidepressants can have mood‐enhancing, anxiolytic, or sedative effects and are able to increase or decrease inner drive. Moreover, the placebo effect is of particular importance in the treatment of depression. There are studies assuming that the more severe the depressive symptoms are, the greater the benefit of antidepressants seem to be compared to placebo (Anderson 2008; Kirsch 2008). However, one meta‐analysis performed on patient‐level data regarding the response to antidepressant medication showed that initial depression severity and outcomes were similarly related in treatment and placebo groups (Rabinowitz 2016).
A number of studies have shown that the risk of relapse or recurrence of depression is associated with residual symptoms following acute treatment phases (APA 2010; NICE 2010). These findings lead to the therapeutic goal of sustained remission and recommendations of international treatment guidelines to continue antidepressant medication after acute‐phase treatment (APA 2010; NICE 2010).
Why it is important to do this review
Research that focuses on the prevention of recurrence of depression was identified as a top priority in the project "Depression: asking the right questions" (MQ 2016). The high prevalence and the severe personal, societal, and economic consequences of persistent depressive disorder underline the need for adequate treatment strategies (Gilmer 2005). Growing evidence indicates that persistent depressive disorder responds well to several acute interventions, such as combined psychological and pharmacological treatments, although the number of RCTs is still limited (Spijker 2013). Yet, given the high rates of relapse and recurrences of depression following response to acute treatment, long‐term continuation and maintenance therapy are of great importance (Beshai 2011).
Several RCTs have supported the effectiveness of continuation and maintenance therapies for depression (Browne 2002; Jarrett 2001; Jarrett 2013; Keller 2007; Klein 2004; Petersen 2010; Vittengl 2009). One meta‐analysis on relapse prevention with antidepressant drug treatment of depressive disorders showed that continued antidepressant medication produced a robust reduction in relapse (Glue 2010). Another meta‐analysis summarized the findings of long‐term effects of cognitive behavioural therapy (CBT) (Vittengl 2007). Participants who responded to acute treatment and continued to receive CBT showed a significant reduction in relapse and recurrence rates in comparison to inactive as well as active controls.
Although most evidence addresses acute treatments for persistent depressive disorder or long‐term treatments for acute depressive episodes, some studies have addressed the effectiveness of long‐term treatments of persistent depressive disorder (Gelenberg 2003; Harrison 1986; Keller 1998a; Klein 2004; Kocsis 1996; Kocsis 2003; Koran 2001; Rouillon 1989; Stangier 2013).
We found no systematic review on the comparative effectiveness of continuation and maintenance treatments for persistent depressive disorder.
In summary, this systematic review may be highly relevant as:
-
persistent depressive disorders have a high prevalence and serious personal, societal, and economic consequences;
-
no evidence synthesis is available on continuation and maintenance treatments of persistent depressive disorders;
-
high quality evidence synthesis is needed for clinical guideline recommendations.
Objectives
To assess the effects of pharmacological and psychological continuation and maintenance treatments for persistent depressive disorder, in comparison with each other; placebo (drug/attention placebo/non‐specific treatment control); and treatment as usual (TAU). In addition, to assess the effects of combined psychological and pharmacological continuation and maintenance treatments, in comparison with either of these treatments alone.
Methods
Criteria for considering studies for this review
Types of studies
Randomized controlled trials (RCTs), and non‐randomized controlled trials (NRCTs). We considered NRCTs in this review as we expected a limited number of RCTs. There were no restrictions regarding other design characteristics. There were no cross‐over or cluster RCTs eligible for inclusion in this review; however, future versions of this review could consider including these trials.
Types of participants
Characteristics
We included participants aged 18 years or older of any gender and ethnicity.
Diagnosis
We included participants who had a diagnosis of persistent depressive disorder or had had this diagnosis before their last previous acute treatment. The diagnosis of depression needed to rely on a formal classification system, such as the International Classification of Diseases (ICD) (WHO 1992), or the Diagnostic and Statistical Manual of Mental Disorders (DSM) (APA 2013). Participants needed to be either currently remitted from persistent depressive disorder or needed to have at least partially responded to an acute intervention (at least 25% symptom reduction from baseline) at the beginning of the continuation or maintenance treatment. We included participants described as 'treatment resistant' if they fulfilled the formerly mentioned criteria. As the distinction between subtypes of persistent depressive disorder (chronic major depression, dysthymia, double depression, or recurrent depression without a complete remission between episodes) is controversial, inclusion was primarily driven by the duration of the existing depressive disorder. Consequently, we included studies investigating participants with chronic major depression, dysthymia, double depression, or recurrent depression without a complete remission between episodes if the target disorders were or had been of at least two years' duration. We excluded studies reporting to investigate 'chronically depressed' participants without fulfilling these criteria (e.g. less than two years' duration).
Comorbidities
We included studies that did not define specific concurrent mental or somatic conditions as inclusion criteria but reported on comorbidities in addition to the persistent depressive disorder. We excluded studies focusing exclusively on persistently depressed participants with a specific concurrent mental or somatic disorder as we assumed that the interventions in these types of studies (primarily) addressed the comorbid condition and were not focused exclusively on persistent depression.
Setting
There were no restrictions based on settings.
Subset data
We only considered studies in which both participants with persistent and acute forms of depression were included if they reported data separately for the persistent subgroup (or if 80% or more of the total sample had a diagnosis of persistent depression). If randomization was based on the total sample, we included studies and categorized them as NRCTs.
Types of interventions
Experimental intervention
We considered pharmacological, psychological, and combined continuation and maintenance interventions. We defined continuation treatments as treatments given to currently remitted people or to people who previously responded to an antidepressant treatment, whereas we defined maintenance treatments as treatments given to people who were currently recovered. Continuation/maintenance treatments needed to be started within one year after termination of an acute treatment. We considered all interventions that satisfied these definitions. Additionally, we considered studies that did not report all the above mentioned criteria but reported data on interventions that were clearly labelled as 'continuation' or 'maintenance' treatments. We considered pharmacological interventions including the oral administration of classified antidepressants:
-
tricyclic antidepressant (TCA);
-
selective serotonin reuptake inhibitor (SSRI);
-
monoamine oxidase inhibitor (MAOI);
-
alpha2‐receptor antagonist;
-
selective noradrenaline‐dopamine reuptake inhibitor (SNDRI);
-
melatonin receptor agonist;
-
serotonin 5HT2C receptor antagonist
-
noradrenergic and specific serotonergic antidepressants (NaSSA);
-
selective serotonin noradrenaline reuptake inhibitor (SSNRI).
We also considered the following as they can be used (alone or in combination) in treating different forms of depression (DGPPN 2015):
-
non‐classified antidepressants (Trazodone);
-
lithium;
-
Hypericum perforatum;
-
antipsychotic drugs.
Psychological therapies had to fulfil the following criteria.
-
The intervention must have been based on a scientific theory (described in detail or manualized or referenced, or a combination of these).
-
At least one contact between therapist and participant either face‐to‐face or via telecommunication technologies (e.g. online therapy) must have taken place. Thus, for example, the general dissemination of information material in form of leaflets in waiting rooms was not considered as a psychological therapy.
-
The intervention must have considered the personal needs of the participant or a group of participants and must have been individually tailored in an interpersonal process. Thus, we included group therapies.
Concerning psychological therapies, we considered behaviour therapy/behaviour modification, CBT, third‐wave CBTs, psychodynamic therapies, humanistic therapies, integrative therapies, systemic therapies, and other psychologically oriented interventions (based on the definition of the Cochrane Common Mental Disorders Group) for inclusion.
Combined interventions included the administration of one or more pharmacological agents combined with one or more psychological therapy.
Somatic (e.g. electroconvulsive therapy, vagus nerve stimulation, acupuncture), non‐pharmacological (e.g. physical exercise, bright light therapy), and organizational (e.g. case management) interventions were not considered as including too many different interventions was likely to result in large clinical and methodological heterogeneity.
Comparator intervention
We included both controlled and comparative effectiveness studies. The comparators were:
-
pharmacological placebo (participants received placebo tablets);
-
attention‐placebo/non‐specific control (participants received a treatment that involved non‐specific psychosocial factors or assessment only);
-
treatment as usual (TAU);
-
(other) psychological therapy;
-
(other) pharmacological treatment;
-
(other) combined psychological/pharmacological therapy.
Types of outcome measures
Primary outcomes
-
Relapse/recurrence rate of depression, preferentially defined as:
-
fulfilment of formal diagnostic criteria for depression (DSM, ICD), or as
-
exceeding a cut‐off on a depression symptom rating scale used by the authors, specifically:
-
Hamilton Depression Rating Scale (HAM‐D; Hamilton 1960);
-
Montgomery‐Åsberg Depression Rating Scale (MADRS; Montgomery 1979);
-
Beck‐Depression‐Inventory (BDI; Beck 1996);
-
Inventory of Depressive Symptomatology (IDS; Rush 2000);
-
Patient Health Questionnaire (PHQ; Spitzer 1999); or
-
any other depression symptom scale.
-
-
Due to the long tradition of depression research, most instruments used in clinical trials are usually psychometrically sound. Such measures were preferred throughout the review (referenced or sufficient psychometric quality (or both) reported).
-
Dropout due to any reason.
Secondary outcomes
-
Symptom severity of depression at the end of treatment (metric outcome of depression scale as defined above).
-
Health‐related quality of life (e.g. World Health Organization Quality of Life (WHOQOL) (Skevington 2004).
-
Dropout due to any type of adverse event (for the definition of adverse events see below).
-
Any type of adverse event (defined as any potentially negative event occurring during or after treatment in relation to a patient including symptoms of all body parts (e.g. headache, dizziness, dry mouth); psychological symptoms (e.g. depressed mood, suicidal thoughts); and psychosocial, legal, and economic consequences (e.g. conflicts with the partner, stigmatization) (Ladwig 2014; Nebeker 2004; Rief 2011).
-
Serious adverse events (defined as adverse events leading to serious consequences such as death, mortal danger, hospitalization, or disability; FDA 2016). Note that adverse events need to be differentiated from side effects that are defined as any adverse event that can be attributed to a lege artis intervention.
Timing of outcome assessment
The primary outcome time point was the 'end of the intervention' (regardless of the duration of the intervention). Additionally, we planned to analyze data at 'one year after the end of the intervention' providing that enough data were available. If one‐year‐data were not available, we planned to use data that ranged between six and 18 months after the end of the intervention with a preference for the time that was closest to one year after the end of the intervention. However, only one study provided follow‐up data 12 weeks after the end of the intervention.
Hierarchy of outcome measures
If more than one diagnostic definition or depression symptom rating scale (or both) was available (concerning relapse or recurrence rate of depression), we used the presented hierarchy to select measures (priority starting with: fulfilment of formal diagnostic criteria, continuing with HAM‐D, MADRS, etc.).
Search methods for identification of studies
Electronic searches
Cochrane Common Mental Disorders Controlled Trials Register (CCMD‐CTR)
The Cochrane Common Mental Disorders Group maintains a specialized register of RCTs, the CCMD‐CTR (description in Appendix 1). The Group's Information Specialist ran an initial search of the CCMD‐CTR (11 December 2015) for study records using the following controlled search terms (condition only): ("chronic depression" or "dysthymia"or "dysthymic disorder" or "persistent depressive disorder" or "recurrent depression")
The Information Specialist also searched the CCMD‐CTR‐references register (11 December 2015) using a more sensitive set of terms (condition only): ("chronic* depress*" or "double depress*" or dysthymi* or (depress* NEAR2 recurr*) or "persistent depressive disorder"):ti,ab,kw,ky,mh,mc,emt
[Key: ti = title; ab = abstract; kw = keywords; ky = additional keywords; mh = MeSH terms; mc = MeSH checkwords; emt = EMTREE terms]
As the scope of this review covers RCTs and NRCTs the information specialist also ran a scoping search of Ovid PsycINFO (11 December 2015) (Appendix 2). We screened the records retrieved from the CCMD‐CTR and PsycINFO for continuation and maintenance trials, prior to running all other database searches. The information specialist used these as a test set to develop the search strategy further, to prevent the retrieval of too many irrelevant references.
The Information Specialist ran complementary searches on the following bibliographic databases (September 2016 and 2018) using relevant subject headings and search syntax, appropriate to each resource (Appendix 2):
-
Cochrane Central Register of Controlled Trials (CENTRAL to Issue 9, 2018);
-
Ovid MEDLINE (1946 to 28 September 2018);
-
Ovid Embase (1974 to 28 September 2018);
-
Ovid PsycINFO (all years to 28 September 2018).
We also searched the international trial registers ClinicalTrials.gov and ICTRP to 28‐09‐2018, using the following terms for ClinicalTrials.gov: (“chronic depression” OR “double depression” OR dysthymia OR dysthymic OR “recurrent depression” OR “recurrent depressive disorder” OR “persistent depressive disorder”) AND (continuation OR maintenance) and the following terms for ICTRP: chronic depression AND continuation OR double depression AND continuation OR dysthymia AND continuation OR dysthymic AND continuation OR recurrent depression AND continuation OR recurrent depressive disorder AND continuation OR persistent depressive disorder AND continuation OR chronic depression AND maintenance OR double depression AND maintenance OR dysthymia AND maintenance OR dysthymic AND maintenance OR recurrent depression AND maintenance OR recurrent depressive disorder AND maintenance OR persistent depressive disorder AND maintenance.
There were no restrictions on date, language, or publication status applied to the searches. The search of the CCMD‐CTR was not repeated in 2018 as it was out of date at the time.
Searching other resources
Grey literature
We searched the following sources of grey literature.
-
ProQuest Dissertations and Theses Database (www.proquest.com/; searched
-
11 August 2015).
-
Depression. The Treatment and Management of Depression in Adults (NICE 2010).
-
S3 Guideline/National Disease Management Guideline. Unipolar Depression (DGPPN 2015).
-
Canadian Network for Mood and Anxiety Treatments (CANMAT). Clinical guidelines for the management of major depressive disorder in adults (Kennedy 2009).
-
Open Grey (www.opengrey.eu/; retrieved 11 August 2015).
As the first search on grey literature revealed no additional results, we did not repeat it in September 2018, only the main searches (see above) were updated.
Handsearching
As all relevant journals are included in the bibliographic databases being searched, we conducted no further handsearches in journals.
Reference lists
We checked the reference lists of all included studies and relevant systematic reviews to identify additional studies missed from the original electronic searches (e.g. unpublished or in‐press citations). We also conducted a cited reference search on the Web of Science.
Correspondence
We contacted the first author of all included studies to request information on unpublished or ongoing studies or additional trial data.
Data collection and analysis
Selection of studies
Two review authors (KM, SL, RM, or AJ) independently screened titles and abstracts for inclusion of all the potential studies identified as a result of the search and coded them as 'retrieve' (eligible or potentially eligible/unclear) or 'do not retrieve' (ineligible). We retrieved the full‐text reports/publications and two review authors (KM, SL, or RM) independently screened the full‐texts and selected studies for inclusion. We recorded reasons for exclusion of the ineligible studies. We resolved any disagreement through discussion or, if required, we consulted a fourth review author (AJ). We identified and excluded duplicate records and we collated multiple reports that related to the same study so that each study, rather than each report, was the unit of interest in the review. We recorded the selection process in sufficient detail to complete a PRISMA flow diagram and Characteristics of included studies and Characteristics of excluded studies tables.
Data extraction and management
We used a data collection form, which had been piloted on one study in the review (Klein 2004), to extract study characteristics and outcome data. Three review authors (KM, SL, RM) extracted data from this study for piloting the data collection form. Extraction of the data of the remaining included studies was undertaken by two review authors (KM, SL, or RM), who independently extracted study characteristics and data. We extracted the following.
-
Methods: study design, time of randomization, total duration of study, location, study setting, and date of study (year).
-
Participants: number of participants (n), mean age, age range, % women, diagnostic subgroup, mean age of onset, length of current/last episode, number of previous episodes.
-
Interventions: intervention, comparison, type of acute treatment previous to continuation/maintenance treatment.
-
Outcomes: primary and secondary outcomes specified and collected, and time points reported.
-
Notes: funding of the trial.
We noted in the Characteristics of included studies table if outcome data were not reported in a usable way. We resolved disagreements by consensus or by involving a third review author (KM, SL, or RM). One review author (SL) transferred data into Review Manager 5 (Review Manager 2014). We double‐checked that data were entered correctly by comparing the data presented in the systematic review with the study reports. A second review author (KM) spot‐checked study characteristics for accuracy against the trial report.
Main comparisons
We chose seven main comparisons from the list of possible comparisons based on clinical importance and expected frequency of the comparisons in clinical trials:
-
pharmacological continuation and maintenance therapies versus placebo;
-
pharmacological continuation and maintenance therapies versus TAU;
-
psychological continuation and maintenance therapies versus attention placebo/non‐specific control;
-
psychological continuation and maintenance therapies versus TAU;
-
psychological continuation and maintenance therapies versus pharmacological continuation and maintenance therapies;
-
combined psychological and pharmacological continuation and maintenance therapies versus pharmacological continuation and maintenance therapies alone;
-
combined psychological and pharmacological continuation and maintenance therapies versus psychotherapeutic continuation and maintenance therapies alone.
Assessment of risk of bias in included studies
Two review authors (KM, SL, or RM) independently assessed risk of bias for each study using the criteria outlined in the Cochrane Handbook for Systematic Reviews of Interventions (Higgins 2011). We resolved any disagreements by discussion or by involving another review author (KM, SL, or RM). We assessed the risk of bias according to the following domains:
-
random sequence generation;
-
allocation concealment;
-
blinding of participants and personnel;
-
blinding of outcome assessment;
-
incomplete outcome data;
-
selective outcome reporting;
-
other bias.
We judged each potential source of bias as high, low, or unclear and provided a supporting quotation from the study report together with a justification for our judgement in the 'Risk of bias' table. We summarized the risk of bias judgements across different studies for each of the domains listed. Where information on risk of bias related to unpublished data or correspondence with a trialist, we noted this in the 'Risk of bias' table.
We used the ROBINS‐I tool for assessing the quality of non‐randomized studies in meta‐analyses to assess the quality of NRCTs (Sterne 2016). This tool shows substantial overlap with the risk of bias ratings in RCTs, but additionally includes two domains at the preintervention level (bias due to confounding, bias in selection of participants into the study) and one domain at the intervention level (bias in classification of interventions).
We included no cluster‐randomized trials; however, in updates of this review we will consider recruitment bias, baseline imbalance, loss of clusters, incorrect analysis, and comparability with individually randomized trials in cluster‐randomized trials (Higgins 2011).
We used sensitivity analyses to consider the risk of bias. Moreover, we took the risk of bias into account when interpreting the treatment effects.
Measures of treatment effect
Dichotomous data
To increase clinical applicability of the findings, we calculated the risk ratio (RR) and 95% confidence intervals (CI) of the primary outcomes relapse/recurrence and dropout due to any reason, as they are more likely to help clinicians to make informed decisions in specific clinical situations. For rare outcomes (adverse events) or endpoints with highly varying baseline rates, we estimated odds ratios (OR) and 95% CIs. When the overall results were significant, we calculated the number needed to treat for an additional beneficial outcome (NNTB). None of the included studies in this review used time‐to‐event data, however in future versions of this review primary studies should consider pooled hazard ratios for calculations.
Continuous data
We analyzed continuous data as mean differences (MD) and 95% CIs when studies used the same rating scale. When studies used different scales, we calculated standardized mean differences (SMD) and 95% CIs. We entered data presented as a scale with a consistent direction of effect. We undertook meta‐analyses only where this was meaningful (i.e. if the treatments, participants, and underlying clinical question were similar enough for useful pooling). We planned to narratively describe skewed data reported as medians and interquartile ranges if effect size calculation was not possible.
Time‐to‐event data
We planned to consider pooled hazard ratios for calculation of time‐to‐event data.
Unit of analysis issues
Cross‐over and cluster‐randomized trials
As we expected a small number of overall available studies, data from cross‐over trials and cluster‐randomized trials were planned for inclusion in the analysis, regardless of the level of randomization. None of the studies in this review was either a cross‐over or a cluster‐randomized trial. However, in updates of this review, cluster‐randomized trials should include direct effect estimates of the primary studies, only if they were obtained from analyses that accounted for the clustering in the data (e.g. using a multilevel model). Otherwise, the effect estimates should be approximated using an inflated standard error that incorporates the design effect (Higgins 2011). For cross‐over trials, only the first comparison (precross‐over) meeting our inclusion criteria should be used.
Studies with multiple treatment groups
For studies with multiple treatment groups, for each of the main objectives addressed in our review, we considered only data from the comparison of interest. If the study provided more than one comparison of interest for one of the main objectives, we planned to divide the number of participants in the arm used several times by the number of arms for all analyses to avoid including participants more than once in the analysis. However, this procedure was not necessary in our analyses.
Dealing with missing data
In case of missing or unclear data, we contacted corresponding authors or study sponsors to obtain key study characteristics and missing numerical outcome data when possible (e.g. when a study was identified as abstract only). We documented all requests and correspondence.
For all studies, we planned to calculate effect sizes using the intention‐to‐treat (ITT) principle (i.e. analyzing all participants allocated to the respective study arm). For the primary outcomes, all randomized participants were included in the analyses (when possible) irrespective of how the authors of the primary studies defined their ITT sample. For all other outcomes, we followed the definition of the ITT sample provided by the authors. Where authors reported no ITT data, we used the data provided.
Assessment of heterogeneity
We tested statistical heterogeneity between studies for significance using Cochrane's Q‐test and quantified it using the I² statistic (Higgins 2003).
Results were visually displayed as forest plots. We expected considerable clinical heterogeneity between studies. I² values in the range of 0% to 40% might not be important, 30% to 60% may represent moderate heterogeneity, 50% to 90% may represent substantial heterogeneity, and 75% to 100% considerable heterogeneity. Based on this classification, we considered I² values in the range of 50% to 100% as relevant statistical heterogeneity that was to be further explored. As "thresholds for the interpretation of I² can be misleading, since the importance of inconsistency depends on several factors" (Higgins 2011), this was only a rough orientation. Therefore, we decided on a case‐by‐case‐basis if the determined heterogeneity needed to be further explored.
Assessment of reporting biases
We tested for possible reporting biases and small‐study effects using visual examination of funnel plots (when useful). We planned to use Egger's test for test of publication bias, requiring a minimum of 10 studies per comparison (Sterne 2001).
Data synthesis
All analyses used a random‐effects model (DerSimonian 1986). We used a random‐effects rather than fixed‐effect model because we assumed that the included studies would not be functionally equivalent and would show considerable clinical (concerning population, intervention) and methodological (concerning quality) heterogeneity. Results are visually displayed as forest plots.
If it was not possible to combine studies via meta‐analysis, we provided a narrative summary.
Subgroup analysis and investigation of heterogeneity
To identify possible treatment effect moderators, we planned a priori defined subgroup analyses (in case of categorical predictors) or meta‐regression analyses (in case of metric predictors) for the primary outcomes.
We considered the following variables in subgroup analyses:
-
subtype of persistent depressive disorder (dysthymia versus other): a possibly moderating effect of subtype would suggest that a distinction between these subtypes might be used for allocation of people to treatments (differential indication). In contrast, a possible homogeneity of effects across subtypes may suggest that a distinction is of little relevance in the day‐to‐day practice. We planned to test dysthymia against other subtypes as dysthymia is assumed to be the most frequently mentioned subtype;
-
mean age of onset: the age of onset is known as a relevant predictor, it should be assessed if people with early onset need different treatments;
-
applied intervention (CBTs versus other, SSRIs versus other): experience shows that CBT approaches/SSRIs are the most frequent forms of psychological therapies/antidepressants to be studied. Therefore, we decided to test these approaches versus other approaches. Evidence on the best available treatments (in case of considerable differences) is indispensable for guideline recommendations;
-
duration of continuation/maintenance treatment (weeks): for guideline recommendations and clinical practice, it is indispensable to know if different treatment durations result in different outcomes, e.g. if longer treatments lead to better outcomes.
In case of considerable heterogeneity between study results that could not be explained by the a priori defined subgroup and meta‐regression analyses, we planned to perform a series of a posteriori (explorative) meta‐regression analyses to identify sources of heterogeneity. A priori and a posteriori analyses should be clearly labelled as such.
Sensitivity analysis
We performed sensitivity analyses excluding studies with a high or unclear risk of bias (separately for each of the seven domains according to Cochrane's 'Risk of bias' tool, when possible) or outlying findings (or both). Results were contrasted to those acquired with data from all studies to control for possible effects of study quality on pooled effects.
We planned additional sensitivity analysis: excluding trials without a randomization on person level (second phases of cross‐over trials, NRCTs, and cluster‐randomized trials) and excluding trials without (re)randomization immediately before the continuation/maintenance phase to control for possible design effects.
'Summary of findings' table
We included the comparison of effectiveness of pharmacotherapy versus placebo for persistent depressive disorder in summary of findings Table for the main comparison. 'Summary of findings' tables include a summary of the quality of evidence, the magnitude of effects of the according intervention and a summary of available data on the primary outcomes (relapse/recurrence and dropout due to any reason). We expressed findings as measures of RR and absolute risk, with 95% CIs and used the GRADE approach to assess the quality of the body of evidence (Guyatt 2011).
Results
Description of studies
Results of the search
The CCMD Information Specialist conducted initial searches in December 2015 of the CCMD‐CTR (studies and references registers) and Ovid PsycINFO, retrieving a total of 4489 records. In September 2016, after we had screened the initial search results the Information Specialist ran further searches of CENTRAL and a cross‐search of Ovid MEDLINE, Embase and PsycINFO, retrieving an additional 929 records (after exclusion of duplicates). In October 2016, we searched and screened several sources of grey literature, reference lists of relevant systematic reviews and studies, and correspondended with authors of included studies to date, which yielded an additional 834 records. After removal of duplicates, two review authors (SL, KM, RM, or AJ) independently screened all 5520 records by title and abstract and excluded 5000 records as they did not meet our inclusion criteria. Two out of three review authors (SL, KM, or RM) independently checked each of the remaining 520 full‐text reports for eligibility. We included 17 publications (representing 10 studies) for the qualitative synthesis, and out of this pool we used 10 publications for the quantitative synthesis. One additional study is classified as 'awaiting classification', as the recruiting process has not finished yet (NCT03219879). The PRISMA flow diagram displays the details of the selection process (see Figure 1).
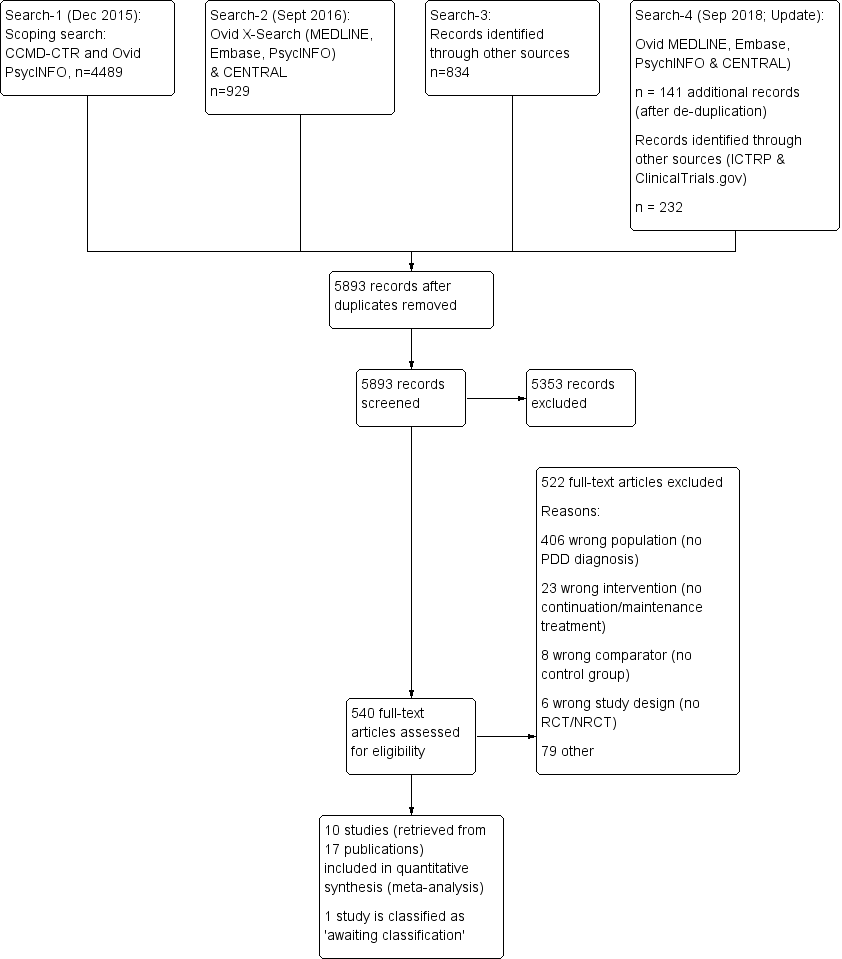
Study flow diagram. NRCT: non‐randomized controlled trial; PDD: persistent depressive disorder; RCT: randomized controlled trial.
In September 2018, the Information Specialist repeated the searches of Ovid MEDLINE, Embase, PsycINFO together with a search of the Cochrane Library trials database (CENTRAL). The update search retrieved 141 additional records (after de‐duplication). We screened these 141 records and identified 20 records for which we did a full‐text screening. Only one study fulfilled the inclusion criteria, but this study was already included in the systematic review (duplicate).
We also repeated the searches in the WHO International ClinicalTrials Registry Platform (ICTRP) and ClinicalTrials.gov (to September 2018) and identified 232 new records. Of these 232 records, 231 were excluded and one is a duplicate (classified as 'awaiting classification', see above).
Included studies
We included 17 publications, describing 10 studies: five continuation and five maintenance studies. In Table 1, column 'Study ID', we mentioned the 10 main publications. Three further publications described the acute phases of the included continuation and maintenance studies (Keller 1998a; Keller 2000; Marin 1994; see Table 1, column 'Related acute‐phase study'), one publication was a study protocol (Rush 1998), and three publications (Berndt 2000; Kocsis 1997; Kocsis 2002) provided additional analyses on the studies of Keller 1998b and Koran 2001. Thus, these seven publications provided information missing in the 10 main publications (e.g. location of the study, comorbidities, detailed information on the interventions).
| Related acute‐phase study | Study ID | Treatment arms | Continuation/maintenance (treatment duration) | Study design | Diagnosis |
| Keller 1998b | Sertraline Imipramine | Continuation (16 weeks) | NRCT | Chronic major depressive disorder, double depression | |
| Sertraline Placebo | Maintenance (76 weeks) | RCT | Chronic major depressive disorder, double depression | ||
| Harrison 1986 | Phenelzine Placebo | Continuation (26 weeks) | RCT | Dysthymia, double depression | |
| Keller 2000 | Nefazodone CBASP Combination | Continuation (16 weeks) | NRCT | Chronic major depressive disorder, double depression, recurrent depressive disorder with incomplete interepisode remission | |
| Nefazodone Placebo | Maintenance (52 weeks) | RCT | Chronic major depressive disorder, double depression, recurrent depressive disorder with incomplete interepisode remission | ||
| CBASP Assessment only | Maintenance (52 weeks) | RCT | Chronic major depressive disorder, double depression, recurrent depressive disorder with incomplete interepisode remission | ||
| Hellerstein 2001 | Fluoxetine Fluoxetine + group psychotherapy | Continuation (16 weeks) | RCT | Dysthymia | |
| Marin 1994 | Imipramine Desipramine | Continuation (16–20 weeks) | NRCT | Dysthymia, double depression | |
| Desipramine Placebo | Maintenance (104 weeks) | RCT | Chronic major depressive disorder, dysthymia, double depression | ||
| Desipramine Placebo | Maintenance (104 weeks) | RCT | Dysthymia |
*These groups are partially overlapping (see above).
CBASP: Cognitive Behavioral Analysis System of Psychotherapy; NRCT: non‐randomized controlled trial; RCT: randomized controlled trial.
There were partially overlapping participant groups between the different continuation/maintenance treatment studies that followed one acute treatment study. However, these studies focused on different comparisons and were not included in the same analyses. Two exceptions were the studies of Kocsis 1996 and Miller 2001. These two studies focused on the same comparison (desipramine versus placebo) during the maintenance phase, but analyzed different diagnostic subgroups. While Miller 2001 analyzed solely participants with dysthymia, Kocsis 1996 included participants with a chronic MDD and double depression. Both studies shared the group of participants with dysthymia, although just partially as Miller 2001 also included participants with dysthymia not involved in Kocsis 1996.
Two studies investigated solely continuation treatments (Harrison 1986; Hellerstein 2001). The other eight studies followed three acute treatment studies, and investigated both continuation and maintenance treatments (Gelenberg 2003; Keller 1998b; Klein 2004; Kocsis 1995; Kocsis 2003; Koran 2001; Miller 2001).
Comparisons
We predefined seven relevant comparisons.
1. Pharmacological continuation and maintenance therapies versus placebo
Five of 10 studies included comparisons of an antidepressant medication with a pharmacological placebo (Gelenberg 2003; Harrison 1986; Keller 1998b; Kocsis 1996; Miller 2001). Two of these five studies compared desipramine versus placebo in the maintenance phase, but used different subgroups for analyses (see Table 1) (Kocsis 1996; Miller 2001).
2. Pharmacological continuation and maintenance therapies versus treatment as usual
There were no studies comparing pharmacological therapies versus TAU.
3. Psychological continuation and maintenance therapies versus attention placebo/non‐specific control
One study compared psychotherapy versus assessment only (Klein 2004).
4. Psychological continuation and maintenance therapies versus treatment as usual
There were no studies comparing psychological therapies versus TAU.
5. Psychological continuation and maintenance therapies versus pharmacological continuation and maintenance therapies
One study with three treatment arms compared pharmacological, psychological, and combined continuation therapy (Kocsis 2003).
6. Combined psychological and pharmacological continuation and maintenance therapies versus pharmacological continuation and maintenance therapies alone
Two studies compared combined psychological and pharmacological continuation and maintenance therapies versus pharmacological continuation and maintenance therapies alone (Hellerstein 2001; Kocsis 2003 with three treatment arms (pharmacological, psychological, and combined continuation therapy)).
7. Combined psychological and pharmacological continuation and maintenance therapies versus psychotherapeutic continuation and maintenance therapies alone
One study compared combined psychological and pharmacological continuation and maintenance therapies versus psychotherapeutic continuation and maintenance therapies alone (Kocsis 2003 with three treatment arms (pharmacological, psychological, and combined continuation therapy)).
We included one a posteriori comparison.
8. Pharmacological continuation and maintenance therapies versus other pharmacological continuation and maintenance therapies (post hoc)
Two studies compared pharmacological continuation and maintenance therapies versus other pharmacological continuation and maintenance therapies (post hoc) (Kocsis 1995; Koran 2001).
Design
Two studies used a randomized, controlled, parallel‐group design to investigate the continuation treatment phase (Harrison 1986; Hellerstein 2001). Three studies investigated a continuation treatment within an NRCT, that is, the participants continued to receive the same treatment that was effective during acute treatment (Kocsis 1995; Kocsis 2003; Koran 2001). Each of these three studies was followed by maintenance treatments applying a randomized, controlled, parallel‐group design (Gelenberg 2003; Keller 1998b; Klein 2004; Kocsis 1996; Miller 2001). Continuation treatments lasted between 16 and 26 weeks, maintenance treatments between 52 and 104 weeks. All 10 studies involved preceded acute treatments in their study design (see Table 1).
Sample size
Study size varied widely. The two studies investigating solely a continuation treatment randomized 12 participants (Harrison 1986) and 40 participants (Hellerstein 2001). Two studies randomized 329 participants (Kocsis 2003) and 386 participants (Koran 2001) for the continuation phase and rerandomized 82 participants (Klein 2004) and 161 participants (Keller 1998b) for the subsequent maintenance phase. Another study (Kocsis 1995) randomized 73 participants to the continuation phase and rerandomized between 27 participants (Miller 2001) and 53 participants (Kocsis 1996) to the subsequent maintenance phase.
Setting
Two studies were multicentre (Harrison 1986; Hellerstein 2001), and five were single centre (Gelenberg 2003; Keller 1998b; Klein 2004; Kocsis 2003; Koran 2001). One study was conducted multicentre during the continuation treatment (Kocsis 1995), and continued single centre during the maintenance phase (Kocsis 1996; Miller 2001). All studies were conducted in the US and used an outpatient setting for treatment.
Inclusion criteria
All studies required the participants to meet DSM criteria for persistent depressive disorder by the time of entering the study (i.e. start of acute treatment). Two continuation treatment studies included people with dysthymia (Harrison 1986; Hellerstein 2001), whereby the latter one focused on people with early‐onset dysthymia. While Koran 2001 and Keller 1998b included participants with either a chronic depressive episode or double depression, Gelenberg 2003, Kocsis 2003, and Klein 2004 additionally included participants with recurrent depression with incomplete interepisode remission. Kocsis 1995 analyzed participants with either dysthymia or double depression in the continuation treatment phase. The subsequent maintenance treatment phase included participants with either chronic major depressive disorder, dysthymia, or double depression, whereby Miller 2001 analyzed only people with dysthymia.
All studies used explicit response or remission criteria for entry into continuation or maintenance phases. Participants were required to show at least clinical response or partial remission, scoring below 15 on the HAM‐D (Gelenberg 2003; Klein 2004; Kocsis 2003), or to range between a score of 11 and 12 on the HAM‐D (Kocsis 1996; Miller 2001). Harrison 1986 required the participants to reach a score of 1 or 2 ("very much improved" or "much improved") on the Clinical Global Impression (CGI). Keller 1998b and Koran 2001 required participants to fulfil both a HAM‐D score of 15 or less and a CGI score of less than 3 (i.e. no more than mild depression). One study additionally defined specific remission criteria based on the Longitudinal Interval Follow‐up Evaluation (LIFE) for participants with double depression (Koran 2001), scoring 1 (no symptoms) or 2 (some symptoms) during four weeks. Compared to acute‐phase baseline scores, six studies determined response or remission with at least 50% decrease of symptoms (Gelenberg 2003; Keller 1998b; Klein 2004; Kocsis 2003; Koran 2001; Miller 2001), and one study with at least 40% reduction of symptoms (Hellerstein 2001). For the studies investigating continuation treatments, participants had to achieve the defined response or remission criteria directly at the end of acute treatment (Hellerstein 2001; Kocsis 2003), or had to maintain the specific score for the last four weeks before entering the continuation phase (Koran 2001). For the studies investigating maintenance treatments, participants had to continue their response or remission throughout the end of continuation treatment for being eligible to enter the maintenance phase (Gelenberg 2003; Keller 1998b; Klein 2004; Kocsis 1996; Miller 2001). Participants included in the studies had to be aged between 21 and 65 years (Hellerstein 2001; Keller 1998b; Koran 2001) or between 18 and 75 years (Gelenberg 2003; Klein 2004; Kocsis 2003).
Exclusion criteria
Five studies described criteria for excluding participants prior to study entry (i.e. before starting the acute treatment of the study programme). Six studies excluded participants who failed to respond to either at least one adequate trial of antidepressant medication (Harrison 1986; Keller 1998b; Koran 2001) or who failed to respond to three or more previous trials of antidepressant medication or at least two trials of empirical supported psychotherapy, or both (Gelenberg 2003; Klein 2004; Kocsis 2003). Nine studies (except Harrison 1986) excluded participants with serious medical illness, DSM diagnosed axis I disorders (if principal), personality disorders, present psychotic symptoms, or immediate suicidal risk. Five studies excluded participants who took concomitant (psychoactive) medication or who had received electroconvulsive therapy either within three months (Keller 1998b; Koran 2001) or three years prior to study entry (Gelenberg 2003; Klein 2004; Kocsis 2003). Hellerstein 2001 excluded participants who underwent another parallel psychotherapy, and Koran 2001 and Keller 1998b excluded participants who started another psychotherapy within the previous three months before entering study.
Participant characteristics
While one study reported that the majority of included participants were aged in their 30s or 40s (Harrison 1986), all other studies provided mean age scores of participants varying between 36 and 45 years. Harrison 1986 included predominantly women (83%), while the proportion of women varied between 50% and 66% in all other studies. Distribution of diagnostic subgroups differed among the included studies, whereby eight studies treated participants of several diagnostic subgroups, and two studies analyzed solely people with dysthymia (Hellerstein 2001; Miller 2001). The number of participants with double depression varied between 23% and 63% (Gelenberg 2003; Harrison 1986; Keller 1998b; Klein 2004; Kocsis 1995; Kocsis 1996; Kocsis 2003; Koran 2001). Six studies treated participants with a chronic depressive episode (Gelenberg 2003; Keller 1998b; Klein 2004; Kocsis 1996; Kocsis 2003; Koran 2001), of which the amount varied between 11% and 55%. Three studies also treated participants diagnosed with a recurrent depressive episode with incomplete interepisode remission (Gelenberg 2003; Klein 2004; Kocsis 2003); the amount varied between 22% and 29%. Three studies also treated participants with dysthymia, of which the amount varied between 37% and 40% (Harrison 1986; Kocsis 1995; Kocsis 1996).
Although other axis I disorders (if principal) and personality disorders were an exclusion criterion in almost all studies, some studies described percentages of single comorbid mental conditions with the following percentages:
-
Keller 1998b: 26% anxiety disorders, 37% substance abuse, 30% alcohol abuse, 48% axis II disorders;
-
Klein 2004: 27% anxiety disorders, 26% substance abuse;
-
Kocsis 2003: 31% anxiety disorders, 29% alcohol abuse;
-
Kocsis 1996: 34% anxiety disorders, 48% axis II disorders.
As only serious medical illnesses were an exclusion criterion, participants could have more harmless illnesses. However, none of the included studies reported data on comorbid somatic conditions.
Six studies provided data on the mean age of onset, which ranged from 12.3 to 29.5 years. The mean length of the current/previous episode was 73.2 to 105.6 months (data provided in five studies: Gelenberg 2003; Keller 1998b; Klein 2004; Kocsis 2003; Koran 2001). Four studies provided data on the number of previous episodes and reported a mean number of 1.3 to 3.0 episodes (Hellerstein 2001; Keller 1998b; Klein 2004; Koran 2001). Three studies reported the mean lifetime duration of the depressive disorder (Harrison 1986: 15.0 years; Koran 2001: 16.6 years; Miller 2001: 24.0 years).
Four studies reported data on previous medications (Keller 1998b; Kocsis 1996; Kocsis 2003; Miller 2001), the percentages of participants previously received antidepressants ranged from 22% (Keller 1998b) to 57% (Kocsis 2003).
Five studies reported data on previously received psychotherapy (Hellerstein 2001; Keller 1998b; Kocsis 2003; Miller 2001); this applied to 63% (Keller 1998b) to 85% (Miller 2001) of the included participants.
Types of intervention
Antidepressant drugs and drug placebo interventions
Continuation treatment: one continuation treatment study compared an active antidepressant drug with a tablet placebo (Harrison 1986). This study used the MAOIs phenelzine as active treatment for 26 weeks. Participants in the active group received on average phenelzine 51 mg daily. Participants in the placebo group discontinued phenelzine treatment over a period of 14 days by reducing the daily dose by 15 mg every two to three days. Two continuation treatment studies included a direct comparison of two antidepressant medications. Koran 2001 compared sertraline (SSRI) 50 mg to 200 mg per day to imipramine (TCA) 50 mg to 300 mg per day for 16 weeks. The dose could be adapted by 50 mg per day each week depending on the participant's symptoms and adverse effects. The second study compared two TCAs during 16 to 20 weeks of treatment (Kocsis 1995). Participants received the same final dose achieved during acute treatment (imipramine 300 mg per day or desipramine 200 mg per day). Two continuation treatment studies included comparisons of antidepressant medication alone versus medication plus psychotherapy. Kocsis 2003 investigated three active treatment arms, including nefazodone (SNDRI) alone, psychotherapy alone (Cognitive Behavioral Analysis System of Psychotherapy), and nefazodone plus psychotherapy over 16 weeks. In both medication arms, participants received nefazodone 300 mg per day to 600 mg per day. Hellerstein 2001 compared fluoxetine (SSRI) alone with fluoxetine plus group psychotherapy over 16 weeks. Participants in both arms received fluoxetine 20 mg per day to 80 mg per day.
Maintenance treatment: four maintenance treatment studies included the comparison of an active antidepressant drug with a tablet placebo (Gelenberg 2003; Keller 1998b; Kocsis 1996; Miller 2001). Of these four, two studies analyzed the same comparison (desipramine versus placebo) but with focus on different diagnostic subgroups (Kocsis 1996; Miller 2001). In Keller 1998b, the participants in the active treatment group received a flexible daily dose of sertraline hydrochloride 50 mg to 200 mg (SSRI) for 76 weeks. Participants in the placebo arm reduced the sertraline dose by 50 mg every week and received placebo substitution. Gelenberg 2003 used nefazodone SNDRI at the same dose being effective during the previous continuation phase (300 mg per day and 600 mg per day) over 52 weeks. Participants in the placebo arm received identical (but inactive) tablets without any stepwise reduction between continuation and maintenance phase. Kocsis 1996 and Miller 2001 used desipramine (TCA) over 104 weeks as maintenance treatment. Participants in the active group maintained the dose (75mg per day to 350 mg per day) of the previous continuation phase. Participants in the placebo arm reduced their dose by 25% per week during the first month of maintenance treatment and subsequently started a treatment with identical placebo tablets.
Types of psychological therapies
Three studies investigated psychotherapeutic treatments, two continuation treatment studies and one maintenance treatment study.
Kocsis 2003 examined the Cognitive Behavioral Analysis System of Psychotherapy (CBASP; McCullough 2000) during the 16‐week continuation phase. Participants received six sessions of manualized CBASP, both in the CBASP and the combined treatment arm. The continuation treatment study of Hellerstein 2001 compared fluoxetine (SSRI) alone with a group receiving fluoxetine plus manualized group psychotherapy in a 16‐week continuation phase. The combined group received treatment according to an unpublished manual of Cognitive‐Interpersonal Group Psychotherapy for Chronic Depression (CIGP‐CD), combining cognitive and interpersonal approaches. Up to 10 participants formed a group with weekly meetings of 90 minutes.
Klein 2004 investigated CBASP versus assessment only in a 52‐week maintenance phase which followed the study of Kocsis 2003 (see above). Participants in the CBASP group received one session every four weeks for up to 13 sessions, and were evaluated by an independent evaluator every four weeks. Participants in the assessment only group met the project co‐ordinator and the independent evaluator also every four weeks, hence received some attention but no active treatment.
Process evaluation of psychological treatments
One continuation treatment study (Hellerstein 2001) and one maintenance treatment study (Klein 2004) provided information on process evaluation.
Hellerstein 2001 involved two clinical psychology PhD students with extensive psychotherapy training for conducting the group therapy in the continuation treatment phase. On a weekly basis, these two students met a senior psychiatrist supervisor for two months for reviewing how to conduct the treatment with the CIGP‐CD treatment manual. By the start of the study treatment, sessions with the participants were audiotaped and supervised weekly for adherence to the manual.
Information on the CBASP sessions in the maintenance treatment study was inferable from the main publication (Klein 2004). There was additional information from the publication of the acute treatment phase (Keller 2000). The CBASP sessions were all videotaped and conducted by psychotherapists with at least two or five years of experience (dependent on last degree achieved). The therapists underwent a two‐day training workshop with James P McCullough (founder of CBASP) including an evaluation of two videotaped pilot cases before starting treatment with study participants. Throughout the maintenance phase, the designated supervisors at each site assessed therapist's adherence to treatment procedures biweekly by reviewing videotapes. These supervisors were directly supervised by James P McCullough. Treatment adherence was measured using a CBASP‐specific rating scale developed by McCullough (McCullough 2000). In case of non‐adherence, an immediate meeting with the respective therapist was scheduled and opportunities for improvement were discussed.
Types of outcome measures
Primary outcomes
The primary efficacy outcome was rates of relapse or recurrence of depression, defined by exceeding a specific score on the HAM‐D or on the severity of the CGI, by fulfilling DSM criteria for an MDD, by clinical judgement of the research team during a predefined range of time, or a combination of these.
Two continuation studies applied criteria for relapse, either scoring below a satisfactory response during four weeks (Koran 2001), or scoring three or more on the CGI during two weeks (Harrison 1986).
In the maintenance treatment study of Keller 1998b, participants had to fulfil DSM criteria for an MDD during three consecutive weeks, a CGI rating of three or more, and an increase of at least four points on the HAM‐D (compared to maintenance baseline) to be diagnosed as having a recurrence. One week later, a senior investigator determined the diagnosis within a clinical interview to confirm relapse. Two other maintenance treatment studies defined a participant's recurrence by a score of 12 or more on the HAM‐D and a score below 60 on the GAS on three consecutive ratings within four weeks (Kocsis 1996; Miller 2001). Also, if a participant fulfilled these criteria on just one rating but was considered to need urgently alternative treatment, the participant was rated as being recurred.
One continuation treatment study (Kocsis 2003), and two maintenance treatment studies (Gelenberg 2003; Klein 2004), applied the same criteria for recurrence, as they followed the same acute treatment study (Keller 2000). These three studies required the participants to score 16 or higher on the HAM‐D, to fulfil DSM criteria for an MDD on two consecutive visits, and to undergo a clinical interview with a senior investigator confirming recurrence. They also applied another definition in case a participant scored 16 or more on the HAM‐D but did not fulfil MDD criteria or discontinued before a second visit for clarification. Then, senior investigators reviewed the data of such participants at the end of the study, discussed and decided if and at what time an MDD had occurred, and if the participant could be considered to have recurred.
Two studies did not address relapse or recurrence (Hellerstein 2001; Kocsis 1995).
The primary safety/acceptability outcome was dropout due to any reason other than recurrence. Nine studies reported overall dropout rates. Most of the studies also reported reasons for dropout (see 'Secondary outcomes' below). One study did not report any dropouts (Miller 2001).
Secondary outcomes
Metric outcomes of depression severity scales and quality of life measures were reviewed as secondary efficacy outcomes. Six studies reported changes in severity of depressive symptoms from pre‐ to post‐treatment on the HAM‐D (Gelenberg 2003; Harrison 1986; Hellerstein 2001; Keller 1998b; Klein 2004; Koran 2001). Three studies included quality of life measures (Hellerstein 2001; Keller 1998b; Koran 2001). The continuation treatment study of Koran 2001 reported data on the Quality of Life Enjoyment and Satisfaction Questionnaire (Q‐LES‐Q), a self‐report measure obtaining the degree of enjoyment and satisfaction in different areas of daily functioning. In the subsequent maintenance treatment study, Keller 1998b used the 36‐item Short‐Form Health Survey (SF‐36), and reported data on three subscales (social functioning, role limitations owing to emotional problems, role limitations owing to physical health problems) in a further publication (Kocsis 2002). Hellerstein 2001 used the Satisfaction With Life Scale (SWLS), a self‐report measure of subjective life satisfaction. Only one study reported follow‐up outcome data (both for the HAM‐D and the SWLS scores) 12 weeks after the end of the intervention.
Measures of safety (i.e. dropout due to any type of adverse event and the occurrence of any or severe adverse events) were also reviewed. Five of 10 studies reported dropout due to adverse events other than recurrence, and all of these studies compared antidepressant medication with placebo or another medication (Gelenberg 2003; Harrison 1986; Keller 1998b; Kocsis 1995; Koran 2001). Reasons for such dropout were adverse effects, insufficient response, intercurrent illness, or dispute with staff. Two studies reported the occurrence of any adverse events, including adverse effects (e.g. headache, insomnia, sexual problems) for the majority of participants (Keller 1998b), and adverse effects (especially sleep disturbances and sexual problems) for all participants in the medication arm (Harrison 1986), although Harrison 1986 reported no data for the placebo group.
Excluded studies
The major reason for exclusion of studies was the non‐fulfilment of the diagnosis 'persistent depressive disorder' (see Figure 1). Some studies involved participants with recurrent depressive disorder with complete interepisode remission (e.g. Jarrett 2013), other studies also involved chronic forms of depression, but the percentage of chronic forms was less than 80% (e.g. Thase 2001) or provided no separate analyses of diagnostic subgroups of persistent depression (e.g. Petersen 2010). Other studies did not apply clear response or remission criteria for participants to be eligible for entering continuation/maintenance treatment (i.e. all participants from the acute phase could take part in the following treatment phases) (e.g. Schramm 2017).
Risk of bias in included studies
Of the 10 included studies, seven were RCTs and three were NRCTs. These three NRCTs were continuation treatment studies (Kocsis 1995; Kocsis 2003; Koran 2001), and were labelled as NRCTs for this review as the acute‐phase responders were not rerandomized for the continuation treatment. We used the 'Risk of bias' tool on a three‐point scale (low/high/unclear risk) for the RCTs (Figure 2; Figure 3). We used the ROBINS‐I tool (Sterne 2016), using a five‐point scale (low/moderate/serious/critical/unclear risk) for the NRCTs (Figure 4; Figure 5; Table 2; Table 3; Table 4).

Risk of bias graph: review authors' judgements about each risk of bias item presented as percentages across all included seven randomized controlled trials. Blank space in rows containing no information indicate missing information on the 'Risk of bias' scale for the three non‐randomized controlled trials.
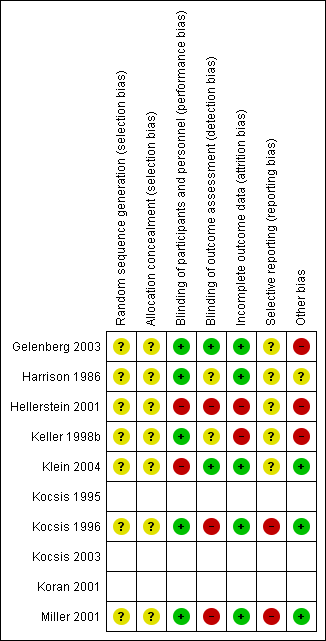
Risk of bias summary: review authors' judgements about each risk of bias item for each included randomized controlled trial (seven studies). Blank space in rows containing no information indicate missing information on the 'Risk of bias' scale for the three non‐randomized controlled trials.
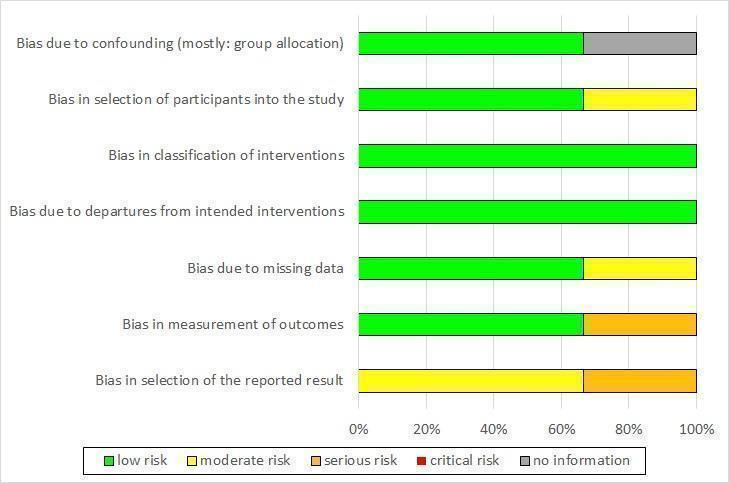
Risk of bias graph non‐randomized controlled trials (NRCT): review authors' judgement about each risk of bias item presented as percentages across all included NRCTs (three studies).

Risk of bias summary non‐randomized controlled trials (NRCT): review authors' judgements about each risk of bias item for each included NRCT (three studies).
| Risk of bias (ROBINS‐I tool) | Rating | Explanation of judgement | Possible ratings |
| Bias due to confounding | 5 | No information how participants were allocated to groups in the acute treatment. | Code 1 = low risk, 2 = moderate risk, 3 = serious risk, 4 = critical risk, 5 = no information |
| Bias in selection of participants into the study | 2 | Different length of drugs and procedures during acute treatment (participants of 3 protocols were included for analyses of continuation treatment). | Code 1 = low risk, 2 = moderate risk, 3 = serious risk, 4 = critical risk, 5 = no information |
| Bias in classification of interventions | 1 | Intervention was well defined: IMI and DMI were continued on an open basis at the same final dose achieved during the acute phase. | Code 1 = low risk, 2 = moderate risk, 3 = serious risk, 4 = critical risk, 5 = no information |
| Bias due to departures from intended interventions | 1 | No indication for departures from intended interventions, check of plasma levels was performed. | Code 1 = low risk, 2 = moderate risk, 3 = serious risk, 4 = critical risk, 5 = no information |
| Bias due to missing data | 2 | Proportions of missing participants differed substantially across interventions: 26% in the IMI group and 6% in the DMI group, in the IMI group 4 participants did not comply with the follow‐up assessment, reasons for dropout were reported; but proportion of dropout due to dissatisfaction with treatment was similar for IMI and DMI (7% and 6%). | Code 1 = low risk, 2 = moderate risk, 3 = serious risk, 4 = critical risk, 5 = no information |
| Bias in measurement of outcomes | 3 | Participants in the IMI protocols were seen and rated once at week 26 of treatment. Participants on the DMI protocol were seen and rated every 2 weeks through week 26. Lack of blinding: participants and raters were aware of the treatment. (see p. 214) | Code 1 = low risk, 2 = moderate risk, 3 = serious risk, 4 = critical risk, 5 = no information |
| Bias in selection of the reported result | 3 | Not all predefined outcomes were reported separately for both groups. Some data were assessed every 2 weeks, these data were not reported. In general, data were not reported for HAM‐D and GAS for the DMI vs IMI. | Code 1 = low risk, 2 = moderate risk, 3 = serious risk, 4 = critical risk, 5 = no information |
DMI: desipramine; GAS: Global Assessment Scale; HAM‐D: Hamilton Depression Rating Scale; IMI: imipramine.
| Risk of bias (ROBINS‐I tool) | Rating | Explanation of judgement | Possible ratings |
| Bias due to confounding | 1 | Randomization before acute phase, exclusion of cross‐over participants. | Code 1 = low risk, 2 = moderate risk, 3 = serious risk, 4 = critical risk, 5 = no information |
| Bias in selection of participants into the study | 1 | All eligible participants were included, cross‐over participants were excluded; acute phase treatment had the same length and measurement times for all groups. | Code 1 = low risk, 2 = moderate risk, 3 = serious risk, 4 = critical risk, 5 = no information |
| Bias in classification of interventions | 1 | Intervention status was well described (planned and actual dose of medication as well as number of CBASP sessions). | Code 1 = low risk, 2 = moderate risk, 3 = serious risk, 4 = critical risk, 5 = no information |
| Bias due to departures from intended interventions | 1 | Medication doses as well as number of CBASP sessions were within the planned range. | Code 1 = low risk, 2 = moderate risk, 3 = serious risk, 4 = critical risk, 5 = no information |
| Bias due to missing data | 1 | Number of missing data was low and comparable in all groups (2–3%). | Code 1 = low risk, 2 = moderate risk, 3 = serious risk, 4 = critical risk, 5 = no information |
| Bias in measurement of outcomes | 1 | Methods of outcome assessment were comparable across intervention groups. Quote: "Trained independent evaluators unaware of treatment assignment completed the HAM‐D‐24 at each assessment visit." (p. 77), no means and standard deviations reported, unclear if other subscales were evaluated. | Code 1 = low risk, 2 = moderate risk, 3 = serious risk, 4 = critical risk, 5 = no information |
| Bias in selection of the reported result | 2 | No study protocol existed, but all measures mentioned in the methods section were reported in the outcome section. | Code 1 = low risk, 2 = moderate risk, 3 = serious risk, 4 = critical risk, 5 = no information |
CBASP: Cognitive Behavioral Analysis System of Psychotherapy; HAM‐D: Hamilton Depression Rating Scale.
| Risk of bias (ROBINS‐I tool) | Rating | Explanation of judgement | Possible ratings |
| Bias due to confounding | 1 | Randomization before acute phase. | Code 1 = low risk, 2 = moderate risk, 3 = serious risk, 4 = critical risk, 5 = no information |
| Bias in selection of participants into the study | 1 | All possible participants were included (direct and cross‐over). All measures existing from the beginning of the intervention. The study flow was clearly described since acute treatment. | Code 1 = low risk, 2 = moderate risk, 3 = serious risk, 4 = critical risk, 5 = no information |
| Bias in classification of interventions | 1 | Intervention status is well defined (dose ranges are described in section 2.3 and 3.4). | Code 1 = low risk, 2 = moderate risk, 3 = serious risk, 4 = critical risk, 5 = no information |
| Bias due to departures from intended interventions | 1 | Assignment to intervention. Quote: "For both treatment groups, 10% of patients had dose increases aimed at improving outcome" (p. 31); same for both groups with regard to the main outcome; adapting dose is usual practice; no deviation from intended treatment, they counted the tablets. | Code 1 = low risk, 2 = moderate risk, 3 = serious risk, 4 = critical risk, 5 = no information |
| Bias due to missing data | 1 | Quote: "For all patients, including drop outs, pill counts indicated compliance rates of 88.7% for imipramine and 84.7% for sertraline. No differences were found between diagnostic groups or between acute and crossover patients." (p. 31); Proportions of and reasons for missing participants were similar across intervention groups; less than 5% dropout for the main outcome; proportions of missing data were comparable and are addressed in the analyses with LOCF. | Code 1 = low risk, 2 = moderate risk, 3 = serious risk, 4 = critical risk, 5 = no information |
| Bias in measurement of outcomes | 1 | Information from Rush et al., 1998 (study protocol): reliable ratings (p. 593); quote: "continued on the same double‐blind medication dose for an additional 16 weeks" (p. 593); assessment methods comparable across groups. | Code 1 = low risk, 2 = moderate risk, 3 = serious risk, 4 = critical risk, 5 = no information |
| Bias in selection of the reported result | 2 | Outcomes correspond to the ones named in the protocol, but protocol just for acute phase; not all measures used during the acute phase were used in continuation phase. | Code 1 = low risk, 2 = moderate risk, 3 = serious risk, 4 = critical risk, 5 = no information |
LOCF: last observation carried forward.
Risk of bias in randomized controlled trials (seven studies)
Random sequence generation (selection bias)
None of the included RCTs described random sequence generation (unclear risk of bias in all seven RCTs).
Allocation (selection bias)
All seven RCTs had an unclear risk of bias concerning allocation as there was no information on the allocation process.
Blinding (performance bias and detection bias)
Blinding of participants and personnel (performance bias)
Five RCTs reported that participants and personnel were blinded (low risk) (Gelenberg 2003; Harrison 1986; Keller 1998b; Kocsis 1996; Miller 2001). Two RCTs were psychotherapy studies (Hellerstein 2001; Klein 2004). Therefore, participants and personnel were aware of the treatment condition (high risk).
Blinding of outcome assessment (detection bias)
In two RCTs, the outcome assessors were independent and blind to the treatment condition (low risk; Gelenberg 2003; Klein 2004). In two RCTs, there was no information on this domain (unclear risk; Harrison 1986; Keller 1998b). In three RCTs, the assessors were study clinicians not blinded to the treatment condition (high risk; Hellerstein 2001; Kocsis 1996; Miller 2001).
Incomplete outcome data (attrition bias)
In five RCTs, the risk concerning incomplete outcome data was low (Gelenberg 2003; Harrison 1986; Klein 2004; Kocsis 1996; Miller 2001). In these studies, the number of participants with missing data was low (below 5%), there were no missing data, or the (main) outcome was reported for all included participants. Two RCTs had a high risk of bias as the number of participants with missing data was very high, and we considered the used imputation methods (last observation carried forward (LOCF)) as rather inadequate for this context (see Discussion) (Hellerstein 2001; Keller 1998b).
Selective reporting (reporting bias)
Five RCTs had an unclear risk concerning reporting bias (Gelenberg 2003; Harrison 1986; Hellerstein 2001; Keller 1998b; Klein 2004). There were no study protocols for the continuation or maintenance treatments available. Nevertheless, we did not rate the risk of bias as high as outcomes in relevant domains were reported and there was no specific indication for selective reporting. Two RCTs were at high risk as results were not reported for all applied measures (Kocsis 1996; Miller 2001).
Other potential sources of bias
To operationalize the domain of other relevant sources of bias, we assessed three subdomains separately: insufficient treatment adherence, allegiance bias/conflict of interest, and attention bias. Ratings from these three subdomains were then summarized to one overall rating of 'other potential sources of bias' for each RCT (see Figure 3 and Characteristics of included studies table). If one of these three subdomains was at high risk of bias, we assessed the overall rating as high. In the case that two (or three) domains indicated an unclear risk and one (or no) domain indicated a low risk, the overall rating was unclear. The overall rating was low risk if two or three domains indicated a low risk and no or one domain indicated an unclear risk.
Three studies were at high risk, especially because conflict of interest was considered very likely (pharmaceutical sponsoring) (Gelenberg 2003; Hellerstein 2001; Keller 1998b). One study had an unclear risk as information on the three subdomains was mostly lacking (Harrison 1986). Three studies had a low risk as there was – for example – serum level control to ensure the treatment adherence (Klein 2004; Kocsis 1996; Miller 2001). Moreover, the investigators ensured that all groups received the same amount of attention and there were – in case of sponsoring from a pharmaceutical company – also other, independent authors involved in the publication.
Risk of bias in non‐randomized controlled trials (three studies)
Bias due to confounding (mostly: group allocation)
Two NRCTs were at low risk of bias due to confounding as participants were randomized before the acute treatment (Kocsis 2003; Koran 2001). In one NRCT, there was no information on how participants were allocated to the groups in the acute treatment phase (unclear risk; Kocsis 1995).
Bias in selection of participants into the study
Two NRCTs included all eligible participants and described the process of inclusion and the study flow clearly (Kocsis 2003; Koran 2001). Kocsis 1995 included participants from three different acute‐phase treatment protocols with different treatment durations and medication, thus the risk was moderate.
Bias in classification of interventions
All three NRCTs defined the intervention status well, for example, the planned and actual dose of the pharmacological intervention and the number of psychotherapy sessions was described, indicating a low risk (Kocsis 1995; Kocsis 2003; Koran 2001).
Bias due to departures from intended interventions
In all three NRCTs, there was no indication for departures from intended interventions (e.g. plasma level checks were performed and the dose range of medication or the number of psychotherapy sessions were within the planned range (Kocsis 1995; Kocsis 2003; Koran 2001). Therefore, the risk was low.
Bias due to missing data
In the studies of Koran 2001 and Kocsis 2003, the number of participants with missing data was low (less than 5% for the main outcome) and comparable across the intervention groups. The risk was moderate for Kocsis 1995, as the proportions of participants with missing data differed substantially across the groups, but reasons for dropout were reported.
Bias in measurement of outcomes
The assessment methods were reliable, comparable across treatment groups and performed by trained independent raters in the studies of Koran 2001 and Kocsis 2003. In the study of Kocsis 1995, the frequency of ratings differed across treatment groups and participants and raters were aware of the treatment (serious risk).
Bias in selection of the reported result
In the study of Koran 2001, the outcomes correspond to the ones named in the methods section. The study protocol focused solely on the acute phase of the study, and not all measures described in the protocol were reported in the publication of the continuation treatment study (moderate risk). For the study reported by Kocsis 2003, no study protocol was available, but all measures reported in the methods section were also reported in the results section (moderate risk). In the study reported by Kocsis 1995, the risk of bias was rated as serious as not all predefined outcomes were reported.
Effects of interventions
See: Summary of findings for the main comparison
For all comparisons, we analyzed ITT data when possible. Six studies reported ITT data for all outcome measures included in this review. In the other four studies, data for 2% to 10% (Hellerstein 2001; Kocsis 1996; Kocsis 2003; Koran 2001) of the ITT sample were missing for single outcome measures at the end of the intervention. Missing data were not replaced, calculations were based on the data provided in the publications. Data on the dropout rate (overall dropout and dropout due to adverse events) were consistently based on the complete ITT sample. The only study with follow‐up data provided data on depression severity at follow‐up for the complete ITT sample and data on quality of life at follow‐up for 85% of the participants of the ITT sample (Hellerstein 2001).
1. Pharmacological continuation and maintenance therapies versus placebo
Five studies compared pharmacological continuation and maintenance therapies with placebo. Keller 1998b compared sertraline (participants = 77) with placebo (participants = 84), Harrison 1986 compared phenelzine (participants = 5) with placebo (participants = 7), and Gelenberg 2003 compared nefazodone (participants = 76) with placebo (participants = 84). Both Kocsis 1996 and Miller 2001 compared desipramine with placebo, analyzing different diagnostic subgroups: Kocsis 1996 (desipramine: participants = 28; placebo: participants = 25), Miller 2001 (desipramine: participants = 14; placebo: participants = 13). As Kocsis 1996 and Miller 2001 evaluated partially overlapping groups (see above), we considered only the data of the larger group (Kocsis 1996) here. The sample of Kocsis 1996 was replaced by the sample of Miller 2001 in the sensitivity analyses.
Primary outcomes
1.1. Relapse/recurrence rates of depression
The four included studies were all RCTs. Three of them were maintenance treatment studies (Gelenberg 2003; Keller 1998b; Kocsis 1996), while Harrison 1986 was a continuation treatment study. All studies used different antidepressants from varying classes. Participants taking antidepressant medication had significant fewer relapses or recurrences compared to the placebo group at end of the intervention, with moderate heterogeneity (RR 0.41, 95% CI 0.21 to 0.79; participants = 383; studies = 4; I² = 54%; Analysis 1.1; Figure 6). This translated to an NNTB of six.

Forest plot of comparison: 1 Medication versus placebo, outcome: 1.1 Relapse/recurrence.
1.2. Dropout due to any reason
Four RCTs provided overall dropout rates at the end of the intervention. Three were maintenance treatment studies (Gelenberg 2003; Keller 1998b; Kocsis 1996), while Harrison 1986 was a continuation treatment study. We found no significant differences between medication and placebo, with substantial heterogeneity (RR 0.90, 95% CI 0.39 to 2.11; participants = 386; I² = 64%; Analysis 1.2). Two studies reported fewer dropouts in the medication arm (Gelenberg 2003; Kocsis 1996), while the other two studies reported fewer dropouts in the placebo group (Harrison 1986; Keller 1998b).
Secondary outcomes
1.3. Symptom severity of depression
Three RCTs provided means and standard deviations (SDs). Two were maintenance treatment studies (Gelenberg 2003; Keller 1998b), while Harrison 1986 was a continuation treatment study. Participants in the medication groups showed a significantly lower symptom severity on the HAM‐D at the end of the intervention compared to the placebo groups, with moderate to substantial heterogeneity (MD –4.79, 95% CI –8.49 to –1.09; participants = 333; I² = 60%; Analysis 1.3).
1.4. Health‐related quality of life
One RCT provided quality of life measures at the end of the intervention and reported three subscales of the SF‐36 (Keller 1998b). In this maintenance treatment study, participants in the medication group reported both higher social functioning (MD 10.80, 95% CI 3.04 to 18.56; participants = 161; Analysis 1.4) and fewer limitations owing to emotional problems (MD 20.70, 95% CI 7.43 to 33.97; participants = 161; Analysis 1.5). There was no significant difference between groups for the subscale of role limitations owing to physical health problems (Analysis 1.6).
1.5. Dropout due to any type of adverse events
Three RCTs provided data on dropouts due to adverse events at the end of the intervention. Two were maintenance treatment studies (Gelenberg 2003; Keller 1998b), while Harrison 1986 was a continuation treatment study. There was no significant difference between medication and placebo groups (OR 3.53, 95% CI 0.67 to 18.70; participants = 333; I² = 46%; Analysis 1.7).
1.6. Any type of adverse event
One RCT provided data on experiencing any adverse event (physical problems such as headache or insomnia) at the end of the intervention (Keller 1998b). In this maintenance treatment study, there was no significant difference between medication and placebo (OR 1.47, 95% CI 0.70 to 3.09; participants = 161; Analysis 1.8). The continuation treatment study of Harrison 1986 (RCT) also provided data on adverse events, but solely for the medication group. In the medication group all participants had adverse events.
1.7. Serious adverse events
We found no studies reporting participants experiencing serious adverse events.
2. Pharmacological continuation and maintenance therapies versus treatment as usual
None of the included studies compared pharmacological continuation and maintenance therapies versus TAU.
3. Psychological continuation and maintenance therapies versus attention placebo/non‐specific control
One maintenance treatment study (RCT) provided data on the comparison psychotherapy versus assessment only (Klein 2004).
Primary outcomes
3.1. Relapse/recurrence rates of depression
Rates of relapse/recurrence were significantly lower in the psychotherapy group (RR 0.37, 95% CI 0.14 to 0.93; participants = 82; Analysis 2.1). This translated to an NNTB of five.
3.2. Dropout due to any reason
There were no significant differences between the overall dropout rates (RR 0.87, 95% CI 0.41 to 1.81; participants = 82; Analysis 2.2).
Secondary outcomes
3.3. Symptom severity of depression
Depression severity was significantly lower in the psychotherapy group at the end of the intervention (MD –4.00, 95% CI –7.05 to –0.95; participants = 82; Analysis 2.3).
3.4. Health‐related quality of life
The study did not report health‐related quality of life.
3.5. Dropout due to any type of adverse events
The study did not report dropout due to any type of adverse events.
3.6. Any type of adverse event
The study did not report participants experiencing any type of adverse event.
3.7. Serious adverse events
The study did not report participants experiencing serious adverse events.
4. Psychological continuation and maintenance therapies versus treatment as usual
None of the included studies compared psychological continuation and maintenance therapies versus TAU.
5. Psychological continuation and maintenance therapies versus pharmacological continuation and maintenance therapies
One continuation treatment study (NRCT) provided data on the comparison psychotherapy versus medication (Kocsis 2003).
Primary outcomes
5.1. Relapse/recurrence rates of depression
There were no significant differences in relapse/recurrence rates between groups (RR 1.22, 95% CI 0.43 to 3.49; participants = 176; Analysis 3.1).
5.2. Dropout due to any reason
There were no significant differences in dropout rates between groups, although there was a tendency favouring psychotherapeutic treatment (RR 0.56, 95% CI 0.30 to 1.03; participants = 179; Analysis 3.2).
Secondary outcomes
5.3. Symptom severity of depression
The study did not report depression severity scales.
5.4. Health‐related quality of life
The study did not report health‐related quality of life.
5.5. Dropout due to any type of adverse events
The study did not report dropout due to any type of adverse events.
5.6. Any type of adverse event
The study did not report participants experiencing any type of adverse event.
5.7. Serious adverse events
The study did not report participants experiencing serious adverse events.
6. Combined psychological and pharmacological continuation and maintenance therapies versus pharmacological continuation and maintenance therapies alone
Two continuation treatment studies compared combined psychological and pharmacological continuation and maintenance therapies versus pharmacological continuation and maintenance therapies alone: Kocsis 2003 (NRCT) compared nefazodone (participants = 91) with nefazodone plus CBASP (participants = 150), while Hellerstein 2001 (RCT) compared fluoxetine only (participants = 19) with fluoxetine plus group psychotherapy (participants = 20).
Primary outcomes
6.1. Relapse/recurrence rates of depression
Kocsis 2003 (NRCT) provided data on relapse/recurrence rates, showing no significant difference between participants taking medication only (nefazodone) or medication combined with psychotherapy (CBASP) (RR 1.23, 95% CI 0.44 to 3.44; participants = 238; Analysis 4.1).
6.2. Dropout due to any reason
Both studies provided overall dropout rates at the end of the intervention and found no significant differences between medication only and the combined treatment, with no heterogeneity (RR 1.43, 95% CI 0.90 to 2.29; participants = 280; I² = 0%; Analysis 4.2).
Secondary outcomes
6.3. Symptom severity of depression
One RCT provided continuous data on depression severity scale (Hellerstein 2001). Participants in the combined treatment group showed significantly lower symptom severity on the HAM‐D at the end of the intervention compared to the medication only group (MD 2.80, 95% CI 0.38 to 5.22; participants = 39; Analysis 4.3). This study also provided follow‐up data 12 weeks after the end of the intervention. There was no significant differences between both groups (MD 0.90, 95% CI –3.26 to 5.06; participants = 39; Analysis 4.4).
6.4. Health‐related quality of life
Hellerstein 2001 (RCT) provided health‐related quality of life measures at the end of the intervention and at follow‐up 12 weeks after the end of the intervention. There were no significant differences between groups at either time point, using the SWLS (end: MD –0.50, 95% CI –1.63 to 0.63; participants = 35; Analysis 4.5; follow‐up: MD 0.60, 95% CI –0.56 to 1.76; participants = 33; Analysis 4.6).
6.5. Dropout due to any type of adverse events
Neither study reported dropout due to any type of adverse events.
6.6. Any type of adverse event
Neither study reported participants experiencing any type of adverse event.
6.7. Serious adverse events
Neither study reported participants experiencing serious adverse events.
7. Combined psychological and pharmacological continuation and maintenance therapies versus psychotherapeutic continuation and maintenance therapies alone
One continuation treatment study (NRCT) provided data on the comparison psychotherapy (CBASP, participants = 88) versus combined treatment (nefazodone plus CBASP, participants = 150) (Kocsis 2003).
Primary outcomes
7.1. Relapse/recurrence rates of depression
There was no difference in rates of relapse/recurrence between groups (RR 1.51, 95% CI 0.57 to 4.01; participants = 234; Analysis 5.1).
7.2. Dropout due to any reason
There was no difference in overall dropout rates at the end of the intervention between groups (RR 0.82, 95% CI 0.45 to 1.51; participants = 238; Analysis 5.2).
Secondary outcomes
7.3. Symptom severity of depression
The study did not report depression severity scales.
7.4. Health‐related quality of life
The study did not report health‐related quality of life.
7.5. Dropout due to any type of adverse events
The study did not report dropout due to any type of adverse event.
7.6. Any type of adverse event
The study did not report participants experiencing any type of adverse event.
7.7. Serious adverse events
The study did not report participants experiencing serious adverse events.
8. Comparison of different antidepressant medications (post hoc analyses)
Two continuation treatment studies (NRCTs) compared two different antidepressant medications (Kocsis 1995; Koran 2001). Although we did not predefine this comparison as a main comparison of interest in the study protocol, we opted to report these additional data.
8.1. Imipramine versus desipramine
One study provided data on the comparison of two different TCAs (imipramine and desipramine) (Kocsis 1995).
Primary outcomes
8.1.1. Relapse/recurrence rates of depression
The study did not report relapse/recurrence rates of depression.
8.1.2. Dropout due to any reason
Significantly more participants dropped out in the imipramine group (RR 4.35, 95% CI 1.19 to 15.87; participants = 73; Analysis 6.1). This translated to an NNTB of five, that is, five participants must have been treated with desipramine to maintain one additional participant in treatment.
Secondary outcomes
8.1.3. Symptom severity of depression
The study did not report depression severity scales.
8.1.4. Health‐related quality of life
The study did not report health‐related quality of life.
8.1.5. Dropout due to any type of adverse events
There were no significant differences in dropout rates due to adverse events between groups (OR 1.49, 95% CI 0.23 to 9.60; participants = 73; Analysis 6.2).
8.1.6. Any type of adverse event
The study did not report participants experiencing any type of adverse event.
8.1.7. Serious adverse events
The study did not report participants experiencing serious adverse events.
8.2. Imipramine versus sertraline
One study compared a TCA (imipramine) with an SSRI (sertraline) (Koran 2001).
Primary outcomes
8.2.1. Relapse/recurrence rates of depression
There were no significant differences in relapse/recurrence rates between groups (RR 1.27, 95% CI 0.84 to 1.91; participants = 376; Analysis 7.1).
8.2.2. Dropout due to any reason
There were no significant differences in overall dropout rates between groups (RR 0.81, 95% CI 0.48 to 1.38; participants = 386; Analysis 7.2).
Secondary outcomes
8.2.3. Symptom severity of depression
There was no significant difference in depression severity (measured with the HAM‐D) at the end of the intervention between groups (MD 0.40, 95% CI –0.97 to 1.77; participants = 377; Analysis 7.3).
8.2.4. Health‐related quality of life
The degree of enjoyment and satisfaction in different areas of daily functioning (Q‐LES‐Q) at the end of the intervention was significantly higher in the sertraline group (MD –4.30, 95% CI –7.31 to –1.29; participants = 347; Analysis 7.4).
8.2.5. Dropout due to any type of adverse events
There were no significant differences in dropout rates due to adverse events between groups (OR 1.99, 95% CI 0.60 to 6.65; participants = 386) (Analysis 7.5).
8.2.6. Any type of adverse event
The study did not report participants experiencing any type of adverse event.
8.2.7. Serious adverse events
The study did not report participants experiencing serious adverse events.
Subgroup analyses
We were unable to perform any of the a priori defined subgroup or meta‐regression analyses due to limited number of studies.
Sensitivity analyses
We could perform sensitivity analyses only for one comparison (pharmacological continuation and maintenance therapies versus placebo) as all other comparisons did not provide enough data.
Excluding studies with a high or unclear risk of bias
For each risk of bias domain, we planned to exclude the studies with high or unclear risk to compare these results with the results of the analysis including all studies.
For the domains 'random sequence generation', 'allocation concealment', and 'selective reporting', none of the studies had a low risk of bias, thus these sensitivity analyses could not be performed.
For the domain 'blinding of participants and personnel', all of these studies had a low risk of bias.
For the domain 'blinding of outcome assessment', only Gelenberg 2003 had a low risk of bias. When including only Gelenberg 2003, the difference between medication and placebo for relapse or recurrence rate of depression did not reach significance (RR 0.76, 95% CI 0.47 to 1.23; P = 0.27), whereas for dropout due to any reason, there was a significant difference favouring medication (RR 0.48, 95% CI 0.24 to 0.94; P = 0.03). For depression severity, the difference between medication and placebo was not significant when including Gelenberg 2003 only (MD –2.10, 95% CI –5.08 to 0.88; P = 0.17). For dropout due to any type of adverse event, there was no significant difference between medication and placebo, which was consistent with the original results.
For the domain 'incomplete outcome data', we excluded Keller 1998b as it had a high risk of bias. There was no change for relapse or recurrence rate of depression or dropout due to any reason (except a lower rate of heterogeneity for dropout due to any reason). For severity of depression, the heterogeneity increased when excluding Keller 1998b. Medication was still superior to placebo but the differences between the two groups was not significant (MD –5.63, 95% CI –14.17 to 2.90; P = 0.20). For dropout due to any type of adverse event, the results did not change substantially when excluding Keller 1998b.
For the domain 'other potential sources of bias', the studies of Kocsis 1996 and Miller 2001 (comparing desipramine with placebo) with the partially overlapping subgroup had a low risk of bias. Including only Kocsis 1996, the difference between medication and placebo for relapse or recurrence rate of depression remained significant. For dropout due to any reason, the difference between medication and placebo was not significant, corresponding to the original results. For severity of depression and dropout due to any type of adverse event there were no data available for Kocsis 1996.
In summary, the sensitivity analyses could only focus on three of the seven risk of bias domains and on the two primary outcomes (relapse or recurrence rate of depression, dropout due to any reason) and on two secondary outcomes (severity of depression, dropout due to any type of adverse event).
Excluding trials without a randomization on a personal level or without (re)randomization before the continuation phase
We could not perform these analyses as all studies providing data on the comparison pharmacological continuation and maintenance therapies versus placebo were RCTs with randomization on a personal level.
Post hoc sensitivity analyses
As there were two partially overlapping groups included in our review regarding the comparison pharmacological continuation and maintenance therapies versus placebo (Kocsis 1996; Miller 2001), we decided to perform an a posteriori defined sensitivity analysis (including Miller 2001 instead of Kocsis 1996). Miller 2001 investigated the dysthymic subsample of Kocsis 1996 but also included additional people with dysthymia. Miller 2001 only provided data on relapse or recurrence rate of depression. The RR was slightly lower with a broader CI and a slightly higher heterogeneity when including Miller 2001 instead of Kocsis 1996 (RR 0.38, 95% CI 0.16 to 0.89; I² = 58%; Analysis 1.9). We considered these differences as clinically not meaningful.
Discussion
Summary of main results
This review was based on data from 10 studies, from which five studies investigated continuation treatments and five studies investigated maintenance treatments. All maintenance treatment studies and two continuation treatment studies applied an RCT design. The remaining three continuation treatment studies used an NRCT design. Five studies included comparisons of antidepressant medication versus tablet placebo. Only three studies involved psychological treatment. Two of these three studies investigated the effect of the Cognitive Behavioral Analysis System of Psychotherapy (CBASP) compared to antidepressant medication or combined treatment, or against assessment only, while the other study compared antidepressant medication to medication plus group therapy. We also analyzed data for a posteriori defined comparison, the direct comparison of two antidepressants. All 10 studies reported data at the end of the intervention, while only one study also reported follow‐up data 12 weeks after the end of the intervention.
Pharmacological continuation and maintenance therapies versus placebo
Five studies compared continuation or maintenance antidepressant medication with tablet placebo. The class of antidepressant medication varied between the included studies, SSRIs, MOIs, SNDRIs, and TCAs were used. For the analyses, we excluded one study (Miller 2001), due to an overlapping group of participants with the study of Kocsis 1996 and included four studies involving 383 participants in our analyses. There was moderate quality of evidence that participants taking antidepressant medication had significantly fewer relapses or recurrences and a lower depressive symptom severity score compared to participants taking placebo at the end of the intervention. The results did not change significantly when replacing Kocsis 1996 by Miller 2001. However, the sensitivity analysis showed that the difference between medication and placebo for relapse or recurrence rate of depression and depression severity was not significant when the only study (Gelenberg 2003) with low risk of bias for assessor outcome blinding was included.
Continuation/maintenance antidepressant medication reduced risk of relapse or recurrence rate of depression with an NNTB of six. Heterogeneity between studies was moderate. For the outcome relapse or recurrence rate of depression, three studies showed similar between‐group effect sizes, although these studies varied largely regarding treatment duration and sample size (Harrison 1986; Keller 1998b; Kocsis 1996). In comparison, in Gelenberg 2003, the effect favouring medication was smaller with a rather narrow CI, and as explained above, sensitivity analyses revealed that this effect was not significant when only including Gelenberg 2003. Miller 2001 showed a very strong effect favouring medication with a very large CI (due to small sample size). In Miller 2001, solely participants with dysthymia were treated over a period of 104 weeks, therefore the design and setting of this study is different from the other four studies. Besides, all studies used different antidepressants from varying classes, which could have contributed to the moderate degree of heterogeneity.
We found no significant differences between medication and placebo concerning the overall dropout rate. However, the quality of evidence for this result was rated as low. Heterogeneity was substantial (I² = 64%). In Harrison 1986, no participant in the placebo group dropped out, but they reported that all participants in the placebo group relapsed (therefore a dropout due to other reasons than relapse/recurrence was not possible by definition). In addition, two studies investigated rather small sample sizes, resulting in large CIs (Harrison 1986; Kocsis 1996).
Participants taking antidepressant medication had a significantly lower depressive symptom severity score compared to participants taking placebo at the end of the intervention (based on three RCTs). Two of these studies, both maintenance treatment studies, showed very similar results, both in means and SDs pre‐ and post‐treatment and generally, in design of the study (maintenance phase, lasting 52 weeks (Gelenberg 2003) or 76 weeks (Keller 1998b)). Treatment duration in the continuation treatment study of Harrison 1986 was 26 weeks, and participants in the medication arm reported lower and participants in the placebo group higher symptom severity scores compared to the corresponding groups in the other two studies. These factors might have contributed to considerable heterogeneity between the three studies.
Regarding relapse or recurrence rate of depression and severity of depression, the results are unconvincing whether or not continued or maintained (or both) pharmacotherapy was superior to tablet placebo in persistent depressed participants.
Three RCTs provided data on dropout due to any type of adverse event at the end of the intervention and low quality of evidence indicated no significant difference between medication and placebo (Gelenberg 2003; Harrison 1986; Keller 1998b). These three studies varied in sample size, dropout rates due to adverse events in general and between treatment arms, potentially contributing to the moderate degree of heterogeneity. In the continuation treatment study of Harrison 1986, no participant in the placebo group dropped out due to adverse events, but all of these participants relapsed (before), and this study had a small sample size and rather short treatment duration compared to the other two studies. The maintenance treatment study of Keller 1998b showed considerable differences in dropout rates between the groups, favouring placebo, and treatment lasted 76 weeks. In comparison to the other two studies, Gelenberg 2003 showed the smallest difference in dropout rates due to an adverse event between the medication and placebo group during the maintenance treatment phase. It was unclear if participants actually took the medication throughout the entire maintenance phase as no laboratory tests were reported (see Characteristics of included studies table). This could possibly lead to less reporting of adverse events.
One study provided quality of life measures, in which participants in the medication group benefited compared to placebo (Keller 1998b).
Psychological continuation and maintenance therapies versus attention placebo/non‐specific control
One maintenance treatment study with 52 weeks' duration, involving 82 participants, compared psychological continuation and maintenance therapies versus attention placebo/non‐specific control (Klein 2004). The study showed fewer relapse or recurrence rate of depression and a lower depression severity score in the CBASP group compared to the assessment‐only group at the end of the intervention. Maintained CBASP treatment reduced the risk of relapse or recurrence with an NNTB of five. Overall dropout rates were similar in both treatment arms. It might be assumed that maintained active psychotherapy has a positive effect on depression outcomes compared to assessment only.
Psychological continuation and maintenance therapies versus pharmacological continuation and maintenance therapies
Only one study, involving 179 participants, provided data on the active comparison of psychotherapy with medication during the continuation treatment phase (Kocsis 2003). Although participants receiving CBASP and participants taking nefazodone did not differ regarding relapse or recurrence of depression and overall dropout rate at the end of the intervention, there was a tendency favouring psychotherapeutic treatment observable regarding dropout.
Combined psychological and pharmacological continuation and maintenance therapies versus pharmacological continuation and maintenance therapies alone
Three studies compared combined psychological and pharmacological continuation and maintenance therapies versus pharmacological continuation and maintenance therapies alone. One continuation treatment study, involving 238 participants, provided relapse or recurrence rates of depression and showed no statistically significant differences between the group taking nefazodone and the group receiving CBASP plus nefazodone (Kocsis 2003). Two studies, involving 280 participants, provided overall dropout rates, showing no statistically significant differences between medication alone and the combined treatment (Hellerstein 2001; Kocsis 2003). One study, involving 39 participants, reported a significant lower depression severity score for the combined group compared to medication alone at the end of the intervention (Hellerstein 2001). However, this effect did not remain at 12 weeks' follow‐up. This same study provided quality of life measures, and found no differences between groups at the end of the intervention and follow‐up.
Combined psychological and pharmacological continuation and maintenance therapies versus psychotherapeutic continuation and maintenance therapies alone
One continuation treatment study, involving 238 participants, compared combined psychological and pharmacological continuation and maintenance therapies versus psychotherapeutic continuation and maintenance therapies alone. It found no significant differences for relapse or recurrence of depression and overall dropout rates between the CBASP group and the CBASP plus nefazodone group (Kocsis 2003).
Comparison of different antidepressant medications (post hoc analyses)
Two studies reported data on the direct comparison of two antidepressants. One continuation treatment study, involving 73 participants, compared two TCAs, where overall dropout rates were higher in the imipramine group compared to the desipramine group (Kocsis 1995). Compared to imipramine, desipramine reduced the dropout risk with a NNTB of five. Dropout rates due to any type of adverse events did not differ significantly between the two groups. The imipramine sample was relatively small (participants = 23) and only half the size of the desipramine sample. The three dropouts in the desipramine group dropped out due to dissatisfaction with treatment response or due to adverse effects. In the imipramine group, one participant discontinued because of adverse effects, one participant had a dispute with the staff, and four participants did not comply with the follow‐up assessment. Data on relapse or recurrence rates of depression were not provided in this comparison.
The second study, a continuation treatment study involving 386 participants, compared a TCA with an SSRI, showing no significant differences between groups regarding relapse or recurrence of depression, overall dropout rate, dropout rate due to any type of adverse events, and severity of depression severity at the end of the intervention (Koran 2001). This study provided quality of life measures, in which participants of the SSRI group reported a significantly higher quality of life at the end of the intervention.
Overall completeness and applicability of evidence
Only 10 studies were identified for inclusion in this review. Most of the studies retrieved in the search could not be included in the review as: they treated solely participants with recurrent depression (with clear interepisode remission and an episode duration shorter than two years); they did not clearly assess the percentage of diagnostic subgroups of persistent depressive disorder; or they reported no subgroup analyses. Thus, it can be assumed that there are more studies available involving people with persistent depression, but as no specific percentages were available from the publications or following contact with the authors, these data could not be considered for this review. Moreover, some long‐term studies had to be excluded because they did not define clear response or remission criteria for entering the next treatment phase which we required for inclusion in the review as response or remission are considered as accurate criteria of continuation or maintenance treatments (Frank 1991). Overall, this resulted in a rather small body of evidence available for addressing the objectives of this review.
Regarding the 10 included studies, for most comparisons only one or two studies provided data for the analyses, limiting the informative value of the presented results. For the comparison of antidepressant medication and placebo, five studies provided consistent data although they used different classes of medication. Only three of the included studies involved psychological treatments, two of them applied to individual participants (CBASP), the other applied as a group therapy, both conducted in an outpatient setting in the US. More studies are required to evaluate the different forms of psychotherapy (e.g. IPT, CBT, CBASP, MBCT, psychodynamic therapy) in varying treatment settings (individual, group), cultures, and healthcare systems. Moreover, just two studies investigated the combination of psychotherapy and antidepressant medication although guidelines already recommend combined treatment for persistent depressive disorders (DGPPN 2015). Also, we expected to include comparisons with TAU, investigating if long‐lasting continuation and maintenance treatments are implemented in healthcare systems and evaluating these treatments under natural conditions. Unfortunately, we identified no studies using this comparator.
From the 10 included studies, five were continuation studies and five were maintenance studies. Maintenance treatment studies varied largely regarding the duration of treatment (12 to 24 months), while the preceding continuation treatment studies were more similar in duration (16 to 20 weeks). Per definition, participants remitted or at least partially responded during acute treatment should start continuation treatment within one year after terminating acute treatment. Then, maintenance treatments should be given during recovery, which is defined as remission lasting longer than six months (Frank 1991; NICE 2010). Three studies providing a continuation treatment phase defined a duration of 16 to 20 weeks' treatment before participants entered a subsequent maintenance phase. This does not correspond to the recommended criterion of six months' recovery before entering maintenance treatment. Still, we decided to include these studies in the review and followed the definition of the authors as they described reasonable criteria for participants being eligible to enter the maintenance phase. We kept the term 'maintenance treatment' for these treatments as they were longer than the examined continuation treatments, consistently. Due to the small amount of included studies, we did not differentiate between effects of continuation versus maintenance treatments during the analyses, which would be valuable considering the distinct criteria of remission/recovery for both treatment phases. Particularly in persistent depressive disorder with participants showing severe levels and duration of symptoms, clear criteria for receiving both treatments following acute therapy are required. Therefore, a consistent application of the terms continuation and maintenance treatment and corresponding implementation into research and health care is needed before definite conclusions about the effectiveness of such treatments can be drawn.
For this review, the primary efficacy outcome was relapse or recurrence. Most of the studies applied rather strict criteria for participants to fulfil this outcome criterion at the end of the intervention (e.g. exceeding cut‐offs during two or three consecutive sessions followed by a personal interview with a study investigator clarifying a potential diagnosis). Such procedures contribute to keeping participants longer in the study programme and possibly underestimate absolute relapse and recurrence rates. Different definitions of this outcome between the included studies also prevent a comparison of absolute relapse/recurrence rates between the examined treatments. Additionally, it must be kept in mind that two different target figures were mixed here: relapse defined the return of symptoms before full remission was reached, while recurrence indicated a new episode after a full remission had been reached.
The primary acceptance outcome was dropout due to any reason (other than relapse/recurrence), of which nine of the 10 studies reported data. Specific reasons for dropout and specific adverse events were rarely described. Instead, general statements about adverse events were reported (e.g. that adverse effects evolved in at least 10% of participants). But, next to adverse effects, other negative events such as interpersonal problems (e.g. conflicts with others) might occur during or after treatment. Such adverse events were reported very rarely in the included studies of this review, but should be addressed clearly in future research (Meister 2016). Especially in long‐term treatments such as continuation and maintenance treatments, dropout is considered likely and should be assessed in more detail (e.g. if participants dropped out due to aspects of the intervention itself or due to other reasons).
Another secondary outcome of interest of this review were quality of life measures. Only three of the 10 studies addressed this outcome although psychotherapeutic and pharmacological treatments are considered to improve quality of life in depressive disorders (Kamenov 2017). As persistent depressive disorders are characterized by a chronic course, an exclusive focus on improvement of depressive symptomatology over a long time might be too narrow to describe health status of participants completely. Including quality of life measures more frequently into studies is recommended.
Moreover, we intended to analyse data at the time point 'one year after the end of the intervention'. Surprisingly, just one of the 10 studies provided follow‐up data, and even this study addressed a short follow‐up duration (12 weeks). Particularly in persistent depressive disorder, we consider the evaluation of long‐term effects beyond termination of treatment as highly relevant and valuable information to provide recommendations on when therapy should be extended, changed, or terminated.
PDD is a rather severe form of depression with people probably experiencing comorbid disorders including personality disorders, suicidality or psychotic symptoms, and usually undergoing several other treatments before entering a study, which in turn was an exclusion criterion in some of the included studies for this review. This raises the question about what type of participants joined the studies we included in this review – severely impaired or less impaired people? Although these previously mentioned exclusion criteria were defined (e.g. other mental disorders as main diagnoses), a high percentage of included participants experienced comorbid conditions (e.g. in Keller 1998b and Kocsis 1996 half of the sample had an axis‐II‐diagnosis). Additionally, anxiety disorders and substance abuse was highly prevalent in samples reporting comorbid conditions. Further, as lifetime duration of depression ranged from 15 to 24 years, we can assume that – despite the exclusion criteria – severely impaired participants were included in our analyses with illness duration and comorbidity rates comparable to those known from previous research (Gilmer 2005; Kocsis 2008). However, not all studies reported on comorbidity and chronicity, so this information was not available for the whole sample.
Six studies had failing previous trials of antidepressant medication as an exclusion criterion (i.e. studies excluded so‐called treatment‐resistant participants). But, as response is a requirement for continuation and maintenance treatment, results of those studies are not applicable to treatment‐resistance anyway.
Experience with prior treatment is common in this severely impaired group and was not an exclusion criterion in the analyzed studies – especially the experience with psychotherapy was high (63% to 85%) in the five studies providing data on this issue.
Another aspect regarding the applicability of evidence is date of publication. Studies included in this review were published between 1986 and 2004. The current practice including available medication and psychotherapy for treating people with persistent forms of depression might have been different at that time. For example, nefazodone, which was used in two of the included studies (Gelenberg 2003; Kocsis 2003), was withdrawn from the market in 2003 (Kocsis 2003) and 2004 (Gelenberg 2003) in some countries due to the rare incidence of hepatoxicity (Cosgrove‐Mather 2004).
Quality of the evidence
For most of the planned comparisons only one or two studies provided data. Thus, we reported a 'Summary of findings' table only for the comparison of pharmacological continuation and maintenance therapies versus placebo, referring to the quality of evidence of the primary outcomes relapse/recurrence and overall dropout.
Limitations in study design or execution (risk of bias)
We included seven RCTs and three NRCTs involving 840 participants with persistent depressive disorder. Two of the three NRCTs were evaluated as having almost no risk of bias in the seven domains, while the other study was classified between moderate and serious risk for more than half of the domains. The seven included RCTs varied regarding risk of bias domains, and were rated mostly as low or unclear risk of bias, with one exception. One study was at high risk of bias in four domains and unclear risk of bias in three domains (Hellerstein 2001). In general, none of the studies addressed allocation concealment and random sequence generation and, therefore, were at unclear risk, and selective reporting at unclear risk in five of these seven studies. One study with high risk of bias in the domain selective reporting analyzed data on dropout during the 104‐week maintenance phase, but only the rates during the first month of treatment, probably underestimating the actual dropout rate over time (Kocsis 1996).
To separate the two primary outcomes (relapse/recurrence and overall dropout), we did not include the participants with relapse/recurrence in the overall dropout rates. This must be kept in mind when interpreting the absolute dropout rates. Additionally, as in one study, all participants in the placebo group relapsed and there was no information on the time of relapse, the dropout rate in this group was zero, possibly overestimating the acceptance of this treatment. If the participants relapsed early, there was 'no chance' for accepting or not accepting the treatment. Two studies reported incomplete outcome data at high risk (Hellerstein 2001; Keller 1998b), as they applied the LOCF method for imputing missing values. In Keller 1998b, 70% of the participants in the placebo group dropped out during the 76‐week maintenance treatment, thus the missing data were replaced by the last available measure of the participant. Although this method is commonly used for analyzing longitudinal data, we consider this procedure inappropriate within the context of continuation/maintenance treatments as it potentially underestimates relapse and recurrence rates. As LOCF assumes that the missing data after the participant's dropout stay the same as the last value observed for that participant (Shih 2002), we assumed that LOCF provided rather optimistic estimates instead of conservative estimates. This assumption of stability is rather unlikely for persistent depressive disorder over long periods of time considering the high likelihood of recurrences reported in previous research.
Analyses regarding dropout rates for the comparison of antidepressant medication versus placebo resulted in serious heterogeneity between studies. Due to the small number of studies, we were unable to analyse these differences statistically. These circumstances in combination with the mentioned limitations of the studies contributed to downgrading the body of evidence for this comparison regarding the outcome dropout (other than relapse/recurrence) to low (see summary of findings Table for the main comparison).
Inconsistency of results
Data were inconsistent in regard to overall dropout rates. Dropout rates varied between studies from 4% (Kocsis 1996) and 100% (Harrison 1986). This unexplained heterogeneity contributed to downgrading the quality of evidence to low regarding overall dropout rates in the comparison of antidepressant medication versus placebo.
Indirectness of evidence
All included studies directly addressed the objective of this review, namely the comparative effectiveness of continuation and maintenance treatments for persistent depressive disorder.
Imprecision of results
Two of four studies addressing overall dropout rates in the comparison of antidepressant medication versus placebo showed wide CIs (Harrison 1986; Kocsis 1996). This contributed to downgrading the quality of evidence to low.
Publication bias
Due to the small number of included studies, we applied funnel plot only for the comparison antidepressant medication versus tablet placebo. Apparently, the funnel plot on relapse/recurrence was asymmetrical, with an overhang of small studies showing a large difference in favour of medication), while the funnel plot on dropout was symmetrical. The application of statistical tests (e.g. Egger's test) for funnel plot asymmetry was not conducted, as it is not advisable due to the small number of studies. The Cochrane Handbook for Systematic Reviews of Interventions recommends these tests when there are at least 10 studies, otherwise the power is too low (Higgins 2011).
Potential biases in the review process
We used a broad search strategy for identifying all relevant studies regarding continuation and maintenance treatments in PDD. The main search was conducted in the specialized register of RCTs of the Cochrane Common Mental Disorders Group (CCMD‐CTR) searching for study and reference records. Moreover, we searched other databases, grey literature, clinical trials registers, and contacted relevant authors in this field. We had to exclude a considerable number of studies as most either did not include specifically participants with PDD or did not report the percentage of treated PDD participants. Although we were in email contact with the first authors of the included papers regarding this missing information, they either did not reply to our queries or simply had specific data no longer available due to conducting these studies several years ago. Therefore, we assumed that more studies than those included in this review were conducted with participants with PDD.
At least two review authors independently screened records, and extracted and analyzed data to prevent any severe bias in the used methods.
There was marked clinical heterogeneity between the included studies, especially regarding sample size, subtype of persistent depression, type of treatment (e.g. type of antidepressant medication), treatment duration, and definition of relevant outcomes. Therefore, we are not reporting on a homogeneous group of participants, manifesting in both studies investigating a specific subgroup (e.g. solely people with dysthymia) and studies investigating all four diagnostic subgroups of PDD, making it difficult to generalize the results to PDD in general. This also applied to the type of treatment: studies included continuation and maintenance treatment with lengths between 16 weeks and two years, which allows no conclusion on continuation or maintenance treatment in general.
We required the included studies to report on ICD or DSM diagnosis of PDD, neglecting total duration of illness or other potential indicators of impairment. But, as we required clear response or remission criteria for considering continuation or maintenance treatment studies for this review, symptom level of included participants was considered rather homogeneous. The pharmaceutical industry funded some of the included studies with grants. Conducting long‐term continuation and maintenance studies requires considerable financial support, potentially leading to bias of the found results if covered by third parties. However, we considered risk of publication bias as low but the application of a statistical test was not advisable due to the small number of studies. Additionally, the required length of treatment – especially of maintenance studies – is possibly one reason for the lack of studies in this field.
Another aspect of potential bias was the allowance or prescribing of concomitant treatments in addition to the treatment provided by the study. Two of the included studies investigating antidepressant medication reported that participants received ongoing psychotherapy. One study reported that 60% of the participants received ongoing psychotherapy while treated with sertraline or imipramine, yet there were no group differences (Koran 2001). In two studies, about 40% of the participants of both treatment groups (desipramine, placebo) were on stable long‐term psychotherapy regimens (Kocsis 1996; Miller 2001). Although parallel treatment is not necessarily considered to bias the results, especially when proportions are similar between treatment groups, the observed individual change is not solely based on study treatment but also on parallel treatment in the respective two studies. Additionally, interaction effects may occur: 1. the effect of antidepressant medication could be underestimated because the received psychotherapy makes an additional treatment (antidepressant medication) less meaningful or 2. receiving parallel psychotherapy intensifies the effect of medication or keeps the participant motivated to stay on medication. However, the other studies did not mention any information about parallel treatments or explicitly stated that no concomitant treatment was allowed.
Despite the discussed conceptual and methodological concerns, we considered conducting a meta‐analysis appropriate, especially for the comparison of antidepressant medication versus tablet placebo. However, sensitivity analyses addressed differences in risk of bias between studies, and found no significant differences between medication and placebo regarding the primary outcome rate of relapse/recurrence when only studies with low risk of bias were included. Heterogeneity was planned to be addressed through subgroup and meta‐regression analyses but, due to the low number of studies included, we were only able to discuss differences between studies on a descriptive level. In general, for the majority of comparisons we had to describe the results based on one single study, not being able to report pooled results.
This review used two primary outcomes, rate of relapse/recurrence and rate of overall dropout due to other reasons than relapse/recurrence. Most of the studies reported on both outcomes separately. Still, there is open discussion if both outcomes overlap conceptually in continuation and maintenance treatment studies. For example, in Harrison 1986, all participants of the placebo group relapsed, resulting in zero dropouts reported during treatment as participants simply had "no chance" for dropping out due to relapsing before, possibly overestimating the acceptance of placebo treatment.
Due to the low number of included studies, we were unable to undertake all planned subgroup and sensitivity analyses. However, in future versions of this review, differences between subgroups should be tested formally (Bucher 1997; Deeks 2008; Song 2003), and all meta‐regression analyses should be performed using the restricted maximum likelihood estimate method, a recommended random‐effects approach that accounts for residual between‐trial heterogeneity (Thompson 1999).
Continuation and maintenance treatment studies are usually performed as complex studies, that is, studies with different treatment phases (acute, continuation, and maintenance treatment). Criteria and procedures of transition from one into the next phase differed between studies: some studies defined response, some remission as an eligibility criterion for the next phase, including different definitions of response and remission (see above). Some studies did not rerandomize participants when entering the new phase (especially concerning the transition from acute to continuation treatment). Other studies rerandomized responders from one treatment arm to a different treatment arm in the next phase, for example Klein 2004 randomized continuation phase responders of CBASP to CBASP or assessment only in the maintenance phase. These different procedures complicate the comparability between different studies. Moreover, studies mostly described different treatment phases, resulting in partly overlapping patient groups included in different analyses.
As persistent depression is a chronic condition, relapses or recurrences are common in this population. Longer treatment durations (i.e. longer observation periods) probably increase the chance to observe relapses or recurrences, this must be kept in mind when comparing the results of different studies with varying treatment durations.
Concerning data analysis, there is no widely accepted consensus on how to deal with missing data in meta‐analysis when primary data are not available. In acute‐phase studies, researchers can replace missing values with methods such as LOCF, if study authors do not report adequate ITT analyses. However, in the case of continuation and maintenance studies, we assume that LOCF would produce rather optimistic instead of conservative estimates (see above) due to its concept of stability of measures over time (Shih 2002). Thus, we had to deal with the available data sets. However, percentages of missing data were low: data on overall dropout rates were complete, the percentage of missing data concerning other outcomes ranged between 0% and 10%.
Agreements and disagreements with other studies or reviews
To our knowledge, this is the first review evaluating the effectiveness of continuation and maintenance treatments in people with PDD.
A previous review investigated the efficacy and acceptability of acute treatments in PDD by applying network meta‐analytic methods, showing that several antidepressant medications were superior to placebo, and that several evidence‐based treatments exist (Kriston 2014). Due to the small number of included studies in our review, comparisons between different antidepressants could not systematically be investigated.
In line with the review of von Wolff 2012 on acute treatment in persistent depression, our review could also not provide a clear superiority of combined treatments compared to pharmacological monotherapy.
Regarding continuation and maintenance studies, Wilkinson 2016 evaluated treatments for older people with depressive disorders. This updated Cochrane Review identified seven studies of which six compared continued or maintained antidepressant medication with placebo, favouring antidepressants regarding relapse/recurrence at 12 months, but showing no significant differences between treatment arms at six or 24 months' follow‐up. Although this result is in line with our result for this comparison and outcome, Wilkinson downgraded the level of evidence to low (GRADE) compared to the GRADE rating of moderate level evidence in our review. Like in our review, Wilkinson 2016 included just two studies involving psychological treatment, and data reported on this as well as combined treatments were too few to draw conclusions.
Regarding long‐term effects of psychological treatments, Vittengl 2007 conducted a meta‐analysis on effects of acute and continued cognitive therapies CTs in depression. They found high relapse and recurrence rates (29% within one year and 54% within two years) for participants discontinuing after acute CT. Those participants continuing CT had significantly fewer relapses and recurrences compared to active controls (e.g. receiving pharmacotherapy) at follow‐up (10 to 255 weeks after end of continuation‐phase treatment), with relapse/recurrence rates of 42% (continued CT) and 61% (active controls) over 114 weeks on average. In comparison, rates of relapse/recurrence were similar at end of (20 to 52 weeks') continuation phase for both CT and other active treatments, with relapse/recurrence rates of 10% (continued CT) and 22% (active controls) over 27 weeks on average. Although the results of Vittengl 2007 are encouraging to consider continued pharmacotherapy or psychotherapy (or both) in depression treatment, the analyses were based on only five to eight studies.
Guidi 2016 conducted a meta‐analysis on the sequential integration of pharmacotherapy and psychotherapy in major depressive disorder, that is participants received pharmacotherapy in the acute phase and psychotherapy in the residual phase. Receiving cognitive‐behavioural therapy (CBT) during continuation of antidepressant drugs was superior to antidepressants alone or TAU. Further, participants receiving CBT who had medication tapered and discontinued were significantly less likely to relapse compared to clinical management or continued pharmacotherapy. These analyses were based on 13 studies.

Study flow diagram. NRCT: non‐randomized controlled trial; PDD: persistent depressive disorder; RCT: randomized controlled trial.
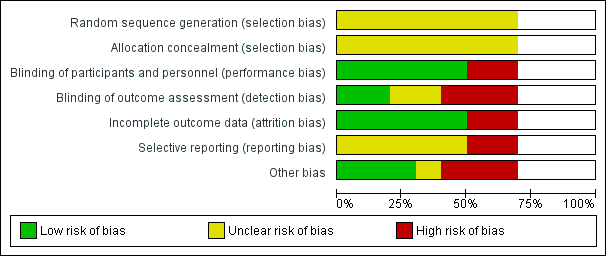
Risk of bias graph: review authors' judgements about each risk of bias item presented as percentages across all included seven randomized controlled trials. Blank space in rows containing no information indicate missing information on the 'Risk of bias' scale for the three non‐randomized controlled trials.

Risk of bias summary: review authors' judgements about each risk of bias item for each included randomized controlled trial (seven studies). Blank space in rows containing no information indicate missing information on the 'Risk of bias' scale for the three non‐randomized controlled trials.

Risk of bias graph non‐randomized controlled trials (NRCT): review authors' judgement about each risk of bias item presented as percentages across all included NRCTs (three studies).
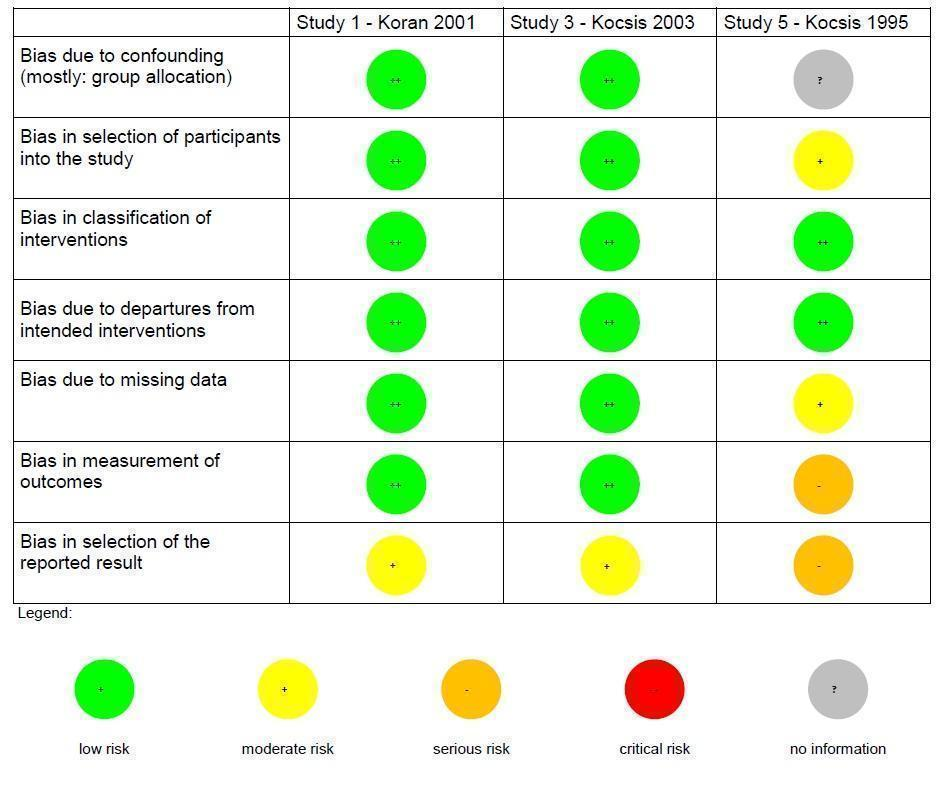
Risk of bias summary non‐randomized controlled trials (NRCT): review authors' judgements about each risk of bias item for each included NRCT (three studies).

Forest plot of comparison: 1 Medication versus placebo, outcome: 1.1 Relapse/recurrence.
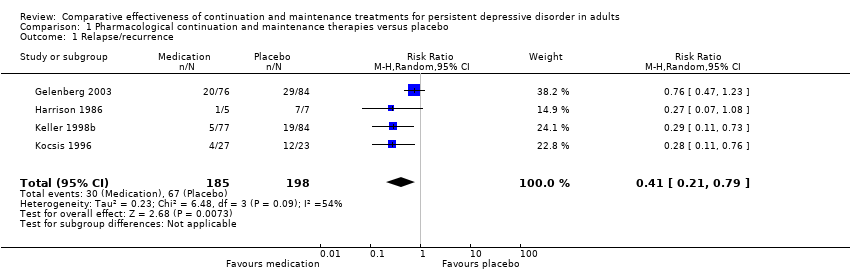
Comparison 1 Pharmacological continuation and maintenance therapies versus placebo, Outcome 1 Relapse/recurrence.

Comparison 1 Pharmacological continuation and maintenance therapies versus placebo, Outcome 2 Dropout due to any reason.

Comparison 1 Pharmacological continuation and maintenance therapies versus placebo, Outcome 3 Depression severity.
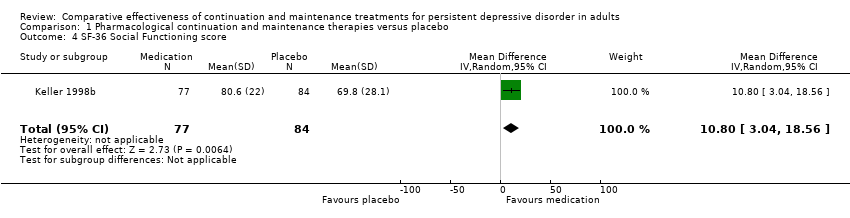
Comparison 1 Pharmacological continuation and maintenance therapies versus placebo, Outcome 4 SF‐36 Social Functioning score.

Comparison 1 Pharmacological continuation and maintenance therapies versus placebo, Outcome 5 SF‐36 Emotional Role score.

Comparison 1 Pharmacological continuation and maintenance therapies versus placebo, Outcome 6 SF‐36 Role Physical score.

Comparison 1 Pharmacological continuation and maintenance therapies versus placebo, Outcome 7 Dropout due to any type of adverse event.

Comparison 1 Pharmacological continuation and maintenance therapies versus placebo, Outcome 8 Any type of adverse event.
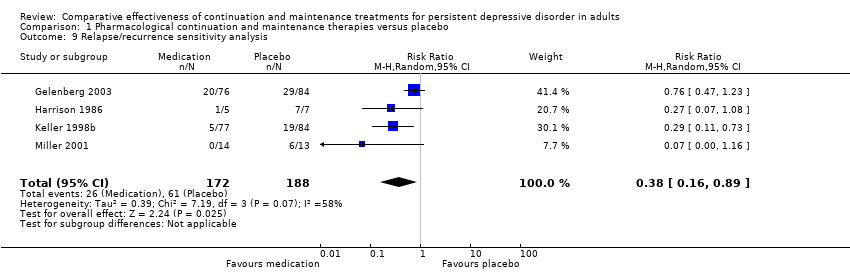
Comparison 1 Pharmacological continuation and maintenance therapies versus placebo, Outcome 9 Relapse/recurrence sensitivity analysis.
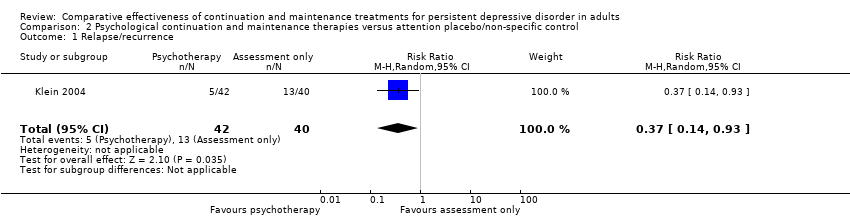
Comparison 2 Psychological continuation and maintenance therapies versus attention placebo/non‐specific control, Outcome 1 Relapse/recurrence.
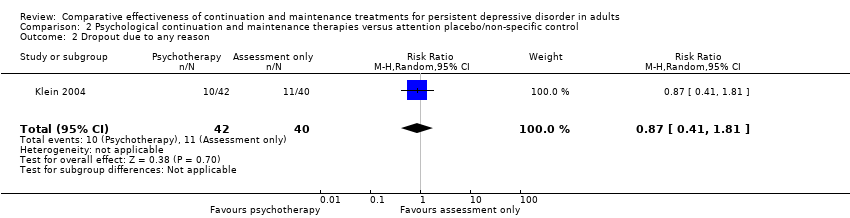
Comparison 2 Psychological continuation and maintenance therapies versus attention placebo/non‐specific control, Outcome 2 Dropout due to any reason.

Comparison 2 Psychological continuation and maintenance therapies versus attention placebo/non‐specific control, Outcome 3 Depression severity.

Comparison 3 Psychological continuation and maintenance therapies versus pharmacological continuation and maintenance therapies, Outcome 1 Relapse/recurrence.

Comparison 3 Psychological continuation and maintenance therapies versus pharmacological continuation and maintenance therapies, Outcome 2 Dropout due to any reason.
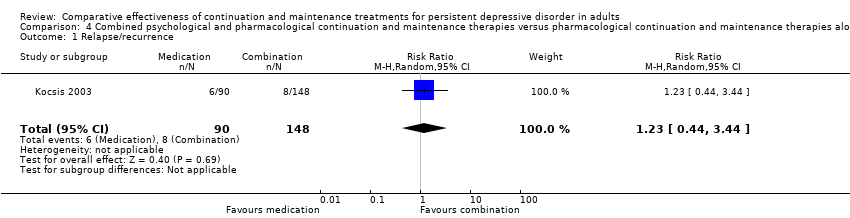
Comparison 4 Combined psychological and pharmacological continuation and maintenance therapies versus pharmacological continuation and maintenance therapies alone, Outcome 1 Relapse/recurrence.
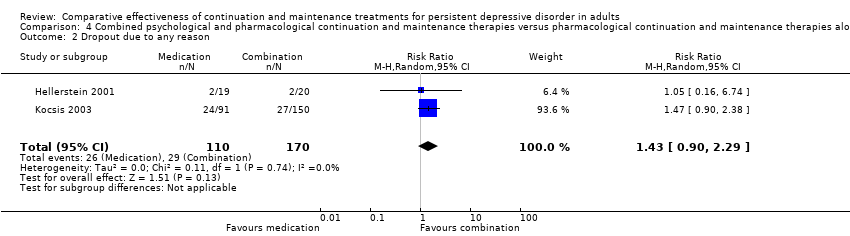
Comparison 4 Combined psychological and pharmacological continuation and maintenance therapies versus pharmacological continuation and maintenance therapies alone, Outcome 2 Dropout due to any reason.
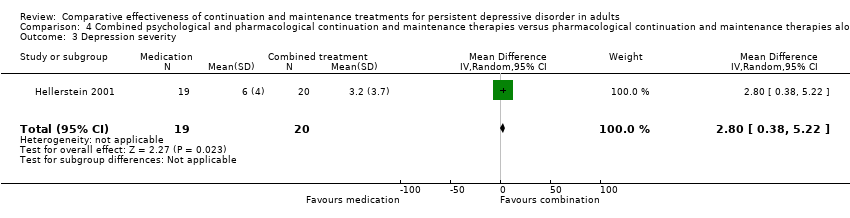
Comparison 4 Combined psychological and pharmacological continuation and maintenance therapies versus pharmacological continuation and maintenance therapies alone, Outcome 3 Depression severity.
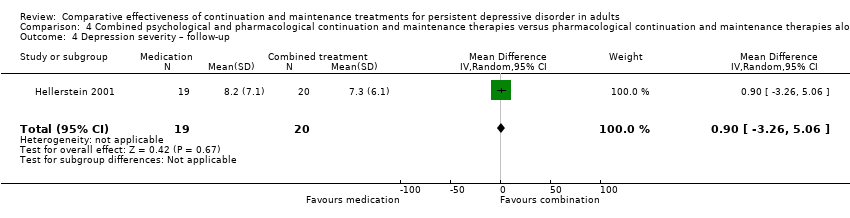
Comparison 4 Combined psychological and pharmacological continuation and maintenance therapies versus pharmacological continuation and maintenance therapies alone, Outcome 4 Depression severity – follow‐up.

Comparison 4 Combined psychological and pharmacological continuation and maintenance therapies versus pharmacological continuation and maintenance therapies alone, Outcome 5 Health‐related quality of life.

Comparison 4 Combined psychological and pharmacological continuation and maintenance therapies versus pharmacological continuation and maintenance therapies alone, Outcome 6 Health‐related quality of life – follow‐up.

Comparison 5 Combined psychological and pharmacological continuation and maintenance therapies versus psychotherapeutic continuation and maintenance therapies alone, Outcome 1 Relapse/recurrence.

Comparison 5 Combined psychological and pharmacological continuation and maintenance therapies versus psychotherapeutic continuation and maintenance therapies alone, Outcome 2 Dropout due to any reason.

Comparison 6 Imipramine (TCA) versus desipramine (TCA), Outcome 1 Dropout due to any reason.
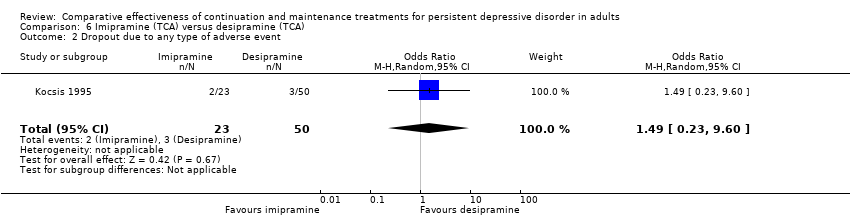
Comparison 6 Imipramine (TCA) versus desipramine (TCA), Outcome 2 Dropout due to any type of adverse event.
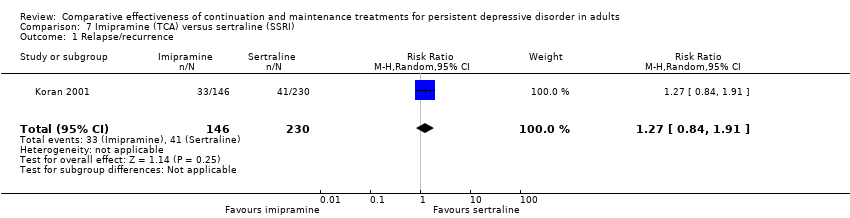
Comparison 7 Imipramine (TCA) versus sertraline (SSRI), Outcome 1 Relapse/recurrence.

Comparison 7 Imipramine (TCA) versus sertraline (SSRI), Outcome 2 Dropout due to any reason.
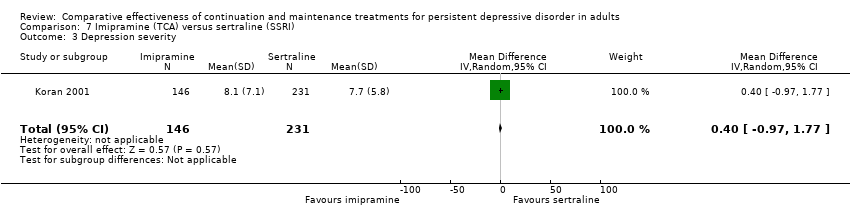
Comparison 7 Imipramine (TCA) versus sertraline (SSRI), Outcome 3 Depression severity.
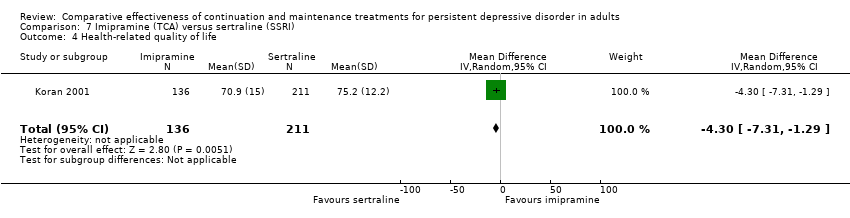
Comparison 7 Imipramine (TCA) versus sertraline (SSRI), Outcome 4 Health‐related quality of life.

Comparison 7 Imipramine (TCA) versus sertraline (SSRI), Outcome 5 Dropout due to any type of adverse event.
| Pharmacological continuation and maintenance treatment compared with placebo for persistent depressive disorder | ||||||
| Patient or population: people with persistent depressive disorder Settings: outpatient treatment Intervention: pharmacological continuation or maintenance treatment (sertraline, phenelzine, nefazodone, desipramine) Comparison: tablet placebo | ||||||
| Outcomes | Illustrative comparative risks* (95% CI) | Relative effect | No of participants | Quality of the evidence | Comments | |
| Assumed risk | Corresponding risk | |||||
| Placebo | Pharmacotherapy | |||||
| Relapse/recurrence (end of intervention) | 338 per 1000 | 139 per 1000a | RR 0.41 (0.21 to 0.79) | 383 | ⊕⊕⊕⊝b | See Characteristics of included studies table for the criteria of relapse/recurrence. |
| Dropout due to any reason (end of intervention) | 255 per 1000 | 230 per 1000a | RR 0.90 (0.39 to 2.11) | 386 | ⊕⊕⊝⊝c, d | "Dropout due to any reason" was all reported dropouts due to other reasons than relapse/recurrence. 1 study only reported dropouts in the first month of the maintenance treatment phase (Kocsis 1996). As the maintenance treatment lasted 24 months, the dropout rate in this study was very likely to be underestimated. |
| *The basis for the assumed risk (e.g. the median control group risk across studies) is provided in footnotes. The corresponding risk (and its 95% confidence interval) is based on the assumed risk in the comparison group and the relative effect of the intervention (and its 95% CI). CI: confidence interval; RR: risk ratio. | ||||||
| GRADE Working Group grades of evidence | ||||||
| aAssumed risk calculated as the proportion of participants on placebo with the outcome (relapse/recurrence or dropout any) in the four included studies, multiplied by 1000. bDowngraded due to limitations in the design and implementation of available studies suggesting high likelihood of bias (there were studies with high or unclear risk of bias in almost all RoB‐Domains (except detection bias)). cDowngraded due to unexplained heterogeneity between studies (I² = 64%). Due to the small number of included studies, subgroup or meta‐regression analyses were not performed. In two studies, dropout rates were higher in the intervention group, in two studies they were lower. dDowngraded due to imprecision of results (the overall confidence interval was wide and the confidence intervals of two included studies are also very wide). | ||||||
| Related acute‐phase study | Study ID | Treatment arms | Continuation/maintenance (treatment duration) | Study design | Diagnosis |
| Keller 1998b | Sertraline Imipramine | Continuation (16 weeks) | NRCT | Chronic major depressive disorder, double depression | |
| Sertraline Placebo | Maintenance (76 weeks) | RCT | Chronic major depressive disorder, double depression | ||
| Harrison 1986 | Phenelzine Placebo | Continuation (26 weeks) | RCT | Dysthymia, double depression | |
| Keller 2000 | Nefazodone CBASP Combination | Continuation (16 weeks) | NRCT | Chronic major depressive disorder, double depression, recurrent depressive disorder with incomplete interepisode remission | |
| Nefazodone Placebo | Maintenance (52 weeks) | RCT | Chronic major depressive disorder, double depression, recurrent depressive disorder with incomplete interepisode remission | ||
| CBASP Assessment only | Maintenance (52 weeks) | RCT | Chronic major depressive disorder, double depression, recurrent depressive disorder with incomplete interepisode remission | ||
| Hellerstein 2001 | Fluoxetine Fluoxetine + group psychotherapy | Continuation (16 weeks) | RCT | Dysthymia | |
| Marin 1994 | Imipramine Desipramine | Continuation (16–20 weeks) | NRCT | Dysthymia, double depression | |
| Desipramine Placebo | Maintenance (104 weeks) | RCT | Chronic major depressive disorder, dysthymia, double depression | ||
| Desipramine Placebo | Maintenance (104 weeks) | RCT | Dysthymia | ||
| *These groups are partially overlapping (see above). CBASP: Cognitive Behavioral Analysis System of Psychotherapy; NRCT: non‐randomized controlled trial; RCT: randomized controlled trial. | |||||
| Risk of bias (ROBINS‐I tool) | Rating | Explanation of judgement | Possible ratings |
| Bias due to confounding | 5 | No information how participants were allocated to groups in the acute treatment. | Code 1 = low risk, 2 = moderate risk, 3 = serious risk, 4 = critical risk, 5 = no information |
| Bias in selection of participants into the study | 2 | Different length of drugs and procedures during acute treatment (participants of 3 protocols were included for analyses of continuation treatment). | Code 1 = low risk, 2 = moderate risk, 3 = serious risk, 4 = critical risk, 5 = no information |
| Bias in classification of interventions | 1 | Intervention was well defined: IMI and DMI were continued on an open basis at the same final dose achieved during the acute phase. | Code 1 = low risk, 2 = moderate risk, 3 = serious risk, 4 = critical risk, 5 = no information |
| Bias due to departures from intended interventions | 1 | No indication for departures from intended interventions, check of plasma levels was performed. | Code 1 = low risk, 2 = moderate risk, 3 = serious risk, 4 = critical risk, 5 = no information |
| Bias due to missing data | 2 | Proportions of missing participants differed substantially across interventions: 26% in the IMI group and 6% in the DMI group, in the IMI group 4 participants did not comply with the follow‐up assessment, reasons for dropout were reported; but proportion of dropout due to dissatisfaction with treatment was similar for IMI and DMI (7% and 6%). | Code 1 = low risk, 2 = moderate risk, 3 = serious risk, 4 = critical risk, 5 = no information |
| Bias in measurement of outcomes | 3 | Participants in the IMI protocols were seen and rated once at week 26 of treatment. Participants on the DMI protocol were seen and rated every 2 weeks through week 26. Lack of blinding: participants and raters were aware of the treatment. (see p. 214) | Code 1 = low risk, 2 = moderate risk, 3 = serious risk, 4 = critical risk, 5 = no information |
| Bias in selection of the reported result | 3 | Not all predefined outcomes were reported separately for both groups. Some data were assessed every 2 weeks, these data were not reported. In general, data were not reported for HAM‐D and GAS for the DMI vs IMI. | Code 1 = low risk, 2 = moderate risk, 3 = serious risk, 4 = critical risk, 5 = no information |
| DMI: desipramine; GAS: Global Assessment Scale; HAM‐D: Hamilton Depression Rating Scale; IMI: imipramine. | |||
| Risk of bias (ROBINS‐I tool) | Rating | Explanation of judgement | Possible ratings |
| Bias due to confounding | 1 | Randomization before acute phase, exclusion of cross‐over participants. | Code 1 = low risk, 2 = moderate risk, 3 = serious risk, 4 = critical risk, 5 = no information |
| Bias in selection of participants into the study | 1 | All eligible participants were included, cross‐over participants were excluded; acute phase treatment had the same length and measurement times for all groups. | Code 1 = low risk, 2 = moderate risk, 3 = serious risk, 4 = critical risk, 5 = no information |
| Bias in classification of interventions | 1 | Intervention status was well described (planned and actual dose of medication as well as number of CBASP sessions). | Code 1 = low risk, 2 = moderate risk, 3 = serious risk, 4 = critical risk, 5 = no information |
| Bias due to departures from intended interventions | 1 | Medication doses as well as number of CBASP sessions were within the planned range. | Code 1 = low risk, 2 = moderate risk, 3 = serious risk, 4 = critical risk, 5 = no information |
| Bias due to missing data | 1 | Number of missing data was low and comparable in all groups (2–3%). | Code 1 = low risk, 2 = moderate risk, 3 = serious risk, 4 = critical risk, 5 = no information |
| Bias in measurement of outcomes | 1 | Methods of outcome assessment were comparable across intervention groups. Quote: "Trained independent evaluators unaware of treatment assignment completed the HAM‐D‐24 at each assessment visit." (p. 77), no means and standard deviations reported, unclear if other subscales were evaluated. | Code 1 = low risk, 2 = moderate risk, 3 = serious risk, 4 = critical risk, 5 = no information |
| Bias in selection of the reported result | 2 | No study protocol existed, but all measures mentioned in the methods section were reported in the outcome section. | Code 1 = low risk, 2 = moderate risk, 3 = serious risk, 4 = critical risk, 5 = no information |
| CBASP: Cognitive Behavioral Analysis System of Psychotherapy; HAM‐D: Hamilton Depression Rating Scale. | |||
| Risk of bias (ROBINS‐I tool) | Rating | Explanation of judgement | Possible ratings |
| Bias due to confounding | 1 | Randomization before acute phase. | Code 1 = low risk, 2 = moderate risk, 3 = serious risk, 4 = critical risk, 5 = no information |
| Bias in selection of participants into the study | 1 | All possible participants were included (direct and cross‐over). All measures existing from the beginning of the intervention. The study flow was clearly described since acute treatment. | Code 1 = low risk, 2 = moderate risk, 3 = serious risk, 4 = critical risk, 5 = no information |
| Bias in classification of interventions | 1 | Intervention status is well defined (dose ranges are described in section 2.3 and 3.4). | Code 1 = low risk, 2 = moderate risk, 3 = serious risk, 4 = critical risk, 5 = no information |
| Bias due to departures from intended interventions | 1 | Assignment to intervention. Quote: "For both treatment groups, 10% of patients had dose increases aimed at improving outcome" (p. 31); same for both groups with regard to the main outcome; adapting dose is usual practice; no deviation from intended treatment, they counted the tablets. | Code 1 = low risk, 2 = moderate risk, 3 = serious risk, 4 = critical risk, 5 = no information |
| Bias due to missing data | 1 | Quote: "For all patients, including drop outs, pill counts indicated compliance rates of 88.7% for imipramine and 84.7% for sertraline. No differences were found between diagnostic groups or between acute and crossover patients." (p. 31); Proportions of and reasons for missing participants were similar across intervention groups; less than 5% dropout for the main outcome; proportions of missing data were comparable and are addressed in the analyses with LOCF. | Code 1 = low risk, 2 = moderate risk, 3 = serious risk, 4 = critical risk, 5 = no information |
| Bias in measurement of outcomes | 1 | Information from Rush et al., 1998 (study protocol): reliable ratings (p. 593); quote: "continued on the same double‐blind medication dose for an additional 16 weeks" (p. 593); assessment methods comparable across groups. | Code 1 = low risk, 2 = moderate risk, 3 = serious risk, 4 = critical risk, 5 = no information |
| Bias in selection of the reported result | 2 | Outcomes correspond to the ones named in the protocol, but protocol just for acute phase; not all measures used during the acute phase were used in continuation phase. | Code 1 = low risk, 2 = moderate risk, 3 = serious risk, 4 = critical risk, 5 = no information |
| LOCF: last observation carried forward. | |||
| Outcome or subgroup title | No. of studies | No. of participants | Statistical method | Effect size |
| 1 Relapse/recurrence Show forest plot | 4 | 383 | Risk Ratio (M‐H, Random, 95% CI) | 0.41 [0.21, 0.79] |
| 2 Dropout due to any reason Show forest plot | 4 | 386 | Risk Ratio (M‐H, Random, 95% CI) | 0.90 [0.39, 2.11] |
| 3 Depression severity Show forest plot | 3 | 333 | Mean Difference (IV, Random, 95% CI) | ‐4.79 [‐8.49, ‐1.09] |
| 4 SF‐36 Social Functioning score Show forest plot | 1 | 161 | Mean Difference (IV, Random, 95% CI) | 10.80 [3.04, 18.56] |
| 5 SF‐36 Emotional Role score Show forest plot | 1 | 161 | Mean Difference (IV, Random, 95% CI) | 20.70 [7.43, 33.97] |
| 6 SF‐36 Role Physical score Show forest plot | 1 | 161 | Mean Difference (IV, Random, 95% CI) | 2.10 [‐9.76, 13.96] |
| 7 Dropout due to any type of adverse event Show forest plot | 3 | 333 | Odds Ratio (M‐H, Random, 95% CI) | 3.53 [0.67, 18.70] |
| 8 Any type of adverse event Show forest plot | 1 | 161 | Odds Ratio (M‐H, Random, 95% CI) | 1.47 [0.70, 3.09] |
| 9 Relapse/recurrence sensitivity analysis Show forest plot | 4 | 360 | Risk Ratio (M‐H, Random, 95% CI) | 0.38 [0.16, 0.89] |
| Outcome or subgroup title | No. of studies | No. of participants | Statistical method | Effect size |
| 1 Relapse/recurrence Show forest plot | 1 | 82 | Risk Ratio (M‐H, Random, 95% CI) | 0.37 [0.14, 0.93] |
| 2 Dropout due to any reason Show forest plot | 1 | 82 | Risk Ratio (M‐H, Random, 95% CI) | 0.87 [0.41, 1.81] |
| 3 Depression severity Show forest plot | 1 | 82 | Mean Difference (IV, Random, 95% CI) | ‐4.00 [‐7.05, ‐0.95] |
| Outcome or subgroup title | No. of studies | No. of participants | Statistical method | Effect size |
| 1 Relapse/recurrence Show forest plot | 1 | 176 | Risk Ratio (M‐H, Random, 95% CI) | 1.22 [0.43, 3.49] |
| 2 Dropout due to any reason Show forest plot | 1 | 179 | Risk Ratio (M‐H, Random, 95% CI) | 0.56 [0.30, 1.03] |
| Outcome or subgroup title | No. of studies | No. of participants | Statistical method | Effect size |
| 1 Relapse/recurrence Show forest plot | 1 | 238 | Risk Ratio (M‐H, Random, 95% CI) | 1.23 [0.44, 3.44] |
| 2 Dropout due to any reason Show forest plot | 2 | 280 | Risk Ratio (M‐H, Random, 95% CI) | 1.43 [0.90, 2.29] |
| 3 Depression severity Show forest plot | 1 | 39 | Mean Difference (IV, Random, 95% CI) | 2.8 [0.38, 5.22] |
| 4 Depression severity – follow‐up Show forest plot | 1 | 39 | Mean Difference (IV, Random, 95% CI) | 0.90 [‐3.26, 5.06] |
| 5 Health‐related quality of life Show forest plot | 1 | 35 | Mean Difference (IV, Random, 95% CI) | ‐0.5 [‐1.63, 0.63] |
| 6 Health‐related quality of life – follow‐up Show forest plot | 1 | 33 | Mean Difference (IV, Random, 95% CI) | 0.60 [‐0.56, 1.76] |
| Outcome or subgroup title | No. of studies | No. of participants | Statistical method | Effect size |
| 1 Relapse/recurrence Show forest plot | 1 | 234 | Risk Ratio (M‐H, Random, 95% CI) | 1.51 [0.57, 4.01] |
| 2 Dropout due to any reason Show forest plot | 1 | 238 | Risk Ratio (M‐H, Random, 95% CI) | 0.82 [0.45, 1.51] |
| Outcome or subgroup title | No. of studies | No. of participants | Statistical method | Effect size |
| 1 Dropout due to any reason Show forest plot | 1 | 73 | Risk Ratio (M‐H, Random, 95% CI) | 4.35 [1.19, 15.87] |
| 2 Dropout due to any type of adverse event Show forest plot | 1 | 73 | Odds Ratio (M‐H, Random, 95% CI) | 1.49 [0.23, 9.60] |
| Outcome or subgroup title | No. of studies | No. of participants | Statistical method | Effect size |
| 1 Relapse/recurrence Show forest plot | 1 | 376 | Risk Ratio (M‐H, Random, 95% CI) | 1.27 [0.84, 1.91] |
| 2 Dropout due to any reason Show forest plot | 1 | 386 | Risk Ratio (M‐H, Random, 95% CI) | 0.81 [0.48, 1.38] |
| 3 Depression severity Show forest plot | 1 | 377 | Mean Difference (IV, Random, 95% CI) | 0.40 [‐0.97, 1.77] |
| 4 Health‐related quality of life Show forest plot | 1 | 347 | Mean Difference (IV, Random, 95% CI) | ‐4.30 [‐7.31, ‐1.29] |
| 5 Dropout due to any type of adverse event Show forest plot | 1 | 386 | Odds Ratio (M‐H, Random, 95% CI) | 1.99 [0.60, 6.65] |