Contenido relacionado
Revisiones y protocolos relacionados
Philip Wilkinson, Zehanah Izmeth | 9 septiembre 2016
Georgina R Cox, Caroline A Fisher, Stefanie De Silva, Mark Phelan, Olaoluwa P Akinwale, Magenta B Simmons, Sarah E Hetrick | 14 noviembre 2012
Rebecca L Dean, Claudia Hurducas, Keith Hawton, Styliani Spyridi, Philip J Cowen, Sarah Hollingsworth, Tahnee Marquardt, Annabelle Barnes, Rebecca Smith, Rupert McShane, Erick H Turner, Andrea Cipriani | 12 septiembre 2021
Georgina R Cox, Patch Callahan, Rachel Churchill, Vivien Hunot, Sally N Merry, Alexandra G Parker, Sarah E Hetrick | 30 noviembre 2014
Yusuke Ogawa, Nozomi Takeshima, Yu Hayasaka, Aran Tajika, Norio Watanabe, David Streiner, Toshi A Furukawa | 3 junio 2019
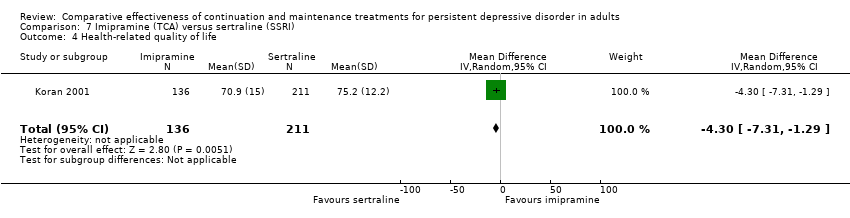
Jennifer Valeska Elli Browna, Nick Waltona, Nicholas Meader, Adam Todd, Lisa AD Webster, Rachel Steele, Stephanie J Sampson, Rachel Churchill, Dean McMillan, Simon Gilbody, David Ekers | 23 diciembre 2019
Sharea Ijaz, Philippa Davies, Catherine J Williamsa, David Kessler, Glyn Lewis, Nicola Wiles | 15 mayo 2018
Christina A Ganslev, Ole Jakob Storebø, Henriette E Callesen, Rachel Ruddy, Ulf Søgaard | 17 julio 2020
Katherine M Appleton, Philip D Voyias, Hannah M Sallis, Sarah Dawson, Andrew R Ness, Rachel Churchill, Rachel Perry | 24 noviembre 2021
Hissei Imai, Aran Tajika, Peiyao Chen, Alessandro Pompoli, Toshi A Furukawa | 12 octubre 2016