Efectividad comparativa del tratamiento continuado y de mantenimiento para el trastorno depresivo persistente en adultos
Información
- DOI:
- https://doi.org/10.1002/14651858.CD012855.pub2Copiar DOI

- Base de datos:
-
- Cochrane Database of Systematic Reviews
- Versión publicada:
-
- 20 mayo 2019see what's new
- Tipo:
-
- Intervention
- Etapa:
-
- Review
- Grupo Editorial Cochrane:
-
Grupo Cochrane de Trastornos mentales comunes
- Copyright:
-
- Copyright © 2019 The Cochrane Collaboration. Published by John Wiley & Sons, Ltd.
Cifras del artículo
Altmetric:
Citado por:
Autores
Contributions of authors
AJ, LK and MH applied for funding.
SL, KM, AJ, RM, BW, MH, and LK developed the protocol.
KM, SL, AJ and RM screened the literature and extracted the data.
KM, SL, RM and LK conducted the analyses.
KM, SL and RM wrote the first version of the manuscript.
Sources of support
Internal sources
-
No sources of support supplied
External sources
-
German Ministry of Education and Research, Germany.
Grant 01KG1403
Declarations of interest
AJ, LK, and MH co‐ordinated the update of the S3 Guideline/National Clinical Practice Guideline "Unipolar Depression" (DGPPN 2015). The expert association DGPPN (editor of the S3 Guideline) provided financial support for the preparation of the Guideline Update to the co‐ordinators' institution (Department of Medical Psychology, University Medical Center Hamburg‐Eppendorf).
KM, BW, AJ, LK, RM, and MH report participating in publicly funded investigator‐initiated primary studies and systematic reviews of interventions for people with depression.
KM, BW, AJ, RM, MH, and SL have had formal training in behavioural psychotherapy.
Acknowledgements
CRG Funding Acknowledgement: The National Institute for Health Research (NIHR) is the largest single funder of the Cochrane Common Mental Disorders Group.
Disclaimer: The views and opinions expressed therein are those of the authors and do not necessarily reflect those of the NIHR, National Health Service, or the Department of Health and Social Care.
Version history
| Published | Title | Stage | Authors | Version |
| 2019 May 20 | Comparative effectiveness of continuation and maintenance treatments for persistent depressive disorder in adults | Review | Katja Machmutow, Ramona Meister, Alessa Jansen, Levente Kriston, Birgit Watzke, Martin Christian Härter, Sarah Liebherz | |
| 2017 Nov 20 | Continuation and maintenance treatments for persistent depressive disorder | Protocol | Sarah Liebherz, Katja Machmutow, Alessa Jansen, Ramona Meister, Birgit Watzke, Martin Christian Härter, Levente Kriston | |
Differences between protocol and review
We replaced the term CCT (clinical controlled trial) by the term NRCT (non‐randomized controlled trial), and updated the name of the tool for analyzing NRCTs to "ROBINS‐I tool" (previously called ACROBAT‐NRSI).
From the seven planned comparisons, we were able to analyse five comparisons. None of the studies provided data for the following two comparisons: pharmacological continuation and maintenance therapies versus treatment as usual (TAU); and psychological continuation and maintenance therapies versus treatment as usual (TAU). We included an additional comparison as two studies provided data: pharmacological continuation and maintenance therapies versus other pharmacological continuation and maintenance therapies (post hoc) medications.
We provided 'Summary of findings' tables for only one comparison (pharmacotherapy versus placebo) as there were few data for the other comparisons.
In the original protocol, we planned analysis of follow‐up data that ranged between six and 18 months after the end of the intervention with a preference for the time that was closest to one year after the end of the intervention. In this review, only one study provided follow‐up data, with time point at 12 weeks after the end of the intervention, which is not in the predefined range of six to 18 months after the end of the intervention. As just one study provided follow‐up data, we still included these data into this review.
Due to the small number of included studies, subgroup and meta‐regression analyses were not performed. Not all predefined sensitivity analyses could be performed due to lack of variation concerning risk of bias in some domains.
To test for publication bias, Eggers' test could not be applied, as it requires a minimum 10 studies per comparison.
We planned to include all participants allocated to the respective study arm in the primary outcome analyses. However, when data on relapse/recurrence were missing for some participants, we used the data provided instead of calculating relapse/recurrence rates ourselves since a classification of all participants without available data as 'relapsed/recurred' probably results in a biased estimate. Continuous data suitable for a calculation of relapse/recurrence rates were not available throughout. Certainly, the percentage of missing data concerning this outcome was low: in five studies relapse/recurrence rates were provided for the whole sample, in two studies this outcome was not addressed and in three studies the amount of missing data ranged between 2% and 10%. Data on the primary acceptance outcome (dropout any) were provided for the whole intention‐to‐treat sample.
Keywords
MeSH
Medical Subject Headings (MeSH) Keywords
Medical Subject Headings Check Words
Humans;
PICO
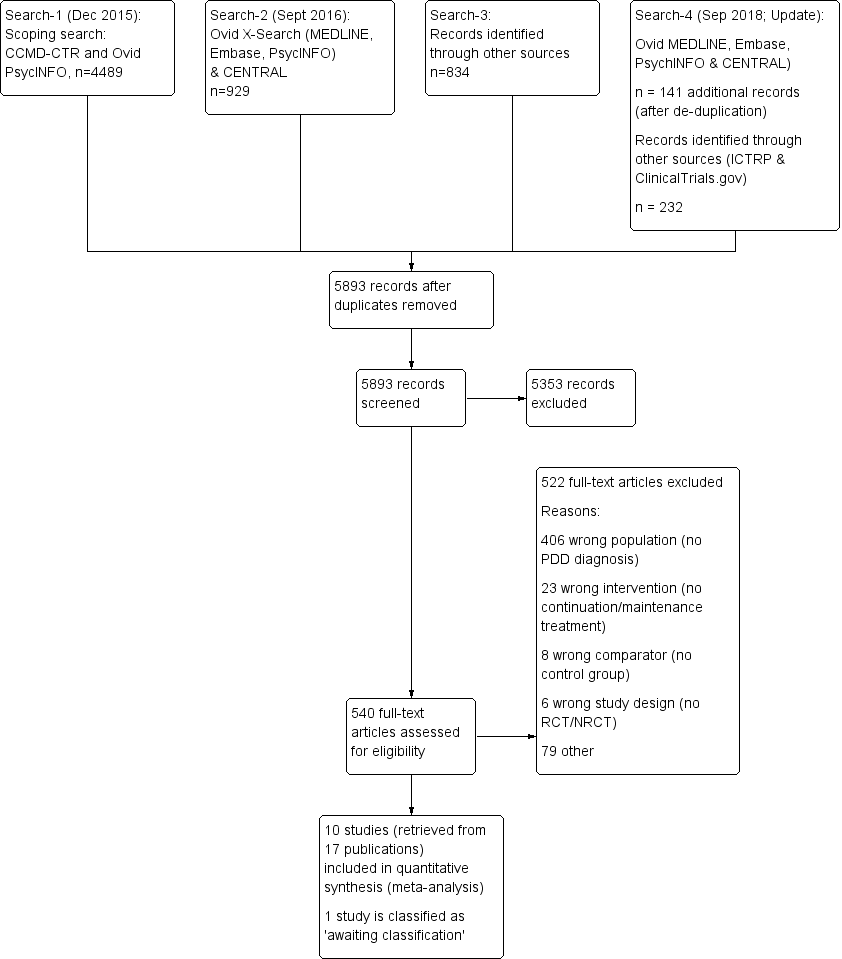
Study flow diagram. NRCT: non‐randomized controlled trial; PDD: persistent depressive disorder; RCT: randomized controlled trial.
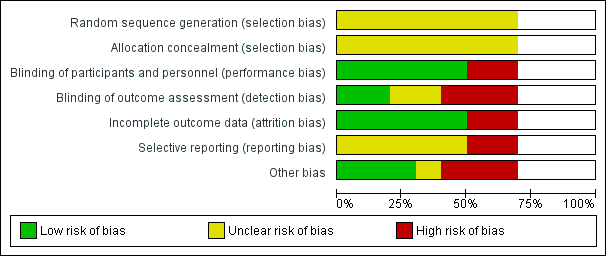
Risk of bias graph: review authors' judgements about each risk of bias item presented as percentages across all included seven randomized controlled trials. Blank space in rows containing no information indicate missing information on the 'Risk of bias' scale for the three non‐randomized controlled trials.
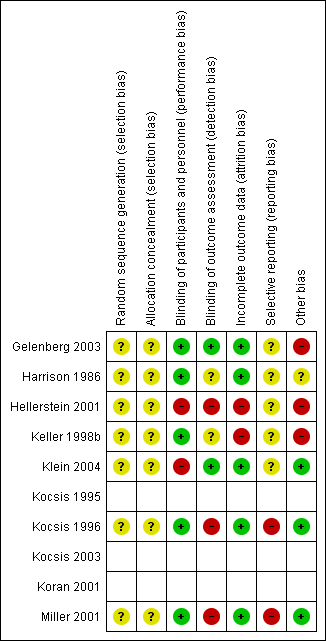
Risk of bias summary: review authors' judgements about each risk of bias item for each included randomized controlled trial (seven studies). Blank space in rows containing no information indicate missing information on the 'Risk of bias' scale for the three non‐randomized controlled trials.

Risk of bias graph non‐randomized controlled trials (NRCT): review authors' judgement about each risk of bias item presented as percentages across all included NRCTs (three studies).
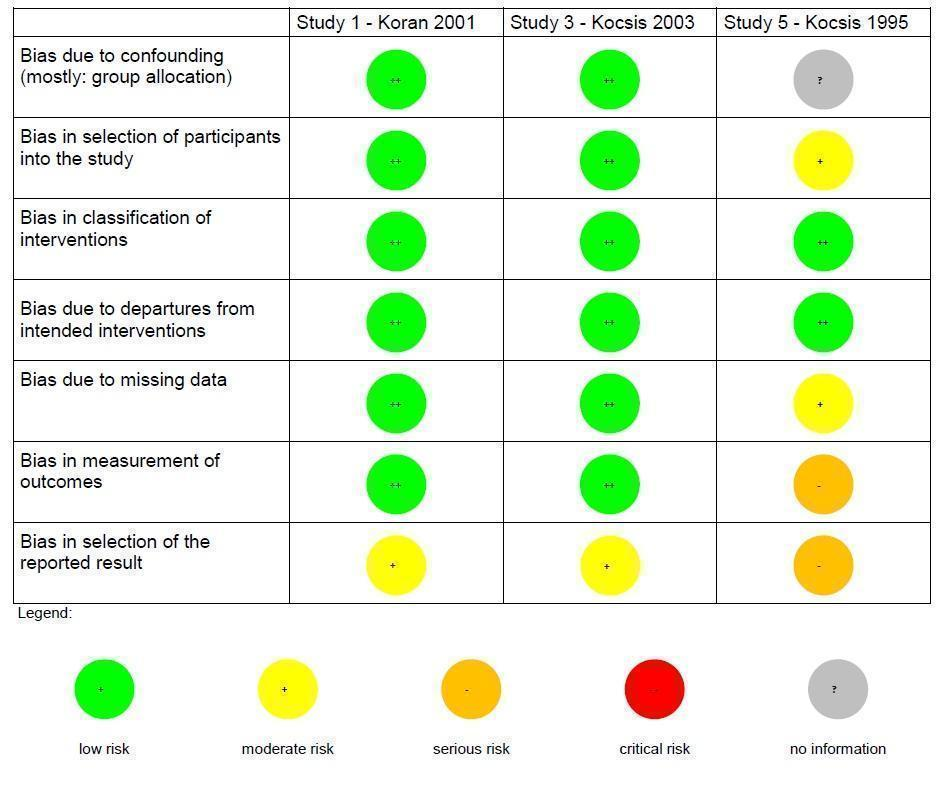
Risk of bias summary non‐randomized controlled trials (NRCT): review authors' judgements about each risk of bias item for each included NRCT (three studies).

Forest plot of comparison: 1 Medication versus placebo, outcome: 1.1 Relapse/recurrence.
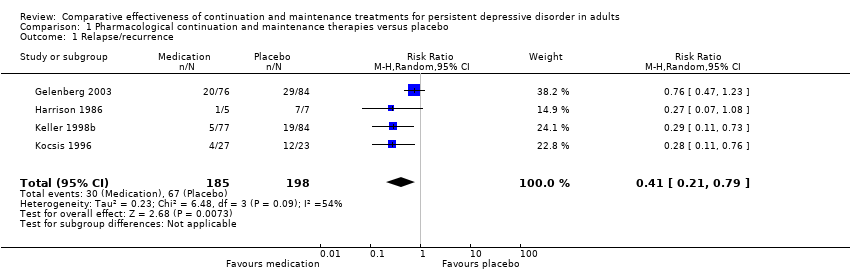
Comparison 1 Pharmacological continuation and maintenance therapies versus placebo, Outcome 1 Relapse/recurrence.

Comparison 1 Pharmacological continuation and maintenance therapies versus placebo, Outcome 2 Dropout due to any reason.

Comparison 1 Pharmacological continuation and maintenance therapies versus placebo, Outcome 3 Depression severity.
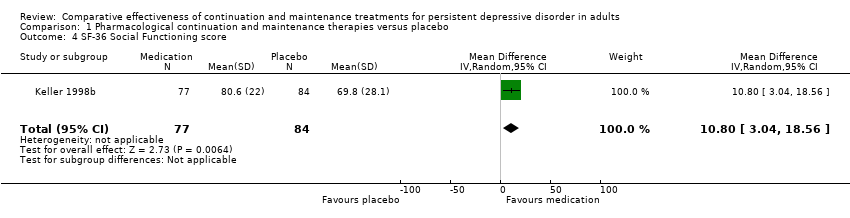
Comparison 1 Pharmacological continuation and maintenance therapies versus placebo, Outcome 4 SF‐36 Social Functioning score.

Comparison 1 Pharmacological continuation and maintenance therapies versus placebo, Outcome 5 SF‐36 Emotional Role score.

Comparison 1 Pharmacological continuation and maintenance therapies versus placebo, Outcome 6 SF‐36 Role Physical score.

Comparison 1 Pharmacological continuation and maintenance therapies versus placebo, Outcome 7 Dropout due to any type of adverse event.

Comparison 1 Pharmacological continuation and maintenance therapies versus placebo, Outcome 8 Any type of adverse event.
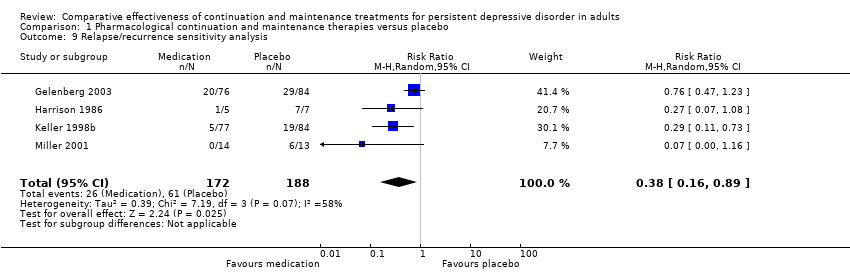
Comparison 1 Pharmacological continuation and maintenance therapies versus placebo, Outcome 9 Relapse/recurrence sensitivity analysis.
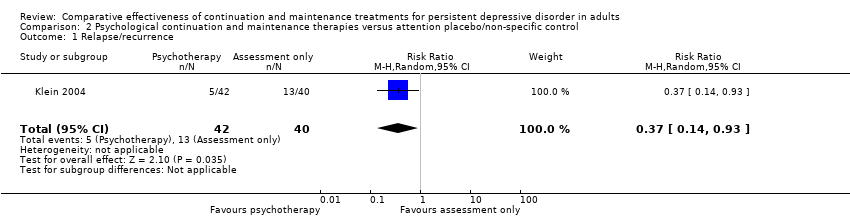
Comparison 2 Psychological continuation and maintenance therapies versus attention placebo/non‐specific control, Outcome 1 Relapse/recurrence.
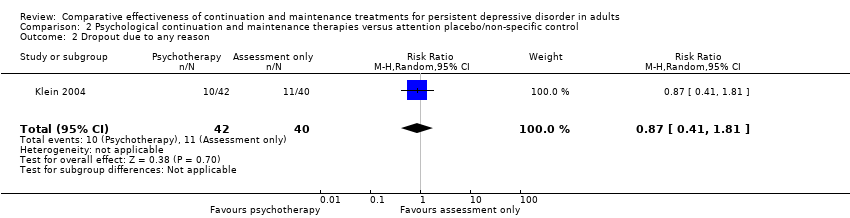
Comparison 2 Psychological continuation and maintenance therapies versus attention placebo/non‐specific control, Outcome 2 Dropout due to any reason.

Comparison 2 Psychological continuation and maintenance therapies versus attention placebo/non‐specific control, Outcome 3 Depression severity.

Comparison 3 Psychological continuation and maintenance therapies versus pharmacological continuation and maintenance therapies, Outcome 1 Relapse/recurrence.

Comparison 3 Psychological continuation and maintenance therapies versus pharmacological continuation and maintenance therapies, Outcome 2 Dropout due to any reason.
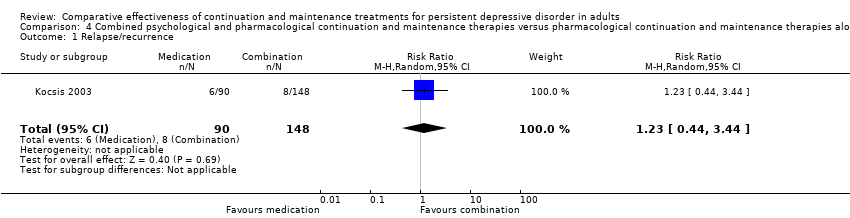
Comparison 4 Combined psychological and pharmacological continuation and maintenance therapies versus pharmacological continuation and maintenance therapies alone, Outcome 1 Relapse/recurrence.
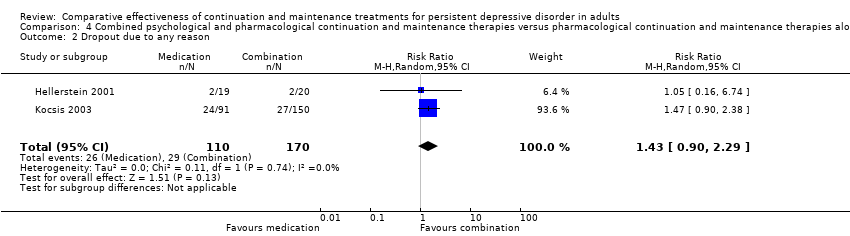
Comparison 4 Combined psychological and pharmacological continuation and maintenance therapies versus pharmacological continuation and maintenance therapies alone, Outcome 2 Dropout due to any reason.
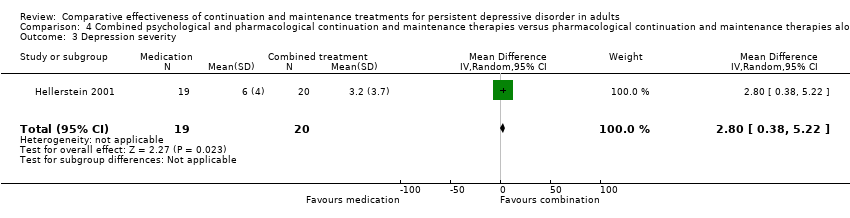
Comparison 4 Combined psychological and pharmacological continuation and maintenance therapies versus pharmacological continuation and maintenance therapies alone, Outcome 3 Depression severity.
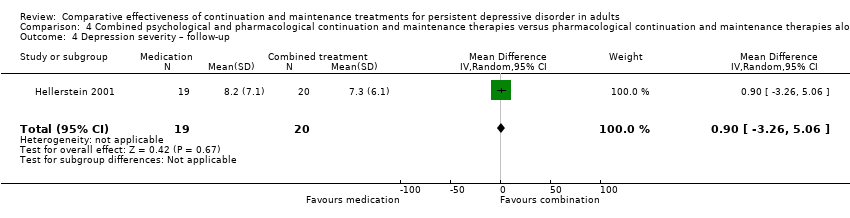
Comparison 4 Combined psychological and pharmacological continuation and maintenance therapies versus pharmacological continuation and maintenance therapies alone, Outcome 4 Depression severity – follow‐up.

Comparison 4 Combined psychological and pharmacological continuation and maintenance therapies versus pharmacological continuation and maintenance therapies alone, Outcome 5 Health‐related quality of life.

Comparison 4 Combined psychological and pharmacological continuation and maintenance therapies versus pharmacological continuation and maintenance therapies alone, Outcome 6 Health‐related quality of life – follow‐up.

Comparison 5 Combined psychological and pharmacological continuation and maintenance therapies versus psychotherapeutic continuation and maintenance therapies alone, Outcome 1 Relapse/recurrence.

Comparison 5 Combined psychological and pharmacological continuation and maintenance therapies versus psychotherapeutic continuation and maintenance therapies alone, Outcome 2 Dropout due to any reason.

Comparison 6 Imipramine (TCA) versus desipramine (TCA), Outcome 1 Dropout due to any reason.
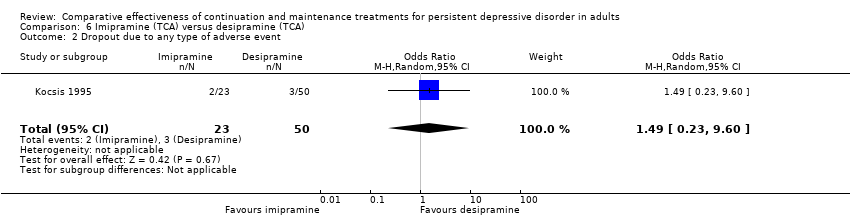
Comparison 6 Imipramine (TCA) versus desipramine (TCA), Outcome 2 Dropout due to any type of adverse event.
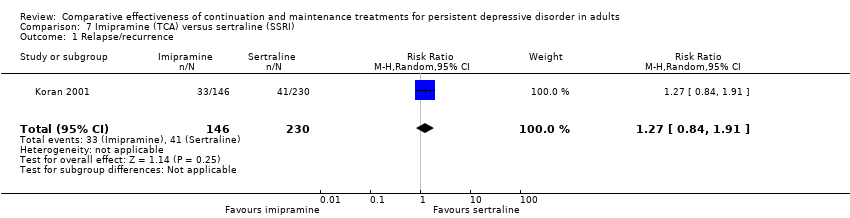
Comparison 7 Imipramine (TCA) versus sertraline (SSRI), Outcome 1 Relapse/recurrence.

Comparison 7 Imipramine (TCA) versus sertraline (SSRI), Outcome 2 Dropout due to any reason.
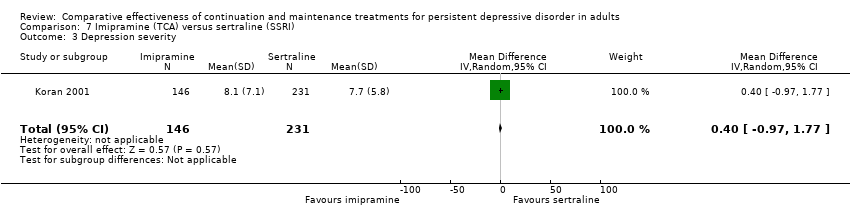
Comparison 7 Imipramine (TCA) versus sertraline (SSRI), Outcome 3 Depression severity.
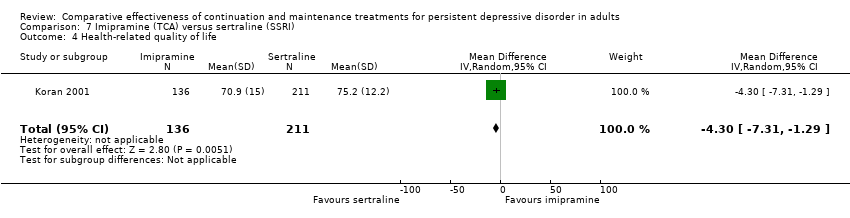
Comparison 7 Imipramine (TCA) versus sertraline (SSRI), Outcome 4 Health‐related quality of life.

Comparison 7 Imipramine (TCA) versus sertraline (SSRI), Outcome 5 Dropout due to any type of adverse event.
| Pharmacological continuation and maintenance treatment compared with placebo for persistent depressive disorder | ||||||
| Patient or population: people with persistent depressive disorder Settings: outpatient treatment Intervention: pharmacological continuation or maintenance treatment (sertraline, phenelzine, nefazodone, desipramine) Comparison: tablet placebo | ||||||
| Outcomes | Illustrative comparative risks* (95% CI) | Relative effect | No of participants | Quality of the evidence | Comments | |
| Assumed risk | Corresponding risk | |||||
| Placebo | Pharmacotherapy | |||||
| Relapse/recurrence (end of intervention) | 338 per 1000 | 139 per 1000a | RR 0.41 (0.21 to 0.79) | 383 | ⊕⊕⊕⊝b | See Characteristics of included studies table for the criteria of relapse/recurrence. |
| Dropout due to any reason (end of intervention) | 255 per 1000 | 230 per 1000a | RR 0.90 (0.39 to 2.11) | 386 | ⊕⊕⊝⊝c, d | "Dropout due to any reason" was all reported dropouts due to other reasons than relapse/recurrence. 1 study only reported dropouts in the first month of the maintenance treatment phase (Kocsis 1996). As the maintenance treatment lasted 24 months, the dropout rate in this study was very likely to be underestimated. |
| *The basis for the assumed risk (e.g. the median control group risk across studies) is provided in footnotes. The corresponding risk (and its 95% confidence interval) is based on the assumed risk in the comparison group and the relative effect of the intervention (and its 95% CI). CI: confidence interval; RR: risk ratio. | ||||||
| GRADE Working Group grades of evidence | ||||||
| aAssumed risk calculated as the proportion of participants on placebo with the outcome (relapse/recurrence or dropout any) in the four included studies, multiplied by 1000. bDowngraded due to limitations in the design and implementation of available studies suggesting high likelihood of bias (there were studies with high or unclear risk of bias in almost all RoB‐Domains (except detection bias)). cDowngraded due to unexplained heterogeneity between studies (I² = 64%). Due to the small number of included studies, subgroup or meta‐regression analyses were not performed. In two studies, dropout rates were higher in the intervention group, in two studies they were lower. dDowngraded due to imprecision of results (the overall confidence interval was wide and the confidence intervals of two included studies are also very wide). | ||||||
| Related acute‐phase study | Study ID | Treatment arms | Continuation/maintenance (treatment duration) | Study design | Diagnosis |
| Keller 1998b | Sertraline Imipramine | Continuation (16 weeks) | NRCT | Chronic major depressive disorder, double depression | |
| Sertraline Placebo | Maintenance (76 weeks) | RCT | Chronic major depressive disorder, double depression | ||
| Harrison 1986 | Phenelzine Placebo | Continuation (26 weeks) | RCT | Dysthymia, double depression | |
| Keller 2000 | Nefazodone CBASP Combination | Continuation (16 weeks) | NRCT | Chronic major depressive disorder, double depression, recurrent depressive disorder with incomplete interepisode remission | |
| Nefazodone Placebo | Maintenance (52 weeks) | RCT | Chronic major depressive disorder, double depression, recurrent depressive disorder with incomplete interepisode remission | ||
| CBASP Assessment only | Maintenance (52 weeks) | RCT | Chronic major depressive disorder, double depression, recurrent depressive disorder with incomplete interepisode remission | ||
| Hellerstein 2001 | Fluoxetine Fluoxetine + group psychotherapy | Continuation (16 weeks) | RCT | Dysthymia | |
| Marin 1994 | Imipramine Desipramine | Continuation (16–20 weeks) | NRCT | Dysthymia, double depression | |
| Desipramine Placebo | Maintenance (104 weeks) | RCT | Chronic major depressive disorder, dysthymia, double depression | ||
| Desipramine Placebo | Maintenance (104 weeks) | RCT | Dysthymia | ||
| *These groups are partially overlapping (see above). CBASP: Cognitive Behavioral Analysis System of Psychotherapy; NRCT: non‐randomized controlled trial; RCT: randomized controlled trial. | |||||
| Risk of bias (ROBINS‐I tool) | Rating | Explanation of judgement | Possible ratings |
| Bias due to confounding | 5 | No information how participants were allocated to groups in the acute treatment. | Code 1 = low risk, 2 = moderate risk, 3 = serious risk, 4 = critical risk, 5 = no information |
| Bias in selection of participants into the study | 2 | Different length of drugs and procedures during acute treatment (participants of 3 protocols were included for analyses of continuation treatment). | Code 1 = low risk, 2 = moderate risk, 3 = serious risk, 4 = critical risk, 5 = no information |
| Bias in classification of interventions | 1 | Intervention was well defined: IMI and DMI were continued on an open basis at the same final dose achieved during the acute phase. | Code 1 = low risk, 2 = moderate risk, 3 = serious risk, 4 = critical risk, 5 = no information |
| Bias due to departures from intended interventions | 1 | No indication for departures from intended interventions, check of plasma levels was performed. | Code 1 = low risk, 2 = moderate risk, 3 = serious risk, 4 = critical risk, 5 = no information |
| Bias due to missing data | 2 | Proportions of missing participants differed substantially across interventions: 26% in the IMI group and 6% in the DMI group, in the IMI group 4 participants did not comply with the follow‐up assessment, reasons for dropout were reported; but proportion of dropout due to dissatisfaction with treatment was similar for IMI and DMI (7% and 6%). | Code 1 = low risk, 2 = moderate risk, 3 = serious risk, 4 = critical risk, 5 = no information |
| Bias in measurement of outcomes | 3 | Participants in the IMI protocols were seen and rated once at week 26 of treatment. Participants on the DMI protocol were seen and rated every 2 weeks through week 26. Lack of blinding: participants and raters were aware of the treatment. (see p. 214) | Code 1 = low risk, 2 = moderate risk, 3 = serious risk, 4 = critical risk, 5 = no information |
| Bias in selection of the reported result | 3 | Not all predefined outcomes were reported separately for both groups. Some data were assessed every 2 weeks, these data were not reported. In general, data were not reported for HAM‐D and GAS for the DMI vs IMI. | Code 1 = low risk, 2 = moderate risk, 3 = serious risk, 4 = critical risk, 5 = no information |
| DMI: desipramine; GAS: Global Assessment Scale; HAM‐D: Hamilton Depression Rating Scale; IMI: imipramine. | |||
| Risk of bias (ROBINS‐I tool) | Rating | Explanation of judgement | Possible ratings |
| Bias due to confounding | 1 | Randomization before acute phase, exclusion of cross‐over participants. | Code 1 = low risk, 2 = moderate risk, 3 = serious risk, 4 = critical risk, 5 = no information |
| Bias in selection of participants into the study | 1 | All eligible participants were included, cross‐over participants were excluded; acute phase treatment had the same length and measurement times for all groups. | Code 1 = low risk, 2 = moderate risk, 3 = serious risk, 4 = critical risk, 5 = no information |
| Bias in classification of interventions | 1 | Intervention status was well described (planned and actual dose of medication as well as number of CBASP sessions). | Code 1 = low risk, 2 = moderate risk, 3 = serious risk, 4 = critical risk, 5 = no information |
| Bias due to departures from intended interventions | 1 | Medication doses as well as number of CBASP sessions were within the planned range. | Code 1 = low risk, 2 = moderate risk, 3 = serious risk, 4 = critical risk, 5 = no information |
| Bias due to missing data | 1 | Number of missing data was low and comparable in all groups (2–3%). | Code 1 = low risk, 2 = moderate risk, 3 = serious risk, 4 = critical risk, 5 = no information |
| Bias in measurement of outcomes | 1 | Methods of outcome assessment were comparable across intervention groups. Quote: "Trained independent evaluators unaware of treatment assignment completed the HAM‐D‐24 at each assessment visit." (p. 77), no means and standard deviations reported, unclear if other subscales were evaluated. | Code 1 = low risk, 2 = moderate risk, 3 = serious risk, 4 = critical risk, 5 = no information |
| Bias in selection of the reported result | 2 | No study protocol existed, but all measures mentioned in the methods section were reported in the outcome section. | Code 1 = low risk, 2 = moderate risk, 3 = serious risk, 4 = critical risk, 5 = no information |
| CBASP: Cognitive Behavioral Analysis System of Psychotherapy; HAM‐D: Hamilton Depression Rating Scale. | |||
| Risk of bias (ROBINS‐I tool) | Rating | Explanation of judgement | Possible ratings |
| Bias due to confounding | 1 | Randomization before acute phase. | Code 1 = low risk, 2 = moderate risk, 3 = serious risk, 4 = critical risk, 5 = no information |
| Bias in selection of participants into the study | 1 | All possible participants were included (direct and cross‐over). All measures existing from the beginning of the intervention. The study flow was clearly described since acute treatment. | Code 1 = low risk, 2 = moderate risk, 3 = serious risk, 4 = critical risk, 5 = no information |
| Bias in classification of interventions | 1 | Intervention status is well defined (dose ranges are described in section 2.3 and 3.4). | Code 1 = low risk, 2 = moderate risk, 3 = serious risk, 4 = critical risk, 5 = no information |
| Bias due to departures from intended interventions | 1 | Assignment to intervention. Quote: "For both treatment groups, 10% of patients had dose increases aimed at improving outcome" (p. 31); same for both groups with regard to the main outcome; adapting dose is usual practice; no deviation from intended treatment, they counted the tablets. | Code 1 = low risk, 2 = moderate risk, 3 = serious risk, 4 = critical risk, 5 = no information |
| Bias due to missing data | 1 | Quote: "For all patients, including drop outs, pill counts indicated compliance rates of 88.7% for imipramine and 84.7% for sertraline. No differences were found between diagnostic groups or between acute and crossover patients." (p. 31); Proportions of and reasons for missing participants were similar across intervention groups; less than 5% dropout for the main outcome; proportions of missing data were comparable and are addressed in the analyses with LOCF. | Code 1 = low risk, 2 = moderate risk, 3 = serious risk, 4 = critical risk, 5 = no information |
| Bias in measurement of outcomes | 1 | Information from Rush et al., 1998 (study protocol): reliable ratings (p. 593); quote: "continued on the same double‐blind medication dose for an additional 16 weeks" (p. 593); assessment methods comparable across groups. | Code 1 = low risk, 2 = moderate risk, 3 = serious risk, 4 = critical risk, 5 = no information |
| Bias in selection of the reported result | 2 | Outcomes correspond to the ones named in the protocol, but protocol just for acute phase; not all measures used during the acute phase were used in continuation phase. | Code 1 = low risk, 2 = moderate risk, 3 = serious risk, 4 = critical risk, 5 = no information |
| LOCF: last observation carried forward. | |||
| Outcome or subgroup title | No. of studies | No. of participants | Statistical method | Effect size |
| 1 Relapse/recurrence Show forest plot | 4 | 383 | Risk Ratio (M‐H, Random, 95% CI) | 0.41 [0.21, 0.79] |
| 2 Dropout due to any reason Show forest plot | 4 | 386 | Risk Ratio (M‐H, Random, 95% CI) | 0.90 [0.39, 2.11] |
| 3 Depression severity Show forest plot | 3 | 333 | Mean Difference (IV, Random, 95% CI) | ‐4.79 [‐8.49, ‐1.09] |
| 4 SF‐36 Social Functioning score Show forest plot | 1 | 161 | Mean Difference (IV, Random, 95% CI) | 10.80 [3.04, 18.56] |
| 5 SF‐36 Emotional Role score Show forest plot | 1 | 161 | Mean Difference (IV, Random, 95% CI) | 20.70 [7.43, 33.97] |
| 6 SF‐36 Role Physical score Show forest plot | 1 | 161 | Mean Difference (IV, Random, 95% CI) | 2.10 [‐9.76, 13.96] |
| 7 Dropout due to any type of adverse event Show forest plot | 3 | 333 | Odds Ratio (M‐H, Random, 95% CI) | 3.53 [0.67, 18.70] |
| 8 Any type of adverse event Show forest plot | 1 | 161 | Odds Ratio (M‐H, Random, 95% CI) | 1.47 [0.70, 3.09] |
| 9 Relapse/recurrence sensitivity analysis Show forest plot | 4 | 360 | Risk Ratio (M‐H, Random, 95% CI) | 0.38 [0.16, 0.89] |
| Outcome or subgroup title | No. of studies | No. of participants | Statistical method | Effect size |
| 1 Relapse/recurrence Show forest plot | 1 | 82 | Risk Ratio (M‐H, Random, 95% CI) | 0.37 [0.14, 0.93] |
| 2 Dropout due to any reason Show forest plot | 1 | 82 | Risk Ratio (M‐H, Random, 95% CI) | 0.87 [0.41, 1.81] |
| 3 Depression severity Show forest plot | 1 | 82 | Mean Difference (IV, Random, 95% CI) | ‐4.00 [‐7.05, ‐0.95] |
| Outcome or subgroup title | No. of studies | No. of participants | Statistical method | Effect size |
| 1 Relapse/recurrence Show forest plot | 1 | 176 | Risk Ratio (M‐H, Random, 95% CI) | 1.22 [0.43, 3.49] |
| 2 Dropout due to any reason Show forest plot | 1 | 179 | Risk Ratio (M‐H, Random, 95% CI) | 0.56 [0.30, 1.03] |
| Outcome or subgroup title | No. of studies | No. of participants | Statistical method | Effect size |
| 1 Relapse/recurrence Show forest plot | 1 | 238 | Risk Ratio (M‐H, Random, 95% CI) | 1.23 [0.44, 3.44] |
| 2 Dropout due to any reason Show forest plot | 2 | 280 | Risk Ratio (M‐H, Random, 95% CI) | 1.43 [0.90, 2.29] |
| 3 Depression severity Show forest plot | 1 | 39 | Mean Difference (IV, Random, 95% CI) | 2.8 [0.38, 5.22] |
| 4 Depression severity – follow‐up Show forest plot | 1 | 39 | Mean Difference (IV, Random, 95% CI) | 0.90 [‐3.26, 5.06] |
| 5 Health‐related quality of life Show forest plot | 1 | 35 | Mean Difference (IV, Random, 95% CI) | ‐0.5 [‐1.63, 0.63] |
| 6 Health‐related quality of life – follow‐up Show forest plot | 1 | 33 | Mean Difference (IV, Random, 95% CI) | 0.60 [‐0.56, 1.76] |
| Outcome or subgroup title | No. of studies | No. of participants | Statistical method | Effect size |
| 1 Relapse/recurrence Show forest plot | 1 | 234 | Risk Ratio (M‐H, Random, 95% CI) | 1.51 [0.57, 4.01] |
| 2 Dropout due to any reason Show forest plot | 1 | 238 | Risk Ratio (M‐H, Random, 95% CI) | 0.82 [0.45, 1.51] |
| Outcome or subgroup title | No. of studies | No. of participants | Statistical method | Effect size |
| 1 Dropout due to any reason Show forest plot | 1 | 73 | Risk Ratio (M‐H, Random, 95% CI) | 4.35 [1.19, 15.87] |
| 2 Dropout due to any type of adverse event Show forest plot | 1 | 73 | Odds Ratio (M‐H, Random, 95% CI) | 1.49 [0.23, 9.60] |
| Outcome or subgroup title | No. of studies | No. of participants | Statistical method | Effect size |
| 1 Relapse/recurrence Show forest plot | 1 | 376 | Risk Ratio (M‐H, Random, 95% CI) | 1.27 [0.84, 1.91] |
| 2 Dropout due to any reason Show forest plot | 1 | 386 | Risk Ratio (M‐H, Random, 95% CI) | 0.81 [0.48, 1.38] |
| 3 Depression severity Show forest plot | 1 | 377 | Mean Difference (IV, Random, 95% CI) | 0.40 [‐0.97, 1.77] |
| 4 Health‐related quality of life Show forest plot | 1 | 347 | Mean Difference (IV, Random, 95% CI) | ‐4.30 [‐7.31, ‐1.29] |
| 5 Dropout due to any type of adverse event Show forest plot | 1 | 386 | Odds Ratio (M‐H, Random, 95% CI) | 1.99 [0.60, 6.65] |