Pronóstico global de los diagnósticos de trastorno del espectro autista en edad preescolar
Información
- DOI:
- https://doi.org/10.1002/14651858.CD012749.pub2Copiar DOI

- Base de datos:
-
- Cochrane Database of Systematic Reviews
- Versión publicada:
-
- 28 septiembre 2022see what's new
- Tipo:
-
- Prognosis
- Etapa:
-
- Review
- Grupo Editorial Cochrane:
-
Grupo Cochrane de Problemas de desarrollo, psicosociales y de aprendizaje
- Copyright:
-
- Copyright © 2022 The Cochrane Collaboration. Published by John Wiley & Sons, Ltd.
Cifras del artículo
Altmetric:
Citado por:
Autores
Contributions of authors
KW, SW and AB conceived the review.
KW, AB, SW designed the review.
AB and RH co‐ordinated the review.
AB, NA‐U, SW, AI, KW developed the protocol.
AB, RH, SW and KW screened search results at title, abstract level
AB, RH, SW, KW, and AM screened search results at full text level.
AB, RH, RB (acknowledgement), AM, SW and TM extracted data and rated risk of bias. KW resolved any conflicts.
AB, TM and RH analysed the data.
TM conducted the meta‐analyses, sensitivity and prognostic factor analyses.
AB, RH TM, KW and AI interpreted the data.
AB and TM graded the quality of the evidence using GRADE. KW and AI were consulted for their expertise when completing the GRADE assessments.
AB and RH wrote the review report, with KW and TM providing methodological, clinical and general advice.
All authors reviewed the final version.
AB is the guarantor for the review.
Sources of support
Internal sources
-
Monash University, Australia
Salary support provided for AB, TM and KW
-
Murdoch Children's Research Institute (MCRI), Australia
MCRI provided some salary support for AB
-
Sydney Children's Hospital Network, Australia
Salary support provided for SW
-
National Health and Medical Research Council (NHMRC), Australia
Susan Woolfenden is supported by an NHMRC Career Development Grant (GNT1158954)
-
University of New South Wales, Australia
Salary support provided for SW
External sources
-
None, Australia
We do not have any external sources of support to declare for this review.
Declarations of interest
AB works as a Speech Pathologist at Monash Children's Hospital, Clayton, Australia. She is also an Associate Editor for Cochrane Developmental, Psychosocial and Learning Problems (DPLP). AB was not involved in the editorial process for this review.
RH: is employed by Western Health as a Paediatric Registrar and works at multiple teaching hospitals in Victoria Australia, caring for children who have been diagnosed with autism spectrum disorder, including conducting diagnostic assessments for autism spectrum disorder as part of a multidisciplinary team.
TM works as a Psychologist in private practice in Victoria Australia.
AM is a Developmental and Community Paediatrician for the Sydney Local Health District and Developmental Paediatrics, Bondi, Sydney, Australia.
SW is the Director of Paediatrics at Sydney Local Health District, Sydney, Australia.
AI is a Hematology Consultant with Hamilton Health Sciences and Professor and Chair of the Department of Research Methods, Evidence, and Impact, McMaster University, Canada. AI is an Editor for Cochrane Cystic Fibrosis and Genetic Disorders and Cochrane Prognosis Methods.
KW is a Developmental Paediatrician for Monash Children's Hospital, Clayton, Australia, an Editor for Cochrane DPLP and a Convenor for Cochrane Child and Cochrane Prognosis. She was not involved in the editorial process for this review. KW declares a grant from the National Health and Medical Research Council for an autism prognosis study about predictors of autism outcome that will also publish diagnostic stability outcomes, and could be included in an update of this systematic review; paid to La Trobe University. The funder had no role in the design of this study or the methods, and will have no role in the data analysis and reporting.
Acknowledgements
We would like to thank the editorial team of Cochrane Developmental, Psychosocial and Learning Problems (DPLP) for their advice and support during the preparation of this review, particularly Margaret Anderson who contributed to the development of the search strategy and Joanne Duffield who also provided support through the process. We also wish to thank the editors, external referees and statistician who commented on earlier drafts. We would like to thank Natalia Albein Urios for her contribution to the published protocol, Ruth Braden for her assistance with data extraction and risk of bias ratings and Andrew Hayen for advice on the statistical analyses. We would also like to acknowledge Charissa Ying Zhen Chan and Francesca Lami for the translation of some articles that were not written in English.
The CRG Editorial Team are grateful to the following reviewers for their time and comments: Dr Farid Foroutan, Ted Rogers Centre for Heart Research, Toronto, Ontario, Canada; and Department of Health Research Methods, Evidence and Impact, McMaster University, Hamilton, Ontario, Canada; Dr Kristelle Hudry, Department of Psychology, Counselling and Therapy, School of Psychology and Public Health, La Trobe University, Australia; Nuala Livingstone, Cochrane Editorial and Methods Department, UK; and Zoe Thomas, Australia; as well as three reviewers who chose not to be publicly acknowledged. They are also grateful to Heather Maxwell for copyediting the review.
Cochrane DPLP supported the authors in the development of this prognosis review.
The following people conducted the editorial process for this article:
-
Sign‐off Editor (final editorial decision): Professor Geraldine Macdonald, Cochrane DPLP; University of Bristol, UK;
-
Managing Editor (selected peer reviewers, collated peer‐reviewer comments, provided editorial guidance to authors, edited the article): Dr Joanne Duffield, Cochrane DPLP; Queen's University Belfast, NI;
-
Deputy Managing Editor (conducted editorial policy checks, provided editorial guidance to authors, edited the article): Dr Sarah Davies, Cochrane DPLP; University of Bristol, UK;
-
Copy Editor (copy editing and production): Heather Maxwell;
-
Peer‐reviewers (provided comments): Dr Farid Foroutan, Ted Rogers Centre for Heart Research, Toronto, Ontario, Canada; and Department of Health Research Methods, Evidence and Impact, McMaster University, Hamilton, Ontario, Canada (methods review)a, Dr Kristelle Hudry, Department of Psychology, Counselling and Therapy, School of Psychology and Public Health, La Trobe University, Australia (clinical/content review), Dr Nuala Livingstone, Cochrane Editorial and Methods Department, UK (methods review)a; Zoe Thomas, Australia (consumer review), and Margaret Anderson, Cochrane DPLP; Queen's University Belfast, NI (search review). One additional peer reviewer provided clinical peer review, and two provided statistical peer reviewa,b, but chose not to be publicly acknowledged.
a*Dr Farid Foroutan is a member of Cochrane Metabolic and Endocrine Disorders Group and the Prognosis Methods Group, Dr Nuala Livingstone is a member of the Cochrane Editorial and Methods Department, as is one peer reviewer who chose to remain anonymous. All provided peer‐review comments on this article and approved it for copyediting and publication, but otherwise were not involved in the editorial process or decision making for this article.
bOne peer reviewer who chose to remain anonymous is a member of Cochrane DPLP, and provided peer‐review comments on this article, but was not otherwise involved in the editorial process or decision making for this article.
Version history
| Published | Title | Stage | Authors | Version |
| 2022 Sep 28 | Overall prognosis of preschool autism spectrum disorder diagnoses | Review | Amanda Brignell, Rachael C Harwood, Tamara May, Susan Woolfenden, Alicia Montgomery, Alfonso Iorio, Katrina Williams | |
| 2017 Aug 24 | Overall prognosis of preschool autism spectrum disorder diagnoses | Protocol | Amanda Brignell, Natalia Albein‐Urios, Susan Woolfenden, Andrew Hayen, Alfonso Iorio, Katrina Williams | |
Differences between protocol and review
Criteria for considering studies for this review
Types of outcome measures
We added an inclusion criterion to clarify the same diagnostic methods and tools needed to be used at both baseline and follow‐up. This was to ensure minimal impact of type of tool on diagnostic status.
We removed the wording "For studies that presented data using continuous measures (e.g. a score on a diagnostic scale), we analysed the data by computing a dichotomous variable" because a mean score on a tool did not allow us to determine change in diagnostic status. The primary outcome was proportion diagnosed with autism spectrum disorder, so it was not appropriate to use continuous measures for this outcome.
Data collection and analysis
We trialled the planned data collection forms and adapted these to ensure the most relevant information was collected (see Appendix 2 for adapted data collection form).
We added additional text on the criteria used to assign ratings and summaries. We added the following to the methods so the process for judging risk of bias was fully transparent.
"These items were then summarised into three domains (study participation, study attrition and outcome measurement) by combining the individual item ratings to provide a risk of bias rating for each summary domain. For study participation, we prioritised ratings for the 'participation in the study by all eligible' and 'study recruitment' criteria. Poor participation and retrospective studies were marked at high risk of bias. Those studies with good participation and prospective recruitment were marked at low risk of bias, which was then graded down to moderate risk of bias if they had one other high risk of bias criterion or three moderate risk of bias criteria across the remainder of the study participation domain criteria. In the study attrition domain, 'loss to follow‐up' criteria were prioritised for determining the domain rating. Those with no loss to follow‐up received a rating of low risk of bias for the study attrition domain rating, except in the case of retrospective studies, where the loss to follow‐up is determined by the selection of participants retrospectively, based on data availability. For the outcome measurement domain rating, we prioritised blinding of the study. If the study was unblinded, it was given a rating of high risk of bias for the domain rating. If the blinding was unclear and the remainder of the criteria were at low risk of bias, then the study was rated at moderate risk of bias; however, if blinding was unclear and there was at least one other criteria in the domain rated at moderate or high, then that study was rated at high risk of bias for the outcome measure domain. Lastly, we provided one overall risk of bias rating for each study. We rated studies to have an overall low risk of bias if all three summary domains were rated at low or moderate risk of bias. Those rated to be at overall high risk of bias were those where one or more summary domains were rated at high risk of bias."
We changed the wording of the term 'subgroup' (written in the protocol) to 'prognostic factor' throughout the manuscript. Prognostic factors modify overall prognosis rather than subgroups, so this term is preferred.
Unit of analysis issues
We stated in the protocol that "if studies had reported data for subgroups (e.g. autistic or autism spectrum disorder; male or female) we will calculate a composite mean score, if this is meaningful. We will do this by conducting a fixed‐effect meta‐analysis of within‐study groups, following the methods described by Borenstein 2009". Continuous mean scores provided for a whole group do not allow us to categorise the number of participants within the group who did and did not meet autism criteria on that measure using any type of analysis including a fixed‐effects meta‐analysis. Upon further consideration, we have removed the sentence on conducting a fixed‐effect meta‐analysis from the review, as we do not plan to use these methods in the future.
Dealing with missing data
We added the following text to the methods section of the review and followed these methods for the review.
"We only included studies when baseline and follow‐up data were provided, detailing the number of children diagnosed with autism spectrum disorder, and where the method of diagnosis was explicitly provided. For studies where we could not extract data on the primary outcome, we compared the characteristics of studies included and excluded from the meta‐analysis and reported any differences in study samples."
Reporting bias
It was not appropriate to complete funnel plots due to the nature of the data (ceiling effect of 100% made the analyses invalid). Therefore, we removed the following sections from the methods.
"If we are able to pool 10 or more studies, we will examine publication bias and other small study effects, using a funnel plot in Review Manager (RevMan), version 5 (Review Manager 2014). We will check for asymmetry at a 10% level. We will attempt to obtain the results of unpublished studies by contacting study authors. Where this is not possible, and the missing studies are thought to introduce significant bias, we will explore the impact of including such studies in the overall assessment of results using sensitivity analyses."
Data synthesis
We used Stata (StataCorp 2019) rather than Revman Web (RevMan Web 2020), to construct forest plots because Revman does not enable forest plots of proportion data.
We changed the minimum number of studies required for meta‐analysis from three to two since a meta‐analysis is possible with two studies. We wrote the following: "We conducted meta‐analyses since data were available from two or more sufficiently homogeneous studies".
We modified the wording of the GRADE assessment table (Appendix 4).
We decided not to collect information in a 'GRADE Evidence Profile' table (Schünemann 2013). We removed the 'GRADE Evidence Profile' table that had been included in the study protocol (Brignell 2017), as it was not required.
Keywords
MeSH
Medical Subject Headings (MeSH) Keywords
Medical Subject Headings Check Words
Adult; Child; Child, Preschool; Female; Humans; Infant; Male; Young Adult;

Study flow diagram.
Risk of bias ratings on the QUIPS tool (40 studies). Green is low risk of bias, orange is moderate risk of bias and red is high risk of bias.
Summary risk of bias ratings for provided for each QUIPS domain (i.e.study participation, study attrition, outcome measurement). See Appendix 9 for a figure showing all criteria that were rated for each domain. Studies were rated to have an overall low risk of bias if all three summary domains were rated low or moderate risk of bias. Studies were rated to have an overall high risk of bias if all three summary domains were rated low or moderate risk of bias.

Risk of bias graph: review authors' judgements about each risk of bias item for each included study presented as percentages across all included studies (41 studies).

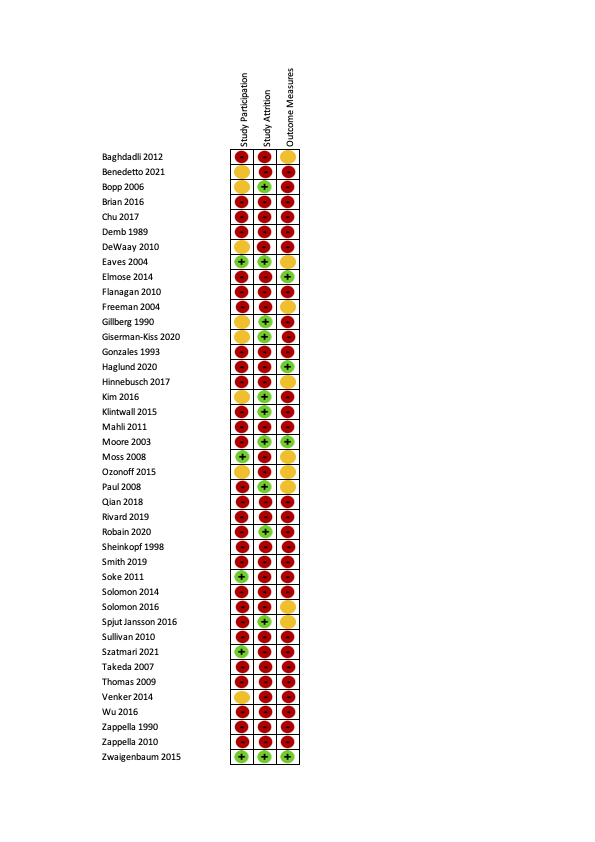
Risk of bias ratings for each included study for each of the 18 criteria. Red indicates high, orange indicates moderate, green indicates low and yellow indicates unclear risk of bias.

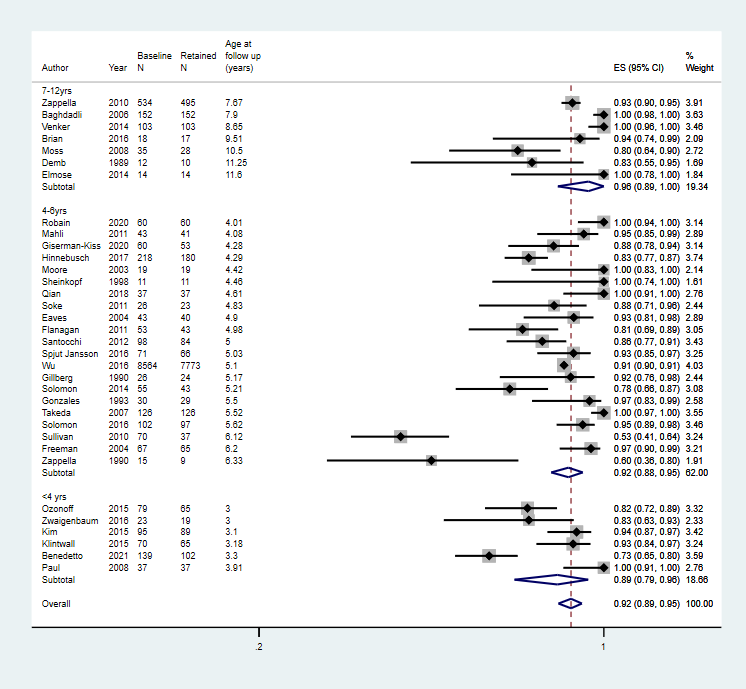
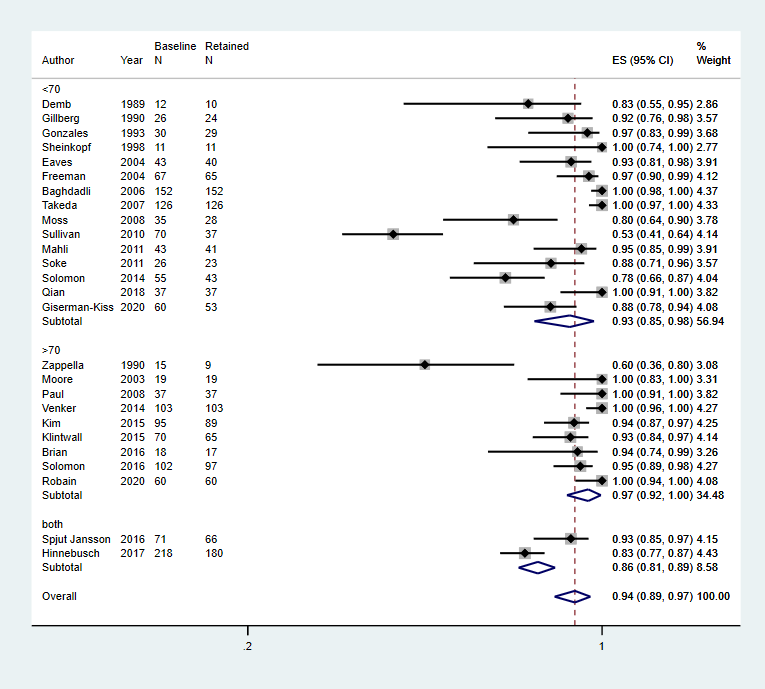
Forest plot of proportion of children that retained their autism diagnosis
Footnote
CI: confidence interval; ES: effect size; N: number in sample

Age at baseline: < 2 years; 2 to 3 years; 4 to 6 years; 7 to 12; years; 13 to 17 years
Footnote
CI: confidence interval; ES: effect size; N: number in sample
Age at follow up: 2 to 3 years; 4 to 6 years; 7 to 12 years; 13 to 18 years
Footnote
CI: confidence interval; ES: effect size; N: number in sample

Duration of follow‐up: short‐term (up to 2 years), medium‐term (2 to 5 years), and long‐term (6 to 17 years) follow‐up
Footnote
CI: confidence interval; ES: effect size; N: number in sample
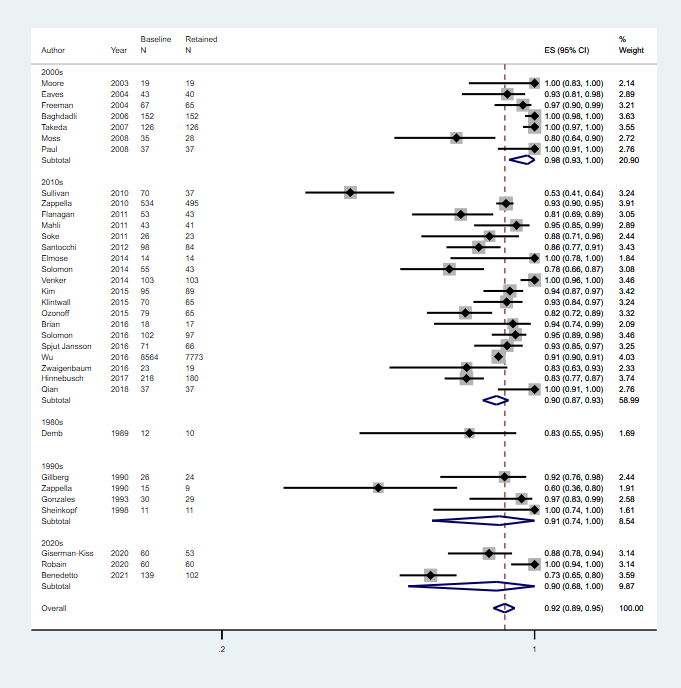
Decade of publication: 1960 to 1969; 1970 to 1979; 1980 to 1989; 1990 to 1999; 2000 to 2009; 2010 to 2019
Footnote
CI: confidence interval; ES: effect size; N: number in sample
Intelligence: mean IQ 70; mean IQ > 70; or more than 70% of the cohort has IQ 70
Footnote
CI: confidence interval; ES: effect size; IQ: intelligence quotient; N: number in sample

Language: > 70% verbal; > 70% non‐verbal (i.e. use < 15 words); mean standardised language score < 70; mean standardised language score 70; or > 70% of the cohort has mean language score < 70
Footnote
CI: confidence interval; ES: effect size; N: number in sample

Adaptive behaviour: mean standard score 70; mean standard score > 70; or > 70% of the cohort has mean standard score 70
Footnote
CI: confidence interval; ES: effect size; N: number in sample
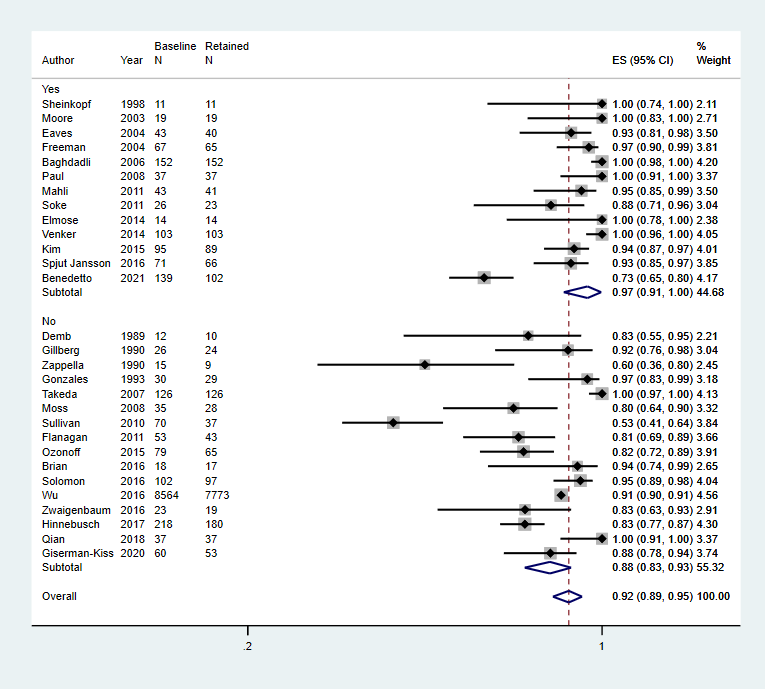
Multidisciplinary team used for diagnosis, Yes or No
Footnote
CI: confidence interval; ES: effect size; N: number in sample
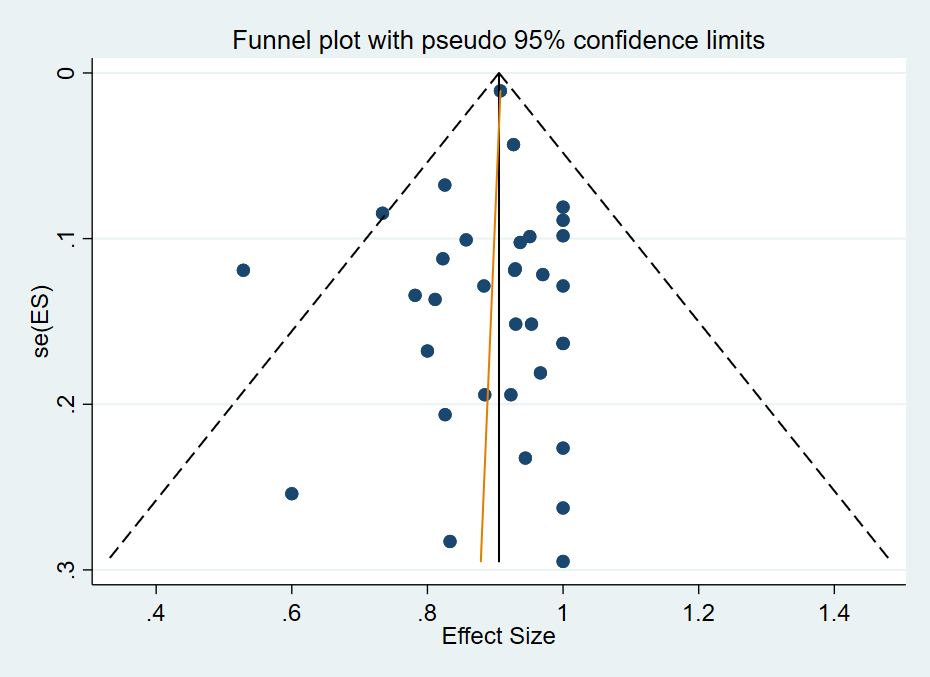
Funnel Plot of included studies
| Proportion of individuals who have a diagnosis of autism spectrum disorder at baseline and continue not meet diagnostic criteria at follow‐up one or more years later | ||||
| Patient or population: children diagnosed with autism spectrum disorder Settings: range of settings | ||||
| Outcomes | Relative effect (95% CI) | Number of participants (studies) | Quality of the evidence | Comments |
|---|---|---|---|---|
| Proportion with an autism spectrum disorder diagnosis at baseline and follow‐up Follow‐up: > 12 months | 0.92 (0.89 to 0.95) | 11,105 (34 studies: 1 intervention trial with 1 arm; 1 RCTa; 2 non‐RCTsa; 30 TAU or in the community) | ⊕⊕⊝⊝ Lowb,c | Limitations (ROB): seriousb Inconsistency: seriousc Indirectness: not serious Imprecision: not serious Publication/reporting bias: not serious Effect size: N/A Dose response gradient: N/A Confirmatory evidence: N/A See footnotes below. |
| Social communication at baseline and follow‐up (mean score) Follow‐up: > 12 months | See comments | None of the included studies provided separate domain scores at baseline and follow‐up | ||
| Restricted and repetitive behaviours and interests at baseline and follow‐up (mean score) Follow‐up: > 12 months | See comments | None of the included studies provided separate domain scores at baseline and follow‐up | ||
| Defnitions of levels of evidence High: We are very confident that the true prognosis (probability of future events) lies close to that of the estimate Moderate: We are moderately confident that the true prognosis (probability of future events) is likely to be close to the estimate, but there is a possibility that it is substantially different Low: Our confidence in the estimate is limited: the true prognosis (probability of future events) may be substantially different from the estimate Very low: We have very little confidence in the estimate: the true prognosis (probability of future events) is likely to be substantially different from the estimate
CI: Confidence intervals;N/A: Not applicable;RCT(s): Randomised controlled trial(s);ROB: Risk of bias; TAU: Treatment as usual. | ||||
| aData were taken from the control arm of the study | ||||
| Year published | Classification system | Subgroups (as specified in the classification system) |
|---|---|---|
| 1975 | International Classification of Diseases, Ninth Revision, Clinical Modification (ICD‐9‐CM) | Autistic disorder |
| 1980 | Diagnostic and Statistical Manual of Mental Disorders, Third Edition (DSM‐III) | PDD: infantile autism, childhood onset PDD and atypical PDD |
| 1987 | Diagnostic and Statistical Manual of Mental Disorders, Third Edition, Revised (DSM‐III‐R) | PDD: autistic disorder, PDD‐not otherwise specified (PDD‐NOS) |
| 1994 to 2000 | Diagnostic and Statistical Manual of Mental Disorders, Fourth Edition (DSM‐IV) | Asperger’s disorder, autistic disorder, PDD‐NOS |
| 1996 | International Classification of Diseases, Tenth Revision (ICD‐10) | Childhood autism, Asperger's syndrome, atypical autism, pervasive developmental disorder (PDD) ‐ unspecified |
| 2000 to 2013 | Diagnostic and Statistical Manual of Mental Disorders, Fourth Edition, Text Revision (DSM‐IV‐TR) | Asperger’s disorder, autistic disorder, PDD‐NOS |
| 2013 to current | Diagnostic and Statistical Manual of Mental Disorders, Fifth Edition (DSM‐5) | Autism spectrum disorder |
| 2018 | International Classification of Diseases, Eleventh Revision (ICD‐11) | Autism spectrum disorder |
| PDD‐NOS: pervasive developmental disorder | ||
| Primary publication | Additional publications from the same study |
|---|---|
| Anderson 2007, Bedford 2016, Gotham 2012, Gotham 2011, Hus 2011, Lord 1995, Lord 2004, Lord 2012, Luyster 2007, Pickles 2014, Richler 2010, Thurm 2007 | |
| Baghdadli 2018, Baghdadli 2008, Baghdadli 2007, Darrou 2010, Pry 2011, Pry 2012 | |
| Bopp 2009; Smith 2007 | |
| Flanagan 2012 | |
| Giserman‐Kiss 2018 | |
| Magiati 2007, Magiati 2011a, Magiati 2011b | |
| Ke 2017, Li 2019 | |
| Mello 2018 | |
| Mahoney 2016 | |
| Solomon 2018, Waizbard‐Bartov 2021 | |
| Baribeau 2020, Baribeau 2021, Courchesne 2021, Bennett 2014, Bennett 2015, Georgiades 2014, Georgiades 2021, Szatmari 2015 | |
| Ellis‐Weismer 2015, Davidson 2017, Ray‐Subramanian 2012, Venker 2016 | |
| aMet inclusion criteria but unable to extract data for synthesis as children without a diagnosis of autism spectrum disorder were also included in the cohort. Authors were contacted but we were unable to obtain required data. | |
| Study | Diagnosis type | N at baseline (% male) | IQ (mean standard score)a | Adaptive behavior (mean standard score)a | Language (mean standard score)a | Age at baseline (years) | Follow‐up duration (years) | Diagnostic tool used at baseline (multidisciplinary or not) | Proportion who met diagnostic criteria at follow‐up |
|---|---|---|---|---|---|---|---|---|---|
| ASD | 152 (82) | < 70 | < 70 | NR | 4.90 | 3.00 | ICD‐10 & CARS (Y) | 1.0 | |
| ASD | 147 (80) | NR | NR | NR | 2.3 | 1 | DSM‐5 and ADOS (Y) | 0.73 | |
| ASD | 18 (72) | > 70 | NR | > 70 | 3.15 | 6.36 | DSM‐IV‐TR & ADOS (N) | 0.94 | |
| ASD | 12 (75) | < 70 | NR | NR | 4.50 | 5.00 | DSM‐III & DSM‐III R (N) | 0.83 | |
| ASD | 43 (80) | < 70 | < 70 | NR | 2.75 | 2.25 | DSM‐IV, CARS, MDT (Y) | 0.93 | |
| ASD | 23 (78) | NR | NR | NR | 3.10 | 8.30 | ICD‐10, ADOS (Y) | 1.00 | |
| ASD | 67 (82) | NR | < 70 | NR | 3.59 | 1.38 | CARS (N) | 0.81 | |
| ASD | 59 (81) | < 70 | NR | NR | 4.00 | 2.2 | DSM IV, CARS (N) | 0.97 | |
| ASD | 25 (68) | < 70 | NR | NR | 1.13 | 4.04 | DSM‐III‐R (N) | 0.92 | |
| ASD | 60 (87) | <70 | NR | <70 | 2.31 | 1.98 | ADOS | 0.883 | |
| ASD | 30 (73) | < 70 | NR | NR | 4.50 | 1.00 | DSM‐III, DSM‐III‐R, DSM‐IV and ICD 10 (N) | 0.97 | |
| ASD | 219 (81) | Both | NR | < 70 | 2.13 | 2.16 | DSM‐IV, ADOS, CARS (N) | 0.83 | |
| ASD | 100 (84) | > 70 | Both | NR | 1.80 | 1.30 | ADOS (Y) | 0.93 | |
| ASD | 70 (89) | > 70 | > 70 | < 70 | 1.83 | 1.36 | ADOS G, ADOS T (U) | 0.93 | |
| ASD | 77 (83) | < 70 | NR | NR | 2.48 | 1.65 | CARS (Y) | 0.95 | |
| ASD | 19 (80) | > 70 | NR | < 70 | 2.83 | 1.59 | ADI‐R (Y) | 1.00 | |
| ASD | 35 (91) | < 70 | < 70 | < 70 | 3.5 | 7.00 | ADI‐R (N) | 0.80 | |
| ASD | 79 (NR) | NR | NR | NR | 2 | 1 | ADI‐R, DSM IV, best clinical estimate (N) | 0.82 | |
| ASD | 37 (NR) | > 70 | > 70 | < 70 | 1.82 | 1.09 | ADOS (Y) | 1.00 | |
| ASD | 37 (86) | <70 | NR | NR | 2.57 | 2 | DSM IV TR; CARS ADI‐R (N) | 1.00 | |
| ASD | 60 (100) | >70 | NR | NR | 3 | 1 | DSM 5 ADOS (N) | 1.00 | |
| ASD | 98 (NR) | NR | NR | NR | 3.25 | 1.75 | ADOS, CARS | 0.86 | |
| ASD | 11 (NR) | < 70 | NR | NR | 2.94 | 1.51 | DSM‐III (Y) | 1.00 | |
| AD | 28 (79) | < 70 | NR | NR | 2.75 | 2.08 | ADI‐R (Y) | 0.89 | |
| ASD | 55 (84) | < 70 | NR | NR | 4.21 | 1.00 | ADOS (U) | 0.78 | |
| ASD | 102 (80) | > 70 | Both | Both | 2.86 | 2.76 | ADOS (N) | 0.95 | |
| ASD | 71 (79) | Both | Both | NR | 3.03 | 2.00 | ADOS, DISCO, ADI‐R (Y) | 0.93 | |
| ASD | 75 (83) | < 70 | < 70 | NR | 3.94 | 2.18 | CARS (N) | 0.53 | |
| ASD | 126 (81) | < 70 | NR | NR | 2.62 | 2.90 | ICD‐10, CARS (N) | 1.00 | |
| ASD | 129 (87) | > 70 | > 70 | Both | 2.80 | 5.85 | DSM‐IV, ADOS (Y) | 1.00 | |
| ASD | 8564 (83) | NR | NR | NR | 3.67 | 1.43 | DSM‐IV‐TR file record review (N) | 0.91 | |
| AD | 15 (87) | > 70 | Both | NR | 4.50 | 1.83 | DSM‐III (N) | 0.60 | |
| ASD | 534 (84) | NR | NR | NR | 5.00 | 2.67 | DSM‐IV‐TR (U) | 0.93 | |
| ASD | 23 (69) | NR | > 70 | NR | 1.50 | 1.50 | DSM‐IV‐TR (N) | 0.83 | |
| aMean score (IQ, adaptive behaviour or language) for the cohort is < 70 or more than 70% are less than 70. If cohort evenly spread this is signified 'both'. AD: autistic disorder; ADI: Autism Diagnostic Interview;ADOS: Autism Diagnostic Observation Schedule; ASD: autism spectrum disorder; CARS: Childhood Autism Rating Scale; DISCO: Diagnostic Interview for Social and Communication Disorders; DSM: Diagnostic Statistical Manual of Mental Disorders; ICD: International Classification of Diseases; IQ: intelligence quotient; N: no; NR: not reported; PDD‐NOS: pervasive developmental disorder‐ not otherwise specified; U: unclear; Y: yes. | |||||||||
| Domain | Relative effect (95% CIs) | No. of participants (studies) | I2 | |
|---|---|---|---|---|
| Age at baseline | 0 to 2 years | 0.94 (0.88 to 0.98) | 251 (5 studies) | 52.64%, P = 0.08 |
| 2 to 3 years | 0.92 (0.88 to 0.95) | 9989 (22 studies) | 90.17%, P < 0.01 | |
| 4 to 5 years | 0.91 (0.76 to 0.99) | 152 (5 studies) | 90.48%, P < 0.01 | |
| 5 to 6 years | 0.93 (0.90 to 0.95) | 534 (1 study) | ‐ | |
| Age at follow‐up | < 4 years | 0.89 (0.79 to 0.96) | 443 (6 studies) | 86.80%, P < 0.01 |
| 4 to 6 years | 0.92 (0.88 to 0.95) | 9794 (21 studies) | 87.88%, P < 0.01 | |
| 7 to 12 years | 0.96 (0.89 to 1.00) | 868 (7 studies) | 88.18%, P < 0.01 | |
| Duration of follow‐up | 1 to 2 years | 0.91 (0.88 to 0.94) | 10,745 (27 studies) | 87.86%, P < 0.01 |
| 2 to 5 years | 0.99 (0.92 to 1.00) | 293 (4 studies) | 78.16%, P < 0.01 | |
| 6 to 17 years | 0.92 (0.77 to 1.00) | 67 (3 studies) | ‐ | |
| Decade of publication | 1980 to 1989 | 0.83 (0.55 to 0.95) | 12 (1 studies) | ‐ |
| 1990 to 1999 | 0.91 (0.74 to 1.00) | 82 (4 studies) | 73.16% P = 0.01 | |
| 2000 to 2009 | 0.98 (0.93 to 1.00) | 479 (7 studies) | 80.57% P < 0.01 | |
| 2010 to 2019 | 0.90 (0.87 to 0.93) | 10,273 (19 studies) | 86.84% P < 0.01 | |
| 2020 to 2029 | 0.90 (0.68 to 1.00) | 259 (3 studies) | ‐ | |
| Intelligencea | < 70 | 0.93 (0.85 to 0.98) | 793 (15 studies) | 90.88%, P < 0.01 |
| > 70 | 0.97 (0.92 to 1.00) | 502 (9 studies) | 77.54%, P < 0.01 | |
| Both < 70 and > 70 | 0.86 (0.81, 0.89) | 289 (2 studies) | ‐ | |
| Languagea | < 70 | 0.92 (0.84 to 0.98) | 382 (6 studies) | 79.65%, P < 0.01 |
| > 70 | 0.94 (0.74 to 0.99) | 18 (1 study) | ‐ | |
| Both | 0.98 (0.96 to 1.00) | 205 (2 studies) | ‐ | |
| Adaptive behavioura | < 70 | 0.85 (0.60 to 0.99) | 300 (5 studies) | 96.33%, P < 0.01 |
| > 70 | 0.97 (0.8 to 1.00) | 233 (4 studies) | 83.28%, P < 0.01 | |
| Both | 0.91 (0.82, 0.97) | 283 (4 studies) | 73.88%, P = 0.01 | |
| Multidisciplinary assessment | Yes | 0.97 (0.91 to 1.00) | 767 (13 studies) | 87.97%, P < 0.01 |
| No | 0.88 (0.83 to 0.93) | 9468 (16 studies) | 89.46%, P < 0.01 | |
| aMean score (IQ, adaptive behaviour or language) for the cohort is < 70 or more than 70% are less than 70. If cohort was evenly spread this is signified 'both'. CI: confidence interval;I2: a statistic that describes the percentage of variation across studies; No.: number. | ||||