Pronóstico global de los diagnósticos de trastorno del espectro autista en edad preescolar
Appendices
Appendix 1. Search strategies
Ovid MEDLINE
12 October 2017 (7283 records)
5 July 2021 (3916 records)
1 child development disorders, pervasive/
2 asperger syndrome/
3 autism spectrum disorder/
4 autistic disorder/
5 autis$.tw.
6 asperger$.tw.
7 pervasive development$ disorder$.tw.
8 (child$ adj3 pervasiv$).tw.
9 (PDD adj3 (specified or unspecified)).tw.
10 PDD‐NOS.tw.
11 or/1‐10
12 prognosis/
13 prognos$.tw,kf.
14 prevalence/
15 prevalenc$.tw,kf.
16 follow up studies/
17 (follow$ up$ or followup$).tw.
18 ((diagnos$ or temporal$) adj3 (change$ or stable or unstable or reliab$ or stabili#e$ or stability or instability or re‐evaluat$)).tw,kf.
19 ((developmental or diagnos$) adj1 (outcome$ or trajector$)).tw.
20 (diagnos$ adj1 (baseline or base‐line or early or earlier or first or improve$ or improving or initial$ or original$ or previous$)).ab.
21 (diagnos$ adj1 (final or second or later or subsequent$)).ab.
22 (outcome$ adj2 (change$ or improve$ or severe or severity or trajector$ or worse or worst or worsen$)).ab.
23 (symptom$ adj2 (change$ or improve$ or improving or reduc$ or severe or severity or trajector$ or worse or worst or worsen$)).ab.
24 ((measure$ or score$ or rating$) adj2 (change$ or improve$ or improving or severe or severity or worse or worst or worsen$)).ab.
25 predict$.ab,kf.
26 or/12‐25
27 11 and 26
28 ((autis$ or asperger$ or pervasive) and (improve$ or improving or stability or stable)).ti.
29 27 or 28 [Final line of 2017 search]
30 (201710* or 2018* or 2019* or 2020* or 2021*).dt,ez,da.
31 29 and 30
32 remove duplicates from 31 [Final line of 2021 search]
Ovid Epub Ahead of Print (via Ovid MEDLINE(R) and Epub Ahead of Print, In‐Process, In‐Data‐Review & Other Non‐Indexed Citations, Daily and Versions(R))
12 October 2017 (412 records)
5 July 2021 (413 records)
1 autis$.tw.
2 asperger$.tw.
3 pervasive development$ disorder$.tw,kf.
4 (child$ adj3 pervasiv$).tw,kf.
5 (PDD adj3 (specified or unspecified)).tw,kf.
6 PDD‐NOS.tw,kf.
7 or/1‐6
8 prognos$.tw,kf.
9 prevalenc$.tw,kf. )
10 (follow$ up$ or followup$).tw,kf.
11 ((diagnos$ or temporal$) adj3 (change$ or stable or unstable or reliab$ or stabili#e$ or stability or instability or re‐evaluat$)).tw,kf.
12 ((developmental or diagnos$) adj1 (outcome$ or trajector$)).tw,kf.
13 (diagnos$ adj1 (baseline or base‐line or early or earlier or first or initial$ or original$ or previous$)).ab.
14 (diagnos$ adj1 (final or second or later or subsequent$)).ab.
15 (outcome$ adj2 (change$ or improve$ or improving or severe or severity$ or trajector$ or worse or worst or worsen$)).ab.
16 (symptom$ adj2 (change$ or improve$ or improving or reduc$ or severe or severity$ or trajector$ or worse or worst or worsen$)).ab.
17 ((measure$ or score$ or rating$) adj2 (change$ or improve$ or improving or severe or severity$ or worse or worst or worsen$)).ab.
18 predict$.ab,kf.
19 or/8‐18
20 7 and 19
21 ((autis$ or asperger$ or pervasive) and (improve$ or improving or stability or stable)).ti.
22 20 or 21
23 limit 22 to publisher
Ovid MEDLINE In‐Process, In‐Data‐Review & Other Non‐Indexed Citations (via Ovid MEDLINE(R)) and Epub Ahead of Print, In‐Process, In‐Data‐Review & Other Non‐Indexed Citations, Daily and Versions(R)
2 October 2017 (1296 records)
5 July 2021 (1457 records)
1 autis$.tw.
2 asperger$.tw.
3 pervasive development$ disorder$.tw,kf.
4 (child$ adj3 pervasiv$).tw,kf.
5 (PDD adj3 (specified or unspecified)).tw,kf.
6 PDD‐NOS.tw,kf.
7 or/1‐6
8 prognos$.tw,kf.
9 prevalenc$.tw,kf.
10 (follow$ up$ or followup$).tw,kf.
11 ((diagnos$ or temporal$) adj3 (change$ or stable or unstable or reliab$ or stabili#e$ or stability or instability or re‐evaluat$)).tw,kf.
12 ((developmental or diagnos$) adj1 (outcome$ or trajector$)).tw,kf.
13 (diagnos$ adj1 (baseline or base‐line or early or earlier or first or initial$ or original$ or previous$)).ab.
14 (diagnos$ adj1 (final or second or later or subsequent$)).ab.
15 (outcome$ adj2 (change$ or improve$ or improving or severe or severity or trajector$ or worse or worst or worsen$)).ab.
16 (symptom$ adj2 (change$ or improve$ or improving or reduc$ or severe or severity or trajector$ or worse or worst or worsen$)).ab.
17 ((measure$ or score$ or rating$) adj2 (change$ or improve$ or improving or severe or severity$ or worse or worst or worsen$)).ab.
18 predict$.ab,kf.
19 or/8‐18
20 7 and 19
21 ((autis$ or asperger$ or pervasive) and (improve$ or improving or stability or stable)).ti.
22 20 or 21
23 limit 22 to ("in data review" or in process or "pubmed not medline") [Annotation: Final line 2017]
24 (201710* or 2018* or 2019* or 2020* or 2021*).dt,ed,ez.
25 23 and 24 [Annotation: Final line 2021]
Embase Ovid
12 October 2017 (8263 records)
5 July 2021 (4452 records)
1 *autism/ or *asperger syndrome/ or *childhood disintegrative disorder/ or *"pervasive developmental disorder not otherwise specified"/
2 autis$.tw.
3 asperger$.tw.
4 pervasive development$ disorder$.tw.
5 (pervasive adj3 child$).tw.
6 PDD‐NOS$.tw.
7 or/1‐6
8 *prognosis/
9 prognos$.tw,kw.
10 *follow up/
11 (follow$ up$ or followup$).tw.
12 ((diagnos$ or temporal$) adj3 (change$ or improve$ or stable or unstable or reliab$ or stabili#e$ or stability or instability or re‐evaluat$)).tw.
13 ((developmental or diagnos$) adj1 (outcome$ or trajector$)).tw.
14 (diagnos$ adj1 (baseline or base‐line or early or earlier or first or initial$ or original$ or previous$)).ab.
15 (diagnos$ adj1 (final or second or later or subsequent$)).ab.
16 (outcome$ adj2 (change$ or improve$ or improving or severe or severity or trajector$ or worse or worst or worsen$)).ab.
17 (symptom$ adj2 (baseline or change$ or improve$ or improving or reduc$ or severe or severity or trajector$ or worse or worst or worsen$)).ab.
18 ((measure$ or score$ or level$) adj2 (baseline or change$ or improve$ or improving or severe or severity or worse or worst or worsen$)).ab.
19 (predict$ adj3 (baseline or change$ or course or reduc$ or severe or severity or trajector$ or worse or worst or worsen$)).ab.
20 predict$.kw.
21 or/8‐20
22 7 and 21
23 ((autis$ or asperger$ or pervasive) and (improve$ or improving or stability or stable)).ti.
24 22 or 23 [Annotation: Final line 2017]
25 limit 24 to yr="2017 ‐Current"
26 remove duplicates from 25 [Annotation: Final line 2021]
CINAHL Plus EBSCOhost
12 October 2017 (3260 records)
6 July 2021 (2070 records)
S1 (MM "Child Development Disorders, Pervasive")
S2 (MM "Autistic Disorder")
S3 (MM "Asperger Syndrome")
S4 (MM "Pervasive Developmental Disorder‐Not Otherwise Specified")
S5 TI(autis*) or AB (autis*)
S6 TI(asperger*) or AB (asperger*)
S7 TI (pervasive development* disorder*) OR AB (pervasive development* disorder*)
S8 TI (child* N3 pervasiv*) OR AB (child* N3 pervasiv*)
S9 TI ( (PDD N3 (specified or unspecified)) ) OR AB ( (PDD N3 (specified or unspecified)) )
S10 TI PDD‐NOS OR AB PDD‐NOS
S11 S1 OR S2 OR S3 OR S4 OR S5 OR S6 OR S7 OR S8 OR S9 OR S10
S12 (MM "Prognosis")
S13 TI prognos* OR AB prognos*
S14 (MH "Prospective Studies+")
S15 TI ( "follow up" or follow‐up ) OR AB( "follow up" or follow‐up )
S16 TI ( ((developmental or diagnos*) N1 (outcome* or trajector*)) ) OR AB ( ((developmental or diagnos*) N1 (outcome* or trajector*)) )
S17 TI ( ((diagnos* or temporal*) N3 (change* or stable or unstable or reliab* or stabili* or stability or instability or re‐evaluat*)) ) OR AB ( ((diagnos* or temporal*) N3 (change* or stable or unstable or reliab* or stabili* or instability or re‐evaluat*)) )
S18 AB (diagnos* N1 (baseline or base‐line or early or earlier or first or initial* or original* or previous*))
S19 AB (diagnos* N1 (final or second or later or subsequent*))
S20 AB (outcome* N2 (change* or improve* or improving or severe or severity or trajector* or worse or worst or worsen*))
S21 AB (symptom* N2 (change* or improve* or improving or reduc* or severe or severity or trajector* or worse or worst or worsen*))
S22 AB ((measure* or score* or rating*) N2 (change* or improve* or improving or severe or severity or worse or worst or worsen*))
S23 AB predict*
S24 S12 OR S13 OR S14 OR S15 OR S16 OR S17 OR S18 OR S19 OR S20 OR S21 OR S22 OR S23
S25 S11 AND S24
S26 TI ((autis* or asperger* or pervasive) and (improve* or improving or stability or stable))
S27 S25 OR S26 [Annotation: Final line 2017]
S28 EM 20171001‐
S29 S27 AND S28 [Annotation: Final line 2021]
APA PsycINFO OVID
12 October 2017 (7476 records)
5 July 2021 (3286 records)
1 autism spectrum disorders/
2 autis$.tw.
3 asperger$.tw.
4 pervasive development$ disorder$.tw.
5 (child$ adj3 pervasiv$).tw.
6 (PDD adj3 (specified or unspecified)).tw.
7 PDD‐NOS.tw.
8 or/1‐7
9 prognosis/
10 prognos$.tw.
11 disease course/
12 "severity (disorders)"/
13 (follow$ up$ or followup$).tw.
14 ((diagnos$ or temporal$) adj3 (change$ or stable or unstable or reliab$ or stabili#e$ or stability or instability or re‐evaluat$)).tw.
15 ((developmental or diagnos$) adj1 (outcome$ or trajector$)).tw.
16 (diagnos$ adj1 (baseline or base‐line or early or earlier or first or initial$ or original$ or previous$)).ab.
17 (outcome$ adj2 (change$ or improve$ or improving or sever$ or trajector$ or worse or worst or worsen$)).ab.
18 (symptom$ adj2 (change$ or improve$ or improving or reduc$ or sever$ or trajector$ or worse or worst or worsen$)).ab.
19 ((measure$ or score$ or rating$) adj2 (change$ or improve$ or improving or sever$ or worse or worst or worsen$)).ab.
20 predict$.ab.
21 or/9‐20
22 8 and 21
23 ((autis$ or asperger$ or pervasive) and (improve$ or improving or stability or stable)).ti.
24 22 or 23 [Annotation: Final line 2017]
25 limit 24 to up=20171001‐20210628
26 remove duplicates from 25 [Annotation: Final line 2021]
Conference Proceedings Citation Index‐Science (CPCI‐S) and Conference Proceedings Citation Index‐Social Sciences & Humanities (CPCI‐SSH) (searched via Web of Science Clarivate)
12 October 2017 CPCI‐S (328 records) CPCI‐SSH (47 records)
6 July 2021 CPCI‐S (273 records) CPCI‐SSH (4 records)
#17 #12 OR #11
Indexes=CPCI‐SSH Timespan=2017‐2021 [Annotation: Final line 2021]
# 16 #12 OR #11
Indexes=CPCI‐S Timespan=2017‐2021 [Annotation: Final line 2021]
#15 #12 OR #11
Indexes=CPCI‐SSH Timespan=All years [Annotation: Final line 2017]
# 14 #12 OR #11
Indexes=CPCI‐S Timespan=All years [Annotation: Final line 2017]
#12 TI=((autis* or asperger* or pervasive) and (improve* or improving or stability or stable))
Indexes=CPCI‐S, CPCI‐SSH Timespan=All years
#11 #10 AND #1
Indexes=CPCI‐S, CPCI‐SSH Timespan=All years
#10 #9 OR #8 OR #7 OR #6 OR #5 OR #4 OR #3 OR #2
Indexes=CPCI‐S, CPCI‐SSH Timespan=All years
#9 TS=((measure* or score* or rating*) Near/1 (change* or improve* or improving or severe* or severity or worse or worst or worsen*))
Indexes=CPCI‐S, CPCI‐SSH Timespan=All years
#8 TS=(symptom* Near/1 (change* or improve* or improving or severe* or severity or reduc* or trajector* or worse or worst or worsen*))
Indexes=CPCI‐S, CPCI‐SSH Timespan=All years
#7 TS=(outcome* Near/1 (change* or improve* or improving or severe* or severity or trajector* or worse or worst or worsen*))
Indexes=CPCI‐S, CPCI‐SSH Timespan=All years
#6 TS=(diagnos* Near/1 (final or second or later or subsequent*))
Indexes=CPCI‐S, CPCI‐SSH Timespan=All years
#5 TS=(diagnos* Near/1 (baseline or base‐line or early or earlier or first or initial* or original* or previous*)
Indexes=CPCI‐S, CPCI‐SSH Timespan=All years
#4 TS=((diagnos* or temporal*) Near/3 (change* or stable or unstable or reliab* or stabili*e* or stability or instability or re‐evaluat*) )
Indexes=CPCI‐S, CPCI‐SSHTimespan=All years
#3 TS=((developmental or diagnos*) Near/1 (outcome* or trajector*)
Indexes=CPCI‐S, CPCI‐SSH Timespan=All years
#2 TS=(prognosis* or followup or "follow‐up" or "follow* up" or predict*)
Indexes=CPCI‐S, CPCI‐SSH Timespan=All years
#1 TS=( autis* or asperger* or PDD OR "PDD‐NOS" OR PERVASIVE NEAR/1 (DISORDER* OR CHILD*) ))
Indexes=CPCI‐S, CPCI‐SSH Timespan=All years
Cochrane Database of Systematic Reviews (in the Cochrane Library)
12 October 2017 (4 records)
6 July 2021 (3 records)
#1 MeSH descriptor: [Child Development Disorders, Pervasive] explode all trees
#2 (autis* or asperger*):ti
#3 (PDD N3 (specified or unspecified)):ti or "pervasive development* disorder*":ti or PDD next NOS:ti
#4 {or #1‐#3}
#5 (prognos* or diagnos* or predict*):ti
#6 #4 and #5, in Cochrane Reviews, Cochrane Protocols
#7 #4 and #5 with Cochrane Library publication date Between Oct 2017 and Jul 2021, in Cochrane Reviews, Cochrane Protocols
Database of Reviews of Abstracts of Effectiveness (DARE) in the Cochrane Library
12 October 2017 (2 records)
#1 MeSH descriptor: [Child Development Disorders, Pervasive] explode all trees
#2 (autis* or asperger*):ti
#3 (PDD N3(specified or unspecified)) or "pervasive development* disorder*" or PDD next NOS:ti
#4 {or #1‐#3}
#5 (prognos* or diagnos* or predict*):ti
#6 #4 and #5
Epistemonikos (www.epistemonikos.org)
12 October 2017 (21 records)
6 July 2021. Limited to records added between 1 October 2017 and 6 July 2021 (4 records)
title:((autis* OR asperger* OR PDD* OR "pervasive disorder" OR "pervasive development") AND ( predict* OR prognos* OR stabil* OR stable OR trajectory )) OR (title:((autis* OR asperger* OR PDD* OR "pervasive disorder" OR "pervasive development") AND ("diagnostic stability" OR "stable diagnosis")) OR abstract:((autis* OR asperger* OR PDD* OR "pervasive disorder" OR "pervasive development") AND ("diagnostic stability" OR "stable diagnosis")))
Systematic review filter applied.
SciELO (Scientific Electronic Library Online)
17 November 2021 (493 records)
(autis* or pervasiv* or asperger*) AND (prognos* or diagnos* or predict*)
NIHR (National Institute for Health Research)
17 November 2021 (30 records)
autis*; pervasive; asperger*
Clarivate Web of Science forward citations search
17 November 2021 (990 records)
We completed forward citation searches for all included studies.
Appendix 2. Data collection spreadsheet
| Column heading | Definition |
|---|---|
| Study number | ‐ |
| Author | First author (surname and first initial) |
| Country of publication | ‐ |
| Year of publication | ‐ |
| Description of study | Study description, prospective cohort, retrospective cohort, assessment of outcome, controlled, with/without intervention, aim of the study |
| Study population/group | Clinic versus population versus clinical drawn from a broad population base |
| Sampling frame | Description of where sample was collected from |
| Study sample | Description of baseline study sample |
| Inclusion/exclusion criteria | Participants that were eligible for study are described |
| Adequacy of participation | Adequacy of participation in the study by all who were eligible |
| Size of population/group | Number (N) at baseline, denominator for proportion analyses; proportion (%) male |
| Diagnostic criteria | DSM; ICD; or Kanner and edition number |
| Diagnostic tool/measure at baseline and follow‐up | ADI‐R; ADOS; CARS; GARS; 3di; or DISCO |
| Consistency of tool | Same diagnostic tool for all; same method and setting of outcome for all participants; whether valid reliable tool; completeness of outcome measure |
| Timing of diagnosis | Prior to study, at baseline, etc. |
| Multidisciplinary assessment | Diagnosis was completed by two or more professionals |
| Diagnosis | AD; ASD; AD + PDD‐NOS; as defined by diagnostic criteria |
| Age at baseline in years | ‐ |
| Age at follow‐up in years | ‐ |
| Period of follow‐up in years | Length of follow‐up for the study |
| Cognitive ability/IQ | Outcome; measure used |
| Language ability | Outcome; measure used |
| Adaptive behaviour ability | Outcome; measure used |
| Study approach and outcomes | When outcomes were measured |
| Numerator for primary outcome | Number diagnosed with ASD at follow‐up |
| Denominator for primary outcome | Number assessed for ASD at follow‐up |
| Proportion continuing to meet diagnostic criteria | Numerator divided by denominator |
| Autistic symptoms ‐ core | Outcome: social communication/repetitive, restricted behaviours, and interests; measure used |
| Autistic symptoms ‐ other | Outcome: what symptoms or measure used |
| Study attrition | Number of participants lost to follow‐up; participants that did not complete all parts of follow‐up or tools; reasons for loss to follow‐up; whether reasons have been linked to outcome |
| Interventions | Type and amount of interventions |
| Groups | Control group versus intervention group |
| Notes | ‐ |
| Footnotes AD: autistic disorder; ADI‐R: Autism Diagnostic Interview ‐ Revised; ADOS: Autism Diagnostic Observation Schedule;ASD: autism spectrum disorder; CARS: Childhood Autism Rating Scale; DISCO: Diagnostic Interview for Social and Communication Disorders; DSM: Diagnostic and Statistical Manual of Mental Disorders;GARS: Gilliam Autism Rating Scale;ICD: International Classification of Diseases;IQ: intelligence quotient; PDD‐NOS: pervasive developmental disorder‐not otherwise specified; 3di: developmental, dimensional and diagnostic interview. | |
Appendix 3. Description of risk of bias criteria and the criteria for assigning judgements
| 1. Study participation: the study sample adequately represents population of interest | ||||
|---|---|---|---|---|
| Criteria | Unclear | High | Moderate | Low |
| Sample (described) | ‐ | Clinical (not community based) | Clinical but drawn from broad community base | Population based |
| Description of sampling frame | ‐ | Not described | Some description but not adequate or complete | Well described |
| Description of baseline study sample | ‐ | Not described | Some description but not adequate or complete | Well described |
| Description of inclusion or exclusion criteria | ‐ | Not described | Some description but not adequate or complete | Well described |
| Adequacy of participation in study by all eligible | ‐ | No | ‐ | Yes |
| 2. Study attrition: the study data available (those not lost to follow‐up) adequately represent the study sample | ||||
| Criteria | Unclear | High | Moderate | Low |
| Recruitment | ‐ | Retrospective | Retrospective with whole cohort considered | Prospective |
| LFU (%) | ‐ | < 80% remain | ≥ 80% remain | ≥ 85% remain |
| Description of attempts to collect information on those LFU | ‐ | No | Some information provided but not adequate | Yes |
| Reasons for LFU provided? | ‐ | No | Some information provided but not adequate | Yes |
| Reasons for LFU linked to outcome? | ‐ | No | Some information provided but not adequate | Yes |
| Adequate description of LFU participants? | ‐ | No | Some information provided but not adequate | Yes |
| Analysis: important differences between LFU and non‐LFU in study? | ‐ | Important differences | ‐ | No important differences |
| 3. Outcome measurement: the outcomes of interest are measured in a similar way for all participants | ||||
| Criteria | Unclear | High | Moderate | Low |
| Blinding | ‐ | Not blinded | Blinding inadequate | Blinding adequate |
| Clear definition of outcome provided? | ‐ | No | ‐ | Yes |
| Same outcome tool for all? | ‐ | Not same tool for all | ‐ | Same for all |
| Valid and reliable tool? | ‐ | Not valid, reliable tool used | Valid or reliable tool, but parent rating | Standardised, reliable, valid tool used |
| Method and setting of outcome measurement same for all participants? | ‐ | No | ‐ | Yes |
| Completeness of outcome measure | ‐ | Not all tools completed (> 90% missing) | Not all tools completed but not > 90% missing | All tools completed |
| Footnotes LFU: Loss to follow‐up. | ||||
Appendix 4. GRADE assessment for judging the overall quality of the evidence for prognosis
In grading the quality of the evidence we considered observational studies starting as high quality.
| Domain | Description | |
|---|---|---|
| Rate down if: | Risk of bias | The overall quality is driven by the study with lowest quality (if only low risk of bias studies are use, then the quality is rated as high ; individual studies are rated down one or two levels for serious or critical risk of bias. |
| Inconsistency | Unexplained heterogeneity or variability in results (point estimates) across studies with differences in estimates exceeding decisional thresholds. Large I2 value (significant heterogeneity) and visual inspection of the forest plot (effect sizes on either side of the lines of no effect and with confidence intervals showing little to no overlap) usually prompt concerns around heterogeneity | |
| Indirectness | The study sample or the outcomes in the study, or both, do not accurately reflect the population of interest or the measured outcome does not capture what is believed to be important | |
| Imprecision | This is based primarily the position of the confidence interval relative to a clinical decision threshold | |
| Publication bias | Forrest plot or statistical testing suggesting that small negative studies are underrepresented | |
| Rate up if: | Large effect | Moderate or large effect reported by most studies or in pooled findings in the meta‐analysis |
| Dose‐response gradient | Gradient exists between studies for factors measured at different doses or an increase or decrease in events over time, which follows a well‐defined pattern (e.g. linear) | |
| Footnotes Table modified from Guyatt 2011, Hayden 2014 and Iorio 2015. | ||
Appendix 5. Levels of quality
| Quality level | Definition |
|---|---|
| High | We are very confident that the true prognosis (probability of future events) lies close to that of the estimate |
| Moderate | We are moderately confident that the true prognosis (probability of future events) is likely to be close to the estimate, but there is a possibility that it is substantially different |
| Low | Our confidence in the estimate is limited: the true prognosis (probability of future events) may be substantially different from the estimate |
| Very low | We have very little confidence in the estimate: the true prognosis (probability of future events) is likely to be substantially different from the estimate |
| Footnotes This table has been reproduced from Iorio 2015, with permission from the first author. | |
Appendix 6. Methods for future updates and unused methods
Unit of analysis issues
In future updates of this review, we may be required to complete some data manipulation if continuous scores rather than dichotomised categories are presented for diagnostic groups.
Dealing with missing data
In future reviews, if indicated, we will assess the sensitivity of any primary analyses to missing data using the strategy described in the Cochrane Handbook for Systematic Reviews of Interventions (Deeks 2022). That is, we will perform sensitivity analyses to assess how sensitive the results are by excluding studies if they present data requiring transformations with uncertain assumptions or where they contain a large amount of missing data. We were unable to complete this analysis for primary analyses as the only data we analysed were where all cases were followed up. Therefore, there were no missing data in primary analyses.
Assessment of reporting biases
The very small number of studies that were rated at low risk of bias precluded sensitivity analyses for this review. If future updates have more studies with low risk of bias ratings we will conduct sensitivity analyses to assess the impact of risk bias on outcome.
Data synthesis
If, in future updates of the review included studies are found to be more homogenous than expected, we will analyse the data using a fixed‐effect model.
Prognostic factor analyses
We planned to complete analyses of prognostic factors on studies that used the same or different versions or editions of the diagnostic tool at baseline and follow‐up, or on autism spectrum disorder subgroups (i.e. autistic disorder versus pervasive developmental disorder ‐ not otherwise specified). However, due to the small number of studies that had presented data for these areas we were not able to complete these analyses. We may be able to complete this analysis in future updates.
Sensitivity analysis
In future updates of this review, if there are additional studies with low risk of bias ratings, we will use sensitivity analyses to assess the impact of our decisions made during the review (e.g. inclusion of studies in the review and risk of bias of studies, taking into account recruitment, blinding and outcome measurement factors). This will be achieved by repeating the analyses using an alternative method or assumption, in order to explore the influence of our risk of bias assessments; for example, by the exclusion of lower‐quality studies (those at high or unclear risk of bias due to study participation, participant attrition or outcome measurement).
Appendix 7. Forest plots
a) Forest plot of diagnostic stability by age at baseline

Age at baseline: < 2 years; 2 to 3 years; 4 to 6 years; 7 to 12; years; 13 to 17 years
Footnote
CI: confidence interval; ES: effect size; N: number in sample
There was no significant association between the proportion of children who continued to meet diagnostic criteria for autism spectrum disorder at follow‐up and age at baseline.
b) Forest plot of diagnostic stability by age at follow‐up

Age at follow up: 2 to 3 years; 4 to 6 years; 7 to 12 years; 13 to 18 years
Footnote
CI: confidence interval; ES: effect size; N: number in sample
There was no significant association between the proportion of children who continued to meet diagnostic criteria for autism spectrum disorder at follow‐up and age at follow‐up.
c) Forest plot of diagnostic stability by duration of follow‐up

Duration of follow‐up: short‐term (up to 2 years), medium‐term (2 to 5 years), and long‐term (6 to 17 years) follow‐up
Footnote
CI: confidence interval; ES: effect size; N: number in sample
There was no significant association between the proportion of children who continued to meet diagnostic criteria for autism spectrum disorder at follow‐up and duration of follow‐up.
d) Forest plot of diagnostic stability by decade of publication

Decade of publication: 1960 to 1969; 1970 to 1979; 1980 to 1989; 1990 to 1999; 2000 to 2009; 2010 to 2019
Footnote
CI: confidence interval; ES: effect size; N: number in sample
There was no significant association between the proportion of children who continued to meet diagnostic criteria for autism spectrum disorder at follow‐up and decade of publication.
e) Forest plot of diagnostic stability by mean intelligence quotient

Intelligence: mean IQ 70; mean IQ > 70; or more than 70% of the cohort has IQ 70
Footnote
CI: confidence interval; ES: effect size; IQ: intelligence quotient; N: number in sample
There was no significant association between the proportion of children who continued to meet diagnostic criteria for autism spectrum disorder at follow‐up and mean intelligence quotient.
f) Forest plot of diagnostic stability by language ability

Language: > 70% verbal; > 70% non‐verbal (i.e. use < 15 words); mean standardised language score < 70; mean standardised language score 70; or > 70% of the cohort has mean language score < 70
Footnote
CI: confidence interval; ES: effect size; N: number in sample
There was no significant association between the proportion of children continued to meet diagnostic criteria for autism spectrum disorder at follow‐up and language ability.
g) Forest plot of diagnostic stability by adaptive behaviour

Adaptive behaviour: mean standard score 70; mean standard score > 70; or > 70% of the cohort has mean standard score 70
Footnote
CI: confidence interval; ES: effect size; N: number in sample
There was no significant association between the proportion of children who continued to meet diagnostic criteria for autism spectrum disorder at follow‐up and adaptive behaviour ability.
h) Forest plot of diagnostic stability by multidisciplinary diagnosis

Multidisciplinary team used for diagnosis, Yes or No
Footnote
CI: confidence interval; ES: effect size; N: number in sample
There was no significant association between the proportion of children who continued to meet diagnostic criteria for autism spectrum disorder at follow‐up and whether the diagnosis involved a multidiciplinary team or not.
Appendix 8. Key characteristics of included studies
| Variable | Not included in meta‐analysis (n = 8) | Included in meta‐analysis (n = 34) | |||
|---|---|---|---|---|---|
| n | % | n | % | ||
| Year published | Older (< 2013) | 3 | 38 | 18 | 53 |
| Recent (2013‐2021) | 5 | 62 | 16 | 47 | |
| Tools used to diagnose autism spectrum disorder | One tool | 8 | 100 | 21 | 62 |
| Two tools | 0 | 0 | 10 | 29 | |
| Three tools + | 0 | 0 | 3 | 9 | |
| Multidisciplinary approach | 0a | 0 | 13b | 45 | |
| Autism subgroup | Autism spectrum disorder | 6 | 100 | 32 | 94 |
| Autistic disorder | 0 | 0 | 2 | 6 | |
| Childhood autism | 0 | 0 | 0 | ||
| IQ | < 70 | 4c | 80 | 15d | 58 |
| > 70 | 0 | 0 | 9 | 35 | |
| Mixed | 1 | 20 | 2 | 7 | |
| Male | 433 | 80 | 9139 | 82 | |
| Sample size mean (range) | 67 (13‐272) | 329e (11‐8564) | |||
| Age at baseline in years mean (range) | 3.81 (2.5‐4.9) | 3.04 (1.13‐5) | |||
| Length of follow‐up in years mean (range) | 4.24 (1‐7.36) | 2.53 (1‐8.3) | |||
| Risk of bias (rated low) | Sample (clinical, clinical from broad base, population) | 0 | 0 | 4 | 12 |
| Description of sampling frame | 2 | 25 | 9 | 26 | |
| Description of baseline study sample | 4 | 50 | 15 | 44 | |
| Description of inclusion or exclusion criteria | 3 | 38 | 14 | 41 | |
| Adequacy of participation in study by all eligible | 3 | 38 | 15 | 44 | |
| Recruitment (prospective) | 7 | 88 | 22 | 65 | |
| Loss to follow‐up (LFU; low= >85% retained) | 5 | 63 | 13 | 38 | |
| Description of attempts to collect info on those LFU | 0 | 0 | 3 | 9 | |
| Reasons for LFU provided | 0 | 0 | 3 | 9 | |
| Reasons for LFU linked to outcome | 1 | 13 | 1 | 3 | |
| Description of LFU participants | 0 | 0 | 1 | 3 | |
| Analysis: important differences LFU vs non‐LFU in study | 2 | 25 | 6 | 18 | |
| Blinding | 1 | 13 | 5 | 15 | |
| Clear definition of diagnosis | 6 | 75 | 33 | 97 | |
| Same diagnosis outcome tool for all | 8 | 100 | 34 | 100 | |
| Valid and reliable tool | 8 | 100 | 34 | 100 | |
| Method and setting of outcome measurements same for all participants | 4 | 50 | 21 | 62 | |
| Completeness of outcome measure | 7 | 88 | 33 | 97 | |
| IQ: intelligence quotient; n: number. | |||||
| Footnotes LFU: Loss to follow‐up. an = 3 | |||||
Appendix 9. Justifications for risk of bias assessments across 18 criteria
| Study ID: Baghdadli 2012 | ||
|---|---|---|
| Domain | Risk of bias level | Support for judgement |
| Sample (described) | High | Clinical sample |
| Description of sampling frame | Moderate | Some description |
| Description of baseline study sample | Low | Well described |
| Description of inclusion or exclusion criteria | Low | Well described |
| Adequacy of participation in study by all eligible | High | Participation in study by all eligible not adequate |
| Recruitment | Low | Prospective |
| Loss to follow‐up (LFU) | High | 51% of sample lost to follow‐up |
| Description of attempts to collect information on those LFU | Moderate | Some information provided but inadequate |
| Reasons for LFU provided | Low | Yes |
| Reasons for LFU linked to outcome | Moderate | Some information provided but inadequate |
| Description of LFU participants | High | Not described |
| Analysis: important differences LFU vs non‐LFU in study | Low | No |
| Blinding | Moderate | Inadequately blinded |
| Clear definition of diagnosis provided at follow‐up | Low | Yes |
| Same diagnosis outcome tool for all | Low | Yes |
| Valid and reliable tool | Low | Standardised, reliable valid tool used |
| Method and setting of outcome measurements same for all participants | High | No |
| Completeness of outcome measure | Low | Diagnostic tools completed by all study participants |
| Study ID: Benedettto 2021 | ||
|---|---|---|
| Domain | Risk of bias level | Support for judgement |
| Sample (described) | Moderate | Clinical sample from a broad community base |
| Description of sampling frame | High | Not described |
| Description of baseline study sample | Moderate | Some description |
| Description of inclusion or exclusion criteria | Low | Well described |
| Adequacy of participation in study by all eligible | Low | Adequate participation by all eligible |
| Recruitment | Low | Prospective |
| Loss to follow‐up (LFU) | Low | 13% of sample lost to follow‐up |
| Description of attempts to collect information on those LFU | High | Not described |
| Reasons for LFU provided | High | No |
| Reasons for LFU linked to outcome | High | No |
| Description of LFU participants | High | Not described |
| Analysis: important differences LFU vs non‐LFU in study | Unclear | Not described |
| Blinding | High | Not blinded |
| Clear definition of diagnosis provided at follow‐up | Low | Yes |
| Same diagnosis outcome tool for all | Low | Yes |
| Valid and reliable tool | Low | Standardised, reliable valid tool used |
| Method and setting of outcome measurements same for all participants | Low | Yes |
| Completeness of outcome measure | Low | Diagnostic tools completed by all study participants |
| Study ID: Bopp 2006 | ||
|---|---|---|
| Domain | Risk of bias level | Support for judgement |
| Sample (described) | High | Clinical sample |
| Description of sampling frame | Low | Well described |
| Description of baseline study sample | Low | Well described |
| Description of inclusion or exclusion criteria | High | Not described |
| Adequacy of participation in study by all eligible | Low | Adequate participation by all eligible |
| Recruitment | Low | Prospective |
| Loss to follow‐up (LFU) | Low | None of sample lost to follow‐up |
| Description of attempts to collect info on those LFU | Not applicable as no LFU | |
| Reasons for LFU provided | Not applicable as no LFU | |
| Reasons for LFU linked to outcome | Not applicable as no LFU | |
| Description of LFU participants | Not applicable as no LFU | |
| Analysis: important differences LFU vs non‐LFU in study | Not applicable as no LFU | |
| Blinding | Unclear | Not described |
| Clear definition of diagnosis provided at follow‐up | Low | Yes |
| Same diagnosis outcome tool for all | Low | Yes |
| Valid and reliable tool | Low | Standardised, reliable valid tool used |
| Method and setting of outcome measurements same for all participants | High | No |
| Completeness of outcome measure | Low | Diagnostic tools completed by all study participants |
| Study ID: Brian 2016 | ||
|---|---|---|
| Domain | Risk of bias level | Support for judgement |
| Sample (described) | High | Clinical sample |
| Description of sampling frame | Low | Well described |
| Description of baseline study sample | Moderate | Some description |
| Description of inclusion or exclusion criteria | High | Not described |
| Adequacy of participation in study by all eligible | High | Not described |
| Recruitment | Low | Prospective |
| Loss to follow‐up (LFU) | High | 29% of sample lost to follow‐up |
| Description of attempts to collect information on those LFU | High | Not described |
| Reasons for LFU provided | High | No |
| Reasons for LFU linked to outcome | High | No |
| Description of LFU participants | High | Not described |
| Analysis: important differences LFU vs non‐LFU in study | Low | No |
| Blinding | High | Not blinded |
| Clear definition of diagnosis provided at follow‐up | Low | Yes |
| Same diagnosis outcome tool for all | Low | Yes |
| Valid and reliable tool | Low | Standardised, reliable valid tool used |
| Method and setting of outcome measurements same for all participants | Low | Yes |
| Completeness of outcome measure | Low | Diagnostic tools completed by all study participants |
| Study ID: Chu 2017 | ||
|---|---|---|
| Domain | Risk of bias level | Support for judgement |
| Sample (described) | High | Clinical sample |
| Description of sampling frame | Low | Well described |
| Description of baseline study sample | Low | Well described |
| Description of inclusion or exclusion criteria | Low | Well described |
| Adequacy of participation in study by all eligible | High | Participation in study by all eligible not adequate |
| Recruitment | Low | Prospective |
| Loss to follow‐up (LFU) | Low | 13% of sample lost to follow‐up |
| Description of attempts to collect info on those LFU | High | Not described |
| Reasons for LFU provided | High | Not described |
| Reasons for LFU linked to outcome | High | Not described |
| Description of LFU participants | High | Not described |
| Analysis: important differences LFU vs non‐LFU in study | Unclear | Not described |
| Blinding | High | Not blinded |
| Clear definition of diagnosis provided at follow‐up | Low | Yes |
| Same diagnosis outcome tool for all | Low | Yes |
| Valid and reliable tool | Low | Standardised, reliable valid tool used |
| Method and setting of outcome measurements same for all participants | Low | Yes |
| Completeness of outcome measure | Low | Diagnostic tools completed by all study participants |
| Study ID: Demb 1989 | ||
|---|---|---|
| Domain | Risk of bias level | Support for judgement |
| Sample (described) | Moderate | Clinical sample from a broad community base |
| Description of sampling frame | Moderate | Some description |
| Description of baseline study sample | High | Not described |
| Description of inclusion or exclusion criteria | High | Not described |
| Adequacy of participation in study by all eligible | High | Participation in study by all eligible not adequate |
| Recruitment | Low | Prospective |
| Loss to follow‐up (LFU) | High | 33.3% of sample lost to follow‐up |
| Description of attempts to collect information on those LFU | Moderate | Some information but information inadequate |
| Reasons for LFU provided | Moderate | Some information but information inadequate |
| Reasons for LFU linked to outcome | High | No |
| Description of LFU participants | High | No |
| Analysis: important differences LFU vs non‐LFU in study | Unclear | Not described |
| Blinding | High | Not blinded |
| Clear definition of diagnosis provided at follow‐up | Low | Yes |
| Same diagnosis outcome tool for all | Low | Yes |
| Valid and reliable tool | Low | Standardised, reliable valid tool used |
| Method and setting of outcome measurements same for all participants | High | No, 11 were done in person and one via phone |
| Completeness of outcome measure | Low | Diagnostic tools completed by all study participants |
| Study ID: DeWaay 2012 | ||
|---|---|---|
| Domain | Risk of bias level | Support for judgement |
| Sample (described) | High | Clinical sample |
| Description of sampling frame | Moderate | Some description |
| Description of baseline study sample | Moderate | Some description |
| Description of inclusion or exclusion criteria | Moderate | Some description |
| Adequacy of participation in study by all eligible | Low | Adequate participation by all eligible |
| Recruitment | Low | Prospective |
| Loss to follow‐up (LFU) | Low | None of sample lost to follow‐up but participants selected retrospectively from a prospective cohort |
| Description of attempts to collect info on those LFU | Unclear | Not described |
| Reasons for LFU provided | Unclear | Not described |
| Reasons for LFU linked to outcome | Unclear | Not described |
| Description of LFU participants | Unclear | Not described |
| Analysis: important differences LFU vs non‐LFU in study | Unclear | Not described |
| Blinding | High | Not blinded |
| Clear definition of diagnosis provided at follow‐up | High | No |
| Same diagnosis outcome tool for all | Low | Yes |
| Valid and reliable tool | Low | Standardised, reliable valid tool used |
| Method and setting of outcome measurements same for all participants | High | No |
| Completeness of outcome measure | Low | Diagnostic tools completed by all study participants |
| Study ID: Eaves 2004 | ||
|---|---|---|
| Domain | Risk of bias level | Support for judgement |
| Sample (described) | Low | Population‐based sample |
| Description of sampling frame | Low | Well described |
| Description of baseline study sample | Low | Well described |
| Description of inclusion or exclusion criteria | Moderate | Some description |
| Adequacy of participation in study by all eligible | Low | Adequate participation by all eligible |
| Recruitment | Low | Prospective |
| Loss to follow‐up (LFU) | Low | None of sample lost to follow‐up |
| Description of attempts to collect information on those LFU | Not applicable as no LFU | |
| Reasons for LFU provided | Not applicable as no LFU | |
| Reasons for LFU linked to outcome | Not applicable as no LFU | |
| Description of LFU participants | Not applicable as no LFU | |
| Analysis: important differences LFU vs non‐LFU in study | Not applicable as no LFU | |
| Blinding | Unclear | Not discussed |
| Clear definition of diagnosis provided at follow‐up | Low | Yes |
| Same diagnosis outcome tool for all | Low | Yes |
| Valid and reliable tool | Low | Standardised, reliable valid tool used |
| Method and setting of outcome measurements same for all participants | Low | Yes |
| Completeness of outcome measure | Low | Diagnostic tools completed by all study participants |
| Study ID: Elmose 2014 | ||
|---|---|---|
| Domain | Risk of bias level | Support for judgement |
| Sample (described) | High | Clinical sample |
| Description of sampling frame | Moderate | Some description |
| Description of baseline study sample | Moderate | Some description |
| Description of inclusion or exclusion criteria | High | Not described |
| Adequacy of participation in study by all eligible | Low | Adequate participation by all eligible |
| Recruitment | Moderate | Retrospective, with the whole cohort considered |
| Loss to follow‐up (LFU) | Not applicable as the study is retrospective | |
| Description of attempts to collect information on those LFU | Low | Yes |
| Reasons for LFU provided | Moderate | Some information but information is inadequate |
| Reasons for LFU linked to outcome | High | Not described |
| Description of LFU participants | High | Not described |
| Analysis: important differences LFU vs non‐LFU in study | High | Not described |
| Blinding | Low | Blinding adequate |
| Clear definition of diagnosis provided at follow‐up | Low | Yes |
| Same diagnosis outcome tool for all | Low | Yes |
| Valid and reliable tool | Low | Standardised, reliable valid tool used |
| Method and setting of outcome measurements same for all participants | Low | Yes |
| Completeness of outcome measure | Low | Diagnostic tools completed by all study participants |
| Study ID: Flanagan 2011 | ||
|---|---|---|
| Domain | Risk of bias level | Support for judgement |
| Sample (described) | High | Clinical sample |
| Description of sampling frame | Moderate | Some description |
| Description of baseline study sample | Moderate | Some description |
| Description of inclusion or exclusion criteria | Low | Well described |
| Adequacy of participation in study by all eligible | High | Participation in study by all eligible not adequate |
| Recruitment | High | Retrospective |
| Loss to follow‐up (LFU) | Not applicable as the study is retrospective | |
| Description of attempts to collect information on those LFU | Not applicable as the study is retrospective | |
| Reasons for LFU provided | Not applicable as the study is retrospective | |
| Reasons for LFU linked to outcome | Not applicable as the study is retrospective | |
| Description of LFU participants | Not applicable as the study is retrospective | |
| Analysis: important differences LFU vs non‐LFU in study | Not applicable as the study is retrospective | |
| Blinding | High | Not blinded |
| Clear definition of diagnosis provided at follow‐up | Low | Yes |
| Same diagnosis outcome tool for all | Low | Yes |
| Valid and reliable tool | Low | Standardised, reliable valid tool used |
| Method and setting of outcome measurements same for all participants | Low | Yes |
| Completeness of outcome measure | Low | Diagnostic tools completed by all study participants |
| Study ID: Freeman 2004 | ||
|---|---|---|
| Domain | Risk of bias level | Support for judgement |
| Sample (described) | High | Clinical sample |
| Description of sampling frame | Low | Well described |
| Description of baseline study sample | Moderate | Some description |
| Description of inclusion or exclusion criteria | High | Not described |
| Adequacy of participation in study by all eligible | Low | Adequate participation by all eligible |
| Recruitment | High | Retrospective |
| Loss to follow‐up (LFU) | Not applicable as the study is retrospective | |
| Description of attempts to collect information on those LFU | Not applicable as the study is retrospective | |
| Reasons for LFU provided | Not applicable as the study is retrospective | |
| Reasons for LFU linked to outcome | Not applicable as the study is retrospective | |
| Description of LFU participants | Not applicable as the study is retrospective | |
| Analysis: important differences LFU vs non‐LFU in study | Not applicable as the study is retrospective | |
| Blinding | Moderate | Blinding inadequate |
| Clear definition of diagnosis provided at follow‐up | Low | Yes |
| Same diagnosis outcome tool for all | Low | Yes |
| Valid and reliable tool | Low | Standardised, reliable valid tool used |
| Method and setting of outcome measurements same for all participants | Unclear | Not described |
| Completeness of outcome measure | Low | Diagnostic tools completed by all study participants |
| Study ID: Gillberg 1990 | ||
|---|---|---|
| Domain | Risk of bias level | Support for judgement |
| Sample (described) | High | Clinical sample |
| Description of sampling frame | Moderate | Some description |
| Description of baseline study sample | Moderate | Some description |
| Description of inclusion or exclusion criteria | High | Not described |
| Adequacy of participation in study by all eligible | Low | Adequate participation by all eligible |
| Recruitment | Low | Prospective |
| Loss to follow‐up (LFU) | Low | None of sample lost to follow‐up |
| Description of attempts to collect information on those LFU | Not applicable as no LFU | |
| Reasons for LFU provided | Not applicable as no LFU | |
| Reasons for LFU linked to outcome | Not applicable as no LFU | |
| Description of LFU participants | Not applicable as no LFU | |
| Analysis: important differences LFU vs non‐LFU in study | Not applicable as no LFU | |
| Blinding | High | Not |
| Clear definition of diagnosis provided at follow‐up | Low | Yes |
| Same diagnosis outcome tool for all | Low | Yes |
| Valid and reliable tool | Moderate | Valid or reliable but parent‐rated tool |
| Method and setting of outcome measurements same for all participants | Low | Yes |
| Completeness of outcome measure | Low | Diagnostic tools completed by all study participants |
| Study ID: Giserman‐Kiss | ||
|---|---|---|
| Domain | Risk of bias level | Support for judgement |
| Sample (described) | High | Clinical sample |
| Description of sampling frame | Low | Well described |
| Description of baseline study sample | Low | Well described |
| Description of inclusion or exclusion criteria | Moderate | Some description |
| Adequacy of participation in study by all eligible | Low | Adequate participation in study by all eligible |
| Recruitment | Low | Prospective |
| Loss to follow‐up (LFU) | Low | None of sample lost to follow‐up |
| Description of attempts to collect information on those LFU | Not applicable as no LFU | Not described |
| Reasons for LFU provided | Not applicable as no LFU | Not described |
| Reasons for LFU linked to outcome | Not applicable as no LFU | Not described |
| Description of LFU participants | Not applicable as no LFU | Not described |
| Analysis: important differences LFU vs non‐LFU in study | Not applicable as no LFU | Not described |
| Blinding | Unclear | Not described |
| Clear definition of diagnosis provided at follow‐up | Low | Yes |
| Same diagnosis outcome tool for all | Low | Yes |
| Valid and reliable tool | Low | Standardised, reliable valid tool used |
| Method and setting of outcome measurements same for all participants | Unclear | Not described |
| Completeness of outcome measure | Low | Diagnostic tools completed by all study participants |
| Study ID: Gonzalez 1993 | ||
|---|---|---|
| Domain | Risk of bias level | Support for judgement |
| Sample (described) | Low | Population‐based sample |
| Description of sampling frame | Low | Well described |
| Description of baseline study sample | Low | Well described |
| Description of inclusion or exclusion criteria | High | Not described |
| Adequacy of participation in study by all eligible | High | Participation in study by all eligible not adequate |
| Recruitment | Moderate | Retrospective with the whole cohort considered |
| Loss to follow‐up (LFU) | Not applicable as the study is retrospective | |
| Description of attempts to collect information on those LFU | Not applicable as the study is retrospective | |
| Reasons for LFU provided | Not applicable as the study is retrospective | |
| Reasons for LFU linked to outcome | Not applicable as the study is retrospective | |
| Description of LFU participants | Not applicable as the study is retrospective | |
| Analysis: important differences LFU vs non‐LFU in study | Not applicable as the study is retrospective | |
| Blinding | High | Not blinded |
| Clear definition of diagnosis provided at follow‐up | Low | Yes |
| Same diagnosis outcome tool for all | Low | Yes |
| Valid and reliable tool | Low | Standardised, reliable valid tool used |
| Method and setting of outcome measurements same for all participants | Low | Yes |
| Completeness of outcome measure | Low | Diagnostic tools completed by all study participants |
| Study ID: Haglund 2020 | ||
|---|---|---|
| Domain | Risk of bias level | Support for judgement |
| Sample (described) | Moderate | Clinical sample from a broad community base |
| Description of sampling frame | Moderate | Some description |
| Description of baseline study sample | Low | Well described |
| Description of inclusion or exclusion criteria | Moderate | Some description |
| Adequacy of participation in study by all eligible | High | Participation in study by all eligible not adequate |
| Recruitment | Low | Prospective |
| Loss to follow‐up (LFU) | High | 2% of sample lost to follow‐up |
| Description of attempts to collect information on those LFU | High | Not described |
| Reasons for LFU provided | High | No |
| Reasons for LFU linked to outcome | High | No |
| Description of LFU participants | High | Not described |
| Analysis: important differences LFU vs non‐LFU in study | Unclear | Not described |
| Blinding | Low | Blinding adequate |
| Clear definition of diagnosis provided at follow‐up | Low | Yes |
| Same diagnosis outcome tool for all | Low | Yes |
| Valid and reliable tool | Low | Standardised, reliable valid tool used |
| Method and setting of outcome measurements same for all participants | Low | Yes |
| Completeness of outcome measure | Low | Diagnostic tools completed by all study participants |
| Study ID: Hinnebusch 2017 | ||
|---|---|---|
| Domain | Risk of bias level | Support for judgement |
| Sample (described) | Low | Population‐based sample |
| Description of sampling frame | Low | Well described |
| Description of baseline study sample | Low | Well described |
| Description of inclusion or exclusion criteria | Low | Well described |
| Adequacy of participation in study by all eligible | High | Participation in study by all eligible not adequate |
| Recruitment | Low | Prospective |
| Loss to follow‐up (LFU) | High | 44% of sample lost to follow‐up |
| Description of attempts to collect information on those LFU | Low | Yes |
| Reasons for LFU provided | High | No |
| Reasons for LFU linked to outcome | Unclear | Not described |
| Description of LFU participants | Low | Yes |
| Analysis: important differences LFU vs non‐LFU in study | Low | Some differences but these would not impact outcome |
| Blinding | Unclear | Not described |
| Clear definition of diagnosis provided at follow‐up | Low | Yes |
| Same diagnosis outcome tool for all | Low | Yes |
| Valid and reliable tool | Low | Standardised, reliable valid tool used |
| Method and setting of outcome measurements same for all participants | Low | Yes |
| Completeness of outcome measure | High | More than 90% of diagnostic tools not completed |
| Study ID: Kim 2015 | ||
|---|---|---|
| Domain | Risk of bias level | Support for judgement |
| Sample (described) | High | Clinical sample |
| Description of sampling frame | Moderate | Some description |
| Description of baseline study sample | Low | Not described |
| Description of inclusion or exclusion criteria | Low | Not described |
| Adequacy of participation in study by all eligible | Low | Adequate participation by all eligible |
| Recruitment | Low | Prospective |
| Loss to follow‐up (LFU) | Low | None of sample lost to follow‐up |
| Description of attempts to collect information on those LFU | Not applicable as no LFU | |
| Reasons for LFU provided | Not applicable as no LFU | |
| Reasons for LFU linked to outcome | Not applicable as no LFU | |
| Description of LFU participants | Not applicable as no LFU | |
| Analysis: important differences LFU vs non‐LFU in study | Not applicable as no LFU | |
| Blinding | High | Not blinded |
| Clear definition of diagnosis provided at follow‐up | Low | Yes |
| Same diagnosis outcome tool for all | Low | Yes |
| Valid and reliable tool | Low | Standardised, reliable valid tool used |
| Method and setting of outcome measurements same for all participants | Low | Yes |
| Completeness of outcome measure | Low | Diagnostic tools completed by all study participants |
| Study ID: Klintwall 2015 | ||
|---|---|---|
| Domain | Risk of bias level | Support for judgement |
| Sample (described) | Unclear | Not described |
| Description of sampling frame | Moderate | Some description |
| Description of baseline study sample | High | Not described |
| Description of inclusion or exclusion criteria | Moderate | Some |
| Adequacy of participation in study by all eligible | High | Participation in study by all eligible not adequate |
| Recruitment | Low | Prospective |
| Loss to follow‐up (LFU) | Low | None of sample lost to follow‐up |
| Description of attempts to collect information on those LFU | Not applicable as no LFU | |
| Reasons for LFU provided | Not applicable as no LFU | |
| Reasons for LFU linked to outcome | Not applicable as no LFU | |
| Description of LFU participants | Not applicable as no LFU | |
| Analysis: important differences LFU vs non‐LFU in study | Not applicable as no LFU | |
| Blinding | High | Not blinded |
| Clear definition of diagnosis provided at follow‐up | Low | Yes |
| Same diagnosis outcome tool for all | Low | Yes |
| Valid and reliable tool | Low | Standardised, reliable valid tool used |
| Method and setting of outcome measurements same for all participants | Low | Yes |
| Completeness of outcome measure | Low | Diagnostic tools completed by all study participants |
| Study ID: Mahli 2011 | ||
|---|---|---|
| Domain | Risk of bias level | Support for judgement |
| Sample (described) | High | Clinical sample |
| Description of sampling frame | Moderate | Some description |
| Description of baseline study sample | Moderate | Some description |
| Description of inclusion or exclusion criteria | Low | Well described |
| Adequacy of participation in study by all eligible | Unclear | Not described |
| Recruitment | Low | Prospective |
| Loss to follow‐up (LFU) | High | 54.2% of sample lost to follow‐up |
| Description of attempts to collect information on those LFU | High | Not described |
| Reasons for LFU provided | High | No |
| Reasons for LFU linked to outcome | Unclear | Not described |
| Description of LFU participants | Moderate | Some information but inadequate |
| Analysis: important differences LFU vs non‐LFU in study | Low | Yes |
| Blinding | High | Not blinded |
| Clear definition of diagnosis provided at follow‐up | Low | Yes |
| Same diagnosis outcome tool for all | Low | Yes |
| Valid and reliable tool | Low | Standardised, reliable valid tool used |
| Method and setting of outcome measurements same for all participants | Low | Yes |
| Completeness of outcome measure | Low | Diagnostic tools completed by all study participants |
| Study ID: Moore 2003 | ||
|---|---|---|
| Domain | Risk of bias level | Support for judgement |
| Sample (described) | High | Clinical sample |
| Description of sampling frame | Moderate | Some description |
| Description of baseline study sample | Moderate | Some description |
| Description of inclusion or exclusion criteria | High | Not described |
| Adequacy of participation in study by all eligible | Unclear | Not described |
| Recruitment | Low | Prospective |
| Loss to follow‐up (LFU) | Low | % of sample lost to follow‐up |
| Description of attempts to collect information on those LFU | Not applicable as no LFU | |
| Reasons for LFU provided | Not applicable as no LFU | |
| Reasons for LFU linked to outcome | Not applicable as no LFU | |
| Description of LFU participants | Not applicable as no LFU | |
| Analysis: important differences LFU vs non‐LFU in study | Not applicable as no LFU | |
| Blinding | Low | Blinded |
| Clear definition of diagnosis provided at follow‐up | Low | Yes |
| Same diagnosis outcome tool for all | Low | Yes |
| Valid and reliable tool | Low | Standardised, reliable valid tool used |
| Method and setting of outcome measurements same for all participants | Low | Yes |
| Completeness of outcome measure | Low | Diagnostic tools completed by all study participants |
| Study ID: Moss 2008 | ||
|---|---|---|
| Domain | Risk of bias level | Support for judgement |
| Sample (described) | Moderate | Clinical sample from a broad community base |
| Description of sampling frame | Moderate | Some description |
| Description of baseline study sample | Low | Well described |
| Description of inclusion or exclusion criteria | Low | Well described |
| Adequacy of participation in study by all eligible | Low | Participation in study by all eligible was adequate |
| Recruitment | Low | Prospective |
| Loss to follow‐up (LFU) | Moderate | 20% of sample lost to follow‐up |
| Description of attempts to collect information on those LFU | Low | Well described |
| Reasons for LFU provided | Low | Yes |
| Reasons for LFU linked to outcome | Low | Yes |
| Description of LFU participants | High | Not described |
| Analysis: important differences LFU vs non‐LFU in study | Low | Yes |
| Blinding | Moderate | Blinding inadequate |
| Clear definition of diagnosis provided at follow‐up | Low | Yes |
| Same diagnosis outcome tool for all | Low | Yes |
| Valid and reliable tool | Low | Standardised, reliable valid tool used |
| Method and setting of outcome measurements same for all participants | Low | Yes |
| Completeness of outcome measure | Low | Diagnostic tools completed by all study participants |
| Study ID: Ozonoff 2015 | ||
|---|---|---|
| Domain | Risk of bias level | Support for judgement |
| Sample (described) | High | Clinical sample |
| Description of sampling frame | Moderate | Some description |
| Description of baseline study sample | Moderate | Some description |
| Description of inclusion or exclusion criteria | Low | Well described |
| Adequacy of participation in study by all eligible | Low | Participation in study by all eligible not adequate |
| Recruitment | Low | Prospective |
| Loss to follow‐up (LFU) | Low | None of sample lost to follow‐up |
| Description of attempts to collect information on those LFU | High | Not described |
| Reasons for LFU provided | High | No |
| Reasons for LFU linked to outcome | High | No |
| Description of LFU participants | High | Not described |
| Analysis: important differences LFU vs non‐LFU in study | High | Not described |
| Blinding | Low | Blinding adequate |
| Clear definition of diagnosis provided at follow‐up | Low | Yes |
| Same diagnosis outcome tool for all | Low | Yes |
| Valid and reliable tool | Low | Standardised, reliable valid tool used |
| Method and setting of outcome measurements same for all participants | High | No |
| Completeness of outcome measure | Low | Diagnostic tools completed by all study participants |
| Study ID: Paul 2008 | ||
|---|---|---|
| Domain | Risk of bias level | Support for judgement |
| Sample (described) | High | Clinical sample |
| Description of sampling frame | Moderate | Some description |
| Description of baseline study sample | Low | Well described |
| Description of inclusion or exclusion criteria | Low | Well described |
| Adequacy of participation in study by all eligible | Unclear | Not described |
| Recruitment | Low | Prospective |
| Loss to follow‐up (LFU) | Low | None of sample lost to follow‐up |
| Description of attempts to collect information on those LFU | Not applicable as no LFU | |
| Reasons for LFU provided | Not applicable as no LFU | |
| Reasons for LFU linked to outcome | Not applicable as no LFU | |
| Description of LFU participants | Not applicable as no LFU | |
| Analysis: important differences LFU vs non‐LFU in study | Not applicable as no LFU | |
| Blinding | Moderate | Blinding inadequate |
| Clear definition of diagnosis provided at follow‐up | Low | Yes |
| Same diagnosis outcome tool for all | Low | Yes |
| Valid and reliable tool | Low | Standardised, reliable valid tool used |
| Method and setting of outcome measurements same for all participants | Low | Yes |
| Completeness of outcome measure | Low | Diagnostic tools completed by all study participants |
| Study ID: Qian 2018 | ||
|---|---|---|
| Domain | Risk of bias level | Support for judgement |
| Sample (described) | High | Clinical sample |
| Description of sampling frame | HIgh | Not described |
| Description of baseline study sample | Low | Well described |
| Description of inclusion or exclusion criteria | Moderate | Some described |
| Adequacy of participation in study by all eligible | High | Participation in study by all eligible not adequate |
| Recruitment | High | Retrospective |
| Loss to follow‐up (LFU) | Not applicable as the study is retrospective | |
| Description of attempts to collect information on those LFU | Not applicable as the study is retrospective | |
| Reasons for LFU provided | Not applicable as the study is retrospective | |
| Reasons for LFU linked to outcome | Not applicable as the study is retrospective | |
| Description of LFU participants | Not applicable as the study is retrospective | |
| Analysis: important differences LFU vs non‐LFU in study | Not applicable as the study is retrospective | |
| Blinding | Unclear | Not described |
| Clear definition of diagnosis provided at follow‐up | Low | Yes |
| Same diagnosis outcome tool for all | Low | Yes |
| Valid and reliable tool | Low | Standardised, reliable valid tool used |
| Method and setting of outcome measurements same for all participants | Unclear | Not described |
| Completeness of outcome measure | Low | Diagnostic tools completed by all study participants |
| Study ID: Rivard 2019 | ||
|---|---|---|
| Domain | Risk of bias level | Support for judgement |
| Sample (described) | High | Clinical sample |
| Description of sampling frame | HIgh | Not described |
| Description of baseline study sample | Moderate | Some description |
| Description of inclusion or exclusion criteria | Moderate | Some description |
| Adequacy of participation in study by all eligible | High | Inadequate participation in study by all eligible |
| Recruitment | Low | Prospective |
| Loss to follow‐up (LFU) | Low | None of sample lost to follow‐up but selected participants retrospectively from a prospective cohort |
| Description of attempts to collect information on those LFU | Unclear | Not described |
| Reasons for LFU provided | Unclear | Not described |
| Reasons for LFU linked to outcome | Unclear | Not described |
| Description of LFU participants | Unclear | Not described |
| Analysis: important differences LFU vs non‐LFU in study | Unclear | Not described |
| Blinding | High | Not described |
| Clear definition of diagnosis provided at follow‐up | High | No |
| Same diagnosis outcome tool for all | Low | Yes |
| Valid and reliable tool | Low | Standardised, reliable valid tool used |
| Method and setting of outcome measurements same for all participants | High | No |
| Completeness of outcome measure | Low | Diagnostic tools completed by all study participants |
| Study ID: Robain 2020 | ||
|---|---|---|
| Domain | Risk of bias level | Support for judgement |
| Sample (described) | Moderate | Clinical sample from a broad community base |
| Description of sampling frame | Moderate | Some description |
| Description of baseline study sample | Moderate | Some description |
| Description of inclusion or exclusion criteria | Moderate | Some description |
| Adequacy of participation in study by all eligible | Unclear | Not described |
| Recruitment | Low | Prospective |
| Loss to follow‐up (LFU) | Low | None of sample lost to follow‐up |
| Description of attempts to collect information on those LFU | Not applicable as no LFU | |
| Reasons for LFU provided | Not applicable as no LFU | |
| Reasons for LFU linked to outcome | Not applicable as no LFU | |
| Description of LFU participants | Not applicable as no LFU | |
| Analysis: important differences LFU vs non‐LFU in study | Not applicable as no LFU | |
| Blinding | High | Not blinded |
| Clear definition of diagnosis provided at follow‐up | High | No |
| Same diagnosis outcome tool for all | Low | Yes |
| Valid and reliable tool | Low | Standardised, reliable valid tool used |
| Method and setting of outcome measurements same for all participants | Low | Yes |
| Completeness of outcome measure | Low | Diagnostic tools completed by all study participants |
| Study ID: Sheinkopf 1998 | ||
|---|---|---|
| Domain | Risk of bias level | Support for judgement |
| Sample (described) | High | Clinical sample |
| Description of sampling frame | High | Not described |
| Description of baseline study sample | High | Not described |
| Description of inclusion or exclusion criteria | Moderate | Some description |
| Adequacy of participation in study by all eligible | Unclear | Not described |
| Recruitment | Moderate | Retrospective, with the whole cohort considered |
| Loss to follow‐up (LFU) | Not applicable as the study is retrospective | |
| Description of attempts to collect information on those LFU | Not applicable as the study is retrospective | |
| Reasons for LFU provided | Not applicable as the study is retrospective | |
| Reasons for LFU linked to outcome | Not applicable as the study is retrospective | |
| Description of LFU participants | Not applicable as the study is retrospective | |
| Analysis: important differences LFU vs non‐LFU in study | Not applicable as the study is retrospective | |
| Blinding | Unclear | Not described |
| Clear definition of diagnosis provided at follow‐up | Low | Yes |
| Same diagnosis outcome tool for all | Low | Yes |
| Valid and reliable tool | Low | Standardised, reliable valid tool used |
| Method and setting of outcome measurements same for all participants | Unclear | Not described |
| Completeness of outcome measure | Moderate | Not all tools completed but not > 90% missing |
| Study ID: Smith 2019 | ||
|---|---|---|
| Domain | Risk of bias level | Support for judgement |
| Sample (described) | High | Clinical sample |
| Description of sampling frame | Moderate | Some description |
| Description of baseline study sample | Moderate | Some description |
| Description of inclusion or exclusion criteria | Low | Well described |
| Adequacy of participation in study by all eligible | High | Participation in study by all eligible not adequate |
| Recruitment | Low | Prospective |
| Loss to follow‐up (LFU) | High | 48% of sample lost to follow‐up |
| Description of attempts to collect information on those LFU | High | Not described |
| Reasons for LFU provided | Low | Yes |
| Reasons for LFU linked to outcome | Moderate | Some information provided but inadequate |
| Description of LFU participants | Moderate | Some information provided but inadequate |
| Analysis: important differences LFU vs non‐LFU in study | Low | No important differences reported |
| Blinding | High | Not blinded |
| Clear definition of diagnosis provided at follow‐up | Low | Yes |
| Same diagnosis outcome tool for all | Low | Yes |
| Valid and reliable tool | Low | Standardised, reliable valid tool used |
| Method and setting of outcome measurements same for all participants | High | No |
| Completeness of outcome measure | Moderate | Not all tools completed but not >90% missing |
| Study ID: Soke 2011 | ||
|---|---|---|
| Domain | Risk of bias level | Support for judgement |
| Sample (described) | Moderate | Clinical sample from a broad community base |
| Description of sampling frame | Moderate | Some description |
| Description of baseline study sample | Low | Not described |
| Description of inclusion or exclusion criteria | Low | Not described |
| Adequacy of participation in study by all eligible | Low | Participation in study by all eligible not adequate |
| Recruitment | Low | Prospective |
| Loss to follow‐up (LFU) | High | 22% of sample lost to follow‐up |
| Description of attempts to collect information on those LFU | High | Not described |
| Reasons for LFU provided | High | No |
| Reasons for LFU linked to outcome | High | No |
| Description of LFU participants | High | Not described |
| Analysis: important differences LFU vs non‐LFU in study | Unclear | Not described |
| Blinding | High | Not blinded |
| Clear definition of diagnosis provided at follow‐up | Low | Yes |
| Same diagnosis outcome tool for all | Low | Yes |
| Valid and reliable tool | Low | Standardised, reliable valid tool used |
| Method and setting of outcome measurements same for all participants | Unclear | Not described |
| Completeness of outcome measure | Low | All tools complete |
| Study ID: Solomon 2014 | ||
|---|---|---|
| Domain | Risk of bias level | Support for judgement |
| Sample (described) | High | Clinical sample |
| Description of sampling frame | Low | Well described |
| Description of baseline study sample | Low | Well described |
| Description of inclusion or exclusion criteria | Low | Well described |
| Adequacy of participation in study by all eligible | High | Participation in study by all eligible not adequate |
| Recruitment | Low | Prospective |
| Loss to follow‐up (LFU) | High | 25% of sample lost to follow‐up |
| Description of attempts to collect information on those LFU | High | Not described |
| Reasons for LFU provided | High | No |
| Reasons for LFU linked to outcome | High | No |
| Description of LFU participants | High | Not described |
| Analysis: important differences LFU vs non‐LFU in study | Unclear | Not described |
| Blinding | High | Not blinded |
| Clear definition of diagnosis provided at follow‐up | Low | Yes |
| Same diagnosis outcome tool for all | Low | Yes |
| Valid and reliable tool | Low | Standardised, reliable valid tool used |
| Method and setting of outcome measurements same for all participants | Unclear | Not described |
| Completeness of outcome measure | Low | All tools complete |
| Study ID: Solomon 2016 | ||
|---|---|---|
| Domain | Risk of bias level | Support for judgement |
| Sample (described) | High | Clinical sample |
| Description of sampling frame | Moderate | Some description |
| Description of baseline study sample | Low | Well described |
| Description of inclusion or exclusion criteria | Low | Well described |
| Adequacy of participation in study by all eligible | High | Participation in study by all eligible not adequate |
| Recruitment | Low | Prospective |
| Loss to follow‐up (LFU) | High | 47% of sample lost to follow‐up |
| Description of attempts to collect information on those LFU | High | Not described |
| Reasons for LFU provided | Low | Yes |
| Reasons for LFU linked to outcome | Moderate | Some information but inadequate |
| Description of LFU participants | Moderate | Some information but inadequate |
| Analysis: important differences LFU vs non‐LFU in study | Low | No |
| Blinding | Low | Blinding adequate |
| Clear definition of diagnosis provided at follow‐up | Low | Yes |
| Same diagnosis outcome tool for all | Low | Yes |
| Valid and reliable tool | Low | Standardised, reliable valid tool used |
| Method and setting of outcome measurements same for all participants | High | No |
| Completeness of outcome measure | Low | All tools complete |
| Study ID: Spjut Jansson 2016 | ||
|---|---|---|
| Domain | Risk of bias level | Support for judgement |
| Sample (described) | Low | Population based sample |
| Description of sampling frame | Low | Well described |
| Description of baseline study sample | Moderate | Some description |
| Description of inclusion or exclusion criteria | Moderate | Some description |
| Adequacy of participation in study by all eligible | High | Participation in study by all eligible not adequate |
| Recruitment | Low | Prospective |
| Loss to follow‐up (LFU) | Low | None of sample lost to follow‐up |
| Description of attempts to collect information on those LFU | Not applicable as no LFU | |
| Reasons for LFU provided | Not applicable as no LFU | |
| Reasons for LFU linked to outcome | Not applicable as no LFU | |
| Description of LFU participants | Not applicable as no LFU | |
| Analysis: important differences LFU vs non‐LFU in study | Not applicable as no LFU | |
| Blinding | Moderate | Blinding inadequate |
| Clear definition of diagnosis provided at follow‐up | Low | Yes |
| Same diagnosis outcome tool for all | High | No |
| Valid and reliable tool | Low | Standardised, reliable valid tool used |
| Method and setting of outcome measurements same for all participants | Low | Yes |
| Completeness of outcome measure | Low | All tools complete |
| Study ID: Sullivan 2010 | ||
|---|---|---|
| Domain | Risk of bias level | Support for judgement |
| Sample (described) | Moderate | Clinical sample from a broad community base |
| Description of sampling frame | High | Not described |
| Description of baseline study sample | Moderate | Some description |
| Description of inclusion or exclusion criteria | Moderate | Some description |
| Adequacy of participation in study by all eligible | Unclear | Not described |
| Recruitment | Moderate | Retrospective with the whole cohort considered |
| Loss to follow‐up (LFU) | Not applicable as the study is retrospective | |
| Description of attempts to collect information on those LFU | Not applicable as the study is retrospective | |
| Reasons for LFU provided | Not applicable as the study is retrospective | |
| Reasons for LFU linked to outcome | Not applicable as the study is retrospective | |
| Description of LFU participants | Not applicable as the study is retrospective | |
| Analysis: important differences LFU vs non‐LFU in study | Not applicable as the study is retrospective | |
| Blinding | Unclear | Not described |
| Clear definition of diagnosis provided at follow‐up | Low | Yes |
| Same diagnosis outcome tool for all | Low | Yes |
| Valid and reliable tool | Low | Standardised, reliable valid tool used |
| Method and setting of outcome measurements same for all participants | Unclear | Not described |
| Completeness of outcome measure | Low | All tools complete |
| Study ID: Szatmari 2021 | ||
|---|---|---|
| Domain | Risk of bias level | Support for judgement |
| Sample (described) | Moderate | Clinical sample from a brand community base |
| Description of sampling frame | Moderate | Some description |
| Description of baseline study sample | Low | Well described |
| Description of inclusion or exclusion criteria | Low | Well described |
| Adequacy of participation in study by all eligible | High | Not described |
| Recruitment | Low | Prospective |
| Loss to follow‐up (LFU) | High | 28% of sample lost to follow‐up |
| Description of attempts to collect information on those LFU | High | Not described |
| Reasons for LFU provided | High | No |
| Reasons for LFU linked to outcome | Low | Yes |
| Description of LFU participants | High | Not described |
| Analysis: important differences LFU vs non‐LFU in study | High | Yes, important differences reported |
| Blinding | HIgh | Not blinded |
| Clear definition of diagnosis provided at follow‐up | Low | Yes |
| Same diagnosis outcome tool for all | Low | Yes |
| Valid and reliable tool | Low | Standardised, reliable valid tool used |
| Method and setting of outcome measurements same for all participants | High | No |
| Completeness of outcome measure | Low | Diagnostic tools completed by all study participants |
| Study ID: Takeda 2007 | ||
|---|---|---|
| Domain | Risk of bias level | Support for judgement |
| Sample (described) | High | Clinical sample |
| Description of sampling frame | Moderate | Some description |
| Description of baseline study sample | Moderate | Some description |
| Description of inclusion or exclusion criteria | High | Not described |
| Adequacy of participation in study by all eligible | Low | Adequate participation in study by all eligible |
| Recruitment | High | Retrospective |
| Loss to follow‐up (LFU) | Not applicable as the study is retrospective | |
| Description of attempts to collect information on those LFU | Not applicable as the study is retrospective | |
| Reasons for LFU provided | Not applicable as the study is retrospective | |
| Reasons for LFU linked to outcome | Not applicable as the study is retrospective | |
| Description of LFU participants | Not applicable as the study is retrospective | |
| Analysis: important differences LFU vs non‐LFU in study | Not applicable as the study is retrospective | |
| Blinding | High | Blinding inadequate |
| Clear definition of diagnosis provided at follow‐up | Low | Yes |
| Same diagnosis outcome tool for all | Low | Yes |
| Valid and reliable tool | Low | Standardised, reliable valid tool used |
| Method and setting of outcome measurements same for all participants | Low | Yes |
| Completeness of outcome measure | Low | All tools complete |
| Study ID: Thomas 2009 | ||
|---|---|---|
| Domain | Risk of bias level | Support for judgement |
| Sample (described) | Unclear | Not described |
| Description of sampling frame | High | Not described |
| Description of baseline study sample | Moderate | Some description |
| Description of inclusion or exclusion criteria | High | Not described |
| Adequacy of participation in study by all eligible | Unclear | Not described |
| Recruitment | High | Retrospective |
| Loss to follow‐up (LFU) | Not applicable as the study is retrospective | |
| Description of attempts to collect info on those LFU | Not applicable as the study is retrospective | |
| Reasons for LFU provided | Not applicable as the study is retrospective | |
| Reasons for LFU linked to outcome | Not applicable as the study is retrospective | |
| Description of LFU participants | Not applicable as the study is retrospective | |
| Analysis: important differences LFU vs non‐LFU in study | Not applicable as the study is retrospective | |
| Blinding | High | Not blinded |
| Clear definition of diagnosis provided at follow‐up | Low | Yes |
| Same diagnosis outcome tool for all | Low | Yes |
| Valid and reliable tool | Low | Standardised, reliable valid tool used |
| Method and setting of outcome measurements same for all participants | Low | Yes |
| Completeness of outcome measure | Low | All tools complete |
| Study ID: Venker 2014 | ||
|---|---|---|
| Domain | Risk of bias level | Support for judgement |
| Sample (described) | Moderate | Clinical sample from a broad community base |
| Description of sampling frame | Low | Well described |
| Description of baseline study sample | Low | Well described |
| Description of inclusion or exclusion criteria | High | Not described |
| Adequacy of participation in study by all eligible | Low | Adequate participation in study by all eligible |
| Recruitment | Low | Prospective |
| Loss to follow‐up (LFU) | High | 20.2% of sample lost to follow‐up |
| Description of attempts to collect information on those LFU | High | Not described |
| Reasons for LFU provided | High | No |
| Reasons for LFU linked to outcome | High | No |
| Description of LFU participants | High | Not described |
| Analysis: important differences LFU vs non‐LFU in study | High | Yes |
| Blinding | Unclear | Not described |
| Clear definition of diagnosis provided at follow‐up | Low | Yes |
| Same diagnosis outcome tool for all | Low | Yes |
| Valid and reliable tool | Low | Standardised, reliable valid tool used |
| Method and setting of outcome measurements same for all participants | Unclear | Not described |
| Completeness of outcome measure | Low | All tools complete |
| Study ID: Wu 2016 | ||
|---|---|---|
| Domain | Risk of bias level | Support for judgement |
| Sample (described) | Moderate | Clinical sample from a broad community base |
| Description of sampling frame | Moderate | Some description |
| Description of baseline study sample | Low | Well described |
| Description of inclusion or exclusion criteria | Low | Well described |
| Adequacy of participation in study by all eligible | Unclear | Not described |
| Recruitment | High | Retrospective |
| Loss to follow‐up (LFU) | Not applicable as the study is retrospective | |
| Description of attempts to collect information on those LFU | Not applicable as the study is retrospective | |
| Reasons for LFU provided | Not applicable as the study is retrospective | |
| Reasons for LFU linked to outcome | Not applicable as the study is retrospective | |
| Description of LFU participants | Not applicable as the study is retrospective | |
| Analysis: important differences LFU vs non‐LFU in study | Not applicable as the study is retrospective | |
| Blinding | High | Not blinded |
| Clear definition of diagnosis provided at follow‐up | Low | Yes |
| Same diagnosis outcome tool for all | Low | Yes |
| Valid and reliable tool | Moderate | Valid or reliable but parent rated |
| Method and setting of outcome measurements same for all participants | Low | Yes |
| Completeness of outcome measure | Low | All tools complete |
| Study ID: Zappella 1990 | ||
|---|---|---|
| Domain | Risk of bias level | Support for judgement |
| Sample (described) | High | Clinical sample |
| Description of sampling frame | High | Not described |
| Description of baseline study sample | Moderate | Some description |
| Description of inclusion or exclusion criteria | Moderate | Some description |
| Adequacy of participation in study by all eligible | Low | Adequate participation in study by all eligible |
| Recruitment | High | Retrospective |
| Loss to follow‐up (LFU) | Not applicable as the study is retrospective | |
| Description of attempts to collect information on those LFU | Not applicable as the study is retrospective | |
| Reasons for LFU provided | Not applicable as the study is retrospective | |
| Reasons for LFU linked to outcome | Not applicable as the study is retrospective | |
| Description of LFU participants | Not applicable as the study is retrospective | |
| Analysis: important differences LFU vs non‐LFU in study | Not applicable as the study is retrospective | |
| Blinding | High | Not blinded |
| Clear definition of diagnosis provided at follow‐up | Low | Yes |
| Same diagnosis outcome tool for all | Low | Yes |
| Valid and reliable tool | Unclear | Not described |
| Method and setting of outcome measurements same for all participants | Low | Yes |
| Completeness of outcome measure | Low | All tools complete |
| Study ID: Zappella 2010 | ||
|---|---|---|
| Domain | Risk of bias level | Support for judgement |
| Sample (described) | High | Clinical sample |
| Description of sampling frame | High | Not described |
| Description of baseline study sample | Moderate | Some description |
| Description of inclusion or exclusion criteria | Moderate | Some description |
| Adequacy of participation in study by all eligible | Low | Adequate participation in study by all eligible |
| Recruitment | High | Retrospective |
| Loss to follow‐up (LFU) | Not applicable as the study is retrospective | |
| Description of attempts to collect information on those LFU | Not applicable as the study is retrospective | |
| Reasons for LFU provided | Not applicable as the study is retrospective | |
| Reasons for LFU linked to outcome | Not applicable as the study is retrospective | |
| Description of LFU participants | Not applicable as the study is retrospective | |
| Analysis: important differences LFU vs non‐LFU in study | Not applicable as the study is retrospective | |
| Blinding | High | Not blinded |
| Clear definition of diagnosis provided at follow‐up | Low | Yes |
| Same diagnosis outcome tool for all | Low | Yes |
| Valid and reliable tool | Unclear | Not described |
| Method and setting of outcome measurements same for all participants | Low | Yes |
| Completeness of outcome measure | Low | All tools complete |
| Study ID: Zwaigenbaum 2016 | ||
|---|---|---|
| Domain | Risk of bias level | Support for judgement |
| Sample (described) | Moderate | Clinical sample from a broad community base |
| Description of sampling frame | Moderate | Some description |
| Description of baseline study sample | Low | Well described |
| Description of inclusion or exclusion criteria | Low | Well described |
| Adequacy of participation in study by all eligible | Low | Adequate participation in study by all eligible |
| Recruitment | Low | Prospective |
| Loss to follow‐up (LFU) | Low | None of sample lost to follow‐up |
| Description of attempts to collect information on those LFU | Not applicable as no LFU | |
| Reasons for LFU provided | Not applicable as no LFU | |
| Reasons for LFU linked to outcome | Not applicable as no LFU | |
| Description of LFU participants | Not applicable as no LFU | |
| Analysis: important differences LFU vs non‐LFU in study | Not applicable as no LFU | |
| Blinding | Low | Adequately blinded |
| Clear definition of diagnosis provided at follow‐up | Low | Yes |
| Same diagnosis outcome tool for all | Low | Yes |
| Valid and reliable tool | Low | Standardised, reliable valid tool used |
| Method and setting of outcome measurements same for all participants | Low | Yes |
| Completeness of outcome measure | Low | All tools complete |
Footnotes
LFU: loss to follow up; vs: versus
Appendix 10. Funnel Plot

Funnel Plot of included studies
Funnel Plot of included studies

Study flow diagram.
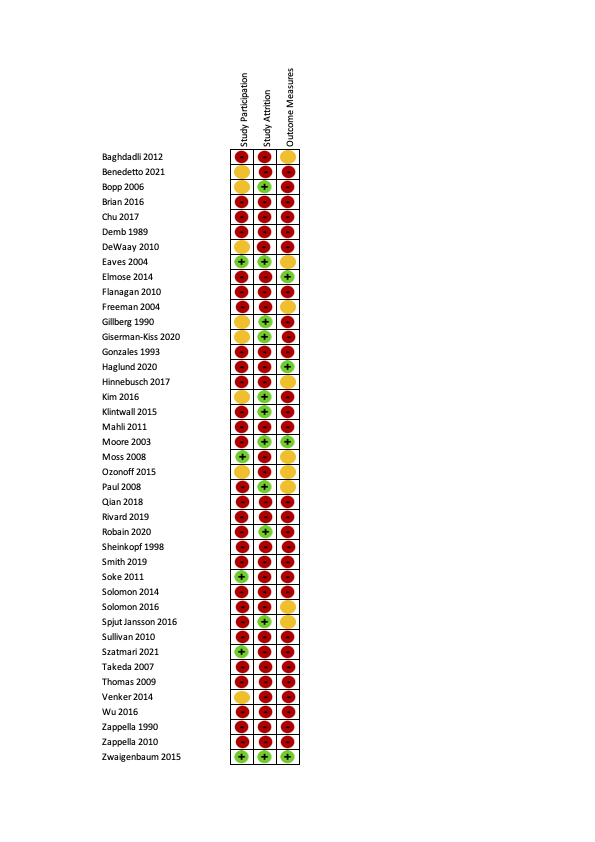
Risk of bias ratings on the QUIPS tool (40 studies). Green is low risk of bias, orange is moderate risk of bias and red is high risk of bias.
Summary risk of bias ratings for provided for each QUIPS domain (i.e.study participation, study attrition, outcome measurement). See Appendix 9 for a figure showing all criteria that were rated for each domain. Studies were rated to have an overall low risk of bias if all three summary domains were rated low or moderate risk of bias. Studies were rated to have an overall high risk of bias if all three summary domains were rated low or moderate risk of bias.

Risk of bias graph: review authors' judgements about each risk of bias item for each included study presented as percentages across all included studies (41 studies).

Risk of bias ratings for each included study for each of the 18 criteria. Red indicates high, orange indicates moderate, green indicates low and yellow indicates unclear risk of bias.

Forest plot of proportion of children that retained their autism diagnosis
Footnote
CI: confidence interval; ES: effect size; N: number in sample

Age at baseline: < 2 years; 2 to 3 years; 4 to 6 years; 7 to 12; years; 13 to 17 years
Footnote
CI: confidence interval; ES: effect size; N: number in sample
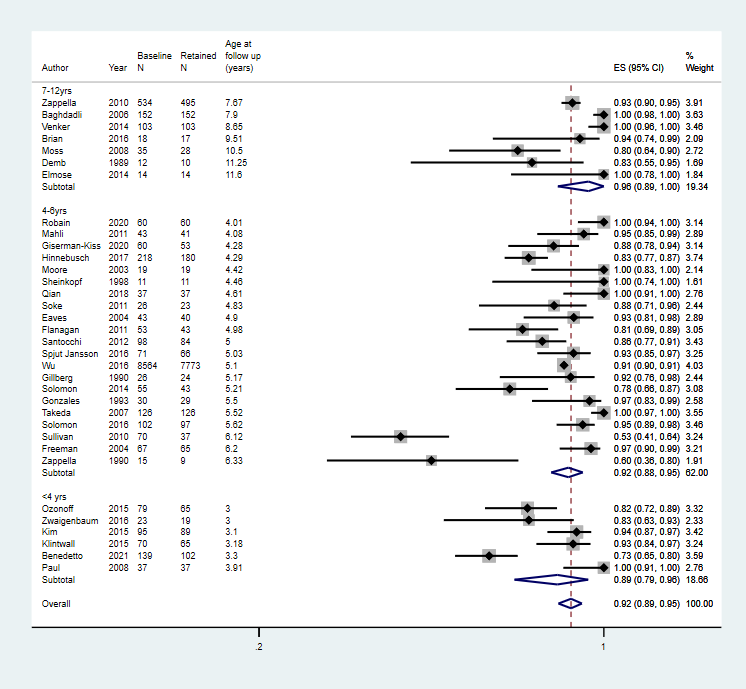
Age at follow up: 2 to 3 years; 4 to 6 years; 7 to 12 years; 13 to 18 years
Footnote
CI: confidence interval; ES: effect size; N: number in sample

Duration of follow‐up: short‐term (up to 2 years), medium‐term (2 to 5 years), and long‐term (6 to 17 years) follow‐up
Footnote
CI: confidence interval; ES: effect size; N: number in sample
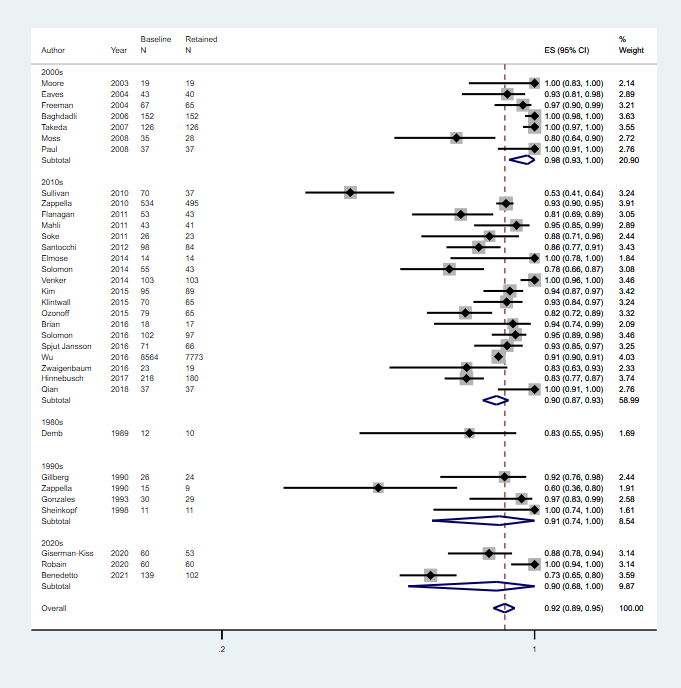
Decade of publication: 1960 to 1969; 1970 to 1979; 1980 to 1989; 1990 to 1999; 2000 to 2009; 2010 to 2019
Footnote
CI: confidence interval; ES: effect size; N: number in sample
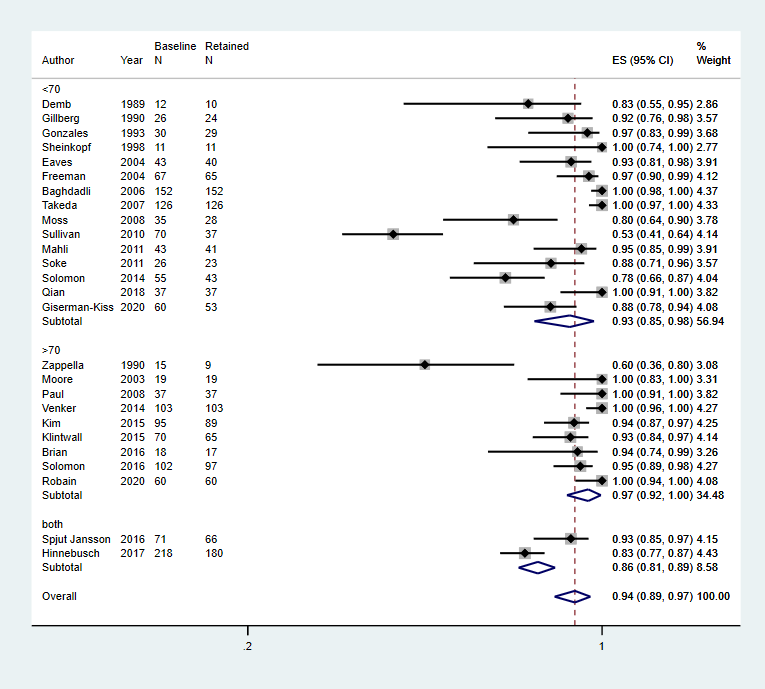
Intelligence: mean IQ 70; mean IQ > 70; or more than 70% of the cohort has IQ 70
Footnote
CI: confidence interval; ES: effect size; IQ: intelligence quotient; N: number in sample

Language: > 70% verbal; > 70% non‐verbal (i.e. use < 15 words); mean standardised language score < 70; mean standardised language score 70; or > 70% of the cohort has mean language score < 70
Footnote
CI: confidence interval; ES: effect size; N: number in sample

Adaptive behaviour: mean standard score 70; mean standard score > 70; or > 70% of the cohort has mean standard score 70
Footnote
CI: confidence interval; ES: effect size; N: number in sample
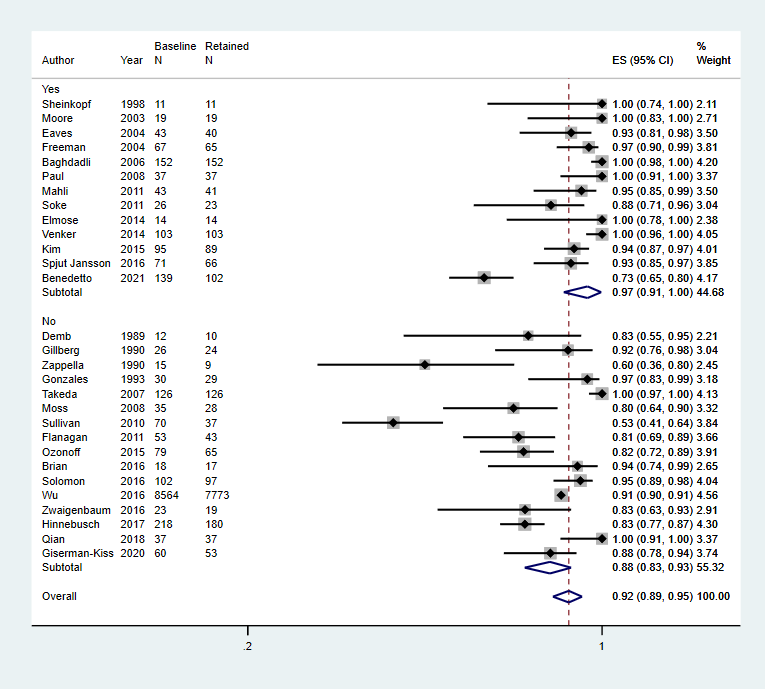
Multidisciplinary team used for diagnosis, Yes or No
Footnote
CI: confidence interval; ES: effect size; N: number in sample
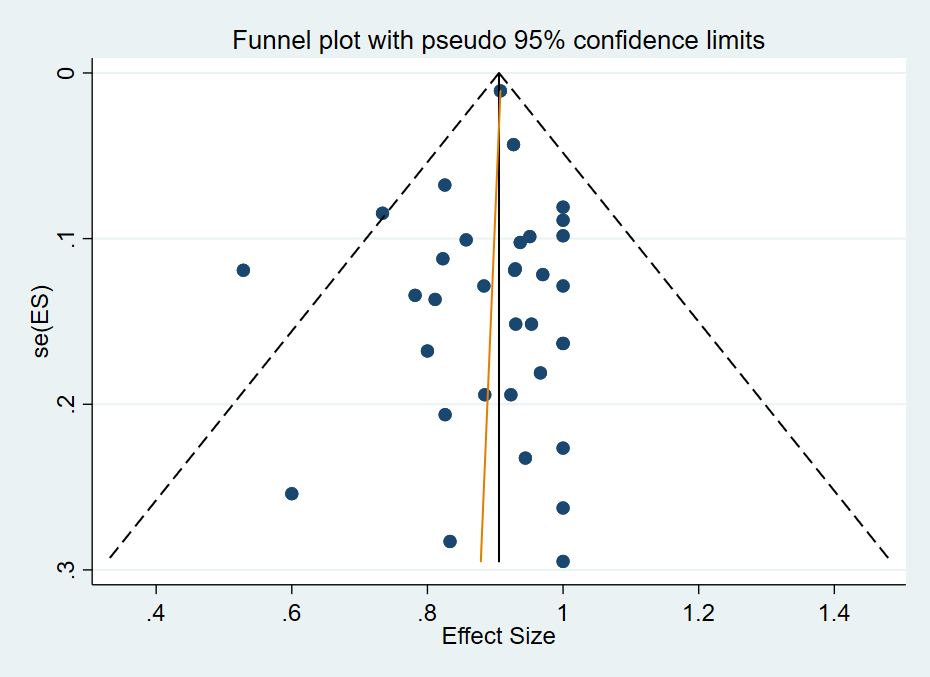
Funnel Plot of included studies
| Proportion of individuals who have a diagnosis of autism spectrum disorder at baseline and continue not meet diagnostic criteria at follow‐up one or more years later | ||||
| Patient or population: children diagnosed with autism spectrum disorder Settings: range of settings | ||||
| Outcomes | Relative effect (95% CI) | Number of participants (studies) | Quality of the evidence | Comments |
|---|---|---|---|---|
| Proportion with an autism spectrum disorder diagnosis at baseline and follow‐up Follow‐up: > 12 months | 0.92 (0.89 to 0.95) | 11,105 (34 studies: 1 intervention trial with 1 arm; 1 RCTa; 2 non‐RCTsa; 30 TAU or in the community) | ⊕⊕⊝⊝ Lowb,c | Limitations (ROB): seriousb Inconsistency: seriousc Indirectness: not serious Imprecision: not serious Publication/reporting bias: not serious Effect size: N/A Dose response gradient: N/A Confirmatory evidence: N/A See footnotes below. |
| Social communication at baseline and follow‐up (mean score) Follow‐up: > 12 months | See comments | None of the included studies provided separate domain scores at baseline and follow‐up | ||
| Restricted and repetitive behaviours and interests at baseline and follow‐up (mean score) Follow‐up: > 12 months | See comments | None of the included studies provided separate domain scores at baseline and follow‐up | ||
| Defnitions of levels of evidence High: We are very confident that the true prognosis (probability of future events) lies close to that of the estimate Moderate: We are moderately confident that the true prognosis (probability of future events) is likely to be close to the estimate, but there is a possibility that it is substantially different Low: Our confidence in the estimate is limited: the true prognosis (probability of future events) may be substantially different from the estimate Very low: We have very little confidence in the estimate: the true prognosis (probability of future events) is likely to be substantially different from the estimate
CI: Confidence intervals;N/A: Not applicable;RCT(s): Randomised controlled trial(s);ROB: Risk of bias; TAU: Treatment as usual. | ||||
| aData were taken from the control arm of the study | ||||
| Year published | Classification system | Subgroups (as specified in the classification system) |
|---|---|---|
| 1975 | International Classification of Diseases, Ninth Revision, Clinical Modification (ICD‐9‐CM) | Autistic disorder |
| 1980 | Diagnostic and Statistical Manual of Mental Disorders, Third Edition (DSM‐III) | PDD: infantile autism, childhood onset PDD and atypical PDD |
| 1987 | Diagnostic and Statistical Manual of Mental Disorders, Third Edition, Revised (DSM‐III‐R) | PDD: autistic disorder, PDD‐not otherwise specified (PDD‐NOS) |
| 1994 to 2000 | Diagnostic and Statistical Manual of Mental Disorders, Fourth Edition (DSM‐IV) | Asperger’s disorder, autistic disorder, PDD‐NOS |
| 1996 | International Classification of Diseases, Tenth Revision (ICD‐10) | Childhood autism, Asperger's syndrome, atypical autism, pervasive developmental disorder (PDD) ‐ unspecified |
| 2000 to 2013 | Diagnostic and Statistical Manual of Mental Disorders, Fourth Edition, Text Revision (DSM‐IV‐TR) | Asperger’s disorder, autistic disorder, PDD‐NOS |
| 2013 to current | Diagnostic and Statistical Manual of Mental Disorders, Fifth Edition (DSM‐5) | Autism spectrum disorder |
| 2018 | International Classification of Diseases, Eleventh Revision (ICD‐11) | Autism spectrum disorder |
| PDD‐NOS: pervasive developmental disorder | ||
| Primary publication | Additional publications from the same study |
|---|---|
| Anderson 2007, Bedford 2016, Gotham 2012, Gotham 2011, Hus 2011, Lord 1995, Lord 2004, Lord 2012, Luyster 2007, Pickles 2014, Richler 2010, Thurm 2007 | |
| Baghdadli 2018, Baghdadli 2008, Baghdadli 2007, Darrou 2010, Pry 2011, Pry 2012 | |
| Bopp 2009; Smith 2007 | |
| Flanagan 2012 | |
| Giserman‐Kiss 2018 | |
| Magiati 2007, Magiati 2011a, Magiati 2011b | |
| Ke 2017, Li 2019 | |
| Mello 2018 | |
| Mahoney 2016 | |
| Solomon 2018, Waizbard‐Bartov 2021 | |
| Baribeau 2020, Baribeau 2021, Courchesne 2021, Bennett 2014, Bennett 2015, Georgiades 2014, Georgiades 2021, Szatmari 2015 | |
| Ellis‐Weismer 2015, Davidson 2017, Ray‐Subramanian 2012, Venker 2016 | |
| aMet inclusion criteria but unable to extract data for synthesis as children without a diagnosis of autism spectrum disorder were also included in the cohort. Authors were contacted but we were unable to obtain required data. | |
| Study | Diagnosis type | N at baseline (% male) | IQ (mean standard score)a | Adaptive behavior (mean standard score)a | Language (mean standard score)a | Age at baseline (years) | Follow‐up duration (years) | Diagnostic tool used at baseline (multidisciplinary or not) | Proportion who met diagnostic criteria at follow‐up |
|---|---|---|---|---|---|---|---|---|---|
| ASD | 152 (82) | < 70 | < 70 | NR | 4.90 | 3.00 | ICD‐10 & CARS (Y) | 1.0 | |
| ASD | 147 (80) | NR | NR | NR | 2.3 | 1 | DSM‐5 and ADOS (Y) | 0.73 | |
| ASD | 18 (72) | > 70 | NR | > 70 | 3.15 | 6.36 | DSM‐IV‐TR & ADOS (N) | 0.94 | |
| ASD | 12 (75) | < 70 | NR | NR | 4.50 | 5.00 | DSM‐III & DSM‐III R (N) | 0.83 | |
| ASD | 43 (80) | < 70 | < 70 | NR | 2.75 | 2.25 | DSM‐IV, CARS, MDT (Y) | 0.93 | |
| ASD | 23 (78) | NR | NR | NR | 3.10 | 8.30 | ICD‐10, ADOS (Y) | 1.00 | |
| ASD | 67 (82) | NR | < 70 | NR | 3.59 | 1.38 | CARS (N) | 0.81 | |
| ASD | 59 (81) | < 70 | NR | NR | 4.00 | 2.2 | DSM IV, CARS (N) | 0.97 | |
| ASD | 25 (68) | < 70 | NR | NR | 1.13 | 4.04 | DSM‐III‐R (N) | 0.92 | |
| ASD | 60 (87) | <70 | NR | <70 | 2.31 | 1.98 | ADOS | 0.883 | |
| ASD | 30 (73) | < 70 | NR | NR | 4.50 | 1.00 | DSM‐III, DSM‐III‐R, DSM‐IV and ICD 10 (N) | 0.97 | |
| ASD | 219 (81) | Both | NR | < 70 | 2.13 | 2.16 | DSM‐IV, ADOS, CARS (N) | 0.83 | |
| ASD | 100 (84) | > 70 | Both | NR | 1.80 | 1.30 | ADOS (Y) | 0.93 | |
| ASD | 70 (89) | > 70 | > 70 | < 70 | 1.83 | 1.36 | ADOS G, ADOS T (U) | 0.93 | |
| ASD | 77 (83) | < 70 | NR | NR | 2.48 | 1.65 | CARS (Y) | 0.95 | |
| ASD | 19 (80) | > 70 | NR | < 70 | 2.83 | 1.59 | ADI‐R (Y) | 1.00 | |
| ASD | 35 (91) | < 70 | < 70 | < 70 | 3.5 | 7.00 | ADI‐R (N) | 0.80 | |
| ASD | 79 (NR) | NR | NR | NR | 2 | 1 | ADI‐R, DSM IV, best clinical estimate (N) | 0.82 | |
| ASD | 37 (NR) | > 70 | > 70 | < 70 | 1.82 | 1.09 | ADOS (Y) | 1.00 | |
| ASD | 37 (86) | <70 | NR | NR | 2.57 | 2 | DSM IV TR; CARS ADI‐R (N) | 1.00 | |
| ASD | 60 (100) | >70 | NR | NR | 3 | 1 | DSM 5 ADOS (N) | 1.00 | |
| ASD | 98 (NR) | NR | NR | NR | 3.25 | 1.75 | ADOS, CARS | 0.86 | |
| ASD | 11 (NR) | < 70 | NR | NR | 2.94 | 1.51 | DSM‐III (Y) | 1.00 | |
| AD | 28 (79) | < 70 | NR | NR | 2.75 | 2.08 | ADI‐R (Y) | 0.89 | |
| ASD | 55 (84) | < 70 | NR | NR | 4.21 | 1.00 | ADOS (U) | 0.78 | |
| ASD | 102 (80) | > 70 | Both | Both | 2.86 | 2.76 | ADOS (N) | 0.95 | |
| ASD | 71 (79) | Both | Both | NR | 3.03 | 2.00 | ADOS, DISCO, ADI‐R (Y) | 0.93 | |
| ASD | 75 (83) | < 70 | < 70 | NR | 3.94 | 2.18 | CARS (N) | 0.53 | |
| ASD | 126 (81) | < 70 | NR | NR | 2.62 | 2.90 | ICD‐10, CARS (N) | 1.00 | |
| ASD | 129 (87) | > 70 | > 70 | Both | 2.80 | 5.85 | DSM‐IV, ADOS (Y) | 1.00 | |
| ASD | 8564 (83) | NR | NR | NR | 3.67 | 1.43 | DSM‐IV‐TR file record review (N) | 0.91 | |
| AD | 15 (87) | > 70 | Both | NR | 4.50 | 1.83 | DSM‐III (N) | 0.60 | |
| ASD | 534 (84) | NR | NR | NR | 5.00 | 2.67 | DSM‐IV‐TR (U) | 0.93 | |
| ASD | 23 (69) | NR | > 70 | NR | 1.50 | 1.50 | DSM‐IV‐TR (N) | 0.83 | |
| aMean score (IQ, adaptive behaviour or language) for the cohort is < 70 or more than 70% are less than 70. If cohort evenly spread this is signified 'both'. AD: autistic disorder; ADI: Autism Diagnostic Interview;ADOS: Autism Diagnostic Observation Schedule; ASD: autism spectrum disorder; CARS: Childhood Autism Rating Scale; DISCO: Diagnostic Interview for Social and Communication Disorders; DSM: Diagnostic Statistical Manual of Mental Disorders; ICD: International Classification of Diseases; IQ: intelligence quotient; N: no; NR: not reported; PDD‐NOS: pervasive developmental disorder‐ not otherwise specified; U: unclear; Y: yes. | |||||||||
| Domain | Relative effect (95% CIs) | No. of participants (studies) | I2 | |
|---|---|---|---|---|
| Age at baseline | 0 to 2 years | 0.94 (0.88 to 0.98) | 251 (5 studies) | 52.64%, P = 0.08 |
| 2 to 3 years | 0.92 (0.88 to 0.95) | 9989 (22 studies) | 90.17%, P < 0.01 | |
| 4 to 5 years | 0.91 (0.76 to 0.99) | 152 (5 studies) | 90.48%, P < 0.01 | |
| 5 to 6 years | 0.93 (0.90 to 0.95) | 534 (1 study) | ‐ | |
| Age at follow‐up | < 4 years | 0.89 (0.79 to 0.96) | 443 (6 studies) | 86.80%, P < 0.01 |
| 4 to 6 years | 0.92 (0.88 to 0.95) | 9794 (21 studies) | 87.88%, P < 0.01 | |
| 7 to 12 years | 0.96 (0.89 to 1.00) | 868 (7 studies) | 88.18%, P < 0.01 | |
| Duration of follow‐up | 1 to 2 years | 0.91 (0.88 to 0.94) | 10,745 (27 studies) | 87.86%, P < 0.01 |
| 2 to 5 years | 0.99 (0.92 to 1.00) | 293 (4 studies) | 78.16%, P < 0.01 | |
| 6 to 17 years | 0.92 (0.77 to 1.00) | 67 (3 studies) | ‐ | |
| Decade of publication | 1980 to 1989 | 0.83 (0.55 to 0.95) | 12 (1 studies) | ‐ |
| 1990 to 1999 | 0.91 (0.74 to 1.00) | 82 (4 studies) | 73.16% P = 0.01 | |
| 2000 to 2009 | 0.98 (0.93 to 1.00) | 479 (7 studies) | 80.57% P < 0.01 | |
| 2010 to 2019 | 0.90 (0.87 to 0.93) | 10,273 (19 studies) | 86.84% P < 0.01 | |
| 2020 to 2029 | 0.90 (0.68 to 1.00) | 259 (3 studies) | ‐ | |
| Intelligencea | < 70 | 0.93 (0.85 to 0.98) | 793 (15 studies) | 90.88%, P < 0.01 |
| > 70 | 0.97 (0.92 to 1.00) | 502 (9 studies) | 77.54%, P < 0.01 | |
| Both < 70 and > 70 | 0.86 (0.81, 0.89) | 289 (2 studies) | ‐ | |
| Languagea | < 70 | 0.92 (0.84 to 0.98) | 382 (6 studies) | 79.65%, P < 0.01 |
| > 70 | 0.94 (0.74 to 0.99) | 18 (1 study) | ‐ | |
| Both | 0.98 (0.96 to 1.00) | 205 (2 studies) | ‐ | |
| Adaptive behavioura | < 70 | 0.85 (0.60 to 0.99) | 300 (5 studies) | 96.33%, P < 0.01 |
| > 70 | 0.97 (0.8 to 1.00) | 233 (4 studies) | 83.28%, P < 0.01 | |
| Both | 0.91 (0.82, 0.97) | 283 (4 studies) | 73.88%, P = 0.01 | |
| Multidisciplinary assessment | Yes | 0.97 (0.91 to 1.00) | 767 (13 studies) | 87.97%, P < 0.01 |
| No | 0.88 (0.83 to 0.93) | 9468 (16 studies) | 89.46%, P < 0.01 | |
| aMean score (IQ, adaptive behaviour or language) for the cohort is < 70 or more than 70% are less than 70. If cohort was evenly spread this is signified 'both'. CI: confidence interval;I2: a statistic that describes the percentage of variation across studies; No.: number. | ||||