Pitavastatin for lowering lipids
Abstract
Background
Pitavastatin is the newest statin on the market, and the dose‐related magnitude of effect of pitavastatin on blood lipids is not known.
Objectives
Primary objective
To quantify the effects of various doses of pitavastatin on the surrogate markers: LDL cholesterol, total cholesterol, HDL cholesterol and triglycerides in participants with and without cardiovascular disease.
To compare the effect of pitavastatin on surrogate markers with other statins.
Secondary objectives
To quantify the effect of various doses of pitavastatin on withdrawals due to adverse effects.
Search methods
The Cochrane Hypertension Information Specialist searched the following databases for trials up to March 2019: the Cochrane Central Register of Controlled Trials (CENTRAL, Issue 2, 2019), MEDLINE (from 1946), Embase (from 1974), the World Health Organization International Clinical Trials Registry Platform, and ClinicalTrials.gov. We also contacted authors of relevant papers regarding further published and unpublished work. The searches had no language restrictions.
Selection criteria
RCT and controlled before‐and‐after studies evaluating the dose response of different fixed doses of pitavastatin on blood lipids over a duration of three to 12 weeks in participants of any age with and without cardiovascular disease.
Data collection and analysis
Two review authors independently assessed eligibility criteria for studies to be included, and extracted data. We entered data from RCT and controlled before‐and‐after studies into Review Manager 5 as continuous and generic inverse variance data, respectively. Withdrawals due to adverse effects (WDAE) information was collected from the RCTs. We assessed all included trials using the Cochrane 'Risk of bias' tool under the categories of allocation (selection bias), blinding (performance bias and detection bias), incomplete outcome data (attrition bias), selective reporting (reporting bias), and other potential sources of bias.
Main results
Forty‐seven studies (five RCTs and 42 before‐and‐after studies) evaluated the dose‐related efficacy of pitavastatin in 5436 participants. The participants were of any age with and without cardiovascular disease, and pitavastatin effects were studied within a treatment period of three to 12 weeks. Log dose‐response data over doses of 1 mg to 16 mg revealed strong linear dose‐related effects on blood total cholesterol and LDL cholesterol and triglycerides. There was no dose‐related effect of pitavastatin on blood HDL cholesterol, which was increased by 4% on average by pitavastatin. Pitavastatin 1 mg/day to 16 mg/day reduced LDL cholesterol by 33.3% to 54.7%, total cholesterol by 23.3% to 39.0% and triglycerides by 13.0% to 28.1%. For every two‐fold dose increase, there was a 5.35% (95% CI 3.32 to 7.38) decrease in blood LDL cholesterol, a 3.93% (95% CI 2.35 to 5.50) decrease in blood total cholesterol and a 3.76% (95% CI 1.03 to 6.48) decrease in blood triglycerides. The certainty of evidence for these effects was judged to be high. When compared to other statins for its effect to reduce LDL cholesterol, pitavastatin is about 6‐fold more potent than atorvastatin, 1.7‐fold more potent than rosuvastatin, 77‐fold more potent than fluvastatin and 3.3‐fold less potent than cerivastatin. For the placebo group, there were no participants who withdrew due to an adverse effect per 109 subjects and for all doses of pitavastatin, there were three participants who withdrew due to an adverse effect per 262 subjects.
Authors' conclusions
Pitavastatin lowers blood total cholesterol, LDL cholesterol and triglyceride in a dose‐dependent linear fashion. Based on the effect on LDL cholesterol, pitavastatin is about 6‐fold more potent than atorvastatin, 1.7‐fold more potent than rosuvastatin, 77‐fold more potent than fluvastatin and 3.3‐fold less potent than cerivastatin. There were not enough data to determine risk of withdrawal due to adverse effects due to pitavastatin.
PICO
Plain language summary
Pitavastatin for lowering lipids
Review question
How do different doses of pitavastatin affect fats in our blood?
Background
Pitavastatin is the newest statin on the market. We don't know the effect of different sizes of dose on the amount of fats in our blood.
Search date
We looked at research up to March 2019.
Study characteristics
We looked for high‐quality randomised trials (RCTs) and before‐and‐after studies with pitavastatin in different dose sizes . The trials were between three and 12 weeks long.
Participants in the trials could be of any age and gender, with or without cardiovascular disease.
Key results
People taking 1 mg to 16 mg of pitavastatin per day lowered their LDL cholesterol by 33.3% to 54.7%. The higher the dose, the lower the levels of three measures of cholesterol. The average increase in HDL cholesterol for all doses was 4%.
For lowering LDL cholesterol, pitavastatin is 6‐times stronger than atorvastatin, 1.7‐times stronger than rosuvastatin, 77‐times stronger than fluvastatin and 3.3‐times weaker than cerivastatin.
In the RCTS, no person out of 109 in the placebo group and three out of 262 people in the pitavastatin group dropped out due to adverse effects.
Certainty of the evidence
There is a high level of trust around the effects of pitavastatin on total cholesterol, LDL cholesterol and triglycerides.
Authors' conclusions
Summary of findings
| Low‐density lipoprotein (LDL) cholesterol‐lowering efficacy of pitavastatin | ||||||
| Patient or population: participants with normal or abnormal lipid profiles Settings: ambulatory clinics Intervention: different fixed doses of pitavastatin Comparison: placebo or baseline | ||||||
| pitavastatin dose | Anticipated absolute effects mmol/L (95%CI) | Percentage change from baseline | No of participants | Certainty of the evidence | Comments | |
|---|---|---|---|---|---|---|
| LDL‐cholesterol before exposure to pitavastatina | LDL‐cholesterol after exposure to pitavastatin | |||||
| 1 mg/day | 5.06 (4.39 to 5.74) | 3.38 (3.32 to 3.44) | ‐33.2 (‐34.3 to ‐32.1) | 759 | ⊕⊕⊕⊕ | Effect predicted from log dose‐response curve, ‐33.3% |
| 2 mg/day | 4.51 (4.24 to 4.79) | 2.77 (2.75 to 2.79) | ‐38.65 (‐39.1 to ‐38.2) | 3847 (36) | ⊕⊕⊕⊕ | Effect predicted from log dose‐response curve, ‐38.6% |
| 4 mg/day | 5.04 (4.24 to 5.85) | 2.82 (2.73 to 2.91) | ‐44.0 (‐45.8 to ‐42.3) | 469 (7) | ⊕⊕⊕⊕ | Effect predicted from log dose‐response curve, ‐44.0% |
| CI: Confidence interval | ||||||
| GRADE Working Group grades of evidence | ||||||
| aMean baseline values. | ||||||
| Total cholesterol‐lowering efficacy ofpitavastatin | ||||||
| Patient or population: participants with normal or abnormal lipid profiles Settings: ambulatory clinics Intervention: different fixed doses of pitavastatin Comparison: placebo or baseline | ||||||
| Pitavastatin dose | Anticipated absolute effects mmol/L (95%CI) | Percentage change from baseline | № of participants | Certainty of the evidence | Comments | |
|---|---|---|---|---|---|---|
| Total cholesterol before exposure to pitavastatina | Total cholesterol after exposure to pitavastatin | |||||
| 1 mg/day | 7.24 (6.67 to 7.82) | 5.55 (5.49 to 5.60) | ‐23.4 (‐24.2 to ‐22.7) | 777 | ⊕⊕⊕⊕ | Effect predicted from log dose‐response equation is ‐23.3% |
| 2 mg/day | 6.65 (6.33 to 6.97) | 4.84 (4.81 to 4.87) | ‐27.25 (‐27.65 to ‐26.84) | 2789 | ⊕⊕⊕⊕ | Effect predicted from log dose‐response equation is ‐27.3% |
| 4 mg/day | 7.21 (6.49 to 7.94) | 4.97 (4.87 to 5.07) | ‐31.1 (‐32.4 to ‐29.7) | 477 | ⊕⊕⊕⊕ | Effect predicted from log dose‐response equation is ‐31.2% |
| CI: Confidence interval | ||||||
| GRADE Working Group grades of evidence | ||||||
| aMean baseline values. | ||||||
| Triglyceride‐lowering efficacy of pitavastatin | ||||||
| Patient or population: participants with normal or abnormal lipid profiles Settings: ambulatory clinics Intervention: different fixed doses of pitavastatin Comparison: placebo or baseline | ||||||
| Pitavastatin dose | Anticipated absolute effects mmol/L (95%CI) | Percentage change from baseline | № of participants | Certainty of the evidence | Comments | |
|---|---|---|---|---|---|---|
| Triglycerides before exposure to pitavastatina | Triglycerides after exposure to pitavastatin | |||||
| 1 mg/day | 1.71 (1.27 to 2.15) | 1.49 (1.45 to 1.52) | ‐13.1 (‐15.4 to ‐10.85) | 673 | ⊕⊕⊕⊕ | Effect predicted from log dose‐response equation is ‐13.0% |
| 2 mg/day | 1.88 (1.75 to 2.02) | 1.56 (1.54 to 1.59) | ‐16.8 (‐18.2 to ‐15.5) | 2035 | ⊕⊕⊕⊕ | Effect predicted from log dose‐response equation is ‐16.8% |
| 4 mg/day | 2.04 (1.29 to 2.79) | 1.67 (1.57 to 1.77) | ‐18.0 (‐23.0 to ‐13.0) | 424 (6) | ⊕⊕⊕⊕ | Effect predicted from log dose‐response equation is ‐20.6% |
| CI: Confidence interval | ||||||
| GRADE Working Group grades of evidence | ||||||
| aMean baseline values. | ||||||
Background
Description of the condition
Cardiovascular disease is a major cause of death and disability in the developed world, accounting for more than one‐third of total deaths (Kreatsoulas 2010). In the USA, cardiovascular disease causes one in three reported deaths each year (CDC 2011; Roger 2011). Existing evidence shows a weak association between adverse cardiovascular events and blood concentrations of low‐density lipoprotein (LDL) cholesterol in adults (Grundy 2004). The current recommended treatment for secondary prevention of adverse cardiovascular events consists of diet and lifestyle changes plus drug therapy with the drug class widely known as ’statins’(CTT 2005).
Description of the intervention
Pitavastatin is a new synthetic potent statin that received FDA approval in the USA in 2009. In a long‐term trial, pitavastatin has been reported to increase high‐density lipoprotein (HDL) cholesterol in people with low HDL cholesterol levels < 40 mg/dL (Teramoto 2009). Pitavastatin is rapidly absorbed, reaching peak plasma concentration within one hour and has a half‐life of 11 hours. Pitavastatin is metabolised to a small degree by cytochromes P‐450 2C8 and P‐450 2C9 to 8‐hydroxy‐pitavastatin (M13) (Mukhtar 2005). Statins as a class have been shown in individual randomised controlled trials (RCTs) and systematic reviews of RCTs to reduce mortality and major vascular events in people with occlusive vascular disease (CTT 2005).
How the intervention might work
Pitavastatin acts in the liver by inhibiting an enzyme early in the pathway for cholesterol synthesis, 3‐hydroxy‐3‐methyl‐glutarylcoenzyme A reductase (HMG‐CoA reductase). This enzyme irreversibly converts 3‐hydroxy‐3‐methylglutaryl CoA to mevalonate (Moghadasian 1999). This reaction is the third step in a sequence of reactions resulting in the production of many compounds including cholesterol and its circulating blood derivatives, LDL cholesterol and very low‐density (VLDL) cholesterol (Gaw 2000). The prevailing hypothesis is that statins reduce mortality and morbidity in patients with occlusive vascular disease by reducing liver production of cholesterol and thus causing a reduction in blood LDL cholesterol and a resulting decrease in atherogenesis. However, the HMG CoA reductase enzyme is also responsible for the production of ubiquinone (co‐enzyme Q10), heme a, vitamin D, steroid hormones and many other compounds. It remains possible that the beneficial effects of statins are due to actions other than the reduction of cholesterol. These other actions have been referred to as the pleiotropic effects of statins (Liao 2005).
Why it is important to do this review
Statins are the most widely prescribed class of drugs in the world. Prescribing of statins is increasing, as are average prescribed doses. At the present time, clinicians have only an approximate sense of the different potency of the different statins. Previous systematic reviews have assessed the effect of statins on serum lipids (Bandolier 2004; Edwards 2003; Law 2003; Ward 2007). They have demonstrated that different statins have different potencies in terms of lipid‐lowering and that higher doses of statins cause greater lowering of serum lipids than lower doses (Kellick 1997; Schaefer 2004; Schectman 1996).
However, a systematic assessment of the potency, dose‐response relationship, and variability of effect has only been published for atorvastatin (Adams 2015), rosuvastatin (Adams 2014), fluvastatin (Adams 2016; Adams 2018) and cerivastatin (Adams 2017; Adams 2020). It is possible that pitavastatin will have different potency, slope of the dose‐response or variability of response. Statin‐induced myopathy is common to all statins, and limits the use of statins in many patients. Knowledge of the effects of statins on blood lipids can help us to use them more effectively. We will use the percentage reduction from baseline on the following surrogate markers to describe the dose‐response relationship of the effect of pitavastatin: total cholesterol, LDL cholesterol, HDL cholesterol, and triglycerides (Boekholdt 2012). We will use the results of this review to compare pitavastatin with rosuvastatin, atorvastatin, cerivastatin and fluvastatin. Subsequent reviews of other drugs in the class (i.e. lovastatin, pravastatin, simvastatin) will also be done, in order to compare the results of all the statins.
Objectives
Primary objective
To quantify the effects of various doses of pitavastatin on the surrogate markers: blood LDL cholesterol, total cholesterol, HDL cholesterol and triglycerides in participants with and without cardiovascular disease.
We recognise that the outcomes important to patients are mortality and cardiovascular morbidity, however, that is not the objective of this systematic review. The aim of this review is to examine the pharmacology of pitavastatin by characterising the dose‐related effect and variability of the effect of pitavastatin on surrogate markers and to compare these to the other statins.
Secondary objectives
To quantify the effect of various doses of pitavastatin on withdrawals due to adverse effects.
Methods
Criteria for considering studies for this review
Types of studies
We included randomised placebo‐controlled trials (RCTs) as well as controlled before‐and‐after studies. Before‐and‐after studies were included, because it has been shown that there is no placebo effect of statins on lipid parameters and that a placebo control is therefore not essential (Tsang 2002). We included data from cross‐over trials if the authors reported data for the initial treatment period versus parallel treatment groups followed by an adequate washout period before crossing over to the other active treatments and if data were reported in a similar manner during all treatment periods.
Types of participants
Participants may be of any age, with and without cardiovascular disease. They could have normal lipid parameters or any type of hyperlipidaemia or dyslipidaemia. We included participants with various comorbid conditions, including type 2 diabetes mellitus, hypertension, metabolic syndrome, chronic renal failure or cardiovascular disease.
Types of interventions
Pitavastatin had to be administered at a constant daily dose defined as a single dose per day compared to placebo or alone defined as a single pitavastatin dose per day for a period of three to 12 weeks. We chose this administration time window to allow at least three weeks for a steady‐state effect of pitavastatin to occur and to keep it short enough to minimise participants dropping out. We included studies where pitavastatin was administered at any time during the day. Trials required a washout baseline dietary stabilisation period of at least three weeks, where all previous lipid‐altering medication was withdrawn. This baseline phase ensured participants follow a standard lipid‐regulating diet and helped to stabilise baseline lipid values prior to treatment. In trials where participants were not receiving lipid‐altering medications or dietary supplements before receiving the test drug, we did not require washout baseline dietary stabilisation periods.
Types of outcome measures
Pitavastatin 1 mg/day, 2 mg/day and 4 mg/day were the primary doses as these are the recommended and predominantly prescribed doses.
Lipid parameters: for the RCTs, we presented the mean percentage change from baseline for different doses of pitavastatin minus the mean percentage change from baseline with placebo for LDL cholesterol, total cholesterol, HDL cholesterol and triglycerides. For the before‐and‐after studies, we presented the mean percentage change from baseline of different doses of pitavastatin. RCT data and before‐and‐after study data were combined because it was shown previously (Adams 2014; Adams 2015) that the two study designs yielded similar results (Tsang 2002).
Primary outcomes
LDL cholesterol
Secondary outcomes
-
Total cholesterol
-
HDL cholesterol
-
Triglycerides
-
End of treatment variability (standard deviation (SD)) and coefficient of variation of all lipid measurements for each dose of pitavastatin. It is important to know whether pitavastatin has an effect on the variability of lipid measures and ultimately to compare this with the effect of other statins.
-
Withdrawals due to adverse effects (WDAEs) could only be assessed in the placebo‐controlled trials.
Search methods for identification of studies
Electronic searches
The Cochrane Hypertension Information Specialist searched the following databases without language, publication year or publication status restrictions:
-
The Cochrane Central Register of Controlled Trials (CENTRAL) via the Cochrane Register of Studies (CRS‐Web) (searched 4 March 2019);
-
MEDLINE Ovid (from 1946 onwards), MEDLINE Ovid Epub Ahead of Print, and MEDLINE Ovid In‐Process & Other Non‐Indexed Citations (searched 4 March 2019);
-
Embase Ovid (from 1974 onwards) (searched 4 March 2019);
-
ClinicalTrials.gov (www.clinicaltrials.gov) (searched 4 March 2019);
-
World Health Organization International Clinical Trials Registry Platform (www.who.it.trialsearch) (searched 4 March 2019).
-
Epistemonikos (https://www.epistemonikos.org) searched 4 March 2019).
The Information Specialist modelled subject strategies for databases on the search strategy designed for MEDLINE. We present the search strategies for major databases in Appendix 1.
Systematic searches in the following databases were conducted for before‐and‐after studies in MEDLINE, Embase, CENTRAL, CRS‐Web, ClinicalTrials.gov, World Health Organization International Clinical Trials Registry Platform, and Epistemonikos. No filters were used to retrieve RCTs and before‐and‐after studies because we wanted to retrieve all available documents on the subject.
Searching other resources
-
The Cochrane Hypertension Information Specialist searched the Hypertension Specialised Register segment (which includes searches of MEDLINE, Embase, and Epistemonikos for systematic reviews) to retrieve existing reviews relevant to this systematic review, so that we could scan their reference lists for additional trials. The Specialised Register also includes searches for controlled trials in the Allied and Complementary Medicine Database (AMED), CAB Abstracts & Global Health, CINAHL, and Web of Science.
-
We checked the bibliographies of included studies and any relevant systematic reviews identified for further references to relevant trials.
-
Where necessary, we contacted authors of key papers and abstracts to request additional information about their trials.
We included grey literature by searching other resources.
-
ProQuest Dissertations and Theses (search.proquest.com/pqdtft/).
-
OpenTrials (opentrials.net).
-
US Food and Drug Administration (www.fda.gov/).
-
European Patent Office (worldwide.espacenet.com).
These resources were searched using the following keywords: pitavastatin, alipza, itavastatin, nisvastatin, livalo, livazo, NK‐104.
Data collection and analysis
Selection of studies, data extraction and management and assessment of risk of bias in included studies were all done using Covidence systematic review software (Covidence 2019).
Selection of studies
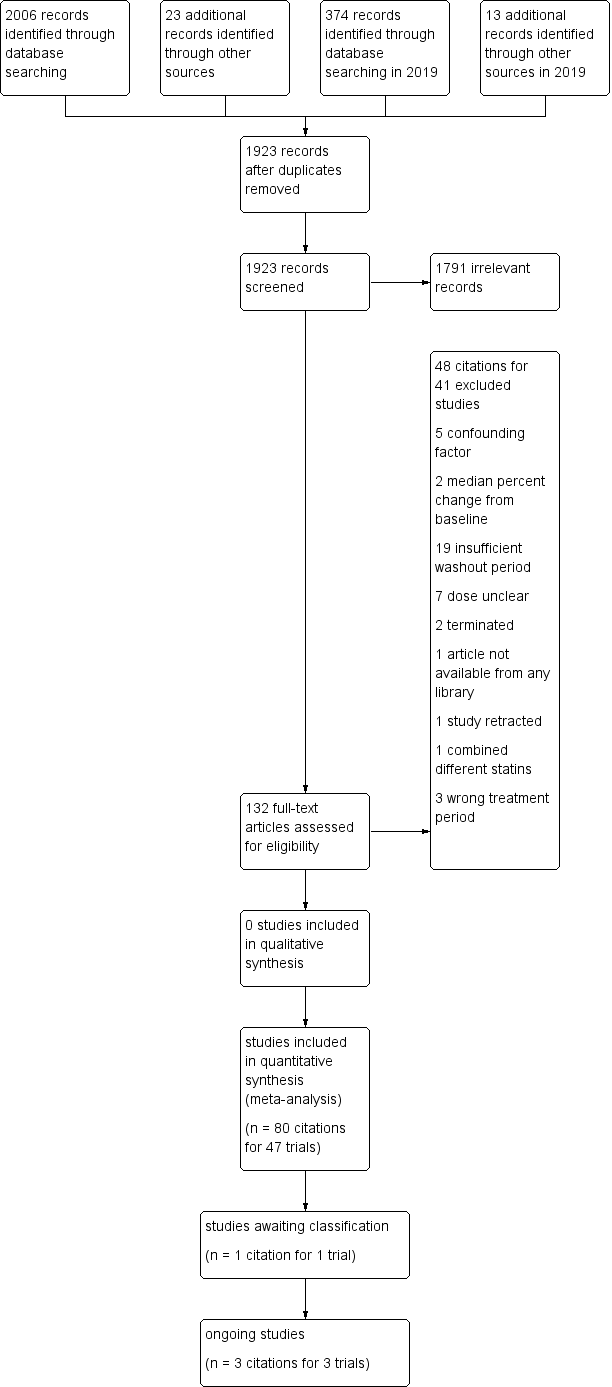
Initial selection of RCTs and before‐and after‐studies involved retrieving and reading the titles and abstracts of each paper found from the electronic search databases or bibliographic citations (see Figure 1 for PRISMA flow diagram (Moher 2009)). Two review authors (SA and NA) analysed the full‐text papers independently, to decide on the studies to be included. We resolved disagreements by recourse to the third review author (JMW). Two review authors (SA and NA) independently extracted the appropriate data from each of the included studies.

Study flow diagram for pitavastatin.
Data extraction and management
We extracted the mean percentage change directly from the data, or we calculated it from the baseline and endpoint values using the calculation found in Appendix 2. We added the calculated data to the Data and analyses section of the review. If the calculated data differed from the given data by more than 10%, the data were not included in the review. We extracted standard deviations (SDs) and standard errors (SEs) from the report or calculated them when possible using the following calculations (Appendix 3). We entered the data from RCT and controlled before‐and‐after studies into Review Manager 5 (RevMan 2020) as continuous and generic inverse variance data, respectively.
Assessment of risk of bias in included studies
We assessed all RCTs and before‐and‐after studies using the Cochrane 'Risk of bias' tool under the categories of allocation (selection bias), blinding (performance bias and detection bias), incomplete outcome data (attrition bias), selective reporting (reporting bias), and other potential sources of bias. We produced 'Risk of bias' tables' as outlined in the Cochrane Handbook for Systematic Reviews of Interventions, Chapter 8 (Higgins 2011). Controlled before‐after‐studies were considered 'high risk' and 'low grading' compared to RCTs. With respect to before‐and‐after studies, having only one study group is considered 'high risk' for random sequence generation and allocation concealment but other features in this study design might be at lower risk, and there may be unidentified differences between the intervention and control groups that may affect changes in the outcome measure. We appreciate that blinding of participants and personnel and blinding of outcome assessment are inappropriate for before‐and‐after studies and that this is a limitation. However, because the lipid parameter measurements are unlikely to be influenced by lack of blinding and were measured in a remote laboratory, they were considered unlikely to be affected by the study design. We were able to use the Cochrane 'Risk of bias' tool for the controlled before‐and‐after studies because there was a lack of difference in the mean differences between the two type of studies (Tsang 2002).
Measures of treatment effect
We analysed the treatment effects as mean difference (MD) for each dose in the RCTs and generic inverse variance for each dose in the before‐and‐after controlled studies separately. In the event that the mean effects from the two study designs were not statistically different, we re‐analysed all efficacy study data using the generic inverse variance to determine the overall weighted treatment effects and their 95% confidence intervals (CIs) for blood total cholesterol, LDL cholesterol, HDL cholesterol, and triglycerides.
Unit of analysis issues
The unit of analysis is the mean value for the people completing the study. We expected follow‐up to be reasonably high for these short‐term studies. The data, however, represented treatment efficacy and not real world effectiveness of pitavastatin on these lipid parameters.
Dealing with missing data
We expected follow‐up to be reasonably high for these short‐term trials. The data, however, represented treatment efficacy and not real‐world effectiveness of pitavastatin on these lipid parameters. When data were missing, we requested them from the authors. The most common type of value that was not reported was the SD of the change.
In the case of a missing SD for the change in lipid parameters, we imputed the SD using the following hierarchy (listed from high to low preference).
-
SD calculated either from the t statistics corresponding to the exact P value reported or from the 95% CI of the mean difference between treatment groups.
-
Average weighted standard deviation of the change from other trials in the review (Furukawa 2006).
Because it is common for the SD to be miscalculated and in order not to overweight studies where it was inaccurately calculated and lower than expected, when SD values were less than 40% of the average weighted SDs, we used the imputed value by the method Furukawa 2006.
Assessment of heterogeneity
The Chi2 test to identify heterogeneity was not appropriate because it has low power when there are few studies but has excessive power to detect clinically unimportant heterogeneity when there are many studies (Higgins 2002). The I² is a better statistic. I² calculates between‐study variance/(between‐study variance + within‐study variance). This measures the proportion of total variation in the estimate of the treatment effect that is due to heterogeneity between studies. This statistic is also independent of the number of studies in the analysis (Higgins 2002).
The I2 was assessed as moderate heterogeneity when ranging from 30% to 50% and high heterogeneity when greater than 50%.
Assessment of reporting biases
We assessed publication bias using funnel plots, as outlined in the Cochrane Handbook for Systematic Reviews of Interventions, Chapter 13 (Page 2019) when there were ten studies or more examining the same outcome (dose).
Data synthesis
We entered all RCTs into Review Manager 5 (RevMan 2020) as mean difference fixed‐effect model data to determine the weighted treatment effect and 95% CIs for blood total cholesterol, LDL cholesterol, HDL cholesterol, and triglycerides. We entered all controlled before‐and‐after studies as generic inverse variance fixed‐effect model data to determine the weighted treatment effect. If the effects in the RCTs were not statistically significantly different from the before‐and‐after studies, we entered all trials for each dose as generic inverse variance to determine the best overall weighted treatment effect for each dose.
We recorded data of each study and dose in GraphPad Prism 4, to yield a weighted least squares analysis based on the inverse of the square of the SE for each lipid parameter, to generate weighted log dose response curves. We entered the number of participants in placebo‐controlled trials, who prematurely withdrew due to at least one adverse effect in Review Manager 5 (RevMan 2020) as dichotomous data for each dose and all combined doses of pitavastatin and reported these as RR versus placebo.
The relative potency of pitavastatin with respect to fluvastatin, atorvastatin, rosuvastatin and cerivastatin, was determined as the ratio of the milligram (mg) amount of pitavastatin to the mg amount of fluvastatin or atorvastatin or rosuvastatin or cerivastatin needed to produce the same specified effect. These values were calculated from the log dose response curves of pitavastatin, fluvastatin, atorvastatin, rosuvastatin and cerivastatin for LDL cholesterol, total cholesterol and triglycerides. The relative potencies were estimated from these dose ratios. The relative potency results are mentioned in the Effects of interventions subsection of the Results section.
Subgroup analysis and investigation of heterogeneity
The main subgroup analyses were the different doses of pitavastatin. We assessed heterogeneity using the I² (Higgins 2002). If an I² value was ≥ 50%, we attempted to identify possible causes for this by carrying out a number of planned subgroup analyses, provided there were sufficient numbers of trials (see below).
We analysed subgroups based on the following factors.
-
Placebo‐controlled trials versus before‐and‐after trials (described above)
-
Men versus women
-
Morning administration time versus evening administration time as defined by the cut‐offs 6:00 am to noon and 6:00 pm to midnight
-
Kowa funded versus non‐Kowa funded trials
-
Twice‐daily versus once‐daily administration
Sensitivity analysis
We conducted sensitivity analyses to assess the effect of different comorbidities, such as familial hyperlipidaemia, on the treatment effect. We compared the treatment effects as generic inverse variance between trials whose subjects were reported to have type IIa or familial hypercholesterolaemia versus trials whose subjects were not reported to have genetic hypercholesterolaemia. Trials were not included in the comparison if the subjects had both familial and non‐familial hypercholesterolaemia. We conducted sensitivity analyses to assess the effect of different methods of dosing, such as twice daily versus single dose, on the treatment effect.
RCTs and before‐and‐after studies were analysed separately in the Data and analyses section.
Summary of findings and assessment of the certainty of the evidence
We used Grading of Recommendations, Assessment, Development and Evaluation (GRADE) approach to assess the certainty of the supporting evidence behind each estimate of treatment effect (Schünemann 2019a; Schünemann 2019b). We presented key findings of the review, including a summary of the amount of data, the magnitude of the effect size and the overall certainty of the evidence, in the summary of findings Table 1, summary of findings Table 2 and summary of findings Table 3. We did not summarise the findings on HDL cholesterol in a 'Summary of findings' table because pitavastatin doses ranging from 1 mg/day to 8 mg/day had no dose‐related effect on HDL cholesterol. There were not enough data to determine risk of withdrawal due to adverse effects due to pitavastatin, therefore, there was no 'Summary of findings' table for WDAEs.
Results
Description of studies
This review included 47 studies involving 5659 intention‐to‐treat participants of whom 5436 (96.1%) participants had at least one lipid parameter measured and of whom 5127 (90.6%) had LDL cholesterol measured. There were 42 before‐and‐after studies, four double‐blind and one single‐blind RCT. The number of placebo and pitavastatin participants were 213 and 5223 respectively. The number of male and female participants reported in 44 of the 47 trials were 2,214 and 2,558, respectively. Participants could be of any age. There were five familial hypercholesterolaemia studies and 11 non‐familial hypercholesterolaemia studies.
Results of the search
Database searching identified 2380 citations and 36 other resource citations giving a total of 2416 records. After the duplicates were removed, 1923 records remained. The number of irrelevant records was 1791. From these remaining records, 132 were obtained as full‐text articles and assessed for eligibility. There were 48 citations for 41 excluded studies with reasons. The final number of included studies was 47 (Figure 1).
Included studies
Eighty citations to 47 studies met the inclusion criteria and had extractable data to evaluate the dose‐related blood lipid‐lowering effect of pitavastatin. Each included study is summarized in the Characteristics of included studies table. The publication languages of the 47 included studies were 40 (85.1%) English, three (6.4%) Japanese, four (8.5%) Chinese. The RCTs consisted of four double‐blind and one single‐blind randomised trial. Trials evaluating the lipid‐altering efficacy of pitavastatin were first published in 2000 and continued to be published until 2018 (Figure 2).
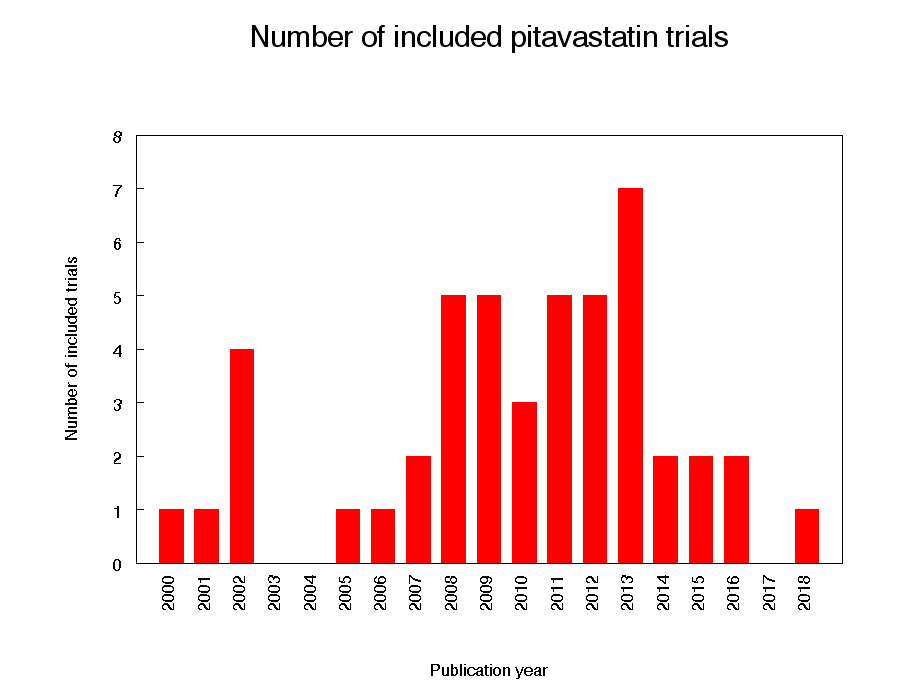
Number of included trials according to publication year
The baseline mean (range) lipid parameters were as follows: total cholesterol, 6.80 mmol/L (4.58 mmol/L to 8.91 mmol/L), 263 mg/dL (177 mg/dL to 344 mg/dL); LDL cholesterol, 4.56 mmol/L (2.97 mmol/L to 6.97 mmol/L), 176 mg/dL (115 mg/dL to 270 mg/dL); HDL cholesterol, 1.38 mmol/L (1.09 mmol/L to 1.71 mmol/L), 53 mg/dL (42 mg/dL to 66 mg/dL) and triglycerides 1.86 mmol/L (0.79 mmol/L to 3.10 mmol/L), 165 mg/dL (70 mg/dL to 274 mg/dL).
Excluded studies
Forty‐one studies were excluded because they did not meet the inclusion criteria. Reasons for exclusion included confounding in which participants were receiving drugs that affect blood lipid concentrations: immunosuppressants such as cyclosporine, protease inhibitors such as ritonavir and indinavir, food supplements such as fish oils, fibrates such as gemfibrozil, fenofibrate and clofibrate, bile acid sequestrants such as cholestyramine, colestipol, colesevelam, the cholesterol absorption inhibitor ezetimibe, the vitamin niacin and the anti‐oxidant drug probucol, inappropriate dosing, inappropriate outcomes such as median percent change from baseline, and inadequate dietary baseline stabilisation period. The reasons for excluding each trial are listed in the Characteristics of excluded studies table.
Risk of bias in included studies
We assessed all included trials using the Cochrane 'Risk of bias' tool under the categories of allocation (selection bias), blinding (performance bias and detection bias), incomplete outcome data (attrition bias), selective reporting (reporting bias), and other potential sources of bias.
Allocation
Random sequence generation bias was judged to be high in the 42 before‐and‐after studies. In the five RCTs, one was judged to have a low risk of bias for random sequence generation, and four were judged to be unclear. Allocation concealment was not applicable to the 42 before‐and‐after studies, but in the 'Risk of bias' tables they were judged to have high risk of bias. Of the five RCTs, two were judged to have a low risk of bias, one single‐blind RCT was judged to have a high risk of bias and two were judged unclear.
Blinding
We judged the risk of performance and detection bias for lipid parameters to be low for all the trials as lipid parameter measurements are unlikely to be influenced by lack of blinding.
We judged the risk of blinding of outcome assessment for lipids to be low for all the trials as lipid parameters were measured in a remote laboratory.
For withdrawals due to adverse effects (WDAEs), in the five RCTs, there was a high risk of detection bias in the single‐blind RCT and in two double‐blind RCTs. It was judged unclear in the other two.
Incomplete outcome data
Incomplete outcome reporting leading to attrition bias was not a problem in this review as few participants were lost to follow‐up and were balanced across the groups in the RCTs. Overall, 96.1% of the participants completed the treatment.
Selective reporting
Out of 47 trials, 45 (95.7%) reported the primary lipid outcome LDL‐C, thus selection bias was not a potential source of bias for this outcome.
Out of five RCTs, only three (60%) reported WDAEs. The trials that did not report these could have deliberately not done so because WDAEs were increased. Therefore, selective reporting bias was judged an important source of bias for this outcome. See 'Risk of bias' tables in Characteristics of included studies, and for the overall risk of bias.
Other potential sources of bias
The main other potential source of bias is industry funding. Out of the 47 trials, 15 (32%) reported funding by industry, 2 (4.4%) reported partial funding by industry and government, 7 (14.9%) reported no industry funding and in 23 (48.9%) trials the source of funding was not reported. Out of 15 industry funded trials, 10 (67%) were funded by Kowa, marketers of pitavastatin and 5 (33%) was funded by another pharmaceutical company. The Kowa‐funded trials might be biased in favour of pitavastatin and would be expected to overestimate the treatment effect while trials funded by rival pharmaceutical companies might be biased against pitavastatin and be expected to underestimate the treatment effect. In trials where the source of funding was not reported, bias could be for or against pitavastatin. Kowa‐funded versus non‐Kowa‐funded LDL cholesterol efficacy data were available for the doses of 2 mg/day and 4 mg/day. These data were analysed separately using the generic inverse variance fixed‐effect model in RevMan 5. The sensitivity analysis revealed that the lipid‐lowering efficacy of pitavastatin in Kowa‐funded versus non‐Kowa‐funded trials was not different for the doses analysed; 2 mg/day (‐38.8% vs ‐39.5%; P = 0.43) and 4 mg/day (‐39.5% vs ‐35.2%; P = 0.36). Assessment for publication bias was done by reviewing the funnel plots for all lipid outcomes with 10 or more trials. None of these funnel plots suggested publication bias.
The determination of lipids in the blood samples was done by laboratories not connected to the trial personnel or participants, therefore, we judged the overall risk of bias to be low for both the placebo‐controlled RCTs and for the before‐and‐after studies.
Effects of interventions
See: Summary of findings 1 Low‐density lipoprotein (LDL) cholesterol‐lowering efficacy of pitavastatin; Summary of findings 2 Total cholesterol‐lowering efficacy of pitavastatin; Summary of findings 3 Triglyceride‐lowering efficacy of pitavastatin
See: Summary of findings table 1, Summary of findings table 2 and Summary of findings table 3, for the LDL cholesterol‐lowering, total cholesterol‐lowering, and triglyceride‐lowering efficacy of pitavastatin for all trials. Relative potencies of pitavastatin with respect to fluvastatin, atorvastatin, rosuvastatin and cerivastatin for LDL cholesterol, total cholesterol and triglycerides were determined. For LDL cholesterol, pitavastatin is 77‐fold more potent than fluvastatin, 6.2‐fold more potent than atorvastatin, 1.7‐fold more potent than rosuvastatin and 3.3‐fold less potent than cerivastatin. For total cholesterol, pitavastatin is 71‐fold more potent than fluvastatin, 5.4‐fold more potent than atorvastatin, 1.8‐fold more potent than rosuvastatin and 3.3‐fold less potent than cerivastatin. For triglycerides, pitavastatin is 31‐fold more potent than fluvastatin, 2.8‐fold more potent than atorvastatin, 3.2‐fold more potent than rosuvastatin and 5.6‐fold less potent than cerivastatin.
Overall efficacy of pitavastatin
Values from all data describing the efficacy of pitavastatin to lower the lipid parameters from RCT and before‐and‐after studies from the Data and analyses section were entered as generic inverse variance data separately into GraphPad Prism 4 to yield log dose‐response curves for placebo and before‐and after studies. To compare slope results of RCT versus before‐and‐after studies, t‐tests from the formula t = (Placebo Slope‐Before‐and‐After Slope)/SQRT(SE2placebo slope + SE2before-and-after slope) were performed from the slopes and standard errors of the curves for total cholesterol, LDL cholesterol, HDL cholesterol and triglycerides. The results showed that there were no differences between RCTs and before‐and‐after studies for total cholesterol (P = 0.2851), LDL cholesterol (P = 0.2723), HDL cholesterol (P = 0.406) and triglycerides (P = 0.686). This demonstrates that the two trial designs provide similar estimates of the lipid‐lowering efficacy of pitavastatin.
In addition, two‐tailed one sample t‐tests were performed from the RCTs to test for the difference between placebo mean effects and zero. The results of these tests demonstrated that the placebo means were not different from zero: total cholesterol: ‐2.53 (95% CI ‐7.41 to 2.36) P = 0.13; LDL cholesterol: 8.0 (95% CI ‐4.23 to 4.51) P = 0.95; HDL cholesterol 1.7 (95% CI ‐3.9 to 7.3) P = 0.23; and triglycerides: 1.6 (95% CI ‐4.0 to 7.2) P = 0.75. The evidence of lack of a placebo effect provided further justification for combining all the trials to determine the overall efficacy.
Validation for combining the results from the two trial designs has been previously shown in the atorvastatin, rosuvastatin, fluvastatin and cerivastatin reviews (Adams 2014; Adams 2015; Adams 2018; Adams 2020).
Combining the results from the two trial designs was done by entering all data into RevMan 5 using the generic inverse variance model outside of this review (data and analysis are not shown). The mean parameters from this analysis are summarised in Table 1. The results from the two trial designs were combined because the mean treatment effects were not statistically different between RCTs and before‐and‐after studies.
| Pitavastatin dose mg/day | 1 | 2 | 4 | 8 | 16 |
| Mean percentage change from control of LDL‐Ca (95% confidence interval) | ‐33.2 (‐34.3 to ‐32.1) | ‐38.65 (‐39.1 to ‐38.2) | ‐44.0 (‐45.8 to ‐42.3) | ‐48.7 (‐52.4 to ‐45.0) | ‐54.5 (‐59.4 to ‐49.6) |
| Mean percentage change from control of total cholesterol (95% confidence interval) | ‐23.4 (‐24.2 to ‐22.7) | ‐27.25 (‐27.65 to ‐26.84) | ‐31.1 (‐32.4 to ‐29.7) | ‐37.0 (‐41.4 to ‐32.6) | |
| Mean percentage change from control of triglycerides (95% confidence interval) | ‐13.1 (‐15.4 to ‐10.85) | ‐16.8 (‐18.2 to ‐15.5) | ‐18.0 (‐23.0 to ‐13.0) | ‐32.9 (‐45.0 to ‐20.8) |
aLDL‐C: low‐density lipoprotein cholesterol
Primary Outcome
LDL cholesterol
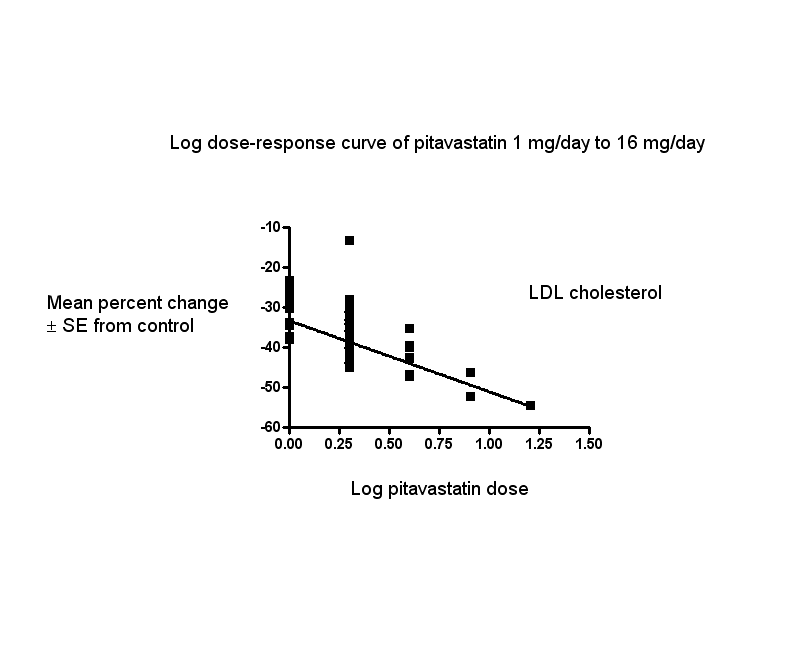
In total, 44/47 (93.6%) trials and 5127/5659 (90.6%) participants contributed to the LDL cholesterol data analysis. The effect of different doses of pitavastatin on LDL cholesterol are shown in the Data and analyses section (Analysis 1.1; Analysis 1.5; Analysis 2.1; Analysis 2.5; Analysis 3.1; Analysis 3.5; Analysis 4.1; Analysis 5.1). The analysis for LDL cholesterol yielded the log dose‐response straight‐line equation, y = ‐17.78 log(x) ‐ 33.27. This equation provides the best estimate of the mean reductions in blood LDL cholesterol from baseline for pitavastatin doses ranging from 1 mg/day to 16 mg/day as it uses all the available data. Using this formula, the calculated reductions in blood LDL cholesterol for doses of 1 mg per day to 16 mg per day were from 33.3% to 54.7%. For every two‐fold dose increase, there was a 5.35% (95% CI 3.32 to 7.38) percentage decrease in blood LDL cholesterol (Figure 3).

Log dose pitavastatin response curve for LDL cholesterol
Values represent the results of each trial for each dose comparison. The standard error bars cannot be seen because they all lie within the points
Secondary Outcomes
Total cholesterol
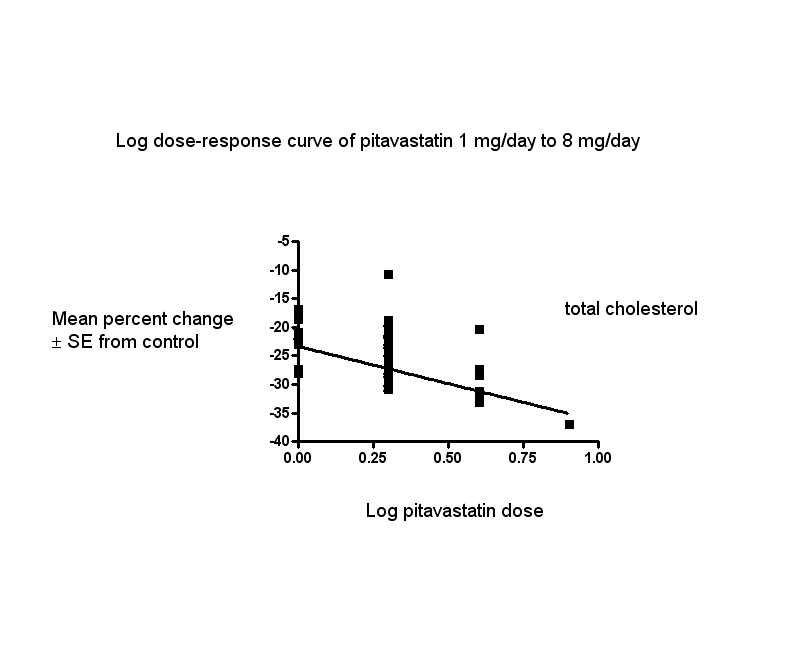
In total, 40/47 (85.1%) trials and 3836/5659 (67.8%) participants contributed to the total cholesterol data analysis. The effect of different doses of pitavastatin on total cholesterol are shown in the Data and analyses section (Analysis 1.2; Analysis 1.6; Analysis 2.2; Analysis 2.6; Analysis 3.2; Analysis 3.6; Analysis 4.2). The analysis for total cholesterol yielded the log dose‐response straight‐line equation, y = ‐13.04 log(x) ‐23.34. This equation provides the best estimate of the mean reductions in blood total cholesterol from baseline for pitavastatin doses ranging from 1 mg/day to 8 mg/day as it uses all the available data. Using this formula, the calculated reductions in blood total cholesterol for doses of 1 mg per day to 8 mg per day were from 23.3% to 35.1%. For every two‐fold dose increase, there was a 3.93% (95% CI 2.35 to 5.50) percentage decrease in blood total cholesterol (Figure 4).

Log dose pitavastatin response curve for total cholesterol
Values represent the results of each trial for each dose comparison. The standard error bars cannot be seen because they all lie within the points
HDL cholesterol
In total, 40/47 (85.1%) trials and 3230/5659 (57.1%) participants contributed to the HDL cholesterol data analysis. The effect of different doses of pitavastatin on HDL cholesterol are shown in the Data and analyses section (Analysis 1.3; Analysis 1.7; Analysis 2.3; Analysis 2.7; Analysis 3.3; Analysis 3.7; Analysis 4.3). The GraphPad Prism 4 analysis showed that pitavastatin doses ranging from 0.1 mg/day to 0.8 mg/day had no dose‐related effect on blood HDL cholesterol. All doses of pitavastatin caused a small increase in HDL cholesterol. When all trials and doses were pooled using generic inverse variance, the magnitude of the increase was 4.11% (95% CI 3.61 to 4.61).
Triglycerides
In total, 32/47 (68.1%) trials and 2979/5659 (52.6%) participants contributed to the triglyceride data analysis. The effect of different doses of pitavastatin on triglycerides are shown in the Data and analyses section (Analysis 1.4; Analysis 1.8; Analysis 2.4; Analysis 2.8; Analysis 3.4; Analysis 3.8; Analysis 4.4). The analysis for triglycerides yielded the log dose‐response straight‐line equation, y = ‐12.48 log(x) ‐ 13.04. This equation provides the best estimate of the mean reductions in blood triglycerides from baseline for pitavastatin doses ranging from 1 mg/day to 8 mg/day as it uses all the RCT data. Using this formula, the calculated reductions in total blood triglycerides for doses of 1 mg /day to 8 mg per day were from 13.0% to 24.3%. For every two‐fold dose increase, there was a 3.76% (95% CI 1.03 to 6.48) percentage decrease in blood triglycerides (Figure 5).

Log dose pitavastatin response curve for triglycerides
Values represent the results of each trial for each dose comparison. The standard error bars cannot be seen because they all lie within the points
End of treatment variability
Pitavastatin did not significantly affect the end‐of‐treatment variabilities of total cholesterol, LDL cholesterol, HDL cholesterol and triglycerides.
Withdrawal data
Three (60%) of the five RCTs reported WDAEs during the three to 12‐week treatment period. In one trial, no participant discontinued treatment due to adverse effects or died during the study, therefore, risk reduction was not estimable. A pooled estimate for all doses compared to placebo showed a risk ratio (RR) of 1.35 (95% CI 0.15 to 12.04) for WDAEs in these short‐term trials (Analysis 6.1). There were not enough data to determine risk of withdrawal due to adverse effects due to pitavastatin. For the placebo group, there were 0 out of 109 participants who withdrew due to an adverse effect and, for all doses of pitavastatin, there were 3 out of 262 participants who withdrew due to an adverse effect.
Subgroup Analyses
Male versus female participant data were available for the 1 mg/day, 2 mg/day and 4 mg/day doses. These data were analysed separately for LDL cholesterol‐lowering efficacy using the generic inverse variance fixed‐effect model in RevMan 5 outside of this review. The subgroup analysis revealed that the efficacy of pitavastatin was greater in females than in males. The efficacy for the 1 mg/day dose (male versus female) was: (‐30.61 vs ‐31.70; P = 0.49), for the 2 mg/day dose (male versus female) was: (‐36.05 vs ‐40.91; P < 0.0001) and for the 4 mg/day dose (male versus female) was: (‐43.64 vs ‐45.30; P = 0.17).
Morning versus evening dose administration data were available for the 1 mg/day, 2 mg/day, and the 4 mg/day doses. These data were analysed separately for LDL cholesterol‐lowering efficacy using the generic inverse variance fixed‐effect model in RevMan 5 outside of this review. The subgroup analysis revealed that the efficacy of pitavastatin was greater when pitavastatin was administered in the evening versus when administered in the morning. The efficacy for the 1 mg/day dose (morning versus evening) was: (‐25.91 vs ‐33.78; P = 0.0002) for the 2 mg/day dose (morning versus evening) was: (‐29.20 vs ‐39.07; P < 0.0007) and for the 4 mg/day dose (morning versus evening) was: (‐39.50 vs ‐45.08; P = 0.08). Comparison of twice‐daily administration versus single‐dose comparison was not possible because no trial provided the appropriate data.
Sensitivity Analyses
Familial versus non‐familial hypercholesterolaemia participant data were available for the doses 1 mg/day, 2 mg/day, and 4 mg/day. These data were analysed separately for LDL cholesterol‐lowering efficacy using the generic inverse variance fixed‐effect model in RevMan 5. There was no difference in the efficacy of pitavastatin between familial versus non‐familial hypercholesterolaemia participants. The efficacy for the 1 mg/day dose (familial versus non‐familial) was: (‐25.91 vs ‐28.02; P = 0.41), for the 2 mg/day dose (familial versus non‐familial) was: (‐37.00 vs ‐37.31; P = 0.85) and for the 4 mg/day dose (familial versus non‐familial) was: (‐39.50 vs ‐41.77; P = 0.49).
Discussion
Summary of main results
Daily pitavastatin intake is effective in lowering LDL cholesterol concentrations and does so in a predictable, dose‐related manner. The Summary of findings table 1 documents the effect of pitavastatin on LDL cholesterol over the dose range of 1 to 4 mg/day, the range for which this systematic review has the most data. Over this range, LDL cholesterol is decreased by 33.2% to 44.0% (Summary of findings table 1). These large reductions reflect a reduction in synthesis of cholesterol by the liver and indicate that liver HMG CoA reductase is being inhibited by approximately two‐fifths over this dose range. This has significant implications beyond circulating LDL cholesterol, as LDL cholesterol is only one of many important biochemical products that are produced by the HMG CoA reductase pathway. Those other products, including co‐enzyme Q10, heme A, vitamin D, steroid hormones and many other compounds are also likely to be reduced by about 40% over this dose range. It is important to recognise that the long‐term consequences of reduction of these products is presently unknown.
In the Data and analyses section, it can be seen that there are more trials and data with the before‐and‐after design than from placebo‐controlled trials. Slope results from placebo‐controlled versus before‐and‐after studies showed no differences for all outcomes, therefore, the effect of pitavastatin on the lipid parameters is similar with the two different trial designs. This, plus the demonstration that the placebo effect was not different from zero, justified using generic inverse variance and displaying the combined estimates in Table 1. In addition, all trial data were entered into GraphPad Prism 4 to calculate the regression lines shown in Figure 3, Figure 4 and Figure 5. The overall efficacy results from GraphPad Prism 4 provide the best estimate of the treatment effect, because they are based on a regression line calculated from all the data for all the doses. The estimates of the average treatment effect from the regression lines are similar to the mean value for all the data for each dose (see summary of findings Table 1). It was important that we used before‐and‐after studies for this review as we would have only had five RCTs if we limited it to placebo‐controlled trials.
In this review, it was established, using regression analysis, that there was a correlation between the baseline value and pitavastatin effect on LDL cholesterol when the effect was expressed as absolute change from baseline (P < 0.0001). There was no correlation between the baseline value and the pitavastatin effect when the effect was expressed as percent reduction from baseline (P = 0.3140). This finding provides support for the fact that systematic reviews reporting the effect of statins on absolute changes in lipid parameters are problematic and potentially misleading.
What is the effect of pitavastatin on end‐of‐treatment variability?
End‐of‐treatment variabilities of pitavastatin and placebo were compared to determine the effect of pitavastatin on variability of blood lipids when expressed as a coefficient of variation. Compared with placebo, pitavastatin at all doses did not affect the coefficient of variation of blood total cholesterol, LDL cholesterol, HDL cholesterol or triglycerides. However, the fact that we only had five trials to test this makes this a weak finding.
Does pitavastatin increase withdrawals due to adverse effects?
There were not enough data in the review to determine risk of withdrawal due to adverse effects due to pitavastatin.
Pitavastatin 8 mg/day, 16 mg/day, 32 mg/day and 64 mg/day from phase 2 and phase 3 clinical trials had rates of discontinuation of 4.6%, 19.6%, 11.8% and 36.4% respectively due to treatment‐emergent adverse effects. In these phase 2 trials, nine subjects developed rhabdomyolysis: two cases for pitavastatin 8 mg/day, one case for 16 mg/day, three for 32 mg/day and three for 64 mg/day (Chowdhury 2009).
Symptomatic myopathy occurred in 8.6% of participants and asymptomatic myopathy in 27.5% of participants. Pitavastatin doses of 8 mg and above were not well tolerated. These were associated with an increased rate of SAEs, of treatment discontinuations, of CK, AST and ALT elevations and of haematuria (Australian Government 2013) and, therefore, it is important to not exceed 4 mg/day.
Overall completeness and applicability of evidence
This review included 47 trials with 5436 out of 5659 intention‐to‐treat participants of which 5127 participants had their LDL cholesterol reported. Even though the number of participants in the review was small, the amount of data retrieved provided us with robust evidence of the dose‐related lipid‐lowering effects of pitavastatin. Practitioners can use this evidence to calculate the expected effect of doses of pitavastatin commonly utilised in society. It is likely that further research will change these estimates appreciably. There was a fair amount of heterogeneity in many of the estimates and it is possible that this was due to differences in the populations being studied (e.g. gender or genetic differences) (Thompson 2005). To explore this, where it was possible, we compared the effect of pitavastatin in males and females. A subgroup analysis comparing male versus female subject data was available for the doses 1, 2 and 4 mg/day and suggested that efficacy of pitavastatin was greater in females than in males. A greater effect in females than males could be because females on average weigh less than males. This subgroup analysis in the atorvastatin, rosuvastatin and cerivastatin reviews also showed a larger effect in females than males (Adams 2014; Adams 2015; Adams 2020). In the fluvastatin review, there was no statistically significant difference of the effect in males and females (Adams 2018).
When we did the review, it was unknown whether the time of pitavastatin administration was important with respect to lipid‐lowering. A subgroup analysis comparing morning versus evening dose administration was available for the doses 1 mg/day, 2 mg/day and 4 mg/day. This comparison showed that the LDL‐lowering efficacy of pitavastatin was greater when pitavastatin was administered in the evening than when administered in the morning. This suggests that evening administration is preferred for this statin and it is similar to simvastatin where evening dose administration is recommended. This finding is clearly worth exploring further as, at the present time, the pitavastatin product monograph does not recommend a time of administration.
Familial versus non‐familial hypercholesterolaemia participant data were available for a sensitivity analysis of the pitavastatin doses of 1 mg/day, 2 mg/day and 4 mg/day. These data were analysed separately for LDL cholesterol‐lowering efficacy using the generic inverse variance fixed‐effect model in RevMan 5. There was no difference in the efficacy of pitavastatin between familial versus non‐familial hypercholesterolaemia participants. This finding is consistent with what was found in the rosuvastatin and cerivastatin reviews (Adams 2014; Adams 2020). However, it is in contrast to the findings in the atorvastatin and fluvastatin reviews where the LDL‐lowering effect was less in participants with familial hypercholesterolaemia (Adams 2015; Adams 2018).
The profound and relatively consistent effect of pitavastatin on lipid parameters shown in this review is probably appreciated by clinicians who treat patients with these drugs. Investigators involved in placebo‐controlled RCTs are likely to know whether participants are taking statins or not. Knowledge of the lipid parameters almost certainly leads to loss of blinding in statin RCTs. The present review calls attention to that problem and efforts to prevent this loss of blinding are needed in future statin RCTs (Higgins 2011).
Quality of the evidence
The summary of all ’Risk of bias’ tools for the lipid effects suggests a high risk of bias (Figure 6). However, the lipid parameter outcomes are probably relatively resistant to bias. If anything, a high risk of bias would lead to an overestimate of the lipid‐lowering effects rather than an underestimate. However, because of the objectivity of the measurement of the lipid parameters, we think that the lipid measures effects are reasonably accurate. This view is strengthened by the fact that we could not show evidence of funding bias. Comparing Kowa‐funded trials with non‐Kowa‐funded trials showed no differences. Furthermore, review of funnel plots did not suggest any publication bias.

Risk of bias summary: review authors' judgements about each risk of bias item for each included study.
There were not enough data to determine risk of withdrawal due to adverse effects due to pitavastatin.
Potential biases in the review process
Combining the placebo‐controlled trials with the before‐and‐after studies is a limitation of the review. We have explained why the increased risk of bias associated with the before‐and‐after design is less in this instance because the lipid parameters were measured in remote laboratories. Another limitation of this review is that many trials did not report standard deviations for the lipid‐lowering effects. In those trials, the standard deviation of the per cent change from baseline of the blood lipid parameters were imputed as the average of this parameter from trials that reported it. These values were determined by the method of (Furukawa 2006), from t‐statistics corresponding to the exact P values reported or from the 95% CI of the mean difference between treatment groups. Such imputation might weight some studies more or less; however, this has been shown in other reviews to not have much effect on the estimate of the effect size (Heran 2008; Musini 2014). Another limitation is that, in this review, few studies were available to demonstrate the lipid‐lowering effect of pitavastatin at doses of < 1 mg/day and > 16 mg/day. We did not downgrade the certainty of evidence due to heterogeneity of LDL cholesterol because the confidence intervals for the pooled result estimates were narrow.
Agreements and disagreements with other studies or reviews
The best estimate of the mean per cent reduction in blood LDL cholesterol for any dose of pitavastatin can be calculated from our log dose‐response equation. Using this equation y = ‐17.78 log(x) ‐ 33.27, a pitavastatin dose of 2 mg/day reduces LDL cholesterol by an average of 38.6%. This is similar to the estimate of 36% reduction in LDL cholesterol in 527 participants in Edwards 2003.
Comparison of the efficacy of pitavastatin with other statins
The greatest value in doing this type of review is the ability to compare pitavastatin to other statins. At present, we can compare it to atorvastatin, rosuvastatin, fluvastatin and cerivastatin, which have been reviewed using the same protocol. The most important finding in this review is that the slope of the dose‐response effect for pitavastatin on LDL cholesterol, total cholesterol and triglycerides is not different from the slope of the dose‐response curves for atorvastatin (Adams 2015), rosuvastatin (Adams 2014), fluvastatin (Adams 2018) and cerivastatin (Adams 2020). This provides some confirmation that the five statins are all causing lipid‐lowering by a similar mechanism. However, it also demonstrates that pitavastatin is more potent than fluvastatin, atorvastatin, rosuvastatin and less potent than cerivastatin at lowering LDL cholesterol: pitavastatin is 77‐fold more potent than fluvastatin, 6.2‐fold more potent than atorvastatin and 1.7‐fold more potent than rosuvastatin. Pitavastatin is 3.3‐fold less potent than cerivastatin but, since cerivastatin is no longer on the market, pitavastatin is the most potent statin currently on the market.
When we compare pitavastatin 1 mg/day which reduces LDL cholesterol by 33.3% on average with the other statins, the dose of fluvastatin, atorvastatin, rosuvastatin and cerivastatin to achieve the same reduction in LDL cholesterol is 106 mg/day, 7.7 mg/day, 1.9 mg/day and 0.3 mg/day, respectively.
When the statins effect in the recommended dose range are compared for their effect to lower LDL cholesterol, pitavastatin has a greater effect than fluvastatin and cerivastatin and a lesser effect than atorvastatin and rosuvastatin.
Pitavastatin 1 mg to 4 mg (33% to 44%) decrease in LDL cholesterol
Fluvastatin 20 mg to 80 mg (21 to 33%) decrease in LDL cholesterol
Cerivastatin 0.1 mg to 0.8 mg (23% to 41%) decrease in LDL cholesterol
Atorvastatin 10 mg to 80 mg (37% to 52%) decrease in LDL cholesterol
Rosuvastatin 5 mg to 40 mg (41% to 55%) decrease in LDL cholesterol
It has been suggested that pitavastatin may be better at increasing HDL than the other statins (Teramoto 2009). This review demonstrates that that is not the case. The average increase in HDL for all doses of pitavastatin was 4.1%. This is not greater than the other statins which, on average, increase HDL by 4.0% for atorvastatin, 5.0% for cerivastatin, 3.7% for fluvastatin and 7.3% for rosuvastatin.
Study flow diagram for pitavastatin.

Number of included trials according to publication year
Log dose pitavastatin response curve for LDL cholesterol
Values represent the results of each trial for each dose comparison. The standard error bars cannot be seen because they all lie within the points
Log dose pitavastatin response curve for total cholesterol
Values represent the results of each trial for each dose comparison. The standard error bars cannot be seen because they all lie within the points

Log dose pitavastatin response curve for triglycerides
Values represent the results of each trial for each dose comparison. The standard error bars cannot be seen because they all lie within the points

Risk of bias summary: review authors' judgements about each risk of bias item for each included study.

Comparison 1: 1 mg vs control, Outcome 1: LDL cholesterol RCTs

Comparison 1: 1 mg vs control, Outcome 2: Total cholesterol RCTs

Comparison 1: 1 mg vs control, Outcome 3: HDL cholesterol RCTs

Comparison 1: 1 mg vs control, Outcome 4: Triglycerides RCTs

Comparison 1: 1 mg vs control, Outcome 5: LDL‐cholesterol non‐RCTs

Comparison 1: 1 mg vs control, Outcome 6: Total cholesterol non‐RCTs

Comparison 1: 1 mg vs control, Outcome 7: HDL‐cholesterol non‐RCTs

Comparison 1: 1 mg vs control, Outcome 8: Triglycerides non‐RCTs

Comparison 1: 1 mg vs control, Outcome 9: WDAE

Comparison 2: 2 mg vs control, Outcome 1: LDL cholesterol RCTs

Comparison 2: 2 mg vs control, Outcome 2: Total cholesterol RCTs

Comparison 2: 2 mg vs control, Outcome 3: HDL cholesterol RCTs

Comparison 2: 2 mg vs control, Outcome 4: Triglycerides RCTs

Comparison 2: 2 mg vs control, Outcome 5: LDL‐cholesterol non‐RCTs

Comparison 2: 2 mg vs control, Outcome 6: Total cholesterol non‐RCTs

Comparison 2: 2 mg vs control, Outcome 7: HDL‐cholesterol non‐RCTs

Comparison 2: 2 mg vs control, Outcome 8: Triglycerides non‐RCTs

Comparison 2: 2 mg vs control, Outcome 9: WDAE

Comparison 3: 4 mg vs control, Outcome 1: LDL‐cholesterol RCTs

Comparison 3: 4 mg vs control, Outcome 2: Total cholesterol RCTs

Comparison 3: 4 mg vs control, Outcome 3: HDL cholesterol RCTs

Comparison 3: 4 mg vs control, Outcome 4: Triglycerides RCTs

Comparison 3: 4 mg vs control, Outcome 5: LDL‐cholesterol non‐RCTs

Comparison 3: 4 mg vs control, Outcome 6: Total cholesterol non‐RCTs

Comparison 3: 4 mg vs control, Outcome 7: HDL‐cholesterol non‐RCTs

Comparison 3: 4 mg vs control, Outcome 8: Triglycerides non‐RCTs

Comparison 3: 4 mg vs control, Outcome 9: WDAE

Comparison 4: 8 mg vs control, Outcome 1: LDL cholesterol RCTs

Comparison 4: 8 mg vs control, Outcome 2: Total cholesterol RCTs

Comparison 4: 8 mg vs control, Outcome 3: HDL cholesterol RCTs

Comparison 4: 8 mg vs control, Outcome 4: Triglycerides RCTs

Comparison 5: 16 mg vs control, Outcome 1: LDL cholesterol RCTs

Comparison 6: All doses of pitavastatin vs placebo, Outcome 1: WDAE
| Low‐density lipoprotein (LDL) cholesterol‐lowering efficacy of pitavastatin | ||||||
| Patient or population: participants with normal or abnormal lipid profiles Settings: ambulatory clinics Intervention: different fixed doses of pitavastatin Comparison: placebo or baseline | ||||||
| pitavastatin dose | Anticipated absolute effects mmol/L (95%CI) | Percentage change from baseline | No of participants | Certainty of the evidence | Comments | |
|---|---|---|---|---|---|---|
| LDL‐cholesterol before exposure to pitavastatina | LDL‐cholesterol after exposure to pitavastatin | |||||
| 1 mg/day | 5.06 (4.39 to 5.74) | 3.38 (3.32 to 3.44) | ‐33.2 (‐34.3 to ‐32.1) | 759 | ⊕⊕⊕⊕ | Effect predicted from log dose‐response curve, ‐33.3% |
| 2 mg/day | 4.51 (4.24 to 4.79) | 2.77 (2.75 to 2.79) | ‐38.65 (‐39.1 to ‐38.2) | 3847 (36) | ⊕⊕⊕⊕ | Effect predicted from log dose‐response curve, ‐38.6% |
| 4 mg/day | 5.04 (4.24 to 5.85) | 2.82 (2.73 to 2.91) | ‐44.0 (‐45.8 to ‐42.3) | 469 (7) | ⊕⊕⊕⊕ | Effect predicted from log dose‐response curve, ‐44.0% |
| CI: Confidence interval | ||||||
| GRADE Working Group grades of evidence | ||||||
| aMean baseline values. | ||||||
| Total cholesterol‐lowering efficacy ofpitavastatin | ||||||
| Patient or population: participants with normal or abnormal lipid profiles Settings: ambulatory clinics Intervention: different fixed doses of pitavastatin Comparison: placebo or baseline | ||||||
| Pitavastatin dose | Anticipated absolute effects mmol/L (95%CI) | Percentage change from baseline | № of participants | Certainty of the evidence | Comments | |
|---|---|---|---|---|---|---|
| Total cholesterol before exposure to pitavastatina | Total cholesterol after exposure to pitavastatin | |||||
| 1 mg/day | 7.24 (6.67 to 7.82) | 5.55 (5.49 to 5.60) | ‐23.4 (‐24.2 to ‐22.7) | 777 | ⊕⊕⊕⊕ | Effect predicted from log dose‐response equation is ‐23.3% |
| 2 mg/day | 6.65 (6.33 to 6.97) | 4.84 (4.81 to 4.87) | ‐27.25 (‐27.65 to ‐26.84) | 2789 | ⊕⊕⊕⊕ | Effect predicted from log dose‐response equation is ‐27.3% |
| 4 mg/day | 7.21 (6.49 to 7.94) | 4.97 (4.87 to 5.07) | ‐31.1 (‐32.4 to ‐29.7) | 477 | ⊕⊕⊕⊕ | Effect predicted from log dose‐response equation is ‐31.2% |
| CI: Confidence interval | ||||||
| GRADE Working Group grades of evidence | ||||||
| aMean baseline values. | ||||||
| Triglyceride‐lowering efficacy of pitavastatin | ||||||
| Patient or population: participants with normal or abnormal lipid profiles Settings: ambulatory clinics Intervention: different fixed doses of pitavastatin Comparison: placebo or baseline | ||||||
| Pitavastatin dose | Anticipated absolute effects mmol/L (95%CI) | Percentage change from baseline | № of participants | Certainty of the evidence | Comments | |
|---|---|---|---|---|---|---|
| Triglycerides before exposure to pitavastatina | Triglycerides after exposure to pitavastatin | |||||
| 1 mg/day | 1.71 (1.27 to 2.15) | 1.49 (1.45 to 1.52) | ‐13.1 (‐15.4 to ‐10.85) | 673 | ⊕⊕⊕⊕ | Effect predicted from log dose‐response equation is ‐13.0% |
| 2 mg/day | 1.88 (1.75 to 2.02) | 1.56 (1.54 to 1.59) | ‐16.8 (‐18.2 to ‐15.5) | 2035 | ⊕⊕⊕⊕ | Effect predicted from log dose‐response equation is ‐16.8% |
| 4 mg/day | 2.04 (1.29 to 2.79) | 1.67 (1.57 to 1.77) | ‐18.0 (‐23.0 to ‐13.0) | 424 (6) | ⊕⊕⊕⊕ | Effect predicted from log dose‐response equation is ‐20.6% |
| CI: Confidence interval | ||||||
| GRADE Working Group grades of evidence | ||||||
| aMean baseline values. | ||||||
| Pitavastatin dose mg/day | 1 | 2 | 4 | 8 | 16 |
| Mean percentage change from control of LDL‐Ca (95% confidence interval) | ‐33.2 (‐34.3 to ‐32.1) | ‐38.65 (‐39.1 to ‐38.2) | ‐44.0 (‐45.8 to ‐42.3) | ‐48.7 (‐52.4 to ‐45.0) | ‐54.5 (‐59.4 to ‐49.6) |
| Mean percentage change from control of total cholesterol (95% confidence interval) | ‐23.4 (‐24.2 to ‐22.7) | ‐27.25 (‐27.65 to ‐26.84) | ‐31.1 (‐32.4 to ‐29.7) | ‐37.0 (‐41.4 to ‐32.6) | |
| Mean percentage change from control of triglycerides (95% confidence interval) | ‐13.1 (‐15.4 to ‐10.85) | ‐16.8 (‐18.2 to ‐15.5) | ‐18.0 (‐23.0 to ‐13.0) | ‐32.9 (‐45.0 to ‐20.8) | |
| aLDL‐C: low‐density lipoprotein cholesterol | |||||
| Outcome or subgroup title | No. of studies | No. of participants | Statistical method | Effect size |
| 1.1 LDL cholesterol RCTs Show forest plot | 3 | 255 | Mean Difference (IV, Fixed, 95% CI) | ‐26.85 [‐29.89, ‐23.81] |
| 1.2 Total cholesterol RCTs Show forest plot | 3 | 255 | Mean Difference (IV, Fixed, 95% CI) | ‐19.43 [‐21.90, ‐16.97] |
| 1.3 HDL cholesterol RCTs Show forest plot | 2 | 202 | Mean Difference (IV, Fixed, 95% CI) | 6.28 [3.36, 9.20] |
| 1.4 Triglycerides RCTs Show forest plot | 2 | 202 | Mean Difference (IV, Fixed, 95% CI) | ‐19.22 [‐28.52, ‐9.91] |
| 1.5 LDL‐cholesterol non‐RCTs Show forest plot | 7 | 504 | Mean Difference (IV, Random, 95% CI) | ‐33.37 [‐35.87, ‐30.86] |
| 1.6 Total cholesterol non‐RCTs Show forest plot | 7 | 522 | Mean Difference (IV, Random, 95% CI) | ‐23.51 [‐25.98, ‐21.04] |
| 1.7 HDL‐cholesterol non‐RCTs Show forest plot | 5 | 402 | Mean Difference (IV, Random, 95% CI) | 3.71 [‐1.29, 8.70] |
| 1.8 Triglycerides non‐RCTs Show forest plot | 6 | 471 | Mean Difference (IV, Fixed, 95% CI) | ‐12.72 [‐15.05, ‐10.38] |
| 1.9 WDAE Show forest plot | 2 | Risk Ratio (IV, Fixed, 95% CI) | Totals not selected | |
| Outcome or subgroup title | No. of studies | No. of participants | Statistical method | Effect size |
| 2.1 LDL cholesterol RCTs Show forest plot | 3 | 253 | Mean Difference (IV, Fixed, 95% CI) | ‐31.00 [‐34.09, ‐27.90] |
| 2.2 Total cholesterol RCTs Show forest plot | 3 | 253 | Mean Difference (IV, Fixed, 95% CI) | ‐22.77 [‐25.32, ‐20.22] |
| 2.3 HDL cholesterol RCTs Show forest plot | 2 | 200 | Mean Difference (IV, Fixed, 95% CI) | 6.25 [3.32, 9.19] |
| 2.4 Triglycerides RCTs Show forest plot | 2 | 200 | Mean Difference (IV, Fixed, 95% CI) | ‐24.63 [‐33.45, ‐15.80] |
| 2.5 LDL‐cholesterol non‐RCTs Show forest plot | 33 | 3594 | Mean Difference (IV, Random, 95% CI) | ‐37.97 [‐39.53, ‐36.41] |
| 2.6 Total cholesterol non‐RCTs Show forest plot | 29 | 2536 | Mean Difference (IV, Fixed, 95% CI) | ‐27.36 [‐27.77, ‐26.96] |
| 2.7 HDL‐cholesterol non‐RCTs Show forest plot | 28 | 1996 | Mean Difference (IV, Random, 95% CI) | 3.98 [2.40, 5.55] |
| 2.8 Triglycerides non‐RCTs Show forest plot | 24 | 1835 | Mean Difference (IV, Fixed, 95% CI) | ‐16.66 [‐18.00, ‐15.31] |
| 2.9 WDAE Show forest plot | 2 | Risk Ratio (IV, Fixed, 95% CI) | Totals not selected | |
| Outcome or subgroup title | No. of studies | No. of participants | Statistical method | Effect size |
| 3.1 LDL‐cholesterol RCTs Show forest plot | 4 | 315 | Mean Difference (IV, Fixed, 95% CI) | ‐39.97 [‐42.86, ‐37.08] |
| 3.2 Total cholesterol RCTs Show forest plot | 4 | 315 | Mean Difference (IV, Random, 95% CI) | ‐28.09 [‐32.73, ‐23.46] |
| 3.3 HDL cholesterol RCTs Show forest plot | 3 | 264 | Mean Difference (IV, Fixed, 95% CI) | 6.65 [3.57, 9.73] |
| 3.4 Triglycerides RCTs Show forest plot | 3 | 264 | Mean Difference (IV, Fixed, 95% CI) | ‐24.81 [‐32.20, ‐17.41] |
| 3.5 LDL‐cholesterol non‐RCTs Show forest plot | 3 | 154 | Mean Difference (IV, Fixed, 95% CI) | ‐46.39 [‐48.54, ‐44.24] |
| 3.6 Total cholesterol non‐RCTs Show forest plot | 3 | 162 | Mean Difference (IV, Fixed, 95% CI) | ‐32.28 [‐33.95, ‐30.60] |
| 3.7 HDL‐cholesterol non‐RCTs Show forest plot | 4 | 319 | Mean Difference (IV, Random, 95% CI) | 6.69 [‐1.04, 14.43] |
| 3.8 Triglycerides non‐RCTs Show forest plot | 3 | 160 | Mean Difference (IV, Fixed, 95% CI) | ‐12.00 [‐18.87, ‐5.14] |
| 3.9 WDAE Show forest plot | 3 | Risk Ratio (IV, Fixed, 95% CI) | Totals not selected | |
| Outcome or subgroup title | No. of studies | No. of participants | Statistical method | Effect size |
| 4.1 LDL cholesterol RCTs Show forest plot | 2 | 256 | Mean Difference (IV, Random, 95% CI) | ‐48.96 [‐54.93, ‐43.00] |
| 4.2 Total cholesterol RCTs Show forest plot | 1 | 100 | Mean Difference (IV, Fixed, 95% CI) | ‐37.00 [‐41.46, ‐32.54] |
| 4.3 HDL cholesterol RCTs Show forest plot | 1 | 100 | Mean Difference (IV, Fixed, 95% CI) | 6.00 [0.44, 11.56] |
| 4.4 Triglycerides RCTs Show forest plot | 1 | 100 | Mean Difference (IV, Fixed, 95% CI) | ‐32.90 [‐45.17, ‐20.63] |
| Outcome or subgroup title | No. of studies | No. of participants | Statistical method | Effect size |
| 5.1 LDL cholesterol RCTs Show forest plot | 1 | 156 | Mean Difference (IV, Fixed, 95% CI) | ‐54.50 [‐59.47, ‐49.53] |
| Outcome or subgroup title | No. of studies | No. of participants | Statistical method | Effect size |
| 6.1 WDAE Show forest plot | 3 | 371 | Risk Ratio (IV, Fixed, 95% CI) | 1.35 [0.15, 12.04] |