Pitavastatina para la reducción de los lípidos
Referencias
Referencias de los estudios incluidos en esta revisión
Referencias de los estudios excluidos de esta revisión
Referencias de los estudios en espera de evaluación
Referencias de los estudios en curso
Referencias adicionales
Characteristics of studies
Characteristics of included studies [ordered by study ID]
| Study characteristics | ||
| Methods | Study design: Randomised controlled trial Study grouping: Parallel group Methods: 5‐week dietary run‐in period; 12‐week randomised, double‐blind, placebo‐controlled trial | |
| Participants | Baseline Characteristics 1 mg
2 mg
4 mg
Placebo
Overall
Included criteria: Children, aged 6‐17 years were eligible if they had diet‐controlled fasting LDL‐C ≥ 160 (4.1 mmol/L) mg/dL,or LDL‐C ≥ 130 mg/dL (3.4 mmol/L) with one of the following risk factors: male; family history of premature cardiovascular disease; presence of low high‐density lipoprotein cholesterol (HDL‐C) 45 mg/dL or high triglycerides > 150 mg/dL; increased lipoprotein(a) > 75 nmol/L; type 2 diabetes mellitus diagnosed by treating physician according to current guidance; or systolic and diastolic blood pressures above the 95th percentile for age and height. Originally, children with an LDL‐C > 190 mg/dL without a risk factor and > 160 mg/dL with a risk factor could be enroled. These levels were changed to > 160 mg/dL without a risk factor and > 130 mg/dL with a risk factor Excluded criteria: None Baseline Group Characteristics: In general, the treatment groups were comparable with respect to all demographic and clinical characteristics | |
| Interventions | Intervention Characteristics 1 mg 2 mg 4 mg Placebo | |
| Outcomes | Total cholesterol
LDL‐cholesterol
WDAE
| |
| Notes | Stephen P on 01/02/2018 10:33 | |
| Risk of bias | ||
| Bias | Authors' judgement | Support for judgement |
| Random sequence generation (selection bias) | Unclear risk | Judgement Comment: method of sequence generation not reported |
| Allocation concealment (selection bias) | Unclear risk | Judgement Comment: method of allocation concealment not reported |
| Blinding of participants and personnel (performance bias) | Low risk | Judgement Comment: double‐blind placebo‐controlled trial |
| Blinding of outcome assessment (detection bias) | Low risk | Judgement Comment: Lipid parameters were measured in a remote laboratory. |
| Selective reporting (reporting bias) | Low risk | Judgement Comment: LDL‐C outcome was reported. |
| Other bias | High risk | Judgement Comment: Kowa Research Europe Ltd. supported the trial. |
| Incomplete outcome data (attrition bias) Total cholesterol | Low risk | All placebo and pitavastatin 1 mg/day participants were included in the efficacy analysis, [(27 ‐ 26)/27]*100 = 3.7%, pitavastatin 2 mg/day participants were not included in the efficacy analysis and [(26 ‐ 24)/26]*100 = 7.7% pitavastatin 4 mg/day participants were not included in the efficacy analysis. |
| Incomplete outcome data (attrition bias) LDL cholesterol) | Low risk | All placebo and pitavastatin 1 mg/day participants were included in the efficacy analysis, [(27 ‐ 26)/27]*100 = 3.7%, pitavastatin 2 mg/day participants were not included in the efficacy analysis and [(26 ‐ 24)/26]*100 = 7.7% pitavastatin 4 mg/day participants were not included in the efficacy analysis. |
| Incomplete outcome data (attrition bias) HDL cholesterol | High risk | Given versus calculated percentage changes from baseline for HDL cholesterol for each dose had a greater than 10% difference; HDL cholesterol was not included in the analysis |
| Incomplete outcome data (attrition bias) Triglycerides | High risk | Triglycerides were expressed as medians, therefore triglycerides were not included in the analysis. |
| Blinding of outcome assessment (detection bias)WDAEs | Unclear risk | Blinding method was not described. |
| Selective reporting (reporting bias) for WDAEs | Low risk | WDAE outcome reported |
| Study characteristics | ||
| Methods | Study design: Historically controlled trial Study grouping: Parallel group Methods: 6 to 8‐week dietary lead‐in period; 12‐week before‐and‐after trial | |
| Participants | Baseline Characteristics 2 mg
2 mg then uptitrated to 4 mg at week 4
2 mg combined data
Overall
Included criteria: men and non‐pregnant, nonlactating women, aged 18 to 75 years, diagnosed with primary hypercholesterolaemia or combined dyslipidaemia. mean fasting LDL‐C levels of 160 mg/dL or more (4.1 mmol/L) and less than or equal to 220 mg/dL (5.7mmol/L), and TG levels of less than or equal to 400 mg/dL (4.5 mmol/L) at the end of the lead‐in period Excluded criteria: previous contraindications or intolerance to statin therapy, homozygous familial hypercholesterolaemia, familial hypoalpha‐lipoproteinaemia, conditions that might have caused secondary dyslipidaemia, uncontrolled diabetes mellitus, pregnancy, conditions affecting absorption, distribution, metabolism or excretion of drugs, symptomatic heart failure (New York Heart Association classification III or IV), significant cardiovascular disease, impaired pancreatic function, liver enzyme levels greater than 1.5‐times the upper limit of normal, impaired renal function, impaired urinary tract function, uncontrolled hypothyroidism, symptomatic cerebrovascular disease, left ventricular ejection fraction less than 0.25, uncontrolled hypertension, muscular or neuromuscular disease, neoplastic disease, treatment with other lipid‐lowering drugs and treatment that would interact with the pharmacokinetics of statins. Women of childbearing potential were only allowed to participate if they were using a reliable contraceptive method. Baseline Group Characteristics: The treatment groups were well matched in terms of age, vital statistics (height, weight and BMI) and disease diagnosis and duration. Approximately 79% of patients in each treatment group had primary hypercholesterolaemia (78.4 to 79.1%) and most of the remainder had combined dyslipidaemia. The groups were also well matched in diagnosis of hypertension and in baseline lipid values. Study subjects included slightly more women than men, and this balance was reflected across the treatment groups | |
| Interventions | Intervention Characteristics 2 mg 2 mg then uptitrated to 4 mg at week 4 2 mg combined data | |
| Outcomes | Total cholesterol
LDL cholesterol
HDL cholesterol
Triglycerides
| |
| Notes | ||
| Risk of bias | ||
| Bias | Authors' judgement | Support for judgement |
| Random sequence generation (selection bias) | High risk | Judgement Comment: Controlled before‐and‐after design |
| Allocation concealment (selection bias) | High risk | Judgement Comment: Controlled before‐and‐after design |
| Blinding of participants and personnel (performance bias) | Low risk | Judgement Comment: Lipid parameter measurements unlikely to be influenced by lack of blinding |
| Blinding of outcome assessment (detection bias) | Low risk | Judgement Comment: Lipid parameters were measured in a remote laboratory. |
| Selective reporting (reporting bias) | Low risk | Judgement Comment: LDL‐cholesterol outcome was reported. |
| Other bias | High risk | Judgement Comment: Kowa Research Europe Ltd. sponsored the trial. |
| Incomplete outcome data (attrition bias) Total cholesterol | Low risk | [(316 ‐ 315)/316]*100 = 0.3% were not included in the efficacy analysis for the pitavastatin 2 mg/day; [(300 ‐ 298)/300]*100 = 0.7% were not included in the efficacy analysis for the pitavastatin 2 mg/day then titrated to 4 mg/day at week 4. |
| Incomplete outcome data (attrition bias) LDL cholesterol) | Low risk | [(316 ‐ 315)/316]*100 = 0.3% were not included in the efficacy analysis for the pitavastatin 2 mg/day; [(300 ‐ 298)/300]*100 = 0.7% were not included in the efficacy analysis for the pitavastatin 2 mg/day then titrated to 4 mg/day at week 4. |
| Incomplete outcome data (attrition bias) HDL cholesterol | Low risk | [(316 ‐ 315)/316]*100 = 0.3% were not included in the efficacy analysis for the pitavastatin 2 mg/day; [(300 ‐ 298)/300]*100 = 0.7% were not included in the efficacy analysis for the pitavastatin 2 mg/day then titrated to 4 mg/day at week 4. |
| Incomplete outcome data (attrition bias) Triglycerides | Low risk | [(316 ‐ 315)/316]*100 = 0.3% were not included in the efficacy analysis for the pitavastatin 2 mg/day; [(300 ‐ 298)/300]*100 = 0.7% were not included in the efficacy analysis for the pitavastatin 2 mg/day then titrated to 4 mg/day at week 4. |
| Blinding of outcome assessment (detection bias)WDAEs | High risk | No comparison possible |
| Selective reporting (reporting bias) for WDAEs | High risk | No WDAE outcome reported |
| Study characteristics | ||
| Methods | Study design: Historically controlled trial Study grouping: Methods: Participants were not on lipid medications within 2 months of the trial; therefore, no washout required. 3 months before‐and‐after study | |
| Participants | Baseline Characteristics 2 mg
Included criteria: participants have primary hypertension, men and women aged 18 to 85 years. Excluded criteria: people who were taking lipid‐lowering drugs, nonsteroidal anti‐inflammatory drugs, anticoagulants, angiotensin receptor antagonists; also with liver and kidney and other organ dysfunction; other cardiovascular diseases; having infectious diseases; acute and chronic inflammatory disease, connective tissue disease, cancer, diabetes, thyroid disease; pregnant and lactating women Baseline Group Characteristics: There was no significant difference between the BMI and smoking status between groups | |
| Interventions | Intervention Characteristics 2 mg | |
| Outcomes | Total cholesterol
LDL cholesterol
HDL cholesterol
Triglycerides
| |
| Notes | ||
| Risk of bias | ||
| Bias | Authors' judgement | Support for judgement |
| Random sequence generation (selection bias) | High risk | Judgement Comment: Controlled before‐and‐after design |
| Allocation concealment (selection bias) | High risk | Judgement Comment: Controlled before‐and‐after design |
| Blinding of participants and personnel (performance bias) | Low risk | Judgement Comment: Lipid parameter measurements unlikely to be influenced by lack of blinding |
| Blinding of outcome assessment (detection bias) | Low risk | Judgement Comment: Lipid parameters were measured in a remote laboratory. |
| Selective reporting (reporting bias) | Low risk | Judgement Comment: LDL‐cholesterol outcome was reported. |
| Other bias | Unclear risk | Judgement Comment: source of funding not reported |
| Incomplete outcome data (attrition bias) Total cholesterol | Low risk | All participants were included in the efficacy analysis. |
| Incomplete outcome data (attrition bias) LDL cholesterol) | Low risk | All participants were included in the efficacy analysis. |
| Incomplete outcome data (attrition bias) HDL cholesterol | Low risk | All participants were included in the efficacy analysis. |
| Incomplete outcome data (attrition bias) Triglycerides | Low risk | All participants were included in the efficacy analysis. |
| Blinding of outcome assessment (detection bias)WDAEs | High risk | No comparison possible |
| Selective reporting (reporting bias) for WDAEs | High risk | No WDAE outcome reported |
| Study characteristics | ||
| Methods | Study design: Historically controlled trial Study grouping: Methods: Washout period of 1 month; 3 months before‐and‐after trial | |
| Participants | Baseline Characteristics 2 mg
| |
| Interventions | Intervention Characteristics 2 mg | |
| Outcomes | Total cholesterol
LDL cholesterol
HDL cholesterol
Triglycerides
| |
| Notes | ||
| Risk of bias | ||
| Bias | Authors' judgement | Support for judgement |
| Random sequence generation (selection bias) | High risk | Controlled before‐and‐after design |
| Allocation concealment (selection bias) | High risk | Controlled before‐and‐after design |
| Blinding of participants and personnel (performance bias) | Low risk | Lipid parameter measurements unlikely to be influenced by lack of blinding |
| Blinding of outcome assessment (detection bias) | Low risk | Lipid parameters were measured in a remote laboratory. |
| Selective reporting (reporting bias) | Low risk | LDL‐cholesterol outcome was reported. |
| Other bias | Unclear risk | Source of funding not reported |
| Incomplete outcome data (attrition bias) Total cholesterol | Low risk | All participants were included in the efficacy analysis. |
| Incomplete outcome data (attrition bias) LDL cholesterol) | Low risk | All participants were included in the efficacy analysis. |
| Incomplete outcome data (attrition bias) HDL cholesterol | Low risk | All participants were included in the efficacy analysis. |
| Incomplete outcome data (attrition bias) Triglycerides | Low risk | All participants were included in the efficacy analysis. |
| Blinding of outcome assessment (detection bias)WDAEs | High risk | No comparison possible |
| Selective reporting (reporting bias) for WDAEs | High risk | No WDAE outcome reported |
| Study characteristics | ||
| Methods | Study design: Historically controlled trial Study grouping: Methods: 6‐8 week washout period, 4 week before‐and‐after trial with evening dosing | |
| Participants | Baseline Characteristics 2 mg
Included criteria: Patients of either gender were eligible for inclusion in the study if they were aged 18‐75 years and had primary hypercholesterolaemia or combined dyslipidaemia that was uncontrolled (LDL‐C ≥ 3.4 mmol/L [130 mg/dL] and ≤ 5.7mmol/L [220 mg/dL]; triglycerides ≤ 4.6 mmol/L [400 mg/dL]) despite dietary measures. In addition, patients were required to have at least two of the following cardiovascular risk factors: cigarette smoking; blood pressure of 140/90 mmHg or above or receiving antihypertensive therapy; a high‐density lipoprotein cholesterol (HDL‐C) concentration of 1 mmol/L (40 mg/dL) or below; a family history of CHD in a male or female first‐degree relative below 55 or below 65 years of age, respectively; age above 45 years in men or above 55 years in women. An HDL‐C concentration above 1.55 mmol/L (60 mg/dL) was considered to offset one risk factor. Patients who were receiving lipid‐modifying therapies were eligible for inclusion if such treatment was withdrawn at least 8 weeks before randomisation. Excluded criteria: The principal exclusion criteria were homozygous familial hypercholesterolaemia, unstable medical conditions, or conditions associated with secondary dyslipidaemia, conditions that might affect drug pharmacokinetics, significant cardiovascular disease, or symptomatic heart failure (left ventricular ejection fraction 0.25) or cerebrovascular disease, uncontrolled or poorly controlled hypertension, uncontrolled diabetes (> 8% glycated haemoglobin), impaired liver or kidney function, or other serious medical conditions. Women of childbearing potential were required to have a negative pregnancy test at the start of the dietary run‐in period and before starting treatment, and to use adequate contraception throughout the study. Baseline Group Characteristics: The two groups were well matched in terms of their baseline characteristics. The mean age of the patients was approximately 60 years, about two‐thirds were male, and all except one were white. The majority of patients (>80%) had primary hypercholesterolaemia, and approximately three‐quarters were at moderate or high cardiovascular risk according to the NCEP criteria. | |
| Interventions | Intervention Characteristics 2 mg | |
| Outcomes | LDL‐cholesterol
| |
| Notes | ||
| Risk of bias | ||
| Bias | Authors' judgement | Support for judgement |
| Random sequence generation (selection bias) | High risk | Judgement Comment: Controlled before‐and‐after design |
| Allocation concealment (selection bias) | High risk | Judgement Comment: Controlled before‐and‐after design |
| Blinding of participants and personnel (performance bias) | Low risk | Judgement Comment: Lipid parameter measurements unlikely to be influenced by lack of blinding |
| Blinding of outcome assessment (detection bias) | Low risk | Judgement Comment: Lipid parameters were measured in a remote laboratory. |
| Selective reporting (reporting bias) | Low risk | Judgement Comment: LDL‐cholesterol outcome was reported. |
| Other bias | High risk | Judgement Comment: The study was supported by Kowa Research Europe Ltd. |
| Incomplete outcome data (attrition bias) Total cholesterol | Low risk | [(236 ‐ 233)/236]*100 =1.3% participants were not included in the efficacy analysis. |
| Incomplete outcome data (attrition bias) LDL cholesterol) | Low risk | [(236 ‐ 233)/236]*100 =1.3% participants were not included in the efficacy analysis. |
| Incomplete outcome data (attrition bias) HDL cholesterol | Low risk | [(236 ‐ 233)/236]*100 =1.3% participants were not included in the efficacy analysis. |
| Incomplete outcome data (attrition bias) Triglycerides | Low risk | [(236 ‐ 233)/236]*100 =1.3% participants were not included in the efficacy analysis. |
| Blinding of outcome assessment (detection bias)WDAEs | High risk | No comparison possible |
| Selective reporting (reporting bias) for WDAEs | High risk | No WDAE outcome reported |
| Study characteristics | ||
| Methods | Study design: Historically controlled trial Study grouping: Method: 6‐8 week washout period, 12 week before‐and‐after study with evening dosing | |
| Participants | Baseline Characteristics 2 mg
Included criteria: Eligible patients were aged 18 – 75 years with type 2 diabetes [haemoglobin A1c (HbA1c) ≤ 7.5%] and combined dyslipidaemia [plasma LDL‐C ≥ 100 and ≤ 220 mg/dL (≥ 2.6 and ≤ 5.7 mmol/L) and triglycerides (TG) ≥ 150 mg/dL ( ≥1.7 mmol/L)], despite dietary therapy, and were receiving an oral antidiabetic treatment (not including glitazones) or insulin. Eligible patients had a body mass index (BMI) of not more than 35 kg/m2, and women of childbearing potential had to use reliable contraception. Excluded criteria: homozygous familial hypercholesterolaemia; other conditions with potential to cause secondary dyslipidaemia, including human immunodeficiency virus infection; HbA1c more than 7.5%; significant cardiovascular disease; history of cerebrovascular disease, neoplastic disease within 10 years, unexplained increased serum creatine kinase (CK) of more than five times the upper limit of the reference range (ULRR); systolic blood pressure above 160 mmHg and diastolic blood pressure above 90 mmHg; history of muscular or neuromuscular disease; and history of resistance to lipid‐lowering therapy or use of supplements that affect lipid metabolism Baseline Group Characteristics: Baseline characteristics were generally well matched across randomised treatment groups in the core study. Most patients were Caucasian (88%) and male (57%), with a mean age of 59 years. All patients were in the NCEP high‐risk category; most were hypertensive (77%) and 49% had previously received a lipid‐modifying therapy. | |
| Interventions | Intervention Characteristics 2 mg | |
| Outcomes | LDL cholesterol
| |
| Notes | ||
| Risk of bias | ||
| Bias | Authors' judgement | Support for judgement |
| Random sequence generation (selection bias) | High risk | Judgement Comment: Controlled before‐and‐after design |
| Allocation concealment (selection bias) | High risk | Judgement Comment: Controlled before‐and‐after design |
| Blinding of participants and personnel (performance bias) | Low risk | Judgement Comment: Lipid parameter measurements unlikely to be influenced by lack of blinding |
| Blinding of outcome assessment (detection bias) | Low risk | Judgement Comment: Lipid parameters were measured in a remote laboratory. |
| Selective reporting (reporting bias) | Low risk | Judgement Comment: LDL‐cholesterol outcome was reported. |
| Other bias | High risk | Judgement Comment: Kowa Research Europe Ltd. supported this trial. |
| Incomplete outcome data (attrition bias) Total cholesterol | Low risk | [(279 ‐ 274)/279]*100 = 1.8% were not included in the efficacy analysis. |
| Incomplete outcome data (attrition bias) LDL cholesterol) | Low risk | [(279 ‐ 274)/279]*100 = 1.8% were not included in the efficacy analysis. |
| Incomplete outcome data (attrition bias) HDL cholesterol | Low risk | [(279 ‐ 274)/279]*100 = 1.8% were not included in the efficacy analysis. |
| Incomplete outcome data (attrition bias) Triglycerides | Low risk | [(279 ‐ 274)/279]*100 = 1.8% were not included in the efficacy analysis. |
| Blinding of outcome assessment (detection bias)WDAEs | High risk | No comparison possible |
| Selective reporting (reporting bias) for WDAEs | High risk | No WDAE outcome reported |
| Study characteristics | ||
| Methods | Study design: Historically controlled trial Study grouping: Method: No washout required because no subject was receiving lipid medications within 3 months of trial, 3‐month before‐and‐after trial | |
| Participants | Baseline Characteristics 4 mg
Included criteria: age from 40 to 80 years, statin‐naïve subjects, and low‐density lipoprotein cholesterol (LDL‐C) ≥ 130 mg/dL with more than or equal to two major risk factors for coronary heart disease (CHD) or LDL‐C ≥ 160 mg/dL with less than two risk factors. Major risk factors for CHD include ≥ 45 years of age for men or ≥ 55 years of age for women, family history of premature CHD (CHD in male first‐degree relative < 55 years or in female first‐degree relative < 65 years), current cigarette smoking, blood pressure (BP) ≥ 140/90 mmHg or on antihypertensive medication, and high‐density lipoprotein cholesterol (HDL‐C) < 40 mg/dL Excluded criteria: hospitalisation for acute coronary syndrome or cerebrovascular disease within the previous 2 months; the use of statin or other lipid‐lowering medication within the previous 3 months; impaired hepatic function or a history of liver disease; chronic renal failure; a history of malignancy; any known contraindication to statin therapy, such as statin allergy, ciclosporin use, pregnancy, breastfeeding, myopathy, or lactose intolerance; and failure to obtain informed consent from participants Baseline Group Characteristics: The mean age was 58 ±8 years, and female predominance was observed (70.8%, [34/48]). Thirty‐two patients (66.7%) had hypertension, and 8 patients (16.7%) had diabetes. None of the patients had coronary artery disease. Of the patients, 25 (52.1%) were taking angiotensin‐converting enzyme (ACE) inhibitors or angiotensin receptor blockers (ARB), 10 (20.8%) were taking beta blockers, and 15 (31.3%) were taking calcium‐channel blockers (CCB). | |
| Interventions | Intervention Characteristics 4 mg | |
| Outcomes | Total cholesterol
LDL cholesterol
HDL cholesterol
Triglycerides
| |
| Notes | ||
| Risk of bias | ||
| Bias | Authors' judgement | Support for judgement |
| Random sequence generation (selection bias) | High risk | Judgement Comment: Controlled before‐and‐after design |
| Allocation concealment (selection bias) | High risk | Judgement Comment: Controlled before‐and‐after design |
| Blinding of participants and personnel (performance bias) | Low risk | Judgement Comment: Lipid parameter measurements unlikely to be influenced by lack of blinding |
| Blinding of outcome assessment (detection bias) | Low risk | Judgement Comment: Lipid parameters were measured in a remote laboratory. |
| Selective reporting (reporting bias) | Low risk | Judgement Comment: LDL‐cholesterol outcome was reported. |
| Other bias | High risk | Judgement Comment: Study was supported by grants from Il‐dong Pharmaceutical Co. Ltd. (Republic of Korea) |
| Incomplete outcome data (attrition bias) Total cholesterol | High risk | Judgement Comment: (60 ‐ 48)*100/60 = 20% were not included n the efficacy analysis. |
| Incomplete outcome data (attrition bias) LDL cholesterol) | High risk | Judgement Comment: (60 ‐ 48)*100/60 = 20% were not included n the efficacy analysis. |
| Incomplete outcome data (attrition bias) HDL cholesterol | High risk | Judgement Comment: (60 ‐ 48)*100/60 = 20% were not included n the efficacy analysis. |
| Incomplete outcome data (attrition bias) Triglycerides | High risk | Judgement Comment: (60 ‐ 48)*100/60 = 20% were not included n the efficacy analysis. |
| Blinding of outcome assessment (detection bias)WDAEs | High risk | Judgement Comment: No comparison possible |
| Selective reporting (reporting bias) for WDAEs | High risk | No WDAE outcome reported |
| Study characteristics | ||
| Methods | Study design: Historically controlled trial Study grouping: Method: No washout required because no participant received lipid medications, 4 weeks before‐and‐after trial | |
| Participants | Baseline Characteristics 2 mg
Included criteria: Adult subjects, aged 25 to 75 years, with elevated ALT concentrations (≥ 1.25 times and ≤ 2.5 times the upper limit of the normal range [ULN]; 40 IU/L) were recruited from the lipid clinics of 10 major hospitals in Korea. All subjects were non‐alcoholics and serologically negative for viral hepatitis markers. None had been treated with statins for more than 3 months before screening, and all had basal fasting LDL‐C concentration levels ≥ 3.36 mmol/L (≥ 130 mg/dL).After 2 weeks of an intervention‐free screening period, subjects were re‐evaluated, including by measurements of serum ALT levels. Subjects who did not meet any of the exclusion criteria were grouped into those with persistently elevated (> 1.25 times and ≤ 2.5 times ULN; 50–100 IU/L) and reduced (50 IU/L) concentrations. Excluded criteria: Overt and irreversible liver cirrhosis, serologically positive for viral markers or active viral hepatitis, cholestatic features (serum bilirubin > 2 X ULN), fasting triglyceride levels ≥ 4.52 mmol/L (400mg/dL), acute or unstable conditions, including a recent history (3 months) of myocardial infarction, advanced heart failure (New York Heart Association class III‐IV), renal dysfunction (serum creatinine ≥ 2.0 mg/dL), uncontrolled hypertension (DBP ≥ 100 mmHg), and thyroid dysfunction (TSH ≥ 1.5 X ULN). Medications prohibited from 1 month before the screening period until the completion of study included drugs that could potentially improve liver function test results (betaine, thiazolidinediones), those that could induce significant hepatic damage (synthetic estrogens, androgen, oral contraceptives, amiodarone, tamoxifen, erythromycin, tetracycline, sulfa antibiotics, methotrexate, perhexiline maleate, valproic acid, cocaine, zidovudine, didanosine, fialuridine, isoniazid, rifampicin, other anti‐tuberculosis medications, trazodone, nefazodone, venlafaxine, chlorpromazine, quinidine, gemfibrozil, herb medication), those that could affect lipid profiles (other HMG‐CoA reductase inhibitors, fibrates, niacin, ezetimibe, steroids, anti‐obesity drugs), and those known to have serious drug interactions with statins (ketoconazole, itraconazole, erythromycin, clarithromycin, cyclosporin, norethindrone, ethyl estradiol). Baseline Group Characteristics: Of these subjects, 129 were male and 60 were female, their mean age was 55.1 years, and 28% had been diagnosed with diabetes, 68% with hypertension, and 72% with metabolic syndrome. All demographic features; habits such as exercise, smoking, and drinking; and medication profiles were similar between the two groups. | |
| Interventions | Intervention Characteristics 2 mg | |
| Outcomes | Total cholesterol
LDL cholesterol
HDL cholesterol
Triglycerides
| |
| Notes | ||
| Risk of bias | ||
| Bias | Authors' judgement | Support for judgement |
| Random sequence generation (selection bias) | High risk | Judgement Comment: Controlled before‐and‐after design |
| Allocation concealment (selection bias) | High risk | Judgement Comment: Controlled before‐and‐after design |
| Blinding of participants and personnel (performance bias) | Low risk | Judgement Comment: Lipid parameter measurements unlikely to be influenced by lack of blinding |
| Blinding of outcome assessment (detection bias) | Low risk | Judgement Comment: Lipid parameters were measured in a remote laboratory. |
| Selective reporting (reporting bias) | Low risk | Judgement Comment: LDL‐cholesterol outcome was reported. |
| Other bias | High risk | Judgement Comment: The study was supported by JW Pharmaceutical Co, Korea. |
| Incomplete outcome data (attrition bias) Total cholesterol | High risk | [(103 ‐ 88)/103)]*100 = 14.6% were not included in the efficacy analysis. |
| Incomplete outcome data (attrition bias) LDL cholesterol) | High risk | [(103 ‐ 88)/103)]*100 = 14.6% were not included in the efficacy analysis. |
| Incomplete outcome data (attrition bias) HDL cholesterol | High risk | [(103 ‐ 88)/103)]*100 = 14.6% were not included in the efficacy analysis. |
| Incomplete outcome data (attrition bias) Triglycerides | High risk | [(103 ‐ 88)/103)]*100 = 14.6% were not included in the efficacy analysis. |
| Blinding of outcome assessment (detection bias)WDAEs | High risk | No comparison possible |
| Selective reporting (reporting bias) for WDAEs | High risk | No WDAE outcome reported |
| Study characteristics | ||
| Methods | Study design: Historically controlled trial Study grouping: Parallel group Method: 3 month dietary run‐in period, 12‐week before‐and‐after study with morning dosing | |
| Participants | Baseline Characteristics 1 mg
1 mg then titrated to 2 mg at week 4
Overall
Included criteria: (1) patients with an LDL‐C level of ≥ 190 mg/dL or LDL‐C level of ≥ 160 mg/dL with one or more of the following risk factors, a family history of coronary artery disease (relation in the second degree), obesity (obesity index ≥ 20%), type 2 diabetes, hypertension (systolic blood pressure ≥ 125 mmHg or diastolic blood pressure ≥ 70 mmHg) and a low HDL cholesterol level ( < 40 mg/dL); (2) Japanese male children 10 to 15 years of age inclusive at the time of informed consent; (3) patients who had received diet therapy for at least three months before screening based on a physician’s instructions or those whose diet for at least three months before screening was judged by the investigator not to require more intensive dietary restrictions (in either case, the patients were required to have received a fixed regimen of diet or diet/exercise therapy for at least four weeks before screening); (4) outpatients; and (5) patients for whom written informed consent was obtained from the patients themselves and their parents or guardians Excluded criteria: (1) patients with homozygous familial hypercholesterolaemia; (2) patients with secondary hyperlipidaemia; (3) patients on apheresis therapy; (4) patients who had recently experienced a cerebrovascular disorder, anginal attack or myocardial infarction; (5) patients with severe hepatic or renal disorders, poor glycaemic control, severe hypertension, a history of allergies to drugs or serious adverse drug reactions (ADRs); (6) patients who had participated in other clinical trial(s) and received investigational drug(s) within 12 weeks before screening; and (7) patients judged inappropriate for the study by the investigator Baseline Group Characteristics: The mean age was 11.8 years, the mean height was 147.6 cm, and the mean weight was 41.1 kg. The patient characteristics were generally similar between 1 mg and 2 mg treatment groups, except for the obesity index. | |
| Interventions | Intervention Characteristics 1 mg 1 mg then titrated to 2 mg at week 4 Both Groups | |
| Outcomes | Total cholesterol
LDL cholesterol
HDL cholesterol
Triglycerides
| |
| Notes | ||
| Risk of bias | ||
| Bias | Authors' judgement | Support for judgement |
| Random sequence generation (selection bias) | High risk | Judgement Comment: Controlled before‐and‐after design |
| Allocation concealment (selection bias) | High risk | Judgement Comment: Controlled before‐and‐after design |
| Blinding of participants and personnel (performance bias) | Low risk | Judgement Comment: Lipid parameter measurements unlikely to be influenced by lack of blinding |
| Blinding of outcome assessment (detection bias) | Low risk | Judgement Comment: Lipid parameters were measured in a remote laboratory. |
| Selective reporting (reporting bias) | Low risk | Judgement Comment: LDL‐cholesterol outcome was reported. |
| Other bias | High risk | Judgement Comment: Kowa Co. Ltd funded this trial. |
| Incomplete outcome data (attrition bias) Total cholesterol | Low risk | All participants were included in the efficacy analysis. |
| Incomplete outcome data (attrition bias) LDL cholesterol) | Low risk | All participants were included in the efficacy analysis. |
| Incomplete outcome data (attrition bias) HDL cholesterol | Low risk | All participants were included in the efficacy analysis. |
| Incomplete outcome data (attrition bias) Triglycerides | Low risk | All participants were included in the efficacy analysis. |
| Blinding of outcome assessment (detection bias)WDAEs | High risk | No comparison possible |
| Selective reporting (reporting bias) for WDAEs | High risk | No WDAE outcome reported |
| Study characteristics | ||
| Methods | Study design: Historically controlled trial Study grouping: Method: Participants were not on any lipid medications, therefore no washout required, 3‐month before‐and‐after study | |
| Participants | Baseline Characteristics 2 mg
Included criteria: Age > 60 years of age, conformity to the 1999 World Health Organization (WHO) criteria for the diagnosis of type 2 diabetes, blood glucose resulting in a HbA1c of 7%, stable blood sugar, fasting blood glucose (FBS) 70 mmol/L blood glucose, 2 h after three meals (PBC) 11.1 mmoI/L, not to have taken statins and other lipid‐regulating drugs within one month, expresses the intention of both patients and their family members, and signed informed consent Excluded criteria: type 1 diabetes, uncooperative, poor compliance, hypersensitivity to pitavastatin and atorvastatin, homozygous familial hypercholesterolaemia, patients with active liver disease or unexplained persistent transaminase elevation (alanine aminotransferase and/or aspartate aminotransferase are 3 times greater than normal), patients taking immunosuppressants such as cyclosporine, severe cases of kidney disease, severe cardiovascular and cerebrovascular diseases (such as myocardial infarction, acute cerebral infarction, acute heart failure, etc.), severe infection, trauma, stress ulcer hyperthyroidism, malignancy, diabetic ketosis, diabetic patients with non‐ketotic hyperosmolar coma or patients with psychiatric symptoms and patients receiving glucocorticoids and postoperative patients Baseline Group Characterisitcs: Baseline characteristics were generally well matched across age, gender, smoking, BMI, drinking history, drug use, and disease diagnosis | |
| Interventions | Intervention Characteristics 2 mg | |
| Outcomes | Total cholesterol
LDL cholesterol
HDL cholesterol
Triglycerides
| |
| Notes | ||
| Risk of bias | ||
| Bias | Authors' judgement | Support for judgement |
| Random sequence generation (selection bias) | High risk | Judgement Comment: Controlled before‐and‐after design |
| Allocation concealment (selection bias) | High risk | Judgement Comment: Controlled before‐and‐after design |
| Blinding of participants and personnel (performance bias) | Low risk | Judgement Comment: Lipid parameter measurements unlikely to be influenced by lack of blinding |
| Blinding of outcome assessment (detection bias) | Low risk | Judgement Comment: Lipid parameters were measured in a remote laboratory. |
| Selective reporting (reporting bias) | Low risk | Judgement Comment: LDL‐cholesterol outcome was reported. |
| Other bias | Unclear risk | Judgement Comment: Source of funding was not reported. |
| Incomplete outcome data (attrition bias) Total cholesterol | Unclear risk | [(40 ‐ 36)/40)]*100 = 10% participants were not included in the efficacy analysis. |
| Incomplete outcome data (attrition bias) LDL cholesterol) | Unclear risk | [(40 ‐ 36)/40)]*100 = 10% participants were not included in the efficacy analysis. |
| Incomplete outcome data (attrition bias) HDL cholesterol | Unclear risk | [(40 ‐ 36)/40)]*100 = 10% participants were not included in the efficacy analysis. |
| Incomplete outcome data (attrition bias) Triglycerides | Unclear risk | [(40 ‐ 36)/40)]*100 = 10% participants were not included in the efficacy analysis. |
| Blinding of outcome assessment (detection bias)WDAEs | High risk | No comparison possible |
| Selective reporting (reporting bias) for WDAEs | High risk | No WDAE outcome reported |
| Study characteristics | ||
| Methods | Study design: Historically controlled trial Study grouping: Method: No participants were receiving lipid medications, therefore, washout period not required; 3‐month before‐and‐after trial | |
| Participants | Baseline Characteristics 2 mg
Included criteria: 15 men and women with hypercholesterolaemia Excluded criteria: alcohol consumption of more than 20 g per week; evidence of pregnancy, treatment with corticosteroid, and hormone replacement therapy. Subjects using lipid‐lowering medication or food enriched with functional plant stanols or sterols were excluded from the study. Subjects with positive test results for the following disorders were also excluded: secondary causes of steatohepatitis and drug‐induced liver injury, viral hepatitis, autoimmune hepatitis, primary biliary cirrhosis, a‐1‐antitrypsin deficiency, haemochromatosis, Wilson’s disease, and biliary obstruction. Baseline Group Characteristics: The mean ages and ratios of male/female subjects were not significantly different between the control and NAFLD groups. | |
| Interventions | Intervention Characteristics 2 mg | |
| Outcomes | Total cholesterol
| |
| Notes | Stephen P on 27/01/2018 11:00 | |
| Risk of bias | ||
| Bias | Authors' judgement | Support for judgement |
| Random sequence generation (selection bias) | High risk | Judgement Comment: Controlled before‐and‐after design |
| Allocation concealment (selection bias) | High risk | Judgement Comment: Controlled before‐and‐after design |
| Blinding of participants and personnel (performance bias) | Low risk | Judgement Comment: Lipid parameter measurements unlikely to be influenced by lack of blinding |
| Blinding of outcome assessment (detection bias) | Low risk | Judgement Comment: Lipid parameters were measured in a remote laboratory. |
| Selective reporting (reporting bias) | High risk | Judgement Comment: LDL‐C outcome was not reported. |
| Other bias | Low risk | Judgement Comment: This study was supported by grants from the Ministry of Education, Culture, Sports, Science and Technology of Japan. |
| Incomplete outcome data (attrition bias) Total cholesterol | Low risk | All participants were included in the efficacy analysis. |
| Incomplete outcome data (attrition bias) LDL cholesterol) | High risk | LDL cholesterol was not reported. |
| Incomplete outcome data (attrition bias) HDL cholesterol | High risk | HDL cholesterol was not reported. |
| Incomplete outcome data (attrition bias) Triglycerides | High risk | Triglycerides were not reported. |
| Blinding of outcome assessment (detection bias)WDAEs | High risk | No comparison possible |
| Selective reporting (reporting bias) for WDAEs | High risk | No WDAE outcome reported |
| Study characteristics | ||
| Methods | Study design: Historically controlled trial Study grouping: Method: 4‐8 week placebo washout period; 8‐week before‐and‐after study with evening dosing | |
| Participants | Baseline Characteristics 2 mg
Included criteria: 30 patients (15 men and 15 women, aged 51 ± 13 [mean ± SD] years) with heterozygous FH. All patients fulfilled the diagnostic criteria: primary hypercholesterolaemia (> 230 mg/dL) with tendon xanthoma or first‐degree relatives of previously diagnosed heterozygous FH patients showing primary hypercholesterolaemia (> 230 mg/dL). The mean ± SD of body mass index was 23.9 ± 2.9 kg/m2. Coronary artery disease had already been documented in 9 patients (30%), and no patient had cerebral atherosclerotic vascular disease. Excluded criteria: not reported. Baseline Group Characteristics: The study population consisted of 30 patients (15 men and 15 women, aged 51±13 [mean ± SD] years) with heterozygous FH. All patients fulfilled our diagnostic criteria: primary hypercholesterolaemia ( > 230 mg/dl) with tendon xanthoma or first‐degree relatives of previously diagnosed heterozygous FH patients showing primary hypercholesterolaemia (> 230 mg/dl). The mean ± SD of body mass index was 23.9 ± 2.9 kg/m2 . Coronary artery disease had already been documented in 9 patients (30%), and no patient had cerebral atherosclerotic vascular disease. | |
| Interventions | Intervention Characteristics 2 mg
| |
| Outcomes | Total cholesterol
LDL cholesterol
HDL cholesterol
Triglycerides
| |
| Notes | ||
| Risk of bias | ||
| Bias | Authors' judgement | Support for judgement |
| Random sequence generation (selection bias) | High risk | Judgement Comment: Controlled before‐and‐after design |
| Allocation concealment (selection bias) | High risk | Judgement Comment: Controlled before‐and‐after design |
| Blinding of participants and personnel (performance bias) | Low risk | Judgement Comment: Lipid parameter measurements unlikely to be influenced by lack of blinding |
| Blinding of outcome assessment (detection bias) | Low risk | Judgement Comment: Lipid parameters were measured in a remote laboratory. |
| Selective reporting (reporting bias) | Low risk | Judgement Comment: LDL‐cholesterol outcome was reported. |
| Other bias | Unclear risk | Judgement Comment: source of funding was not reported. |
| Incomplete outcome data (attrition bias) Total cholesterol | Low risk | All participants were included in the efficacy analysis. |
| Incomplete outcome data (attrition bias) LDL cholesterol) | Low risk | All participants were included in the efficacy analysis. |
| Incomplete outcome data (attrition bias) HDL cholesterol | Low risk | All participants were included in the efficacy analysis. |
| Incomplete outcome data (attrition bias) Triglycerides | Low risk | All participants were included in the efficacy analysis. |
| Blinding of outcome assessment (detection bias)WDAEs | High risk | No comparison possible |
| Selective reporting (reporting bias) for WDAEs | High risk | No WDAE outcome reported |
| Study characteristics | ||
| Methods | Study design: Historically controlled trial Study grouping: Method: Participants were not on any medication; no washout required; 4‐week before‐and‐after trial | |
| Participants | Baseline Characteristics 2 mg
Included criteria: Japanese men, who agreed to undergo pitavastatin treatment and mixed meal test, were involved in this study (n = 10;age: 33.9 ± 10.1 years; body height 172.0 ± 4.3 cm; body weight 80.2 ± 25.3 kg; body mass index (BMI) 27.0 ± 8.3kg/m2; waist circumference 88.5 ± 18.9 cm) Excluded criteria: not reported. Baseline Group Characteristics: Japanese men, (n = 10; age 33.9 ± 10.1 years; body height 172.0 ± 4.3 cm; body weight 80.2 ± 25.3 kg; body mass index (BMI) 27.0 ± 8.3 kg/m2 ; waist circumference 88.5 ± 18.9 cm). None of them had received medication. | |
| Interventions | Intervention Characteristics 2 mg | |
| Outcomes | Total cholesterol
LDL cholesterol
HDL cholesterol
| |
| Notes | Stephen P on 02/02/2018 08:13 | |
| Risk of bias | ||
| Bias | Authors' judgement | Support for judgement |
| Random sequence generation (selection bias) | High risk | Judgement Comment: Controlled before‐and‐after design |
| Allocation concealment (selection bias) | High risk | Judgement Comment: Controlled before‐and‐after design |
| Blinding of participants and personnel (performance bias) | Low risk | Judgement Comment: Lipid parameter measurements unlikely to be influenced by lack of blinding |
| Blinding of outcome assessment (detection bias) | Low risk | Judgement Comment: Lipid parameters were measured in a remote laboratory. |
| Selective reporting (reporting bias) | Low risk | Judgement Comment: LDL‐cholesterol outcome was reported. |
| Other bias | Unclear risk | Judgement Comment: source of funding was not reported. |
| Incomplete outcome data (attrition bias) Total cholesterol | Low risk | All participants were included in the efficacy analysis. |
| Incomplete outcome data (attrition bias) LDL cholesterol) | Low risk | All participants were included in the efficacy analysis. |
| Incomplete outcome data (attrition bias) HDL cholesterol | Low risk | All participants were included in the efficacy analysis. |
| Incomplete outcome data (attrition bias) Triglycerides | High risk | Triglyceride data were not included in the efficacy analysis. |
| Blinding of outcome assessment (detection bias)WDAEs | High risk | No comparison possible |
| Selective reporting (reporting bias) for WDAEs | High risk | No WDAE outcome reported |
| Study characteristics | ||
| Methods | Study design: Historically controlled trial Study grouping: Method: 4‐week dietary washout period; 4‐week before‐and‐after study | |
| Participants | Baseline Characteristics 2 mg
Included criteria: Korean men and women aged 20 to 79 years who had untreated hypercholesterolaemia Excluded criteria: Pregnant and breastfeeding women were excluded. Other exclusion criteria were current use of lipid‐lowering therapy, uncontrolled diabetes mellitus (fasting plasma glucose concentration > 180 mg/dL), uncontrolled hypertension (diastolic blood pressure > 115 mm Hg), a history of cerebrovascular disease or myocardial infarction within 3 months of enrolment, congestive heart failure, a serum creatinine concentration > 2.0 mg/dL, hepatic dysfunction (transaminase levels > 2.5 times the upper limit of normal [ULN]), or an unexplained serum creatine kinase (CK) elevation > 2.5 times the ULN Baseline Characteristics: The characteristics of the 2 groups were similar at baseline. | |
| Interventions | Intervention Characteristics 2 mg | |
| Outcomes | Total cholesterol
LDL cholesterol
HDL cholesterol
Triglycerides
| |
| Notes | Nima Alaeiilkhchi on 27/01/2018 11:48 | |
| Risk of bias | ||
| Bias | Authors' judgement | Support for judgement |
| Random sequence generation (selection bias) | High risk | Judgement Comment: Controlled before‐and‐after design |
| Allocation concealment (selection bias) | High risk | Judgement Comment: Controlled before‐and‐after design |
| Blinding of participants and personnel (performance bias) | Low risk | Judgement Comment: Lipid parameter measurements unlikely to be influenced by lack of blinding |
| Blinding of outcome assessment (detection bias) | Low risk | Judgement Comment: Lipid parameters were measured in a remote laboratory. |
| Selective reporting (reporting bias) | Low risk | Judgement Comment: LDL‐cholesterol outcome was reported. |
| Other bias | High risk | Judgement Comment: Study was funded by Choongwae Pharma Corp. Seoul, Republic of Korea. |
| Incomplete outcome data (attrition bias) Total cholesterol | High risk | [(136 ‐ 110)/136] X 100 = 19.1% were not included in the efficacy analysis. |
| Incomplete outcome data (attrition bias) LDL cholesterol) | High risk | [(136 ‐ 110)/136] X 100 = 19.1% were not included in the efficacy analysis. |
| Incomplete outcome data (attrition bias) HDL cholesterol | High risk | [(136 ‐ 110)/136] X 100 = 19.1% were not included in the efficacy analysis. |
| Incomplete outcome data (attrition bias) Triglycerides | High risk | [(136 ‐ 110)/136] X 100 = 19.1% were not included in the efficacy analysis. |
| Blinding of outcome assessment (detection bias)WDAEs | High risk | No comparison possible |
| Selective reporting (reporting bias) for WDAEs | High risk | No WDAE outcome reported |
| Study characteristics | ||
| Methods | Study design: Historically controlled trial Study grouping: Method: 4‐week dietary lead‐in period; 12‐week before‐and‐after study | |
| Participants | Baseline Characteristics 2 mg
Included criteria: Eligible patients were men and women aged 20 or older with fasting LDL‐C higher than 100 mg/dL. In addition, to be considered “high‐risk”, a patient had to meet at least one of the following criteria (NCEP ATP III guideline): documented CHD; type 2 DM; the patient had fewer than 2 risk factors (other than LDL) present in the following items without CHD or a CHD risk equivalent, a 10‐year (short‐term) CHD risk had to be assessed with a Framingham score > 20%: female: ≥ 55 years old, or male: ≥ 45 years old; fasting high‐density lipoprotein cholesterol (HDL‐C) 40 mg/dL; a family history of premature CHD (CHD in first‐degree male relative 55 years; CHD in first‐degree female relative 65 years); hypertension (BP ≥ 140/90 mm Hg or treated with anti‐hypertensive agents); HDL‐C ≥ 60 mg/dL counted as a“negative” risk factor; its presence removed one risk factor from the total count. Excluded criteria: a history of hypersensitivity to statins, hepatic dysfunction [aspartate aminotransferase (AST) or alanine aminotransferase (ALT) > 100 IU/L], suspected hepatic metabolism disorders or biliary obstruction (acute hepatitis, acute exacerbation of chronic hepatitis, liver cirrhosis, liver cancer and jaundice), or renal dysfunction (serum creatinine > 1.5 mg/dL), pregnancy, possible pregnancy, or breastfeeding and poorly controlled diabetes (HbA1C > 9.0%) Baseline Group Characteristics: The characteristics of the 2 groups were similar at baseline. | |
| Interventions | Intervention Characteristics 2 mg | |
| Outcomes | Total cholesterol
LDL cholesterol
HDL cholesterol
Triglycerides
| |
| Notes | ||
| Risk of bias | ||
| Bias | Authors' judgement | Support for judgement |
| Random sequence generation (selection bias) | High risk | Judgement Comment: Controlled before‐and‐after design |
| Allocation concealment (selection bias) | High risk | Judgement Comment: Controlled before‐and‐after design |
| Blinding of participants and personnel (performance bias) | Low risk | Judgement Comment: Lipid parameter measurements unlikely to be influenced by lack of blinding |
| Blinding of outcome assessment (detection bias) | Low risk | Judgement Comment: Lipid parameters were measured in a remote laboratory. |
| Selective reporting (reporting bias) | Low risk | Judgement Comment: LDL‐cholesterol outcome was reported. |
| Other bias | Low risk | Judgement Comment: The associated study (Lin 2014) was partly supported by research grants V101B‐023, V102B‐048 and V103B‐019 toL.Y. Lin. from the Taipei Veterans General Hospital, Taipei, Taiwan. Kowa company supplied the medicine for the clinical trial. |
| Incomplete outcome data (attrition bias) Total cholesterol | High risk | [(113 ‐ 94)/113]*100 = 16.8% were not included in the efficacy analysis. |
| Incomplete outcome data (attrition bias) LDL cholesterol) | High risk | [(113 ‐ 94)/113]*100 = 16.8% were not included in the efficacy analysis. |
| Incomplete outcome data (attrition bias) HDL cholesterol | High risk | [(113 ‐ 94)/113]*100 = 16.8% were not included in the efficacy analysis. |
| Incomplete outcome data (attrition bias) Triglycerides | High risk | [(113 ‐ 94)/113]*100 = 16.8% were not included in the efficacy analysis. |
| Blinding of outcome assessment (detection bias)WDAEs | High risk | No comparison possible |
| Selective reporting (reporting bias) for WDAEs | High risk | No WDAE outcome reported |
| Study characteristics | ||
| Methods | Study design: Historically controlled trial Study grouping: Method: No participant received lipid medications within 3 months of the trial, therefore, no washout required; 3‐month before‐and‐after study | |
| Participants | Baseline Characteristics 1 mg
Included criteria: 101 Japanese patients (57 men and 44 women, mean age 58.58 ± 12.0 years) with untreated hypercholesterolaemia, who attended the clinic of Rakuwakai Otowa Hospital between March 2006 and December 2006, were selected for this study. The diagnosis of hypercholesterolaemia was established on the basis of laboratory findings, including an elevated serum total cholesterol (TC) level (> 220 mg/dL) and an elevated serum low density lipoprotein cholesterol (LDL‐C) level (> 140 mg/dL). Excluded criteria: current smokers and those who had a history of fractures and/or of other diseases (type 1 diabetes mellitus, liver disease, renal dysfunction, malignancy, hyperthyroidism, hyperparathyroidism, hypercortisolism, or hypogonadism) and those taking medications (active vitamin D3, bisphosphonates, calcitonin, selective oestrogen receptor modulators, estrogens, testosterones, steroids, thyroid hormones, diuretics, heparin or anticonvulsants) that could influence bone metabolism Baseline Group Characteristics: At baseline, all differences between group A and group B were non significant. | |
| Interventions | Intervention Characteristics 1 mg | |
| Outcomes | Total cholesterol
LDL cholesterol
HDL cholesterol
Triglycerides
| |
| Notes | ||
| Risk of bias | ||
| Bias | Authors' judgement | Support for judgement |
| Random sequence generation (selection bias) | High risk | Judgement Comment: Controlled before‐and‐after design |
| Allocation concealment (selection bias) | High risk | Judgement Comment: Controlled before‐and‐after design |
| Blinding of participants and personnel (performance bias) | Low risk | Judgement Comment: Lipid parameter measurements unlikely to be influenced by lack of blinding |
| Blinding of outcome assessment (detection bias) | Low risk | Judgement Comment: Lipid parameters were measured in a remote laboratory. |
| Selective reporting (reporting bias) | Low risk | Judgement Comment: LDL‐C outcome was reported. |
| Other bias | Unclear risk | Judgement Comment: Source of funding was not reported. |
| Incomplete outcome data (attrition bias) Total cholesterol | Low risk | [(66 ‐ 63)/66]*100 = 4.5% were not included in the efficacy analysis. |
| Incomplete outcome data (attrition bias) LDL cholesterol) | Low risk | [(66 ‐ 63)/66]*100 = 4.5% were not included in the efficacy analysis. |
| Incomplete outcome data (attrition bias) HDL cholesterol | Low risk | [(66 ‐ 63)/66]*100 = 4.5% were not included in the efficacy analysis. |
| Incomplete outcome data (attrition bias) Triglycerides | Low risk | [(66 ‐ 63)/66]*100 = 4.5% were not included in the efficacy analysis. |
| Blinding of outcome assessment (detection bias)WDAEs | High risk | No comparison possible |
| Selective reporting (reporting bias) for WDAEs | High risk | No WDAE outcome reported |
| Study characteristics | ||
| Methods | Study design: Historically controlled trial Study grouping: Method: 4‐week washout period; 12‐week before‐and‐after study | |
| Participants | Baseline Characteristics 2 mg
Included criteria: Age 18‐75 years of age, gender is not limited; clinic or hospitalised patients diagnosed as hypercholesterolaemia or willing to accept for the elder brother of patients, the fasting LDL‐C ≥ 3.37 mmol/L; has not received pitavastatin in the past; signed informed consent Excluded criteria: Patients with pitavastatin calcium allergy; had a history of active arterial disease within 3 months such as acute coronary syndromes (i.e. unstable angina and myocardial infarction), angioplasty, angioplasty, coronary artery bypass grafting, transient ischaemic attacks, and stroke; familial cardiogenic sudden death; patients with acute heart failure; poorly controlled refractory hypertension (systolic > 160 mm Hg, diastolic > 100 mm Hg, 1 mm Hg 0.133 kPa); patients with active liver disease, severe liver and kidney dysfunction with ALT, AST and Cr values exceeding 2 times the upper limit of normal; malignancy, bed history of thyroid disease and uncontrolled acute inflammation; patients given hormones or immunosuppressants within the last 1 month; patients in the field or those who are unable to follow up because of mobility; pregnant, breastfeeding, or within 6 months of delivery Baseline Group Characteristics: NR | |
| Interventions | Intervention Characteristics 2 mg | |
| Outcomes | Total cholesterol
LDL cholesterol
| |
| Notes | ||
| Risk of bias | ||
| Bias | Authors' judgement | Support for judgement |
| Random sequence generation (selection bias) | High risk | Judgement Comment: Controlled before‐and‐after design |
| Allocation concealment (selection bias) | High risk | Judgement Comment: Controlled before‐and‐after design |
| Blinding of participants and personnel (performance bias) | Low risk | Judgement Comment: Lipid parameter measurements unlikely to be influenced by lack of blinding |
| Blinding of outcome assessment (detection bias) | Low risk | Judgement Comment: Lipid parameters were measured in a remote laboratory. |
| Selective reporting (reporting bias) | Low risk | Judgement Comment: LDL‐C outcome was reported. |
| Other bias | High risk | Judgement Comment: Kowa (Shanghai) Pharma Consulting Co. Ltd. sponsored the trial. |
| Incomplete outcome data (attrition bias) Total cholesterol | High risk | [(397 ‐ 295)/397]*100 = 25.7% were not included in the efficacy analysis because they were receiving lipid medications at baseline. |
| Incomplete outcome data (attrition bias) LDL cholesterol) | High risk | [(397 ‐ 295)/397]*100 = 25.7% were not included in the efficacy analysis because they were receiving lipid medications at baseline. |
| Incomplete outcome data (attrition bias) HDL cholesterol | High risk | HDL‐cholesterol was not included in the analysis because the values were expressed as medians. |
| Incomplete outcome data (attrition bias) Triglycerides | High risk | Triglycerides were not included in the analysis because they were expressed as medians. |
| Blinding of outcome assessment (detection bias)WDAEs | High risk | No comparison possible |
| Selective reporting (reporting bias) for WDAEs | High risk | No WDAE outcome reported |
| Study characteristics | ||
| Methods | Study design: Historically controlled trial Study grouping: Method: 4‐week washout period; 3‐month before‐and‐after study | |
| Participants | Baseline Characteristics 2 mg
Included criteria: more than 20 years old, no chronic or acute inflammatory diseases diagnosed by clinical symptoms and/or laboratory data, no corticosteroid administration, serum creatinine concentrations < 2.0 mg/dL, serum transaminase concentrations less than twice the upper limit of control ranges, and no viral hepatitis Excluded criteria: none reported Baseline Group Characteristics: NR | |
| Interventions | Intervention Characteristics 2 mg | |
| Outcomes | Total cholesterol
LDL cholesterol
HDL cholesterol
| |
| Notes | ||
| Risk of bias | ||
| Bias | Authors' judgement | Support for judgement |
| Random sequence generation (selection bias) | High risk | Judgement Comment: Controlled before‐and‐after design |
| Allocation concealment (selection bias) | High risk | Judgement Comment: Controlled before‐and‐after design |
| Blinding of participants and personnel (performance bias) | Low risk | Judgement Comment: Lipid parameter measurements unlikely to be influenced by lack of blinding |
| Blinding of outcome assessment (detection bias) | Low risk | Judgement Comment: Lipid parameters were measured in a remote laboratory. |
| Selective reporting (reporting bias) | Low risk | Judgement Comment: LDL‐cholesterol outcome was reported. |
| Other bias | High risk | Judgement Comment: This work was supported in part by a grant from the Ministry of Education, Science and Sports of Japan and "an unrestricted grant" from Kowa Pharmaceutical. |
| Incomplete outcome data (attrition bias) Total cholesterol | High risk | [(91 ‐ 65)/91]*100 = 28.6% were not included in the efficacy analysis. |
| Incomplete outcome data (attrition bias) LDL cholesterol) | High risk | [(91 ‐ 65)/91]*100 = 28.6% were not included in the efficacy analysis. |
| Incomplete outcome data (attrition bias) HDL cholesterol | High risk | [(91 ‐ 65)/91]*100 = 28.6% were not included in the efficacy analysis. |
| Incomplete outcome data (attrition bias) Triglycerides | High risk | [(91 ‐ 65)/91]*100 = 28.6% were not included in the efficacy analysis. |
| Blinding of outcome assessment (detection bias)WDAEs | High risk | No comparison possible |
| Selective reporting (reporting bias) for WDAEs | High risk | No WDAE outcome reported |
| Study characteristics | ||
| Methods | Study design: Randomised controlled trial Study grouping: Parallel group Method: No participant received lipid medications within 6 months of randomisation therefore no washout required 1 month single‐blind randomised placebo‐controlled study only the patients were blinded to the content of the tablets | |
| Participants | Baseline Characteristics 4 mg
Placebo
Overall
Included criteria: The study enroled 65 consecutive patients with ACS, the presence of carotid plaque [intima‐media thickness (IMT) ≥ 1.1 mm], and hypercholesterolaemia (260 > total cholesterol levels ≥ 220 mg/dL). ACS was diagnosed by the presence of acute ischaemic symptoms lasting ≥ 20 minutes within 48 hours before admission to our hospital, and electrocardiographic (ECG) changes consistent with ACS. The presence of ACS was confirmed by coronary angiography in all patients. Acute myocardial infarction (AMI) was diagnosed when creatine kinase‐MB levels increased by at least 2 times the upper level of normal (3.5 ng/mL). Patients without AMI were considered to have unstable angina pectoris (u‐AP). According to these inclusion criteria, 47 patients were diagnosed as u‐AP, and 18 patients were diagnosed as AMI. Excluded criteria: (1) use of statin or other lipid‐lowering agents during the preceding 6 months, (2) history of hepatic disease, (3) untreated endocrine disorder, (4) history of systemic inflammatory diseases, (5) infectious diseases, (6) history of hypersensitivity to statins, (7) cardiogenic shock or pulmonary oedema at admission, or (8) stroke at admission Baseline Group Characteristics: 65 consecutive patients with ACS were randomised. Profiles of traditional risk factors, calibrated IBS values, and levels of CRP, VEGF, and TNFa were similar between the 2 treatment groups. All ACS patients took aspirin and ticlopidine orally during the follow‐up period, and other medications and invasive therapy for culprit lesions were similar in both treatment groups | |
| Interventions | Intervention Characteristics 4 mg Placebo | |
| Outcomes | Total cholesterol
LDL cholesterol
HDL cholesterol
Triglycerides
WDAE
| |
| Notes | ||
| Risk of bias | ||
| Bias | Authors' judgement | Support for judgement |
| Random sequence generation (selection bias) | Low risk | Judgement Comment: The ACS patients were randomly assigned using a random number table generated by a computer. |
| Allocation concealment (selection bias) | High risk | Judgement Comment: Single‐blind allocation concealment was not applied to the investigators. |
| Blinding of participants and personnel (performance bias) | Low risk | Judgement Comment: Single‐blind (only participants); however, lipid parameter measurements unlikely to be influenced by lack of blinding |
| Blinding of outcome assessment (detection bias) | Low risk | Judgement Comment: Lipid parameters were measured in a remote laboratory. |
| Selective reporting (reporting bias) | Low risk | Judgement Comment: LDL‐cholesterol outcome was reported and WDAEs were reported; all of the study participants completed the trial with no WDAEs. |
| Other bias | Low risk | Judgement Comment: This study was supported by Grants‐in‐Aid for (B)(2)‐15390244 and (B)‐19390209, Priority Areas (C) ‘‘Medical Genome Science 15012222’’ from the Ministry of Education, Culture, Sports, Science, and Technology, and by Health and Labor Sciences Research Grants for Comprehensive Research on Aging and Health (H15‐Choju‐012), Tokyo, Japan, government grants |
| Incomplete outcome data (attrition bias) Total cholesterol | Low risk | All participants were included in the efficacy analysis. |
| Incomplete outcome data (attrition bias) LDL cholesterol) | Low risk | All participants were included in the efficacy analysis. |
| Incomplete outcome data (attrition bias) HDL cholesterol | Low risk | All participants were included in the efficacy analysis. |
| Incomplete outcome data (attrition bias) Triglycerides | Low risk | All participants were included in the efficacy analysis. |
| Blinding of outcome assessment (detection bias)WDAEs | High risk | Single‐blinded trial |
| Selective reporting (reporting bias) for WDAEs | Low risk | WDAE outcome reported |
| Study characteristics | ||
| Methods | Study design: Randomised controlled trial Study grouping: Parallel group Method: 4‐week single‐blind placebo run‐in period; 12‐week randomised double‐blind placebo‐controlled study with evening dosing | |
| Participants | Baseline Characteristics 1 mg
2 mg
4 mg
8 mg
Placebo
Overall
Included criteria: 18‐75 years; females of childbearing potential to be on oral contraception of at least 3 months; and willingness to adhere to the National Cholesterol Education Program (NCEP) Step‐1 or equivalent diet. Subjects had primary hypercholesterolaemia with LDL‐cholesterol ≥ 160 mg/dL (4.13 mmol/L) but ≤ 250 mg/dL (6.46 mmol/L), and triglyceride (TG) level ≤ 300 mg/dL (3.43 mmol/L) at Visit 3. Excluded criteria: pregnancy, or not taking oral contraception; • BMI > 30 kg/m2; • alcohol abuse; • hypersensitivity to HMG‐CoA reductase inhibitors; • use of prohibited concomitant medications; • compliance 80% during run‐in period; • diabetes or fasting serum glucose ≥ 7 mmol/L at Visit 2; • renal impairment or serum creatinine > 1.8 mg/dL or nephrotic syndrome; • uncontrolled hypertension or diastolic blood pressure (DBP) ≥ 110 mmHg or systolic blood pressure (SBP) ≥ 180 mmHg; • history of myocardial infarction, unstable angina, stroke, transient ischaemic attack (TIA), percutaneous transluminal coronary angioplasty (PTCA) or coronary artery bypass graft (CABG); • NYHA class 3 or 4 congestive cardiac failure; • active liver disease or AST or alanine aminotransferase (ALT) > 2 times ULN; • muscular or neuromuscular disease or creatinine kinase (CK) > 3 times ULN without explanation; • malignancy within past 10 years; • known cataracts; • human immunodeficiency virus (HIV) infection; • severe depression or suicidal tendencies; • Type I, IIb, III, IV or V hyperlipidaemia; • familial hypercholesterolaemia or LDL‐C > 250 mg/dL at Visit 3; and • hypercholesterolaemia secondary to hypothyroidism Baseline Group Characteristics:NR | |
| Interventions | Intervention Characteristics 1 mg 2 mg 4 mg 8 mg Placebo | |
| Outcomes | Total cholesterol
LDL cholesterol
HDL cholesterol
Triglycerides
| |
| Notes | Stephen P on 22/11/2018 13:02 | |
| Risk of bias | ||
| Bias | Authors' judgement | Support for judgement |
| Random sequence generation (selection bias) | Unclear risk | Judgement Comment: Method of sequence generation was not reported. |
| Allocation concealment (selection bias) | Low risk | Judgement Comment: A centralised randomising system was used. |
| Blinding of participants and personnel (performance bias) | Low risk | Judgement Comment: Double‐blind. Study medication was blinded and investigators did not receive lipid values during treatment period until after study completion. |
| Blinding of outcome assessment (detection bias) | Low risk | Judgement Comment: Lipid parameters were measured in a remote laboratory. |
| Selective reporting (reporting bias) | Low risk | Judgement Comment: LDL cholesterol outcome was reported. |
| Other bias | High risk | Judgement Comment: Trial sponsored by laboratories Negma, a pharmaceutical company in France. |
| Incomplete outcome data (attrition bias) Total cholesterol | Low risk | [(252 ‐ 249)/252]*100 = 1.2 % participants were not included in the efficacy analysis. |
| Incomplete outcome data (attrition bias) LDL cholesterol) | Low risk | [(252 ‐ 249)/252]*100 = 1.2 % participants were not included in the efficacy analysis. |
| Incomplete outcome data (attrition bias) HDL cholesterol | Low risk | [(252 ‐ 249)/252]*100 = 1.2 % participants were not included in the efficacy analysis. |
| Incomplete outcome data (attrition bias) Triglycerides | Low risk | [(252 ‐ 249)/252]*100 = 1.2 % participants were not included in the efficacy analysis. |
| Blinding of outcome assessment (detection bias)WDAEs | High risk | No WDAEs were reported. |
| Selective reporting (reporting bias) for WDAEs | High risk | No WDAE outcome reported |
| Study characteristics | ||
| Methods | Study design: Randomised controlled trial Study grouping: Parallel group Methods: 4‐week placebo washout run‐in period; 12‐week randomised double‐blind placebo‐controlled study with evening dosing | |
| Participants | Baseline Characteristics 1 mg
2 mg
4 mg
Placebo
Overall
Included criteria: 18‐75 years; females of childbearing potential to be on oral contraception of at least 3 months; and willingness to adhere to the National Cholesterol Education Program (NCEP) Step‐1 or equivalent diet. Subjects had primary mixed or combined hyperlipidaemia with LDL‐C level ≥ 135 and ≤ 300 mg/dL (≥ 3.5 and ≤ 7.8 mmol/L) and TG ≥ 175 and ≤ 500 mg/dL (≥ 2.0 and ≤ 5.7 mmol/L). Excluded criteria: pregnancy, or not taking oral contraception; • BMI > 33 kg/m2; • alcohol abuse; • hypersensitivity to HMG‐CoA reductase inhibitors; • use of prohibited concomitant medications; • compliance 80% during run in period; • diabetes or fasting serum glucose ≥ 7 mmol/L at Visit 2; • renal impairment or serum creatinine > 1.8 mg/dL or nephrotic syndrome; • uncontrolled hypertension or diastolic blood pressure (DBP) ≥110 mmHg or systolic blood pressure (SBP) ≥ 180 mmHg; • history of myocardial infarction, unstable angina, stroke, transient ischaemic attack (TIA), percutaneous transluminal coronary angioplasty (PTCA) or coronary artery bypass graft (CABG); • NYHA class 3 or 4 congestive cardiac failure; • active liver disease or AST or alanine aminotransferase (ALT) > 2 times ULN; • muscular or neuromuscular disease or creatinine kinase (CK) > 3 times ULN without explanation; • malignancy within past 10 years; • known cataracts; • human immunodeficiency virus (HIV) infection; • severe depression or suicidal tendencies; • Type I, IIb, III, IV or V hyperlipidaemia; • familial hypercholesterolaemia or LDL‐C > 250 mg/dL at Visit 3; and • hypercholesterolaemia secondary to hypothyroidism Baseline Group Characteristics:NR | |
| Interventions | Intervention Characteristics 1 mg 2 mg 4 mg Placebo | |
| Outcomes | LDL cholesterol
Total cholesterol
HDL cholesterol
Triglycerides
WDAE
| |
| Notes | ||
| Risk of bias | ||
| Bias | Authors' judgement | Support for judgement |
| Random sequence generation (selection bias) | Unclear risk | Judgement Comment: Method of sequence generation was not reported. |
| Allocation concealment (selection bias) | Low risk | Judgement Comment: A centralised randomising system was used. |
| Blinding of participants and personnel (performance bias) | Low risk | Judgement Comment: double‐blind. Study medication was blinded and investigators did not receive lipid values during treatment period until after study completion. |
| Blinding of outcome assessment (detection bias) | Low risk | Judgement Comment: Lipid parameters were measured in a remote laboratory. |
| Selective reporting (reporting bias) | Low risk | Judgement Comment: LDL cholesterol outcome was reported. |
| Other bias | High risk | Judgement Comment: The study was sponsored by Laboratories Negma, a pharmaceutical company in France. |
| Incomplete outcome data (attrition bias) Total cholesterol | Low risk | [(261 ‐ 251)/261)]*100 = 3.8% participants were not included in the efficacy analysis. |
| Incomplete outcome data (attrition bias) LDL cholesterol) | Low risk | [(261 ‐ 251)/261)]*100 = 3.8% participants were not included in the efficacy analysis. |
| Incomplete outcome data (attrition bias) HDL cholesterol | Low risk | [(261 ‐ 251)/261)]*100 = 3.8% participants were not included in the efficacy analysis. |
| Incomplete outcome data (attrition bias) Triglycerides | Low risk | [(261 ‐ 251)/261)]*100 = 3.8% participants were not included in the efficacy analysis. |
| Blinding of outcome assessment (detection bias)WDAEs | Unclear risk | Blinding method was not described. |
| Selective reporting (reporting bias) for WDAEs | Low risk | WDAE outcome reported |
| Study characteristics | ||
| Methods | Study design: Randomised controlled trial Study grouping: Parallel group Methods: 6 to 8‐week dietary washout period; 8‐week randomised double‐blind placebo‐controlled trial | |
| Participants | Baseline Characteristics none reported Included criteria: participants 18 to 80 years with plasma mean LDL‐C levels at two consecutive qualifying visits ≥ 130 mg/dL and ≤ 220 mg/dL, and triglycerides ≤ 400 mg/dL Excluded criteria: pregnancy, or not taking oral contraception; • BMI > 30 kg/m2; • alcohol abuse; • hypersensitivity to HMG‐CoA reductase inhibitors; • use of prohibited concomitant medications; • compliance < 80% during run‐in period; • diabetes or fasting serum glucose ≥ 7 mmol/L at Visit 2; • renal impairment or serum creatinine > 1.8 mg/dL or nephrotic syndrome; • uncontrolled hypertension or diastolic blood pressure (DBP) ≥ 110 mmHg or systolic blood pressure (SBP) ≥ 180 mmHg; • history of myocardial infarction, unstable angina, stroke, transient ischaemic attack (TIA), percutaneous transluminal coronary angioplasty (PTCA) or coronary artery bypass graft (CABG); • NYHA class 3 or 4 congestive cardiac failure; • active liver disease or AST or alanine aminotransferase (ALT) > 2 times ULN; • muscular or neuromuscular disease or creatinine kinase (CK) > 3 times ULN without explanation; • malignancy within past 10 years; • known cataracts; • human immunodeficiency virus (HIV) infection; • severe depression or suicidal tendencies; • Type I, IIb, III, IV or V hyperlipidaemia; • familial hypercholesterolaemia or LDL‐C > 250 mg/dL at Visit 3; and • hypercholesterolaemia secondary to hypothyroidism Baseline Group Characteristics:NR | |
| Interventions | Intervention Characteristics 8 mg 16 mg Placebo | |
| Outcomes | LDL cholesterol
| |
| Notes | ||
| Risk of bias | ||
| Bias | Authors' judgement | Support for judgement |
| Random sequence generation (selection bias) | Unclear risk | Judgement Comment: Random sequence generation method not reported |
| Allocation concealment (selection bias) | Unclear risk | Judgement Comment: Allocation concealment not reported |
| Blinding of participants and personnel (performance bias) | Low risk | Judgement Comment: Double‐blind treatment lipid parameter measurements unlikely to be influenced by lack of proper blinding |
| Blinding of outcome assessment (detection bias) | Low risk | Judgement Comment: Lipid parameters were measured in a remote laboratory. |
| Selective reporting (reporting bias) | Low risk | Judgement Comment: LDL‐cholesterol outcome was reported. |
| Other bias | High risk | Judgement Comment: Sankyo Pharma sponsored the trial. |
| Incomplete outcome data (attrition bias) Total cholesterol | High risk | No total cholesterol data reported |
| Incomplete outcome data (attrition bias) LDL cholesterol) | Low risk | [(54 ‐ 53)/54]*100 = 1.9% participants for placebo group [(107 ‐ 103)/107]*100 = 3.7% participants for the pitavastatin 8 mg/day group [(107 ‐ 103)/107]*100 = 3.7% participants for the pitavastatin 16 mg/day group |
| Incomplete outcome data (attrition bias) HDL cholesterol | High risk | No HDL cholesterol data reported |
| Incomplete outcome data (attrition bias) Triglycerides | High risk | No triglyceride data reported |
| Blinding of outcome assessment (detection bias)WDAEs | High risk | No WDAE data reported |
| Selective reporting (reporting bias) for WDAEs | High risk | No WDAE outcome reported |
| Study characteristics | ||
| Methods | Study design: Historically controlled trial Study grouping: Method: 4‐8 week placebo washout period; 8‐week before‐and‐after study with evening dosing | |
| Participants | Baseline Characteristics 2 mg
Included criteria: 25 patients with heterozygous familial hypercholesterolaemia with primary hypercholesterolaemia (TC > 230 mg/dL) with tendon xanthoma or first‐degree relatives of previously diagnosed heterozygous FH patients. Achilles’ tendon xanthoma was observed in 21 patients and xanthelasma in four. Excluded criteria: not reported. Baseline Group Characteristics:NR | |
| Interventions | Intervention Characteristics 2 mg | |
| Outcomes | Total cholesterol
LDL cholesterol
HDL cholesterol
| |
| Notes | Stephen P on 02/02/2018 08:37 | |
| Risk of bias | ||
| Bias | Authors' judgement | Support for judgement |
| Random sequence generation (selection bias) | High risk | Judgement Comment: Controlled before‐and‐after design |
| Allocation concealment (selection bias) | High risk | Judgement Comment: Controlled before‐and‐after design |
| Blinding of participants and personnel (performance bias) | Low risk | Judgement Comment: Lipid parameter measurements unlikely to be influenced by lack of blinding |
| Blinding of outcome assessment (detection bias) | Low risk | Judgement Comment: Lipid parameters were measured in a remote laboratory. |
| Selective reporting (reporting bias) | Low risk | Judgement Comment: LDL‐cholesterol outcome was reported. |
| Other bias | Unclear risk | Judgement Comment: Source of funding was not reported. |
| Incomplete outcome data (attrition bias) Total cholesterol | High risk | [(36 ‐ 25)/36]*100 = 30.6% were not included in the efficacy analysis. |
| Incomplete outcome data (attrition bias) LDL cholesterol) | High risk | [(36 ‐ 25)/36]*100 = 30.6% were not included in the efficacy analysis. |
| Incomplete outcome data (attrition bias) HDL cholesterol | High risk | [(36 ‐ 25)/36]*100 = 30.6% were not included in the efficacy analysis. |
| Incomplete outcome data (attrition bias) Triglycerides | High risk | [(36 ‐ 25)/36]*100 = 30.6% were not included in the efficacy analysis. |
| Blinding of outcome assessment (detection bias)WDAEs | High risk | No comparison possible |
| Selective reporting (reporting bias) for WDAEs | High risk | No WDAE outcome reported |
| Study characteristics | ||
| Methods | Study design: Historically controlled trial Study grouping: Method: 8‐week washout period; 12‐week before‐and‐after study | |
| Participants | Baseline Characteristics 2 mg
Included criteria: Eight patients with heterozygous familial hypercholesterolaemia (male/female = 1/7, mean age = 62 ± 6 years) were studied. FH was diagnosed according to the following two criteria: primary hypercholesterolaemic patients (TC level above 230 mg/dL in any age group) with tendon xanthomas, or primary hypercholesterolaemic patients with and without tendon xanthomas in a first‐degree relative of familial hypercholesterolaemic patients. Excluded criteria: Not reported Baseline Group Characteristics: There was no significant difference in age, gender, body mass index, TC, LDL‐C, HDL‐C, TG, sd‐LDL‐C and RLP‐C levels between the two groups | |
| Interventions | Intervention Characteristics 2 mg | |
| Outcomes | Total cholesterol
LDL cholesterol
HDL cholesterol
Triglycerides
| |
| Notes | ||
| Risk of bias | ||
| Bias | Authors' judgement | Support for judgement |
| Random sequence generation (selection bias) | High risk | Judgement Comment: Controlled before‐and‐after design |
| Allocation concealment (selection bias) | High risk | Judgement Comment: Controlled before‐and‐after design |
| Blinding of participants and personnel (performance bias) | Low risk | Judgement Comment: Lipid parameter measurements unlikely to be influenced by lack of blinding |
| Blinding of outcome assessment (detection bias) | Low risk | Judgement Comment: Lipid parameters were measured in a remote laboratory. |
| Selective reporting (reporting bias) | Low risk | Judgement Comment: LDL cholesterol outcome was reported. |
| Other bias | Unclear risk | Judgement Comment: Source of funding was not reported. |
| Incomplete outcome data (attrition bias) Total cholesterol | Low risk | All participants were included in the efficacy analysis. |
| Incomplete outcome data (attrition bias) LDL cholesterol) | Low risk | All participants were included in the efficacy analysis. |
| Incomplete outcome data (attrition bias) HDL cholesterol | Low risk | All participants were included in the efficacy analysis. |
| Incomplete outcome data (attrition bias) Triglycerides | Low risk | All participants were included in the efficacy analysis. |
| Blinding of outcome assessment (detection bias)WDAEs | High risk | No comparison possible |
| Selective reporting (reporting bias) for WDAEs | High risk | No WDAE outcome reported |
| Study characteristics | ||
| Methods | Study design: Historically controlled trial Study grouping: Method: No washout required because participants were not treated for hypercholesterolaemia; 3‐month before‐and‐after study | |
| Participants | Baseline Characteristics 2 mg
Included criteria: None of the patients had any current or past history of ischaemic heart disease. Excluded criteria: Previous usage of stains; taking any medication that might potentially affect the PPAR and insulin resistance, such as pioglitazone and fibrates; taking medication for anticoagulation, or antiplatelet drugs; severe hepatic, respiratory or renal disease failure, haematologic diseases or other grave complications; oral steroid use; and a history of poor drug compliance Baseline Group Characteristics: None of the patients had any current or past history of ischaemic heart disease | |
| Interventions | Intervention Characteristics 2 mg | |
| Outcomes | Total cholesterol
LDL cholesterol
HDL cholesterol
Triglycerides
| |
| Notes | ||
| Risk of bias | ||
| Bias | Authors' judgement | Support for judgement |
| Random sequence generation (selection bias) | High risk | Judgement Comment: Controlled before‐and‐after design |
| Allocation concealment (selection bias) | High risk | Judgement Comment: Controlled before‐and‐after design |
| Blinding of participants and personnel (performance bias) | Low risk | Judgement Comment: Lipid parameter measurements unlikely to be influenced by lack of blinding |
| Blinding of outcome assessment (detection bias) | Low risk | Judgement Comment: Lipid parameters were measured in a remote laboratory. |
| Selective reporting (reporting bias) | Low risk | Judgement Comment: LDL‐cholesterol outcome was reported. |
| Other bias | Unclear risk | Judgement Comment: Source of funding was not reported. |
| Incomplete outcome data (attrition bias) Total cholesterol | Low risk | All participants were included in the efficacy analysis. |
| Incomplete outcome data (attrition bias) LDL cholesterol) | Low risk | All participants were included in the efficacy analysis. |
| Incomplete outcome data (attrition bias) HDL cholesterol | Low risk | All participants were included in the efficacy analysis. |
| Incomplete outcome data (attrition bias) Triglycerides | Low risk | All participants were included in the efficacy analysis. |
| Blinding of outcome assessment (detection bias)WDAEs | High risk | No comparison possible |
| Selective reporting (reporting bias) for WDAEs | High risk | No WDAE outcome reported |
| Study characteristics | ||
| Methods | Study design: Historically controlled trial Study grouping: Method: 6‐8 week washout dietary lead‐in period; 12‐week before‐and‐after trial with evening dosing | |
| Participants | Baseline Characteristics 2 mg
Included criteria: men and non‐pregnant, non‐lactating women aged 18–75 years, Women of childbearing potential were only permitted to participate if they were using a reliable method of contraception throughout; mean LDL‐C levels ≥ 160 mg/dL (4.1 mmol/L) and ≤ 220 mg/dL (5.7 mmol/L) and mean TG levels of ≤ 400 mg/dL (4.6 mmol/L at the end of the run‐in qualified for randomisation) Excluded criteria: previous contraindications or intolerance to statin therapy, homozygous familial hypercholesterolaemia, familial hypoalphalipoproteinaemia, medical conditions that might cause secondary dyslipidaemia, uncontrolled diabetes mellitus, pregnancy, conditions affecting absorption, distribution, metabolism, or excretion of drugs, symptomatic heart failure (New York Heart Association classification III or IV), significant cardiovascular disease, such as myocardial infarction, coronary or peripheral artery angioplasty, bypass graft surgery, or severe or unstable angina pectoris, impaired pancreatic function, liver enzyme levels greater than 1.5 times the upper limit of normal, impaired renal function, impaired urinary tract function, uncontrolled hypothyroidism, symptomatic cerebrovascular disease, left ventricular ejection fraction lower than 0.25, uncontrolled hypertension, muscular or neuromuscular disease, neoplastic disease, treatment with other lipid‐lowering drugs and medications potentially altering the pharmacokinetics of statins. Patients with serum creatine kinase (CK) activity greater than the upper limit of the reference range (ULRR) without clinical explanation Baseline Group Characteristics: The four treatment groups were similar with respect to age, sex, and race. Overall, there were more females than males 61 vs. 39% – in the safety population. Average age was 58 years and mean values for height, weight and BMI were very similar across the four treatment groups. | |
| Interventions | Intervention Characteristics 2 mg | |
| Outcomes | Total cholesterol
LDL cholesterol
HDL cholesterol
Triglycerides
| |
| Notes | ||
| Risk of bias | ||
| Bias | Authors' judgement | Support for judgement |
| Random sequence generation (selection bias) | High risk | Judgement Comment: Controlled before‐and‐after design |
| Allocation concealment (selection bias) | High risk | Judgement Comment: Controlled before‐and‐after design |
| Blinding of participants and personnel (performance bias) | Low risk | Judgement Comment: Lipid parameter measurements unlikely to be influenced by lack of blinding |
| Blinding of outcome assessment (detection bias) | Low risk | Judgement Comment: Lipid parameters were measured in a remote laboratory. |
| Selective reporting (reporting bias) | Low risk | Judgement Comment: LDL‐C outcome was reported. |
| Other bias | High risk | Judgement Comment: The trial was supported by Kowa Research Europe Ltd. L.O. is a consultant/advisor to Kowa. |
| Incomplete outcome data (attrition bias) Total cholesterol | Low risk | [(315 ‐ 307)/315)]*100 = 2.5% were not included in the efficacy analysis. |
| Incomplete outcome data (attrition bias) LDL cholesterol) | Low risk | [(315 ‐ 307)/315)]*100 = 2.5% were not included in the efficacy analysis. |
| Incomplete outcome data (attrition bias) HDL cholesterol | Low risk | [(315 ‐ 307)/315)]*100 = 2.5% were not included in the efficacy analysis. |
| Incomplete outcome data (attrition bias) Triglycerides | Low risk | [(315 ‐ 307)/315)]*100 = 2.5% were not included in the efficacy analysis. |
| Blinding of outcome assessment (detection bias)WDAEs | High risk | No comparison possible |
| Selective reporting (reporting bias) for WDAEs | High risk | No WDAE outcome reported |
| Study characteristics | ||
| Methods | Study design: Historically controlled trial Study grouping: Method: 4‐week washout dietary lead‐in period; 8‐week before‐and‐after study | |
| Participants | Baseline Characteristics 2 mg
Included criteria: Korean men and women who were aged between 20 and 75 years with fasting triglyceride levels 600 mg/dL and LDL cholesterol levels > 130 mg/dL. The dietary guidelines recommended by the Guideline Committee for Hyperlipidemia Management in Korea were used for the lead‐in period, and the patients continued the diet after randomisation. These recommendations were defined as a diet comprising ≤ 20% of total calories from fat, ≤ 6% of total calories from saturated fat, and a daily cholesterol intake of 200 mg/dL. Excluded criteria: participation in other studies 3 months before enrolment; currently taking any kind of antihyperlipidaemic drug; suffering from uncontrolled diabetes (fasting plasma glucose, ≥ 180 mg/dL), thyroid dysfunction (abnormal thyroid‐stimulating hormone values 0.035 lalU/mL or > 3.1 plU/mL), or uncontrolled hypertension (diastolic blood pressure, > 115 mm Hg); symptomatic cerebrovascular disease or myocardial infarction within 3 months of enrolment; creatine kinase (CK) levels > 2 times the upper limit of normal (ULN); aspartate or alanine aminotransferase levels > 2.5 times ULN; and serum creatinine levels > 2.5 times ULN. Pregnant or breastfeeding women. Baseline Group Characteristics: No significant between‐group differences were found for baseline total cholesterol (P = 0.316), triglyceride (P = 0.278), LDL cholesterol (P = 0.403), or HDL cholesterol (P = 0.615) levels between groups. | |
| Interventions | Intervention Characteristics 2 mg | |
| Outcomes | Total cholesterol
LDL cholesterol
HDL cholesterol
Triglycerides
| |
| Notes | Stephen P on 30/06/2018 10:40 | |
| Risk of bias | ||
| Bias | Authors' judgement | Support for judgement |
| Random sequence generation (selection bias) | High risk | Judgement Comment: Controlled before‐and‐after design |
| Allocation concealment (selection bias) | High risk | Judgement Comment: Controlled before‐and‐after design |
| Blinding of participants and personnel (performance bias) | Low risk | Judgement Comment: Lipid parameter measurements unlikely to be influenced by lack of blinding |
| Blinding of outcome assessment (detection bias) | Low risk | Judgement Comment: Lipid parameters were measured in a remote laboratory. |
| Selective reporting (reporting bias) | Low risk | Judgement Comment: LDL‐cholesterol outcome was reported. |
| Other bias | High risk | Judgement Comment: This study was sponsored by Choongwae Pharma Corporation, Seoul, South Korea. |
| Incomplete outcome data (attrition bias) Total cholesterol | Low risk | [(52 ‐ 49)/52)]*100 = 5.8% participants were not included in the efficacy analysis. |
| Incomplete outcome data (attrition bias) LDL cholesterol) | Low risk | [(52 ‐ 49)/52)]*100 = 5.8% participants were not included in the efficacy analysis. |
| Incomplete outcome data (attrition bias) HDL cholesterol | Low risk | [(52 ‐ 49)/52)]*100 = 5.8% participants were not included in the efficacy analysis. |
| Incomplete outcome data (attrition bias) Triglycerides | High risk | [(52 ‐ 28)/52]*100 = 46.2% participants were not included in the efficacy analysis. |
| Blinding of outcome assessment (detection bias)WDAEs | High risk | No comparison possible |
| Selective reporting (reporting bias) for WDAEs | High risk | No WDAE outcome reported |
| Study characteristics | ||
| Methods | Study design: Historically controlled trial Study grouping: Method: 6‐week washout/dietary stabilisation; 12‐week before‐and‐after study | |
| Participants | Baseline Characteristics 4 mg
Included criteria: Participants were aged 18 to 80 years with either primary hyperlipidaemia or mixed dyslipidaemia. After a 6‐week washout/dietary stabilisation, subjects had LDL‐C levels of 130 to 220 mg/dL and TG levels ≤ 400 mg/dL. Excluded criteria: Familial hypercholesterolaemia, secondary causes of dyslipidaemia such as nephrotic syndrome, previous intolerance or allergy to statins, uncontrolled diabetes mellitus (defined as a glycosylated haemoglobin level > 8%), poorly controlled hypertension (blood pressure ≥ 160/100 mm Hg), or the presence of any unstable medical conditions Baseline Group Characteristics: The majority of participants in both groups were white (89.0% and 86.0%, respectively). Approximately 70% of participants in both groups were diagnosed with primary hyperlipidaemia and the other 30% with mixed dyslipidaemia. | |
| Interventions | Intervention Characteristics 4 mg | |
| Outcomes | HDL cholesterol
| |
| Notes | ||
| Risk of bias | ||
| Bias | Authors' judgement | Support for judgement |
| Random sequence generation (selection bias) | High risk | Judgement Comment: Controlled before‐and‐after design |
| Allocation concealment (selection bias) | High risk | Judgement Comment: Controlled before‐and‐after design |
| Blinding of participants and personnel (performance bias) | Low risk | Judgement Comment: Lipid parameter measurements unlikely to be influenced by lack of blinding |
| Blinding of outcome assessment (detection bias) | Low risk | Judgement Comment: Lipid parameters were measured in a remote laboratory. |
| Selective reporting (reporting bias) | High risk | Judgement Comment: LDL‐cholesterol outcome was not reported. |
| Other bias | High risk | Judgement Comment: Dr. Sponseller is an employee of Kowa Pharmaceuticals America, Inc. Kowa Pharmaceuticals sell pitavastatin |
| Incomplete outcome data (attrition bias) Total cholesterol | High risk | No outcome reported |
| Incomplete outcome data (attrition bias) LDL cholesterol) | High risk | No outcome reported |
| Incomplete outcome data (attrition bias) HDL cholesterol | Low risk | [(164 ‐ 157)/164]*100 = 4.3% participants were not included in the efficacy analysis |
| Incomplete outcome data (attrition bias) Triglycerides | High risk | No outcome reported |
| Blinding of outcome assessment (detection bias)WDAEs | High risk | No comparison possible |
| Selective reporting (reporting bias) for WDAEs | High risk | No WDAE outcome reported |
| Study characteristics | ||
| Methods | Study design: Historically controlled trial Study grouping: Parallel group Method: 4‐week or longer run‐in period; 12‐week before‐and‐after study with evening dosing | |
| Participants | Baseline Characteristics 1 mg
2 mg
4 mg
Included criteria: 273 patients with hyperlipidaemia with serum total cholesterol levels ≥ 220 mg/dL, aged 25‐75 years Excluded criteria: None reported Baseline Characteristics: There was no imbalance between the 3 dose groups with regard to age, sex ratio, WHO classification for hyperlipidaemia, weight or height, although imbalances were noted with regard to the familial hypercholesterolaemia (FH) and baseline serum lipid levels (TC, TG, HDL‐C and LDL‐C) | |
| Interventions | Intervention Characteristics 1 mg 2 mg 4 mg | |
| Outcomes | Total cholesterol
LDL cholesterol
HDL cholesterol
Triglycerides
| |
| Notes | ||
| Risk of bias | ||
| Bias | Authors' judgement | Support for judgement |
| Random sequence generation (selection bias) | High risk | Judgement Comment: Controlled before‐and‐after design |
| Allocation concealment (selection bias) | High risk | Judgement Comment: Controlled before‐and‐after design |
| Blinding of participants and personnel (performance bias) | Low risk | Judgement Comment: Lipid parameter measurements unlikely to be influenced by lack of blinding |
| Blinding of outcome assessment (detection bias) | Low risk | Judgement Comment: Lipid parameters were measured in a remote laboratory. |
| Selective reporting (reporting bias) | Low risk | Judgement Comment: LDL‐cholesterol outcome was reported. |
| Other bias | Unclear risk | Judgement Comment: Source of funding was not reported. |
| Incomplete outcome data (attrition bias) Total cholesterol | Low risk | [(90 ‐ 84)/90)]*100 = 6.7% participants were not included in the efficacy analysis for pitavastatin 1 mg/day; [(90 ‐ 82)/90]*100 = 8.9% participants were not included in the efficacy analysis for pitavastatin 2 mg/day; [(86 ‐ 85)/86]*100 = 1.2% participants were not included in the efficacy analysis for pitavastatin 4 mg/day. |
| Incomplete outcome data (attrition bias) LDL cholesterol) | High risk | [(90 ‐ 81)/90]*100 = 10% participants were not included in the efficacy analysis for pitavastatin 1 mg/day; [(90 ‐ 73)/90]*100 = 18.9% participants were not included in the efficacy analysis for pitavastatin 2 mg/day; [(86 ‐ 77)/86]*100 = 10.5% participants were not included in the efficacy analysis for pitavastatin 4 mg/day; [(266 ‐ 231)/266]*100 = 13.2% participants were not included in the efficacy analysis for all doses. |
| Incomplete outcome data (attrition bias) HDL cholesterol | Low risk | [(90 ‐ 84)/90]*100 = 6.7% participants were not included in the efficacy analysis for pitavastatin 1 mg/day; [(90 ‐ 82)/90]*100 = 8.9% participants were not included in the efficacy analysis for pitavastatin 2 mg/day; [(86 ‐ 85)/86]*100 = 1.2% participants were not included in the efficacy analysis for pitavastatin 4 mg/day. |
| Incomplete outcome data (attrition bias) Triglycerides | Low risk | [(90 ‐ 83)/90]*100 = 7.8% participants were not included in the efficacy analysis for pitavastatin 1 mg/day; [(90 ‐ 80)/90]*100 = 11.1% participants were not included in the efficacy analysis for pitavastatin 2 mg/day; [(86 ‐ 83)/86]*100 = 3.5% participants were not included in the efficacy analysis for pitavastatin 4 mg/day; [(266 ‐ 246)/266]*100 = 7.5% participants were not included in the efficacy analysis for all doses. |
| Blinding of outcome assessment (detection bias)WDAEs | High risk | No comparison possible |
| Selective reporting (reporting bias) for WDAEs | High risk | No WDAE outcome reported |
| Study characteristics | ||
| Methods | Study design: Historically controlled trial Study grouping: Method: more than 4 weeks run‐in period; 12‐week before‐and‐after study with evening dosing | |
| Participants | Baseline Characteristics 2 mg
Included criteria: Women and men between the ages of 20 and 75 years with primary hyperlipidaemia, with a TC value ≥ 220 mg/dL and TG values ≤ 400 mg/dL Excluded criteria: Pregnant women and those who were breastfeeding, subjects who had taken pitavastatin, had participated in other studies 4 months prior to the study, suffered from uncontrolled diabetes mellitus or severe hypertension or had a cerebrovascular disorder or myocardial infarction diagnosed 3 months prior to the study, heart failure, hepatic or renal dysfunction or drug allergy. Baseline Group Characteristics: Based on baseline characteristics, all demographic and prognostic factors and lipid parameters were well balanced between the two treatment groups. | |
| Interventions | Intervention Characteristics 2 mg | |
| Outcomes | Total cholesterol
LDL cholesterol
HDL cholesterol
Triglycerides
| |
| Notes | ||
| Risk of bias | ||
| Bias | Authors' judgement | Support for judgement |
| Random sequence generation (selection bias) | High risk | Judgement Comment: Controlled before‐and‐after design |
| Allocation concealment (selection bias) | High risk | Judgement Comment: Controlled before‐and‐after design |
| Blinding of participants and personnel (performance bias) | Low risk | Judgement Comment: Lipid parameter measurements unlikely to be influenced by lack of blinding |
| Blinding of outcome assessment (detection bias) | Low risk | Judgement Comment: Lipid parameters were measured in a remote laboratory. |
| Selective reporting (reporting bias) | Low risk | Judgement Comment: LDL‐cholesterol outcome was reported. |
| Other bias | Unclear risk | Judgement Comment: Source of funding was not reported. |
| Incomplete outcome data (attrition bias) Total cholesterol | Low risk | [(125 ‐ 120)]*100 = 4% participants were not included in the efficacy analysis. |
| Incomplete outcome data (attrition bias) LDL cholesterol) | Low risk | [(125 ‐ 120)]*100 = 4% participants were not included in the efficacy analysis. |
| Incomplete outcome data (attrition bias) HDL cholesterol | Low risk | [(125 ‐ 120)]*100 = 4% participants were not included in the efficacy analysis. |
| Incomplete outcome data (attrition bias) Triglycerides | High risk | [(125 ‐ 75)]*100 = 40% were not included in the efficacy analysis. |
| Blinding of outcome assessment (detection bias)WDAEs | High risk | No comparison possible |
| Selective reporting (reporting bias) for WDAEs | High risk | No WDAE outcome reported |
| Study characteristics | ||
| Methods | Study design: Historically controlled trial Study grouping: Method: Participants were not receiving any concomitant drug, therefore, no washout required; 3‐month before‐and‐after study | |
| Participants | Baseline Characteristics 2 mg
Included criteria: Patients with primary hypercholesterolaemia with a low‐density lipoprotein (LDL) cholesterol concentration > 160 mg/dL and a triglyceride concentration ≤ 400 mg/dL Excluded criteria: Patients who smoked or had diabetes, hypertension, vascular events, revascularisation procedures, coronary artery disease, or active liver disease, or took any concomitant drug Baseline Characteristics: NR | |
| Interventions | Intervention Characteristics 2 mg | |
| Outcomes | Total cholesterol
LDL cholesterol
HDL cholesterol
Triglycerides
| |
| Notes | ||
| Risk of bias | ||
| Bias | Authors' judgement | Support for judgement |
| Random sequence generation (selection bias) | High risk | Judgement Comment: Controlled before‐and‐after design |
| Allocation concealment (selection bias) | High risk | Judgement Comment: Controlled before‐and‐after design |
| Blinding of participants and personnel (performance bias) | Low risk | Judgement Comment: Lipid parameter measurements unlikely to be influenced by lack of blinding |
| Blinding of outcome assessment (detection bias) | Low risk | Judgement Comment: Lipid parameters were measured in a remote laboratory. |
| Selective reporting (reporting bias) | Low risk | Judgement Comment: LDL‐cholesterol outcome was reported. |
| Other bias | Unclear risk | Judgement Comment: Source of funding was not reported. |
| Incomplete outcome data (attrition bias) Total cholesterol | Low risk | All participants were included in the efficacy analysis. |
| Incomplete outcome data (attrition bias) LDL cholesterol) | Low risk | All participants were included in the efficacy analysis. |
| Incomplete outcome data (attrition bias) HDL cholesterol | Low risk | All participants were included in the efficacy analysis. |
| Incomplete outcome data (attrition bias) Triglycerides | Low risk | All participants were included in the efficacy analysis. |
| Blinding of outcome assessment (detection bias)WDAEs | High risk | No comparison possible |
| Selective reporting (reporting bias) for WDAEs | High risk | No WDAE outcome reported |
| Study characteristics | ||
| Methods | Study design: Historically controlled trial Study grouping: Method: No washout required because participants were not on lipid medications; 8‐week before‐and‐after study with evening dosing | |
| Participants | Baseline Characteristics 1 mg
Included criteria: patients older than 18 years of age with hypercholesterolaemia who had an indication for statin therapy according to the NCEP‐ATPIII guidelines (i.e. CHD or CHD risk equivalents and LDL‐C ≥ 100 mg/dL; ≥ 2 risk factors [10‐y risk 10‐20%] and LDL‐C ≥ 130 mg/dL; ≥ 2 risk factors [10‐y risk 10%] and LDL‐C ≥ 160 mg/dL; 0‐1 risk factor and LDL‐C ≥ 190 mg/dL) Excluded criteria: currently taking drugs known to affect lipid metabolism or interact with pitavastatin or atorvastatin (e.g. estrogen, corticosteroids, azole antifungals, fibrates, ticlopidine, thiazolidinedione, phenobarbital, and valproic acid), had previously been treated with statins, had active liver disease or elevated liver enzyme levels (AST or ALT > 3 times the upper limit of normal[ULN]), had CK levels more than 10 times the ULN, or had severe renal impairment (creatinine clearance 30 mL/min), pregnancy or lactation and triglyceride (TG) level > 400 mg/dL. Baseline Group Characteristics: Baseline characteristics were similar between treatment groups with the exception of mean AST. | |
| Interventions | Intervention Characteristics 1 mg | |
| Outcomes | Total cholesterol
LDL cholesterol
| |
| Notes | Stephen P on 01/02/2018 09:23 | |
| Risk of bias | ||
| Bias | Authors' judgement | Support for judgement |
| Random sequence generation (selection bias) | High risk | Judgement Comment: Controlled before‐and‐after design |
| Allocation concealment (selection bias) | High risk | Judgement Comment: Controlled before‐and‐after design |
| Blinding of participants and personnel (performance bias) | Low risk | Judgement Comment: Lipid parameter measurements unlikely to be influenced by lack of blinding |
| Blinding of outcome assessment (detection bias) | Low risk | Judgement Comment: Lipid parameters were measured in a remote laboratory. |
| Selective reporting (reporting bias) | Low risk | Judgement Comment: LDL‐cholesterol outcome was reported. |
| Other bias | Unclear risk | Judgement Comment: Source of funding was not reported. |
| Incomplete outcome data (attrition bias) Total cholesterol | Low risk | [(50 ‐ 48)/50]*100 = 4% missing data were replaced by series mean, see Table 3. |
| Incomplete outcome data (attrition bias) LDL cholesterol) | Low risk | [(50 ‐ 48)/50]*100 = 4% missing data were replaced by series mean, see Table 3. |
| Incomplete outcome data (attrition bias) HDL cholesterol | Low risk | [(50 ‐ 48)/50]*100 = 4% missing data were replaced by series mean, see Table 3. |
| Incomplete outcome data (attrition bias) Triglycerides | Low risk | [(50 ‐ 48)/50]*100 = 4% missing data were replaced by series mean, see Table 3. |
| Blinding of outcome assessment (detection bias)WDAEs | High risk | No comparison possible |
| Selective reporting (reporting bias) for WDAEs | High risk | No WDAE outcome reported |
| Study characteristics | ||
| Methods | Study design: Historically controlled trial Study grouping: Method: 4‐week washout period for participants who had been taking lipid‐lowering drugs before enrolment; 2 to 4‐week run‐in period for all participants; 8‐week before‐and‐after study | |
| Participants | Baseline Characteristics 2 mg
Included criteria: Eligible patients were men or postmenopausal women aged ≥ 20 years; had LDL‐C levels ≥ 140 mg/dL, HDL‐C levels 80 mg/dL, and TG levels 500 ≤ mg/dL; and had glucose intolerance. Glucose intolerance was defined as receipt of pharmacologic treatment for diabetes (excluding insulin therapy) or a glucose measurement in the past 3 months indicative of glucose intolerance (i.e. fasting blood glucose ≥ 110 mg/dL, 1‐hour blood glucose ≥ 180 mg/dL, or 2‐hour blood glucose ≥ 140 mg/dL after a 75‐g oral glucose challenge, or a casual blood glucose level ≥ 140 mg/dL). This definition was based on the criteria for borderline diabetes used in Japan and on World Health Organization criteria for impaired fasting glucose and impaired glucose tolerance. Excluded criteria: contraindications to statin use (i.e. hepatic impairment or biliary tract obstruction, cyclosporine use, and use of fibrates with an abnormal renal function test result); severe renal impairment or dysfunction (serum creatinine ≥ 2 mg/dL); secondary hyperlipidaemia associated with conditions such as hypothyroidism or Cushing’s syndrome; use of steroid hormones, including topical and nasal forms; severe hypertension; cerebrovascular disease in the past 3 months; myocardial infarction or coronary artery reconstruction in the past 3 months; heart failure (New York Heart Association class 3 or higher); history of allergy or serious adverse reactions to the study drugs; poorly controlled diabetes, based on the study physician’s judgement; and type 1 diabetes. Patients could also be excluded if their participation was considered inappropriate by the study physician Baseline Group Characteristics: There were no significant differences between the 2 groups in terms of any parameter | |
| Interventions | Intervention Characteristics 2 mg | |
| Outcomes | HDL cholesterol
| |
| Notes | ||
| Risk of bias | ||
| Bias | Authors' judgement | Support for judgement |
| Random sequence generation (selection bias) | High risk | Judgement Comment: Controlled before‐and‐after design |
| Allocation concealment (selection bias) | High risk | Judgement Comment: Controlled before‐and‐after design |
| Blinding of participants and personnel (performance bias) | Low risk | Judgement Comment: Lipid parameter measurements unlikely to be influenced by lack of blinding |
| Blinding of outcome assessment (detection bias) | Low risk | Judgement Comment: Lipid parameters were measured in a remote laboratory. |
| Selective reporting (reporting bias) | High risk | Judgement Comment: No 3‐12 week data for LDL cholesterol |
| Other bias | Low risk | Judgement Comment: Clinical research grant from the International University of Health and Welfare, Tochigi, Japan |
| Incomplete outcome data (attrition bias) Total cholesterol | High risk | No 3‐12 week data |
| Incomplete outcome data (attrition bias) LDL cholesterol) | High risk | No 3‐12 week data |
| Incomplete outcome data (attrition bias) HDL cholesterol | Low risk | All participants were included in the efficacy analysis at 8 weeks. |
| Incomplete outcome data (attrition bias) Triglycerides | High risk | No 3‐12 week data |
| Blinding of outcome assessment (detection bias)WDAEs | High risk | No comparison possible |
| Selective reporting (reporting bias) for WDAEs | High risk | No WDAE outcome reported |
| Study characteristics | ||
| Methods | Study design: Historically controlled trial Study grouping: Method: 4‐week dietary lead‐in period; 3‐month before‐and‐after study | |
| Participants | Baseline Characteristics 2 mg
Included criteria: men or women aged 30‐79 with type 2 diabetes with hypercholesterolaemia [total cholesterol ≥ 5.70 mmol/L (220 mg/dL)] and/or hypertriglyceridaemia [triglycerides 1.70–3.96 mmol/L (150–350 mg/dL)] Excluded criteria: a past history of hypersensitivity to statins; hepatic dysfunction [serum levels of aspartate aminotransferase (AST) or alanine aminotransferase (ALT) ≥ 100 IU], suspected disorder of hepatic metabolism or biliary obstruction (acute hepatitis, acute exacerbation of chronic hepatitis, liver cirrhosis, liver cancer and jaundice); renal dysfunction [serum creatinine ≥ 133 umol/L(1.5 mg/dL)], pregnant, possibly pregnant or breastfeeding women; patients with poorly controlled diabetes mellitus [HbA1c > 9.4% (National Glycohemoglobin Standardization Program), 79 mmol/L (International Federation of Clinical Chemistry and Laboratory Medicine)], recent history of cerebrovascular disease, coronary heart disease or congestive heart failure; familial hypercholesterolaemia; secondary hyperlipidaemia other than that associated with diabetes mellitus Baseline Group Characteristics: There were no differences in characteristics between two groups | |
| Interventions | Intervention Characteristics 2 mg | |
| Outcomes | Total cholesterol
LDL cholesterol
HDL cholesterol
Triglycerides
| |
| Notes | ||
| Risk of bias | ||
| Bias | Authors' judgement | Support for judgement |
| Random sequence generation (selection bias) | High risk | Judgement Comment: Controlled before‐and‐after design |
| Allocation concealment (selection bias) | High risk | Judgement Comment: Controlled before‐and‐after design |
| Blinding of participants and personnel (performance bias) | Low risk | Judgement Comment: Lipid parameter measurements unlikely to be influenced by lack of blinding |
| Blinding of outcome assessment (detection bias) | Low risk | Judgement Comment: Lipid parameters were measured in a remote laboratory. |
| Selective reporting (reporting bias) | Low risk | Judgement Comment: LDL‐cholesterol outcome was reported. |
| Other bias | Unclear risk | Judgement Comment: Source of funding was not reported. |
| Incomplete outcome data (attrition bias) Total cholesterol | Low risk | All participants were included in the efficacy analysis. |
| Incomplete outcome data (attrition bias) LDL cholesterol) | Low risk | All participants were included in the efficacy analysis. |
| Incomplete outcome data (attrition bias) HDL cholesterol | Low risk | All participants were included in the efficacy analysis. |
| Incomplete outcome data (attrition bias) Triglycerides | Low risk | All participants were included in the efficacy analysis. |
| Blinding of outcome assessment (detection bias)WDAEs | High risk | No comparison possible |
| Selective reporting (reporting bias) for WDAEs | High risk | No WDAE outcome reported |
| Study characteristics | ||
| Methods | Study design: Historically controlled trial Study grouping: Method: 4‐week run‐off period; 8‐week before‐and‐after study | |
| Participants | Baseline Characteristics 2 mg
Included criteria: 13 men and 20 women with type 2 diabetes mellitus whose serum cholesterol levels were more than 5.7 mmol/L (220 mg/dL) and changes in HbA1c levels were less than 10% in the previous two months Excluded criteria: The use of other drugs to treat hyperlipidaemia was not permitted during the study Baseline Group Characteristics: The study subjects consisted of 13 men and 20 women with type 2 diabetes mellitus whose serum cholesterol levels were more than 5.7 mmol/L ( = 220 mg/dL) and changes in HbA1c levels were less than 10% in the previous two months | |
| Interventions | Intervention Characteristics 2 mg | |
| Outcomes | Total cholesterol
LDL cholesterol
| |
| Notes | Stephen P on 17/02/2018 09:46 | |
| Risk of bias | ||
| Bias | Authors' judgement | Support for judgement |
| Random sequence generation (selection bias) | High risk | Judgement Comment: Controlled before‐and‐after design |
| Allocation concealment (selection bias) | High risk | Judgement Comment: Controlled before‐and‐after design |
| Blinding of participants and personnel (performance bias) | Low risk | Judgement Comment: Lipid parameter measurements unlikely to be influenced by lack of blinding |
| Blinding of outcome assessment (detection bias) | Low risk | Judgement Comment: Lipid parameters were measured in a remote laboratory. |
| Selective reporting (reporting bias) | Low risk | Judgement Comment: LDL‐cholesterol outcome was reported. |
| Other bias | Unclear risk | Judgement Comment: Kowa, Co. supported this study. This work was also supported by the Promotion of Fundamental Studies in Health Science in the Organization for Pharmaceutical Safety and Research (OPSR), Health Sciences Research Grants (Research on Human Genome and Gene Therapy) from the Ministry of Health and Welfare, and a Research Project Grant from the University of Tsukuba. H.S. is a recipient of Grant‐in‐Aid for Scientific Research from the Japan Society for the Promotion of Science. |
| Incomplete outcome data (attrition bias) Total cholesterol | Low risk | All participants were included in the efficacy analysis. |
| Incomplete outcome data (attrition bias) LDL cholesterol) | Low risk | All participants were included in the efficacy analysis. |
| Incomplete outcome data (attrition bias) HDL cholesterol | High risk | No data included in the efficacy analysis because the data differed by more than 10% between given and calculated values |
| Incomplete outcome data (attrition bias) Triglycerides | High risk | No data included in the efficacy analysis because the data differed by more than 10% between given and calculated values |
| Blinding of outcome assessment (detection bias)WDAEs | High risk | No comparison possible |
| Selective reporting (reporting bias) for WDAEs | High risk | No WDAE outcome reported |
| Study characteristics | ||
| Methods | Study design: Historically controlled trial Study grouping: Parallel group Method: 6 to 8‐week washout/dietary period; 12‐week before‐and‐after study | |
| Participants | Baseline Characteristics 1 mg
2 mg
2 mg then titrated to 4 mg at 4 weeks
Included criteria: Enroled patients were at least 65 years of age with a diagnosis of primary hypercholesterolaemia or combined (mixed) dyslipidaemia [plasma LDL‐C between 3.4 mmol/L (130 mg/dL) and 5.7 mmol/L (220 mg/dL) despite dietary therapy, and moderately elevated triglyceride levels ≤ 4.6 mmol/L (400 mg/dL)] at two consecutive assessments during a washout and dietary lead‐in period. Excluded criteria: Exclusion criteria included homozygous familial hypercholesterolaemia or condition(s) that could cause secondary dyslipidaemia; uncontrolled medical conditions, including diabetes mellitus (glycated haemoglobin > 8%), uncontrolled hypothyroidism, defined as concentrations of thyroid‐stimulating hormone above the upper limit of the reference range (ULRR); and poorly controlled or uncontrolled hypertension (systolic blood pressure > 160 mmHg and diastolic blood pressure > 90 mmHg) with or without antihypertensive therapy; gastrointestinal conditions that may have interfered with drug absorption; impaired liver or renal function; serum creatine kinase (CK) more than five times the ULRR; or significant CVD, such as MI, coronary or peripheral artery angioplasty, bypass graft surgery, or severe or unstable angina pectoris. Baseline Group Characteristics: Groups were well matched in terms of their demographic and other baseline characteristics. | |
| Interventions | Intervention Characteristics 1 mg 2 mg 2 mg then titrated to 4 mg at 4 weeks | |
| Outcomes | Total cholesterol
LDL cholesterol
HDL cholesterol
Triglycerides
| |
| Notes | ||
| Risk of bias | ||
| Bias | Authors' judgement | Support for judgement |
| Random sequence generation (selection bias) | High risk | Judgement Comment: Controlled before‐and‐after design |
| Allocation concealment (selection bias) | High risk | Judgement Comment: Controlled before‐and‐after design |
| Blinding of participants and personnel (performance bias) | Low risk | Judgement Comment: Lipid parameter measurements unlikely to be influenced by lack of blinding |
| Blinding of outcome assessment (detection bias) | Low risk | Judgement Comment: Lipid parameters were measured in a remote laboratory. |
| Selective reporting (reporting bias) | Low risk | Judgement Comment: LDL‐cholesterol outcome was reported. |
| Other bias | High risk | Judgement Comment: This study was supported by Kowa Research Europe. |
| Incomplete outcome data (attrition bias) Total cholesterol | Low risk | [(209 ‐ 207)/209]*100 = 1.0% participants were not included in the efficacy analysis for 1 mg/day dose; [(226 ‐ 224)/226]*100 = 0.9% participants were not included in the efficacy analysis for 2 mg/day dose. |
| Incomplete outcome data (attrition bias) LDL cholesterol) | Low risk | Pitavastatin 1 mg/day: 4 weeks [(209 ‐ 197)/209]*100 = 5.7%, 8 weeks [(209 ‐ 192)/209]*100 = 8.1%, 12 weeks [(209 ‐ 188)/209]*100 = 10.0% participants were not included in the efficacy analysis. Pitavastatin 2 mg/day: 4 weeks [(226 ‐ 217)/226]*100 = 4.0%, 8 weeks [(226 ‐ 214)/226]*100 = 5.3%, 12 weeks [(226 ‐ 208)/226]*100 = 8.0% participants were not included in the efficacy analysis. Pitavastatin 2 mg/day at 4 weeks then uptitrated to 4 mg/day from 8‐12 weeks: [(216 ‐ 203)/216]*100 = 6.0% participants were not included in the efficacy analysis. |
| Incomplete outcome data (attrition bias) HDL cholesterol | Low risk | [(209 ‐ 207)/209]*100 = 1.0% participants were not included in the efficacy analysis for 1 mg/day dose; [(226 ‐ 224)/226]*100 = 0.9% participants were not included in the efficacy analysis for 2 mg/day dose. |
| Incomplete outcome data (attrition bias) Triglycerides | Low risk | [(209 ‐ 207)/209]*100 = 1.0% participants were not included in the efficacy analysis for 1 mg/day dose; [(226 ‐ 224)/226]*100 = 0.9% participants were not included in the efficacy analysis for 2 mg/day dose. |
| Blinding of outcome assessment (detection bias)WDAEs | High risk | No comparison possible |
| Selective reporting (reporting bias) for WDAEs | High risk | No WDAE outcome reported |
| Study characteristics | ||
| Methods | Study design: Historically controlled trial Study grouping: Method: 4‐week washout period; 12‐week before‐and‐after study | |
| Participants | Baseline Characteristics 2 mg
Included criteria: Patients with high cholesterol having serum TC ≥ 220 mg/dL; fasting LDL‐C ≥ 140 mg/dL and serum TG ≤ 400 mg/dL Excluded criteria: Patients previously taking dextran sulfate sodium sulfur 18 (DS), patients who are contraindicated for statins or DS, patients who can not be discontinued from previous medication, patients with HbA1c > 8% or poor glycaemic control, patients with fasting serum TG ≥ 600 mg/dL, patients not suitable for the study according to the investigators. Baseline Group Characteristics: NR | |
| Interventions | Intervention Characteristics 2 mg | |
| Outcomes | Total cholesterol
LDL cholesterol
HDL cholesterol
Triglycerides
| |
| Notes | ||
| Risk of bias | ||
| Bias | Authors' judgement | Support for judgement |
| Random sequence generation (selection bias) | High risk | Judgement Comment: Controlled before‐and‐after design |
| Allocation concealment (selection bias) | High risk | Judgement Comment: Controlled before‐and‐after design |
| Blinding of participants and personnel (performance bias) | Low risk | Judgement Comment: Lipid parameter measurements unlikely to be influenced by lack of blinding |
| Blinding of outcome assessment (detection bias) | Low risk | Judgement Comment: Lipid parameters were measured in a remote laboratory. |
| Selective reporting (reporting bias) | Low risk | Judgement Comment: LDL‐cholesterol outcome was reported. |
| Other bias | Unclear risk | Judgement Comment: Source of funding was not reported. |
| Incomplete outcome data (attrition bias) Total cholesterol | High risk | [(26 ‐ 18)/26]*100 = 30.8% participants were not included in the efficacy analysis. |
| Incomplete outcome data (attrition bias) LDL cholesterol) | High risk | [(26 ‐ 11)/26]*100 = 57.7% participants were not included in the efficacy analysis. |
| Incomplete outcome data (attrition bias) HDL cholesterol | High risk | [(26 ‐ 13)/26]*100 = 50.0% participants were not included in the efficacy analysis. |
| Incomplete outcome data (attrition bias) Triglycerides | High risk | [(26 ‐ 18)/26]*100 = 30.8% participants were not included in the efficacy analysis. |
| Blinding of outcome assessment (detection bias)WDAEs | High risk | No comparison possible |
| Selective reporting (reporting bias) for WDAEs | High risk | No WDAE outcome reported |
| Study characteristics | ||
| Methods | Study design: Historically controlled trial Study grouping: Method: No participant received lipid medications, therefore no washout required; 12‐week before‐and‐after study | |
| Participants | Baseline Characteristics 2 mg
Included criteria: participants with hypercholesterolaemia and women over 20 years old who had not been receiving statins beforehand Excluded criteria: not reported Baseline Group Characteristics: NR | |
| Interventions | Intervention Characteristics 2 mg | |
| Outcomes | LDL cholesterol
HDL cholesterol
Triglycerides
| |
| Notes | ||
| Risk of bias | ||
| Bias | Authors' judgement | Support for judgement |
| Random sequence generation (selection bias) | High risk | Judgement Comment: Controlled before‐and‐after design |
| Allocation concealment (selection bias) | High risk | Judgement Comment: Controlled before‐and‐after design |
| Blinding of participants and personnel (performance bias) | Low risk | Judgement Comment: Lipid parameter measurements unlikely to be influenced by lack of blinding |
| Blinding of outcome assessment (detection bias) | Low risk | Judgement Comment: Lipid parameters were measured in a remote laboratory. |
| Selective reporting (reporting bias) | Low risk | Judgement Comment: LDL‐cholesterol outcome was reported. |
| Other bias | Unclear risk | Judgement Comment: Source of funding was not reported. |
| Incomplete outcome data (attrition bias) Total cholesterol | Low risk | All participants were included in the efficacy analysis. |
| Incomplete outcome data (attrition bias) LDL cholesterol) | Low risk | All participants were included in the efficacy analysis. |
| Incomplete outcome data (attrition bias) HDL cholesterol | Low risk | All participants were included in the efficacy analysis. |
| Incomplete outcome data (attrition bias) Triglycerides | Low risk | All participants were included in the efficacy analysis. |
| Blinding of outcome assessment (detection bias)WDAEs | High risk | No comparison possible |
| Selective reporting (reporting bias) for WDAEs | High risk | No WDAE outcome reported |
| Study characteristics | ||
| Methods | Study design: Historically controlled trial Study grouping: Method: 4 to 6‐week washout period; 8‐week before‐and‐after study with evening dosing; HDL cholesterol data weres not included in the efficacy analysis because the calculated percentage change versus given percentage change was greater than 10%. | |
| Participants | Baseline Characteristics Pitavastatin 2 mg/day
Included criteria: Serum total cholesterol value of 220 mg/dL (5.69 mmol/L) or more. Ages: 20‐75 years old. Excluded criteria: Patients with poor control of diabetes and patients with severe hypertension, patients with severe hepatopathy, renal impairment, myocardial infarction and cerebrovascular disorder attack (within 3 months after the attack) and patients with heart failure, women who are breastfeeding, pregnant women or women who desire pregnancy, patients with a history of drug hypersensitivity or a history of serious side effects, other patients who were judged inappropriate as subjects of this trial by the investigators, no consent of trial participation Baseline Group Characteristics: NR | |
| Interventions | Intervention Characteristics Pitavastatin 2 mg/day
| |
| Outcomes | Total cholesterol
LDL cholesterol
Triglycerides
| |
| Notes | ||
| Risk of bias | ||
| Bias | Authors' judgement | Support for judgement |
| Random sequence generation (selection bias) | High risk | Judgement Comment: Controlled before‐and‐after design |
| Allocation concealment (selection bias) | High risk | Judgement Comment: Controlled before‐and‐after design |
| Blinding of participants and personnel (performance bias) | Low risk | Judgement Comment: Lipid parameter measurements unlikely to be influenced by lack of blinding |
| Blinding of outcome assessment (detection bias) | Low risk | Judgement Comment: Lipid parameters were measured in a remote laboratory. |
| Selective reporting (reporting bias) | Low risk | Judgement Comment: LDL‐cholesterol outcome was reported. |
| Other bias | Unclear risk | Judgement Comment: Source of funding was not reported. |
| Incomplete outcome data (attrition bias) Total cholesterol | Low risk | [(313 ‐ 295)/313]*100 = 5.8% were not included in the efficacy analysis for total cholesterol at 4 weeks; [(313 ‐ 277)/313]*100 = 11.5% were not included in the efficacy analysis for total cholesterol at 8 weeks. |
| Incomplete outcome data (attrition bias) LDL cholesterol) | Unclear risk | [(313 ‐ 289)/313]*100 = 7.7% were not included in the efficacy analysis for LDL cholesterol at 4 weeks; [(313 ‐ 268)/313]*100 = 14.4% were not included in the efficacy analysis for LDL cholesterol at 8 weeks. |
| Incomplete outcome data (attrition bias) HDL cholesterol | High risk | No data included in the efficacy analysis because the data differed by more than 10% between given and calculated values |
| Incomplete outcome data (attrition bias) Triglycerides | High risk | [(313 ‐ 138)/313]*100 = 55.9% were not included in the efficacy analysis for triglycerides at 4 weeks; [(313 ‐ 133)/313]*100 = 57.5% were not included in the efficacy analysis for triglycerides at 8 weeks. |
| Blinding of outcome assessment (detection bias)WDAEs | High risk | No comparison possible |
| Selective reporting (reporting bias) for WDAEs | High risk | No WDAE outcome reported |
| Study characteristics | ||
| Methods | Study design: Historically controlled trial Study grouping: Method: No washout required because participants were not receiving anti‐dyslipidaemic agents; 2‐month before‐and‐after study | |
| Participants | Baseline Characteristics 2 mg
Included criteria: patients who had not received anti‐dyslipidaemic agents and had LDL‐C levels greater than 140 mg/dL Excluded criteria: not reported Baseline Group Characteristics: There were no differences in the baseline characteristics of the patients in each group. | |
| Interventions | Intervention Characteristics 2 mg | |
| Outcomes | Total cholesterol
LDL cholesterol
HDL cholesterol
Triglycerides
| |
| Notes | ||
| Risk of bias | ||
| Bias | Authors' judgement | Support for judgement |
| Random sequence generation (selection bias) | High risk | Judgement Comment: Controlled before‐and‐after design |
| Allocation concealment (selection bias) | High risk | Judgement Comment: Controlled before‐and‐after design |
| Blinding of participants and personnel (performance bias) | Low risk | Judgement Comment: Lipid parameter measurements unlikely to be influenced by lack of blinding |
| Blinding of outcome assessment (detection bias) | Low risk | Judgement Comment: Lipid parameters were measured in a remote laboratory. |
| Selective reporting (reporting bias) | Low risk | Judgement Comment: LDL‐cholesterol outcome was reported. |
| Other bias | Unclear risk | Judgement Comment: This work was partially supported by a Research Grant from the University of Fukui. |
| Incomplete outcome data (attrition bias) Total cholesterol | Low risk | All participants were included in the efficacy analysis. |
| Incomplete outcome data (attrition bias) LDL cholesterol) | Low risk | All participants were included in the efficacy analysis. |
| Incomplete outcome data (attrition bias) HDL cholesterol | Low risk | All participants were included in the efficacy analysis. |
| Incomplete outcome data (attrition bias) Triglycerides | Low risk | All participants were included in the efficacy analysis. |
| Blinding of outcome assessment (detection bias)WDAEs | High risk | No comparison possible |
| Selective reporting (reporting bias) for WDAEs | High risk | No WDAE outcome reported |
| Study characteristics | ||
| Methods | Study design: Historically controlled trial Study grouping: Parallel group Method: Participants were not receiving lipid medication for at least 3 months; 3‐month before‐and‐after study | |
| Participants | Baseline Characteristics 1 mg
4 mg
Included criteria: 63 essential hypertensive patients with dyslipidaemia with LDL‐cholesterol level higher than the National Cholesterol Education Program Adult Treatment Panel III recommendations (100 mg/dL for moderately high/high‐risk subjects without atherosclerotic vascular disease, 70 mg/dL for high‐risk subjects with atherosclerotic vascular disease) Excluded criteria: Aged 20 years, treatment for dyslipidaemia within the preceding 3 months, current treatment with progesterone or other hormone therapy within the previous 3 months, familial hypercholesterolaemia, acute coronary syndrome, congestive heart failure (New York Heart Association class II or greater), liver dysfunction, chronic kidney disease requiring regular haemodialysis, endocrine disease, secondary hypertension, and administration of agents affecting lipid metabolism Baseline Group Characteristics: Baseline total cholesterol, LDL‐cholesterol and apolipoprotein B were significantly higher in the pitavastatin 4 mg/day group than in the pitavastatin 1 mg/day group. | |
| Interventions | Intervention Characteristics 1 mg 4 mg | |
| Outcomes | Total cholesterol
LDL cholesterol
HDL cholesterol
Triglycerides
| |
| Notes | Stephen P on 21/02/2018 09:30 | |
| Risk of bias | ||
| Bias | Authors' judgement | Support for judgement |
| Random sequence generation (selection bias) | High risk | Judgement Comment: Controlled before‐and‐after design |
| Allocation concealment (selection bias) | High risk | Judgement Comment: Controlled before‐and‐after design |
| Blinding of participants and personnel (performance bias) | Low risk | Judgement Comment: Lipid parameter measurements unlikely to be influenced by lack of blinding |
| Blinding of outcome assessment (detection bias) | Low risk | Judgement Comment: Lipid parameters were measured in a remote laboratory. |
| Selective reporting (reporting bias) | Low risk | Judgement Comment: LDL‐cholesterol outcome was reported. |
| Other bias | Low risk | Judgement Comment: Authors had no support or funding to report. |
| Incomplete outcome data (attrition bias) Total cholesterol | Low risk | All participants were included in the efficacy analysis. |
| Incomplete outcome data (attrition bias) LDL cholesterol) | Low risk | All participants were included in the efficacy analysis. |
| Incomplete outcome data (attrition bias) HDL cholesterol | Low risk | All participants were included in the efficacy analysis. |
| Incomplete outcome data (attrition bias) Triglycerides | Low risk | All participants were included in the efficacy analysis. |
| Blinding of outcome assessment (detection bias)WDAEs | High risk | No comparison possible |
| Selective reporting (reporting bias) for WDAEs | High risk | No WDAE outcome reported |
| Study characteristics | ||
| Methods | Study design: Historically controlled trial Study grouping: Parallel group Method: No lipid‐lowering medication had been administered, therefore no washout period required; 12‐week before‐and‐after study | |
| Participants | Baseline Characteristics 2 mg PIT‐ROS
2 mg PIT‐PIT
2 mg PIT‐ROS and PIT‐PIT
Included criteria: outpatients with type 2 diabetes with fasting serum LDL‐C ≥ 140 mg/dL and triglyceride 300 mg/dL; no lipid‐lowering medication had been administered; glycated haemoglobin A1c (HbA1c) 8.5%; serum creatinine 2.0 mg/dL; urinary albumin excretion 300 mg/Cr; no concomitant use of insulin, fibrates, thyroid hormone, or corticosteroid hormone; and no changes in medications during the previous 3 months Excluded criteria: history of stroke or other cardiovascular events Baseline Group Characteristics: No significant differences in any parameters at baseline were seen among the four groups. | |
| Interventions | Intervention Characteristics 2 mg PIT‐ROS 2 mg PIT‐PIT 2 mg PIT‐ROS and PIT‐PIT | |
| Outcomes | LDL cholesterol
HDL cholesterol
Triglycerides
| |
| Notes | ||
| Risk of bias | ||
| Bias | Authors' judgement | Support for judgement |
| Random sequence generation (selection bias) | High risk | Judgement Comment: Controlled before‐and‐after design |
| Allocation concealment (selection bias) | High risk | Judgement Comment: Controlled before‐and‐after design |
| Blinding of participants and personnel (performance bias) | Low risk | Judgement Comment: Lipid parameter measurements unlikely to be influenced by lack of blinding |
| Blinding of outcome assessment (detection bias) | Low risk | Judgement Comment: Lipid parameters were measured in a remote laboratory. |
| Selective reporting (reporting bias) | Low risk | Judgement Comment: LDL‐cholesterol outcome was reported. |
| Other bias | Unclear risk | Judgement Comment: Source of funding was not reported. |
| Incomplete outcome data (attrition bias) Total cholesterol | High risk | Total cholesterol data were not reported. |
| Incomplete outcome data (attrition bias) LDL cholesterol) | Low risk | [(45 ‐ 43)/45]*100 = 4.4% were not included in the efficacy analysis. |
| Incomplete outcome data (attrition bias) HDL cholesterol | Low risk | [(45 ‐ 43)/45]*100 = 4.4% were not included in the efficacy analysis. |
| Incomplete outcome data (attrition bias) Triglycerides | Low risk | [(45 ‐ 43)/45]*100 = 4.4% were not included in the efficacy analysis. |
| Blinding of outcome assessment (detection bias)WDAEs | High risk | No comparison possible |
| Selective reporting (reporting bias) for WDAEs | High risk | No WDAE outcome reported |
| Study characteristics | ||
| Methods | Study design: Historically controlled trial Study grouping: Method: 4‐week washout period; 12‐week before‐and‐after study | |
| Participants | Baseline Characteristics 2 mg
Included criteria: Men and women aged 20 or older with hypercholesterolaemia (TC ≥ 220 mg/dL) and TG ≤ 400 mg/dL, including familial hypercholesterolaemia Excluded criteria: During the study period, administration of fibrates, other statins, probucol and cyclosporine (because of drug–drug interaction) was prohibited. Patients with a past history of hypersensitivity to statins; patients with hepatic dysfunction [aspartate aminotransferase (AST) or alanine aminotransferase (ALT) ≥ 100 IU/L], suspected hepatic metabolism disorders or biliary obstruction (acute hepatitis, acute exacerbation of chronic hepatitis, liver cirrhosis, liver cancer and jaundice), or renal dysfunction (serum creatinine ≥ 1.5 mg/dL); pregnant women, women who may be pregnant, and breastfeeding women; patients with poorly controlled diabetes (HbA1c > 8.0%) Baseline Group Characteristics: Baseline incidence of hypertension was significantly higher in the pitavastatin group, but no significant differences were observed in the other parameters. | |
| Interventions | Intervention Characteristics 2 mg | |
| Outcomes | Total cholesterol
LDL cholesterol
| |
| Notes | Stephen P on 02/02/2018 10:36 | |
| Risk of bias | ||
| Bias | Authors' judgement | Support for judgement |
| Random sequence generation (selection bias) | High risk | Judgement Comment: Controlled before‐and‐after design |
| Allocation concealment (selection bias) | High risk | Judgement Comment: Controlled before‐and‐after design |
| Blinding of participants and personnel (performance bias) | Low risk | Judgement Comment: Lipid parameter measurements unlikely to be influenced by lack of blinding |
| Blinding of outcome assessment (detection bias) | Low risk | Judgement Comment: Lipid parameters were measured in a remote laboratory. |
| Selective reporting (reporting bias) | Low risk | Judgement Comment: LDL‐cholesterol outcome was reported. |
| Other bias | Low risk | Quote: "This study was supported by the grant from Non‐Profit Organization for Medical Frontier, Chiba, Japan. It was also supported in part by a Grant‐in‐Aids for Scientific Research from the Ministry of Health, Labour and Welfare to K.Y." Judgement Comment: government grants |
| Incomplete outcome data (attrition bias) Total cholesterol | Low risk | [(101 ‐ 93)/101]*100 = 7.9% participants were not included in the efficacy analysis. |
| Incomplete outcome data (attrition bias) LDL cholesterol) | Low risk | [(101 ‐ 93)/101]*100 = 7.9% participants were not included in the efficacy analysis. |
| Incomplete outcome data (attrition bias) HDL cholesterol | High risk | No data included in the efficacy analysis because the data differed by more than 10% between given and calculated values |
| Incomplete outcome data (attrition bias) Triglycerides | High risk | No data included in the efficacy analysis because the data differed by more than 10% between given and calculated values |
| Blinding of outcome assessment (detection bias)WDAEs | High risk | No comparison possible |
| Selective reporting (reporting bias) for WDAEs | High risk | No WDAE outcome reported |
| Study characteristics | ||
| Methods | Study design: Historically controlled trial Study grouping: Method: Participants were not receiving any medications, therefore washout not required; 4‐week before‐and‐after study | |
| Participants | Baseline Characteristics 2 mg
Included criteria: male chronic smokers, who were newly diagnosed with mild hypercholesterolaemia Excluded criteria: history of malignancy, cardiovascular events or active inflammatory diseases, other cardiovascular risk factors or taking other medications Baseline Characteristics: There were no significant differences between the 2 groups in any clinical parameters. | |
| Interventions | Intervention Characteristics 2 mg | |
| Outcomes | Total cholesterol
LDL cholesterol
HDL cholesterol
Triglycerides
| |
| Notes | ||
| Risk of bias | ||
| Bias | Authors' judgement | Support for judgement |
| Random sequence generation (selection bias) | High risk | Judgement Comment: Controlled before‐and‐after design |
| Allocation concealment (selection bias) | High risk | Judgement Comment: Controlled before‐and‐after design |
| Blinding of participants and personnel (performance bias) | Low risk | Judgement Comment: Lipid parameter measurements unlikely to be influenced by lack of blinding |
| Blinding of outcome assessment (detection bias) | Low risk | Judgement Comment: Lipid parameters were measured in a remote laboratory. |
| Selective reporting (reporting bias) | Low risk | Judgement Comment: LDL‐cholesterol outcome was reported. |
| Other bias | Low risk | Judgement Comment: Sources of Funding: A grant from the Smoking Research Foundation to T.M |
| Incomplete outcome data (attrition bias) Total cholesterol | Low risk | All participants were included in the efficacy analysis. |
| Incomplete outcome data (attrition bias) LDL cholesterol) | Low risk | All participants were included in the efficacy analysis. |
| Incomplete outcome data (attrition bias) HDL cholesterol | Low risk | All participants were included in the efficacy analysis. |
| Incomplete outcome data (attrition bias) Triglycerides | Low risk | All participants were included in the efficacy analysis. |
| Blinding of outcome assessment (detection bias)WDAEs | High risk | No comparison possible |
| Selective reporting (reporting bias) for WDAEs | High risk | No WDAE outcome reported |
| Study characteristics | ||
| Methods | Study design: Historically controlled trial Study grouping: Method: No participant was on lipid medications, therefore no washout required; 12‐week before‐and‐after study | |
| Participants | Baseline Characteristics 2 mg
Included criteria: Participants with hyperlipidaemia, aged 45 to 75 years Excluded criteria: Participants aged 20 years, premenopausal females, diabetes, CVD, liver dysfunction, renal dysfunction, endocrine disease, or administration of agents affecting lipid metabolism and lipid oxidation Baseline Group Characteristics: There were no significant baseline characteristic differences between groups | |
| Interventions | Intervention Characteristics 2 mg | |
| Outcomes | Total cholesterol
LDL cholesterol
HDL cholesterol
| |
| Notes | Stephen P on 31/01/2018 05:52 | |
| Risk of bias | ||
| Bias | Authors' judgement | Support for judgement |
| Random sequence generation (selection bias) | High risk | Judgement Comment: Controlled before‐and‐after design |
| Allocation concealment (selection bias) | High risk | Judgement Comment: Controlled before‐and‐after design |
| Blinding of participants and personnel (performance bias) | Low risk | Judgement Comment: Lipid parameter measurements unlikely to be influenced by lack of blinding |
| Blinding of outcome assessment (detection bias) | Low risk | Judgement Comment: Lipid parameters were measured in a remote laboratory. |
| Selective reporting (reporting bias) | Low risk | Judgement Comment: LDL‐cholesterol outcome was reported. |
| Other bias | Low risk | Judgement Comment: government grant |
| Incomplete outcome data (attrition bias) Total cholesterol | Low risk | All participants were included in the efficacy analysis. |
| Incomplete outcome data (attrition bias) LDL cholesterol) | Low risk | All participants were included in the efficacy analysis. |
| Incomplete outcome data (attrition bias) HDL cholesterol | Low risk | All participants were included in the efficacy analysis. |
| Incomplete outcome data (attrition bias) Triglycerides | High risk | No data included in the efficacy analysis because the data differed by more than 10% between given and calculated values |
| Blinding of outcome assessment (detection bias)WDAEs | High risk | No comparison possible |
| Selective reporting (reporting bias) for WDAEs | High risk | No WDAE outcome reported |
| Study characteristics | ||
| Methods | Study design: Historically controlled trial Study grouping: Method: Participants were not on any drug therapy for at least 6 months, therefore no washout required; 3‐month before‐and‐after study | |
| Participants | Baseline Characteristics 2 mg
Included criteria: participants had hypercholesterolaemia (LDL‐C > 140 mg/dL). Excluded criteria: diabetes and renal dysfunction and CRP levels > 5.0 mg/L Baseline Group Characteristics: There were no significant differences in age, body mass index (BMI), systolic blood pressure (SBP), and diastolic blood pressure (DBP) | |
| Interventions | Intervention Characteristics 2 mg | |
| Outcomes | LDL cholesterol
HDL cholesterol
Triglycerides
| |
| Notes | ||
| Risk of bias | ||
| Bias | Authors' judgement | Support for judgement |
| Random sequence generation (selection bias) | High risk | Judgement Comment: Controlled before‐and‐after design |
| Allocation concealment (selection bias) | High risk | Judgement Comment: Controlled before‐and‐after design |
| Blinding of participants and personnel (performance bias) | Low risk | Judgement Comment: Lipid parameter measurements unlikely to be influenced by lack of blinding |
| Blinding of outcome assessment (detection bias) | Low risk | Judgement Comment: Lipid parameters were measured in a remote laboratory. |
| Selective reporting (reporting bias) | Low risk | Judgement Comment: LDL‐cholesterol outcome was reported. |
| Other bias | Unclear risk | Judgement Comment: Source of funding was not reported. |
| Incomplete outcome data (attrition bias) Total cholesterol | Low risk | All participants were included in the efficacy analysis. |
| Incomplete outcome data (attrition bias) LDL cholesterol) | Low risk | All participants were included in the efficacy analysis. |
| Incomplete outcome data (attrition bias) HDL cholesterol | Low risk | All participants were included in the efficacy analysis. |
| Incomplete outcome data (attrition bias) Triglycerides | Low risk | All participants were included in the efficacy analysis. |
| Blinding of outcome assessment (detection bias)WDAEs | High risk | No comparison possible |
| Selective reporting (reporting bias) for WDAEs | High risk | No WDAE outcome reported |
| Study characteristics | ||
| Methods | Study design: Historically controlled trial Study grouping: Method: 4‐week washout period; 12‐week before‐and‐after study | |
| Participants | Baseline Characteristics 1 mg
Included criteria: men and women who were at least 18 years old treated with or without lipid‐lowering agents, plasma LDL cholesterol level above 140 mg/dL and a plasma TG level below 400 mg/dL Excluded criteria: pregnant or had familial hyperlipoproteinaemia, acute phase coronary artery disease, active liver disease, hepatic or renal dysfunction, or uncontrolled hypertension, concurrently taking drugs known to affect lipid levels or known to interact with the study medication Baseline Group Characteristics: There were no significant differences in age, sex, and body mass index between groups. Risk factors and complications did not differ between the two groups. | |
| Interventions | Intervention Characteristics 1 mg | |
| Outcomes | Total cholesterol
LDL cholesterol
Triglycerides
| |
| Notes | Stephen P on 31/01/2018 08:13 | |
| Risk of bias | ||
| Bias | Authors' judgement | Support for judgement |
| Random sequence generation (selection bias) | High risk | Judgement Comment: Controlled before‐and‐after design |
| Allocation concealment (selection bias) | High risk | Judgement Comment: Controlled before‐and‐after design |
| Blinding of participants and personnel (performance bias) | Low risk | Judgement Comment: Lipid parameter measurements unlikely to be influenced by lack of blinding |
| Blinding of outcome assessment (detection bias) | Low risk | Judgement Comment: Lipid parameters were measured in a remote laboratory. |
| Selective reporting (reporting bias) | Low risk | Judgement Comment: LDL‐cholesterol outcome was reported. |
| Other bias | Unclear risk | Judgement Comment: Source of funding was not reported. |
| Incomplete outcome data (attrition bias) Total cholesterol | Low risk | All participants were included in the efficacy analysis. |
| Incomplete outcome data (attrition bias) LDL cholesterol) | Low risk | All participants were included in the efficacy analysis. |
| Incomplete outcome data (attrition bias) HDL cholesterol | Low risk | All participants were included in the efficacy analysis. |
| Incomplete outcome data (attrition bias) Triglycerides | Low risk | All participants were included in the efficacy analysis. |
| Blinding of outcome assessment (detection bias)WDAEs | High risk | No comparison possible |
| Selective reporting (reporting bias) for WDAEs | High risk | No WDAE outcome reported |
ACS: Acute coronary syndromes
ADRs: Adverse drug reactions
ALT: Alanine aminotransferase
AMI: Acute myocardial infarction
AST: Aspartate aminotransferase
ATP: Adult treatment panel
BMI: Body mass index
BP: Blood pressure
BUN: Blood urea nitrogen
CABG: Coronary artery bypass grafting
CHD: Coronary heart disease
CK: Creatine kinase
Cr: Creatinine
DBP: Diastolic blood pressure
DM: Diabetes mellitus
DS: Dextran sulfate
ECG: Electrocardiogram
FBS: Fetal bovine serum
FH: Familial hypercholesterolaemia
HbA1C: Hemoglobin A1c
HDL‐C: High density lipoprotein cholesterol
HIV: Human immunodeficiency virus
HMG‐CoA: 3‐hydroxy‐3‐methylglutaryl coenzyme A
IMT: Intima media thickness
KPa: Kilo Pascals
LDL‐C: Low density lipoprotein cholesterol
MB: Myocardial band
NCEP: National Cholesterol Education Program
NYHA: New York Heart Association
PBC: Primary biliary cholangitis
PIT: Pitavastatin
PPAR: Peroxisome proliferator‐activated receptor
PTCA: Percutaneous transluminal coronary angioplasty
RLP‐C: Reminant‐like particle cholesterol
ROS: Rosuvastatin
SBP: Systolic blood pressure
sd: small dense
SD: Standard deviation
TC: Total cholesterol
TG: Triglyceride
TIA: Transient ischaemic attack
TSH: Thyroid stimulating hormone
u‐AP: Unstable angina pectoris
ULN: Upper limit of normal
ULRR: Upper limit of the reference range
WDAE: Withdrawal due to adverse effects
WHO: World health organisation
Characteristics of excluded studies [ordered by study ID]
| Study | Reason for exclusion |
| Confounding factor: protease inhibitors of treating HIV | |
| Dose is 2‐4 mg/day pitavastatin one/two Pitavastatin 2 mg tablets per day | |
| Washout period unclear | |
| Washout period unclear | |
| Combined different statins | |
| Trial excluded because dose was 1‐2 mg/day and lipids had median percentage change from baseline | |
| Run‐in washout period not reported | |
| Some participants may have had at least 3‐week washout period but others only 2 weeks. | |
| Dose unclear | |
| Confounding factor: protease inhibitors of treating HIV | |
| Dose is 1‐4 mg/day dose range | |
| Participants may be receiving lipid altering agents at baseline no washout period reported | |
| Dose is 1 or 2 mg/day dose not specific | |
| Participants were receiving lipid altering agents at baseline | |
| Patients received cholesterol lowering drugs at baseline | |
| no 3‐12 week lipid data 12‐16 weeks | |
| Dose is 1‐4 mg/day dose range | |
| Participants may be receiving lipid altering agents at baseline no washout period reported | |
| Participants may be receiving lipid altering agents at baseline no washout period reported | |
| Participants may be receiving non statin lipid altering agents at baseline no washout period reported | |
| Participants may be receiving non statin lipid altering agents at baseline no washout period reported | |
| Participants may be receiving lipid altering agents at baseline no washout period reported | |
| Participants are receiving a statin excluding pitavastatin at baseline | |
| Participants may be receiving lipid altering agents at baseline no washout period reported | |
| Confounding factor in 5 of the 19 subjects | |
| Confounding factor | |
| Trial period reported as 8 weeks or more | |
| Some participants received lipid‐lowering agents at baseline | |
| Subjects may be receiving lipid altering agents at baseline | |
| Baseline washout period too short | |
| Terminated The study was aborted and the investigators provided no data | |
| Terminated The study was aborted and the investigators provided no data | |
| Median percent change from baseline | |
| Some participants may have had at least a 3‐week washout period but others only 2 weeks. | |
| Median percent change from baseline | |
| Article not available from any library | |
| Dose unclear | |
| Confounding factor | |
| Some participants were treated for 12 weeks while some were treated for more than 12 weeks. | |
| Article retracted | |
| Washout period of all previous lipid‐lowering drugs not clear |
HIV: Human Immunodeficiency Virus
Characteristics of studies awaiting classification [ordered by study ID]
| Methods | Historically controlled trial Participants were not receiving lipid altering medications within 4 weeks of the study no washout required |
| Participants | Male and Female 20‐80 years old with NASH/NAFLD Included criteria: 1)The patients with fatty liver 2)The patients with the level of ALT (42‐120IU/L) 3)The patients with high cholesterol levels Exclusion criteria: 1)The patients with the use of drugs for dyslipidaemia within 4 weeks 2)The patients with chronic kidney disease (serum Cre>2.0) or severe liver dysfunction 3)The patients who are pregnant or giving the breast to a baby or want to be pregnant within the period of trial 4)The patients with cyclosporin 5)The patients with liver dysfunction by drug, alcohol, virus, or autoimmune factors |
| Interventions | pitavastatin calcium |
| Outcomes | The level of alanine aminotransferase |
| Notes | treatment period not reported |
ALT: Alanine aminotransferase
CK: Creatine kinase
Cre: Creatinine
ECG: electrocardiogram
GPT: Glutamic‐pyruvic transaminase
HDL‐C: High density lipoprotein cholesterol
HMG‐CoA: 3‐hydroxy‐3‐methylglutaryl coenzyme A
IU: International unit
LDL‐C: Low density lipoprotein cholesterol
MB: Myocardial band
NAFLD: Nonalcohol fatty liver disease
NASH: Nonalcohol steatohepatitis
NYHA: New York Heart Association
PCI: Percutaneous coronary intervention
ST: End of S and start of T wave between ventricular depolarisation and repolarization electrocardiogram
TC: Total cholesterol
TG: Triglycerides
Characteristics of ongoing studies [ordered by study ID]
| Study name | STA study |
| Methods | Historically controlled trial Parallel Participants were not receiving lipid altering medications no washout required 8 week trial |
| Participants | Male and Female 18 years or greater Included criteria: 1) Unstable angina, non‐ST‐segment elevation acute coronary syndrome receiving optimal reperfusion therapy 2) Evidence of coronary artery disease 3) low density lipoprotein cholesterol >70mg/dl, triglyceride <500mg/dl 4) agree to informed consent Exclusion criteria: 1) contraindication to statin therapy 2) pregnant women 3) life expectancy less than 2 years 4) abnormal renal, liver function 5) prescribed other lipid lowering medication (fibrate, omega 3, niacin) |
| Interventions | pitavastatin 2 mg/day pitavastatin 4 mg/day |
| Outcomes | Lipid profile (total cholesterol, triglyceride, LDL‐C, HDL‐C) in each group |
| Starting date | 2015‐06‐23 |
| Contact information | Kyeong Ho Yun MD Wonkwang University Hospital 895 Muwang‐ro, Iksan, Korea, 54538 |
| Notes |
| Study name | COCTAIL |
| Methods | Study design: Randomised controlled trial Study grouping: Parallel group Methods: 8 week randomised, double‐blind, placebo‐controlled trial |
| Participants | Males and females aged 20 years or older Included criteria:
Exclusion criteria:
|
| Interventions | Placebo Pitavastatin 4 mg/day |
| Outcomes | Total cholesterol, LDL cholesterol, HDL cholesterol, Triglycerides |
| Starting date | June 2011 |
| Contact information | Gyu Rok Han, MD Dept. of Cardiology, Hallym University Medical Center |
| Notes |
| Study name | Efficacy and Safety Study of Pitavastatin for Hypercholesterolemia |
| Methods | Historically controlled trial 4 week washout period of all previous lipid lowering drugs 12 week study |
| Participants | Females or males aged between 20 and 80 years Included criteria:
Exclusion criteria:
|
| Interventions | 1PC002 (Pitavastatin) 2 mg/day |
| Outcomes | Total cholesterol, LDL cholesterol, HDL cholesterol, Triglycerides |
| Starting date | October 18, 2012 |
| Contact information | Orient Pharma Co., Ltd. |
| Notes |
ALT: Alanine aminotransferase
AST: Aspartate aminotransferase
CK: Creatine kinase
CVD: Cardiovascular disease
HbA1c: Haemoglobin A1c
HDL‐C: High density lipoprotein cholesterol
HIV: Human immunodeficiency virus
ICF: Informed consent form
LDL‐C: Low density lipoprotein cholesterol
PCI: Percutaneous coronary intervention
ST: End of S and start of T wave between ventricular depolarisation and repolarization electrocardiogram
TC: Total cholesterol
TG: Triglycerides
ULN: Upper limit of normal
Data and analyses
| Outcome or subgroup title | No. of studies | No. of participants | Statistical method | Effect size |
| 1.1 LDL cholesterol RCTs Show forest plot | 3 | 255 | Mean Difference (IV, Fixed, 95% CI) | ‐26.85 [‐29.89, ‐23.81] |
| Analysis 1.1  Comparison 1: 1 mg vs control, Outcome 1: LDL cholesterol RCTs | ||||
| 1.2 Total cholesterol RCTs Show forest plot | 3 | 255 | Mean Difference (IV, Fixed, 95% CI) | ‐19.43 [‐21.90, ‐16.97] |
| Analysis 1.2  Comparison 1: 1 mg vs control, Outcome 2: Total cholesterol RCTs | ||||
| 1.3 HDL cholesterol RCTs Show forest plot | 2 | 202 | Mean Difference (IV, Fixed, 95% CI) | 6.28 [3.36, 9.20] |
| Analysis 1.3  Comparison 1: 1 mg vs control, Outcome 3: HDL cholesterol RCTs | ||||
| 1.4 Triglycerides RCTs Show forest plot | 2 | 202 | Mean Difference (IV, Fixed, 95% CI) | ‐19.22 [‐28.52, ‐9.91] |
| Analysis 1.4  Comparison 1: 1 mg vs control, Outcome 4: Triglycerides RCTs | ||||
| 1.5 LDL‐cholesterol non‐RCTs Show forest plot | 7 | 504 | Mean Difference (IV, Random, 95% CI) | ‐33.37 [‐35.87, ‐30.86] |
| Analysis 1.5  Comparison 1: 1 mg vs control, Outcome 5: LDL‐cholesterol non‐RCTs | ||||
| 1.6 Total cholesterol non‐RCTs Show forest plot | 7 | 522 | Mean Difference (IV, Random, 95% CI) | ‐23.51 [‐25.98, ‐21.04] |
| Analysis 1.6  Comparison 1: 1 mg vs control, Outcome 6: Total cholesterol non‐RCTs | ||||
| 1.7 HDL‐cholesterol non‐RCTs Show forest plot | 5 | 402 | Mean Difference (IV, Random, 95% CI) | 3.71 [‐1.29, 8.70] |
| Analysis 1.7  Comparison 1: 1 mg vs control, Outcome 7: HDL‐cholesterol non‐RCTs | ||||
| 1.8 Triglycerides non‐RCTs Show forest plot | 6 | 471 | Mean Difference (IV, Fixed, 95% CI) | ‐12.72 [‐15.05, ‐10.38] |
| Analysis 1.8  Comparison 1: 1 mg vs control, Outcome 8: Triglycerides non‐RCTs | ||||
| 1.9 WDAE Show forest plot | 2 | Risk Ratio (IV, Fixed, 95% CI) | Totals not selected | |
| Analysis 1.9  Comparison 1: 1 mg vs control, Outcome 9: WDAE | ||||
| Outcome or subgroup title | No. of studies | No. of participants | Statistical method | Effect size |
| 2.1 LDL cholesterol RCTs Show forest plot | 3 | 253 | Mean Difference (IV, Fixed, 95% CI) | ‐31.00 [‐34.09, ‐27.90] |
| Analysis 2.1  Comparison 2: 2 mg vs control, Outcome 1: LDL cholesterol RCTs | ||||
| 2.2 Total cholesterol RCTs Show forest plot | 3 | 253 | Mean Difference (IV, Fixed, 95% CI) | ‐22.77 [‐25.32, ‐20.22] |
| Analysis 2.2  Comparison 2: 2 mg vs control, Outcome 2: Total cholesterol RCTs | ||||
| 2.3 HDL cholesterol RCTs Show forest plot | 2 | 200 | Mean Difference (IV, Fixed, 95% CI) | 6.25 [3.32, 9.19] |
| Analysis 2.3  Comparison 2: 2 mg vs control, Outcome 3: HDL cholesterol RCTs | ||||
| 2.4 Triglycerides RCTs Show forest plot | 2 | 200 | Mean Difference (IV, Fixed, 95% CI) | ‐24.63 [‐33.45, ‐15.80] |
| Analysis 2.4  Comparison 2: 2 mg vs control, Outcome 4: Triglycerides RCTs | ||||
| 2.5 LDL‐cholesterol non‐RCTs Show forest plot | 33 | 3594 | Mean Difference (IV, Random, 95% CI) | ‐37.97 [‐39.53, ‐36.41] |
| Analysis 2.5  Comparison 2: 2 mg vs control, Outcome 5: LDL‐cholesterol non‐RCTs | ||||
| 2.6 Total cholesterol non‐RCTs Show forest plot | 29 | 2536 | Mean Difference (IV, Fixed, 95% CI) | ‐27.36 [‐27.77, ‐26.96] |
| Analysis 2.6  Comparison 2: 2 mg vs control, Outcome 6: Total cholesterol non‐RCTs | ||||
| 2.7 HDL‐cholesterol non‐RCTs Show forest plot | 28 | 1996 | Mean Difference (IV, Random, 95% CI) | 3.98 [2.40, 5.55] |
| Analysis 2.7  Comparison 2: 2 mg vs control, Outcome 7: HDL‐cholesterol non‐RCTs | ||||
| 2.8 Triglycerides non‐RCTs Show forest plot | 24 | 1835 | Mean Difference (IV, Fixed, 95% CI) | ‐16.66 [‐18.00, ‐15.31] |
| Analysis 2.8  Comparison 2: 2 mg vs control, Outcome 8: Triglycerides non‐RCTs | ||||
| 2.9 WDAE Show forest plot | 2 | Risk Ratio (IV, Fixed, 95% CI) | Totals not selected | |
| Analysis 2.9  Comparison 2: 2 mg vs control, Outcome 9: WDAE | ||||
| Outcome or subgroup title | No. of studies | No. of participants | Statistical method | Effect size |
| 3.1 LDL‐cholesterol RCTs Show forest plot | 4 | 315 | Mean Difference (IV, Fixed, 95% CI) | ‐39.97 [‐42.86, ‐37.08] |
| Analysis 3.1  Comparison 3: 4 mg vs control, Outcome 1: LDL‐cholesterol RCTs | ||||
| 3.2 Total cholesterol RCTs Show forest plot | 4 | 315 | Mean Difference (IV, Random, 95% CI) | ‐28.09 [‐32.73, ‐23.46] |
| Analysis 3.2  Comparison 3: 4 mg vs control, Outcome 2: Total cholesterol RCTs | ||||
| 3.3 HDL cholesterol RCTs Show forest plot | 3 | 264 | Mean Difference (IV, Fixed, 95% CI) | 6.65 [3.57, 9.73] |
| Analysis 3.3  Comparison 3: 4 mg vs control, Outcome 3: HDL cholesterol RCTs | ||||
| 3.4 Triglycerides RCTs Show forest plot | 3 | 264 | Mean Difference (IV, Fixed, 95% CI) | ‐24.81 [‐32.20, ‐17.41] |
| Analysis 3.4  Comparison 3: 4 mg vs control, Outcome 4: Triglycerides RCTs | ||||
| 3.5 LDL‐cholesterol non‐RCTs Show forest plot | 3 | 154 | Mean Difference (IV, Fixed, 95% CI) | ‐46.39 [‐48.54, ‐44.24] |
| Analysis 3.5  Comparison 3: 4 mg vs control, Outcome 5: LDL‐cholesterol non‐RCTs | ||||
| 3.6 Total cholesterol non‐RCTs Show forest plot | 3 | 162 | Mean Difference (IV, Fixed, 95% CI) | ‐32.28 [‐33.95, ‐30.60] |
| Analysis 3.6  Comparison 3: 4 mg vs control, Outcome 6: Total cholesterol non‐RCTs | ||||
| 3.7 HDL‐cholesterol non‐RCTs Show forest plot | 4 | 319 | Mean Difference (IV, Random, 95% CI) | 6.69 [‐1.04, 14.43] |
| Analysis 3.7  Comparison 3: 4 mg vs control, Outcome 7: HDL‐cholesterol non‐RCTs | ||||
| 3.8 Triglycerides non‐RCTs Show forest plot | 3 | 160 | Mean Difference (IV, Fixed, 95% CI) | ‐12.00 [‐18.87, ‐5.14] |
| Analysis 3.8  Comparison 3: 4 mg vs control, Outcome 8: Triglycerides non‐RCTs | ||||
| 3.9 WDAE Show forest plot | 3 | Risk Ratio (IV, Fixed, 95% CI) | Totals not selected | |
| Analysis 3.9  Comparison 3: 4 mg vs control, Outcome 9: WDAE | ||||
| Outcome or subgroup title | No. of studies | No. of participants | Statistical method | Effect size |
| 4.1 LDL cholesterol RCTs Show forest plot | 2 | 256 | Mean Difference (IV, Random, 95% CI) | ‐48.96 [‐54.93, ‐43.00] |
| Analysis 4.1  Comparison 4: 8 mg vs control, Outcome 1: LDL cholesterol RCTs | ||||
| 4.2 Total cholesterol RCTs Show forest plot | 1 | 100 | Mean Difference (IV, Fixed, 95% CI) | ‐37.00 [‐41.46, ‐32.54] |
| Analysis 4.2  Comparison 4: 8 mg vs control, Outcome 2: Total cholesterol RCTs | ||||
| 4.3 HDL cholesterol RCTs Show forest plot | 1 | 100 | Mean Difference (IV, Fixed, 95% CI) | 6.00 [0.44, 11.56] |
| Analysis 4.3  Comparison 4: 8 mg vs control, Outcome 3: HDL cholesterol RCTs | ||||
| 4.4 Triglycerides RCTs Show forest plot | 1 | 100 | Mean Difference (IV, Fixed, 95% CI) | ‐32.90 [‐45.17, ‐20.63] |
| Analysis 4.4  Comparison 4: 8 mg vs control, Outcome 4: Triglycerides RCTs | ||||
| Outcome or subgroup title | No. of studies | No. of participants | Statistical method | Effect size |
| 5.1 LDL cholesterol RCTs Show forest plot | 1 | 156 | Mean Difference (IV, Fixed, 95% CI) | ‐54.50 [‐59.47, ‐49.53] |
| Analysis 5.1  Comparison 5: 16 mg vs control, Outcome 1: LDL cholesterol RCTs | ||||
| Outcome or subgroup title | No. of studies | No. of participants | Statistical method | Effect size |
| 6.1 WDAE Show forest plot | 3 | 371 | Risk Ratio (IV, Fixed, 95% CI) | 1.35 [0.15, 12.04] |
| Analysis 6.1  Comparison 6: All doses of pitavastatin vs placebo, Outcome 1: WDAE | ||||
Study flow diagram for pitavastatin.

Number of included trials according to publication year
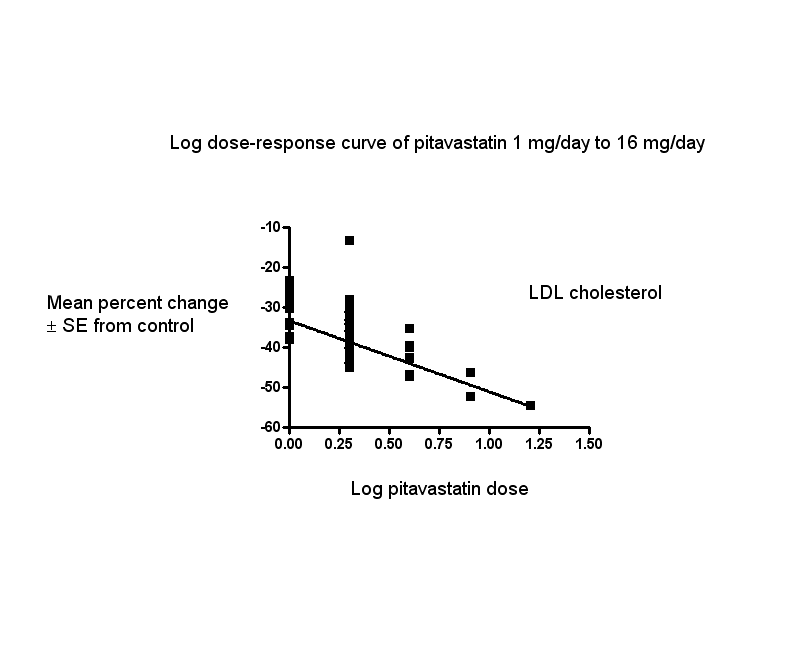
Log dose pitavastatin response curve for LDL cholesterol
Values represent the results of each trial for each dose comparison. The standard error bars cannot be seen because they all lie within the points
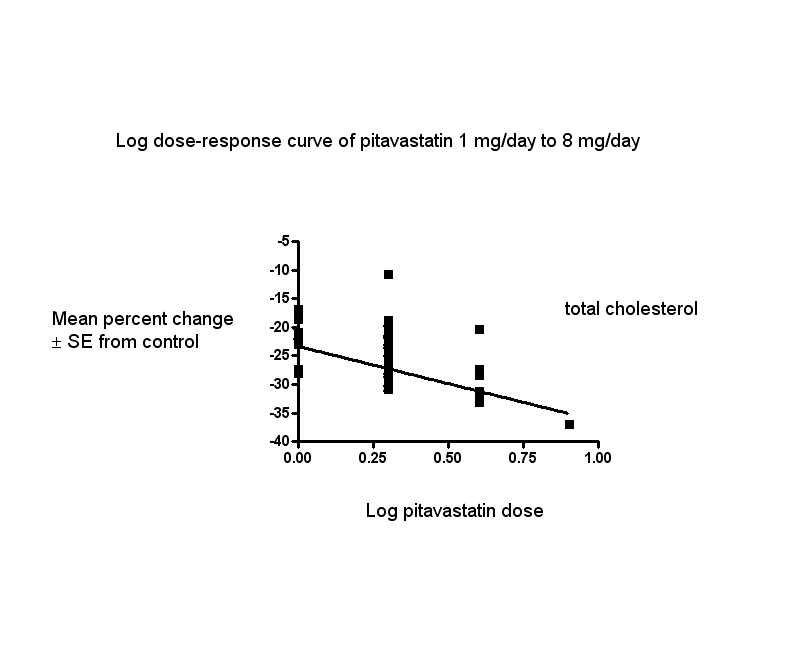
Log dose pitavastatin response curve for total cholesterol
Values represent the results of each trial for each dose comparison. The standard error bars cannot be seen because they all lie within the points

Log dose pitavastatin response curve for triglycerides
Values represent the results of each trial for each dose comparison. The standard error bars cannot be seen because they all lie within the points

Risk of bias summary: review authors' judgements about each risk of bias item for each included study.

Comparison 1: 1 mg vs control, Outcome 1: LDL cholesterol RCTs

Comparison 1: 1 mg vs control, Outcome 2: Total cholesterol RCTs

Comparison 1: 1 mg vs control, Outcome 3: HDL cholesterol RCTs

Comparison 1: 1 mg vs control, Outcome 4: Triglycerides RCTs

Comparison 1: 1 mg vs control, Outcome 5: LDL‐cholesterol non‐RCTs

Comparison 1: 1 mg vs control, Outcome 6: Total cholesterol non‐RCTs

Comparison 1: 1 mg vs control, Outcome 7: HDL‐cholesterol non‐RCTs

Comparison 1: 1 mg vs control, Outcome 8: Triglycerides non‐RCTs

Comparison 1: 1 mg vs control, Outcome 9: WDAE

Comparison 2: 2 mg vs control, Outcome 1: LDL cholesterol RCTs

Comparison 2: 2 mg vs control, Outcome 2: Total cholesterol RCTs

Comparison 2: 2 mg vs control, Outcome 3: HDL cholesterol RCTs

Comparison 2: 2 mg vs control, Outcome 4: Triglycerides RCTs

Comparison 2: 2 mg vs control, Outcome 5: LDL‐cholesterol non‐RCTs

Comparison 2: 2 mg vs control, Outcome 6: Total cholesterol non‐RCTs

Comparison 2: 2 mg vs control, Outcome 7: HDL‐cholesterol non‐RCTs

Comparison 2: 2 mg vs control, Outcome 8: Triglycerides non‐RCTs

Comparison 2: 2 mg vs control, Outcome 9: WDAE

Comparison 3: 4 mg vs control, Outcome 1: LDL‐cholesterol RCTs

Comparison 3: 4 mg vs control, Outcome 2: Total cholesterol RCTs

Comparison 3: 4 mg vs control, Outcome 3: HDL cholesterol RCTs

Comparison 3: 4 mg vs control, Outcome 4: Triglycerides RCTs

Comparison 3: 4 mg vs control, Outcome 5: LDL‐cholesterol non‐RCTs

Comparison 3: 4 mg vs control, Outcome 6: Total cholesterol non‐RCTs

Comparison 3: 4 mg vs control, Outcome 7: HDL‐cholesterol non‐RCTs

Comparison 3: 4 mg vs control, Outcome 8: Triglycerides non‐RCTs

Comparison 3: 4 mg vs control, Outcome 9: WDAE

Comparison 4: 8 mg vs control, Outcome 1: LDL cholesterol RCTs

Comparison 4: 8 mg vs control, Outcome 2: Total cholesterol RCTs

Comparison 4: 8 mg vs control, Outcome 3: HDL cholesterol RCTs

Comparison 4: 8 mg vs control, Outcome 4: Triglycerides RCTs

Comparison 5: 16 mg vs control, Outcome 1: LDL cholesterol RCTs

Comparison 6: All doses of pitavastatin vs placebo, Outcome 1: WDAE
| Low‐density lipoprotein (LDL) cholesterol‐lowering efficacy of pitavastatin | ||||||
| Patient or population: participants with normal or abnormal lipid profiles Settings: ambulatory clinics Intervention: different fixed doses of pitavastatin Comparison: placebo or baseline | ||||||
| pitavastatin dose | Anticipated absolute effects mmol/L (95%CI) | Percentage change from baseline | No of participants | Certainty of the evidence | Comments | |
|---|---|---|---|---|---|---|
| LDL‐cholesterol before exposure to pitavastatina | LDL‐cholesterol after exposure to pitavastatin | |||||
| 1 mg/day | 5.06 (4.39 to 5.74) | 3.38 (3.32 to 3.44) | ‐33.2 (‐34.3 to ‐32.1) | 759 | ⊕⊕⊕⊕ | Effect predicted from log dose‐response curve, ‐33.3% |
| 2 mg/day | 4.51 (4.24 to 4.79) | 2.77 (2.75 to 2.79) | ‐38.65 (‐39.1 to ‐38.2) | 3847 (36) | ⊕⊕⊕⊕ | Effect predicted from log dose‐response curve, ‐38.6% |
| 4 mg/day | 5.04 (4.24 to 5.85) | 2.82 (2.73 to 2.91) | ‐44.0 (‐45.8 to ‐42.3) | 469 (7) | ⊕⊕⊕⊕ | Effect predicted from log dose‐response curve, ‐44.0% |
| CI: Confidence interval | ||||||
| GRADE Working Group grades of evidence | ||||||
| aMean baseline values. | ||||||
| Total cholesterol‐lowering efficacy ofpitavastatin | ||||||
| Patient or population: participants with normal or abnormal lipid profiles Settings: ambulatory clinics Intervention: different fixed doses of pitavastatin Comparison: placebo or baseline | ||||||
| Pitavastatin dose | Anticipated absolute effects mmol/L (95%CI) | Percentage change from baseline | № of participants | Certainty of the evidence | Comments | |
|---|---|---|---|---|---|---|
| Total cholesterol before exposure to pitavastatina | Total cholesterol after exposure to pitavastatin | |||||
| 1 mg/day | 7.24 (6.67 to 7.82) | 5.55 (5.49 to 5.60) | ‐23.4 (‐24.2 to ‐22.7) | 777 | ⊕⊕⊕⊕ | Effect predicted from log dose‐response equation is ‐23.3% |
| 2 mg/day | 6.65 (6.33 to 6.97) | 4.84 (4.81 to 4.87) | ‐27.25 (‐27.65 to ‐26.84) | 2789 | ⊕⊕⊕⊕ | Effect predicted from log dose‐response equation is ‐27.3% |
| 4 mg/day | 7.21 (6.49 to 7.94) | 4.97 (4.87 to 5.07) | ‐31.1 (‐32.4 to ‐29.7) | 477 | ⊕⊕⊕⊕ | Effect predicted from log dose‐response equation is ‐31.2% |
| CI: Confidence interval | ||||||
| GRADE Working Group grades of evidence | ||||||
| aMean baseline values. | ||||||
| Triglyceride‐lowering efficacy of pitavastatin | ||||||
| Patient or population: participants with normal or abnormal lipid profiles Settings: ambulatory clinics Intervention: different fixed doses of pitavastatin Comparison: placebo or baseline | ||||||
| Pitavastatin dose | Anticipated absolute effects mmol/L (95%CI) | Percentage change from baseline | № of participants | Certainty of the evidence | Comments | |
|---|---|---|---|---|---|---|
| Triglycerides before exposure to pitavastatina | Triglycerides after exposure to pitavastatin | |||||
| 1 mg/day | 1.71 (1.27 to 2.15) | 1.49 (1.45 to 1.52) | ‐13.1 (‐15.4 to ‐10.85) | 673 | ⊕⊕⊕⊕ | Effect predicted from log dose‐response equation is ‐13.0% |
| 2 mg/day | 1.88 (1.75 to 2.02) | 1.56 (1.54 to 1.59) | ‐16.8 (‐18.2 to ‐15.5) | 2035 | ⊕⊕⊕⊕ | Effect predicted from log dose‐response equation is ‐16.8% |
| 4 mg/day | 2.04 (1.29 to 2.79) | 1.67 (1.57 to 1.77) | ‐18.0 (‐23.0 to ‐13.0) | 424 (6) | ⊕⊕⊕⊕ | Effect predicted from log dose‐response equation is ‐20.6% |
| CI: Confidence interval | ||||||
| GRADE Working Group grades of evidence | ||||||
| aMean baseline values. | ||||||
| Pitavastatin dose mg/day | 1 | 2 | 4 | 8 | 16 |
| Mean percentage change from control of LDL‐Ca (95% confidence interval) | ‐33.2 (‐34.3 to ‐32.1) | ‐38.65 (‐39.1 to ‐38.2) | ‐44.0 (‐45.8 to ‐42.3) | ‐48.7 (‐52.4 to ‐45.0) | ‐54.5 (‐59.4 to ‐49.6) |
| Mean percentage change from control of total cholesterol (95% confidence interval) | ‐23.4 (‐24.2 to ‐22.7) | ‐27.25 (‐27.65 to ‐26.84) | ‐31.1 (‐32.4 to ‐29.7) | ‐37.0 (‐41.4 to ‐32.6) | |
| Mean percentage change from control of triglycerides (95% confidence interval) | ‐13.1 (‐15.4 to ‐10.85) | ‐16.8 (‐18.2 to ‐15.5) | ‐18.0 (‐23.0 to ‐13.0) | ‐32.9 (‐45.0 to ‐20.8) | |
| aLDL‐C: low‐density lipoprotein cholesterol | |||||
| Outcome or subgroup title | No. of studies | No. of participants | Statistical method | Effect size |
| 1.1 LDL cholesterol RCTs Show forest plot | 3 | 255 | Mean Difference (IV, Fixed, 95% CI) | ‐26.85 [‐29.89, ‐23.81] |
| 1.2 Total cholesterol RCTs Show forest plot | 3 | 255 | Mean Difference (IV, Fixed, 95% CI) | ‐19.43 [‐21.90, ‐16.97] |
| 1.3 HDL cholesterol RCTs Show forest plot | 2 | 202 | Mean Difference (IV, Fixed, 95% CI) | 6.28 [3.36, 9.20] |
| 1.4 Triglycerides RCTs Show forest plot | 2 | 202 | Mean Difference (IV, Fixed, 95% CI) | ‐19.22 [‐28.52, ‐9.91] |
| 1.5 LDL‐cholesterol non‐RCTs Show forest plot | 7 | 504 | Mean Difference (IV, Random, 95% CI) | ‐33.37 [‐35.87, ‐30.86] |
| 1.6 Total cholesterol non‐RCTs Show forest plot | 7 | 522 | Mean Difference (IV, Random, 95% CI) | ‐23.51 [‐25.98, ‐21.04] |
| 1.7 HDL‐cholesterol non‐RCTs Show forest plot | 5 | 402 | Mean Difference (IV, Random, 95% CI) | 3.71 [‐1.29, 8.70] |
| 1.8 Triglycerides non‐RCTs Show forest plot | 6 | 471 | Mean Difference (IV, Fixed, 95% CI) | ‐12.72 [‐15.05, ‐10.38] |
| 1.9 WDAE Show forest plot | 2 | Risk Ratio (IV, Fixed, 95% CI) | Totals not selected | |
| Outcome or subgroup title | No. of studies | No. of participants | Statistical method | Effect size |
| 2.1 LDL cholesterol RCTs Show forest plot | 3 | 253 | Mean Difference (IV, Fixed, 95% CI) | ‐31.00 [‐34.09, ‐27.90] |
| 2.2 Total cholesterol RCTs Show forest plot | 3 | 253 | Mean Difference (IV, Fixed, 95% CI) | ‐22.77 [‐25.32, ‐20.22] |
| 2.3 HDL cholesterol RCTs Show forest plot | 2 | 200 | Mean Difference (IV, Fixed, 95% CI) | 6.25 [3.32, 9.19] |
| 2.4 Triglycerides RCTs Show forest plot | 2 | 200 | Mean Difference (IV, Fixed, 95% CI) | ‐24.63 [‐33.45, ‐15.80] |
| 2.5 LDL‐cholesterol non‐RCTs Show forest plot | 33 | 3594 | Mean Difference (IV, Random, 95% CI) | ‐37.97 [‐39.53, ‐36.41] |
| 2.6 Total cholesterol non‐RCTs Show forest plot | 29 | 2536 | Mean Difference (IV, Fixed, 95% CI) | ‐27.36 [‐27.77, ‐26.96] |
| 2.7 HDL‐cholesterol non‐RCTs Show forest plot | 28 | 1996 | Mean Difference (IV, Random, 95% CI) | 3.98 [2.40, 5.55] |
| 2.8 Triglycerides non‐RCTs Show forest plot | 24 | 1835 | Mean Difference (IV, Fixed, 95% CI) | ‐16.66 [‐18.00, ‐15.31] |
| 2.9 WDAE Show forest plot | 2 | Risk Ratio (IV, Fixed, 95% CI) | Totals not selected | |
| Outcome or subgroup title | No. of studies | No. of participants | Statistical method | Effect size |
| 3.1 LDL‐cholesterol RCTs Show forest plot | 4 | 315 | Mean Difference (IV, Fixed, 95% CI) | ‐39.97 [‐42.86, ‐37.08] |
| 3.2 Total cholesterol RCTs Show forest plot | 4 | 315 | Mean Difference (IV, Random, 95% CI) | ‐28.09 [‐32.73, ‐23.46] |
| 3.3 HDL cholesterol RCTs Show forest plot | 3 | 264 | Mean Difference (IV, Fixed, 95% CI) | 6.65 [3.57, 9.73] |
| 3.4 Triglycerides RCTs Show forest plot | 3 | 264 | Mean Difference (IV, Fixed, 95% CI) | ‐24.81 [‐32.20, ‐17.41] |
| 3.5 LDL‐cholesterol non‐RCTs Show forest plot | 3 | 154 | Mean Difference (IV, Fixed, 95% CI) | ‐46.39 [‐48.54, ‐44.24] |
| 3.6 Total cholesterol non‐RCTs Show forest plot | 3 | 162 | Mean Difference (IV, Fixed, 95% CI) | ‐32.28 [‐33.95, ‐30.60] |
| 3.7 HDL‐cholesterol non‐RCTs Show forest plot | 4 | 319 | Mean Difference (IV, Random, 95% CI) | 6.69 [‐1.04, 14.43] |
| 3.8 Triglycerides non‐RCTs Show forest plot | 3 | 160 | Mean Difference (IV, Fixed, 95% CI) | ‐12.00 [‐18.87, ‐5.14] |
| 3.9 WDAE Show forest plot | 3 | Risk Ratio (IV, Fixed, 95% CI) | Totals not selected | |
| Outcome or subgroup title | No. of studies | No. of participants | Statistical method | Effect size |
| 4.1 LDL cholesterol RCTs Show forest plot | 2 | 256 | Mean Difference (IV, Random, 95% CI) | ‐48.96 [‐54.93, ‐43.00] |
| 4.2 Total cholesterol RCTs Show forest plot | 1 | 100 | Mean Difference (IV, Fixed, 95% CI) | ‐37.00 [‐41.46, ‐32.54] |
| 4.3 HDL cholesterol RCTs Show forest plot | 1 | 100 | Mean Difference (IV, Fixed, 95% CI) | 6.00 [0.44, 11.56] |
| 4.4 Triglycerides RCTs Show forest plot | 1 | 100 | Mean Difference (IV, Fixed, 95% CI) | ‐32.90 [‐45.17, ‐20.63] |
| Outcome or subgroup title | No. of studies | No. of participants | Statistical method | Effect size |
| 5.1 LDL cholesterol RCTs Show forest plot | 1 | 156 | Mean Difference (IV, Fixed, 95% CI) | ‐54.50 [‐59.47, ‐49.53] |
| Outcome or subgroup title | No. of studies | No. of participants | Statistical method | Effect size |
| 6.1 WDAE Show forest plot | 3 | 371 | Risk Ratio (IV, Fixed, 95% CI) | 1.35 [0.15, 12.04] |