Scolaris Content Display Scolaris Content Display

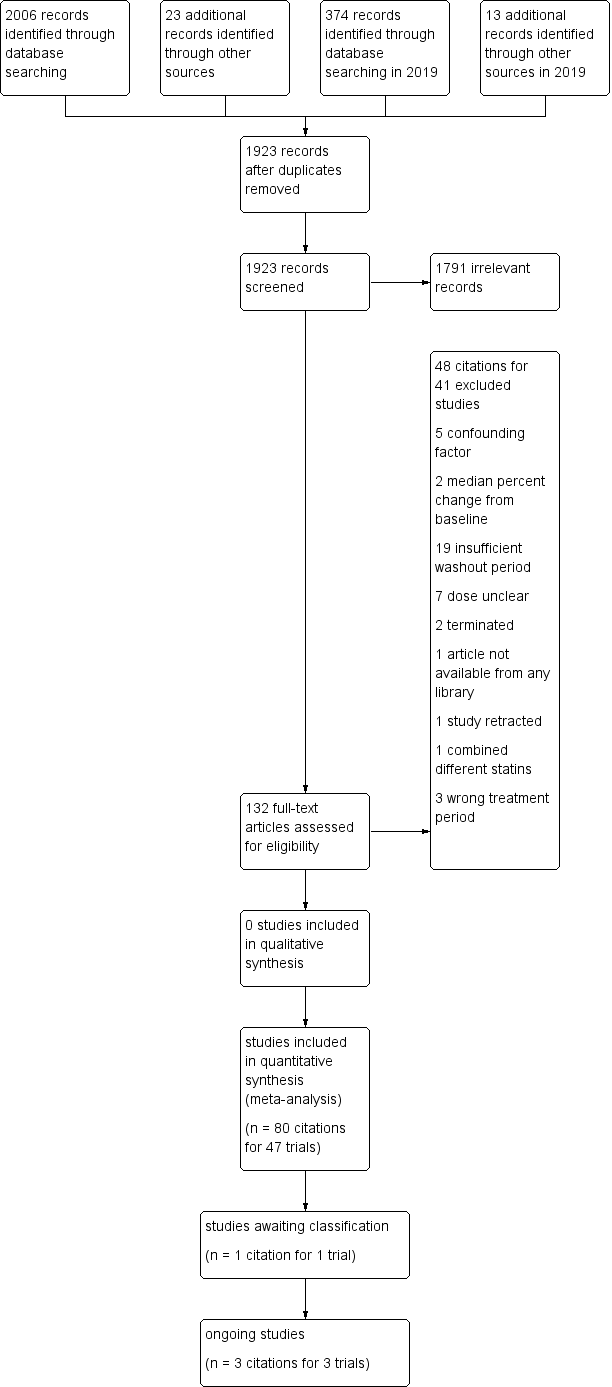
Study flow diagram for pitavastatin.

Figuras y tablas -
Figure 1

Study flow diagram for pitavastatin.

Number of included trials according to publication year

Figuras y tablas -
Figure 2

Number of included trials according to publication year

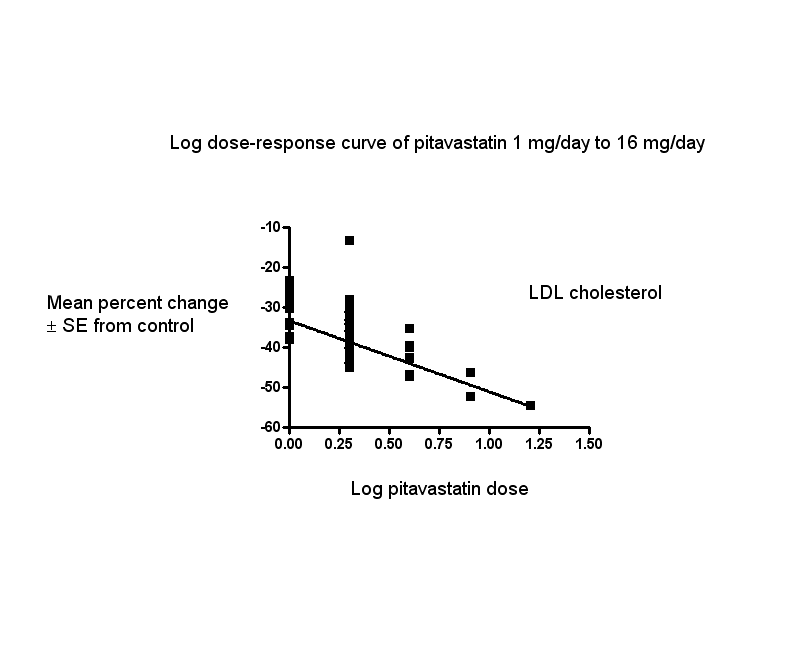
Log dose pitavastatin response curve for LDL cholesterolValues represent the results of each trial for each dose comparison. The standard error bars cannot be seen because they all lie within the points

Figuras y tablas -
Figure 3

Log dose pitavastatin response curve for LDL cholesterol

Values represent the results of each trial for each dose comparison. The standard error bars cannot be seen because they all lie within the points

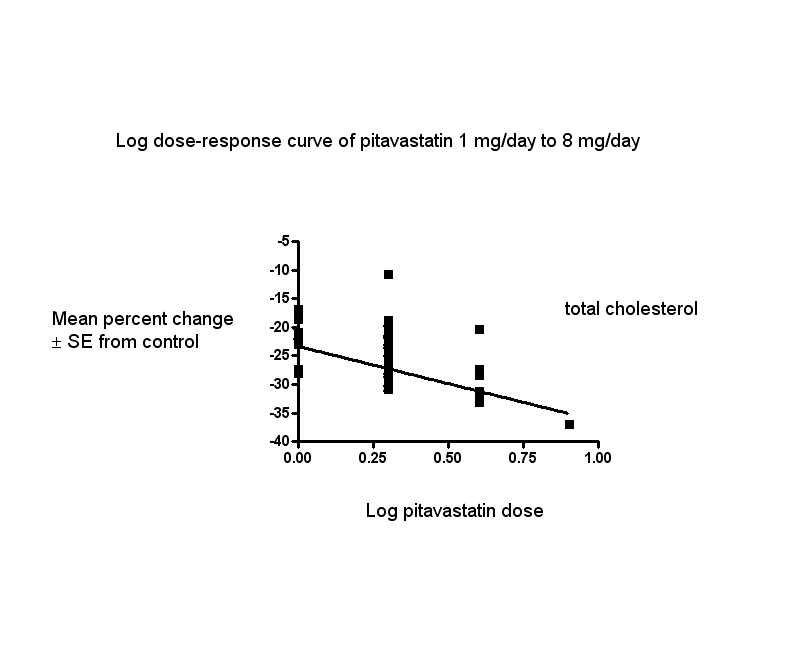
Log dose pitavastatin response curve for total cholesterolValues represent the results of each trial for each dose comparison. The standard error bars cannot be seen because they all lie within the points

Figuras y tablas -
Figure 4

Log dose pitavastatin response curve for total cholesterol

Values represent the results of each trial for each dose comparison. The standard error bars cannot be seen because they all lie within the points

Log dose pitavastatin response curve for triglyceridesValues represent the results of each trial for each dose comparison. The standard error bars cannot be seen because they all lie within the points

Figuras y tablas -
Figure 5

Log dose pitavastatin response curve for triglycerides

Values represent the results of each trial for each dose comparison. The standard error bars cannot be seen because they all lie within the points

Risk of bias summary: review authors' judgements about each risk of bias item for each included study.

Figuras y tablas -
Figure 6

Risk of bias summary: review authors' judgements about each risk of bias item for each included study.

Comparison 1: 1 mg vs control, Outcome 1: LDL cholesterol RCTs

Figuras y tablas -
Analysis 1.1

Comparison 1: 1 mg vs control, Outcome 1: LDL cholesterol RCTs

Comparison 1: 1 mg vs control, Outcome 2: Total cholesterol RCTs

Figuras y tablas -
Analysis 1.2

Comparison 1: 1 mg vs control, Outcome 2: Total cholesterol RCTs

Comparison 1: 1 mg vs control, Outcome 3: HDL cholesterol RCTs

Figuras y tablas -
Analysis 1.3

Comparison 1: 1 mg vs control, Outcome 3: HDL cholesterol RCTs

Comparison 1: 1 mg vs control, Outcome 4: Triglycerides RCTs

Figuras y tablas -
Analysis 1.4

Comparison 1: 1 mg vs control, Outcome 4: Triglycerides RCTs

Comparison 1: 1 mg vs control, Outcome 5: LDL‐cholesterol non‐RCTs

Figuras y tablas -
Analysis 1.5

Comparison 1: 1 mg vs control, Outcome 5: LDL‐cholesterol non‐RCTs

Comparison 1: 1 mg vs control, Outcome 6: Total cholesterol non‐RCTs

Figuras y tablas -
Analysis 1.6

Comparison 1: 1 mg vs control, Outcome 6: Total cholesterol non‐RCTs

Comparison 1: 1 mg vs control, Outcome 7: HDL‐cholesterol non‐RCTs

Figuras y tablas -
Analysis 1.7

Comparison 1: 1 mg vs control, Outcome 7: HDL‐cholesterol non‐RCTs

Comparison 1: 1 mg vs control, Outcome 8: Triglycerides non‐RCTs

Figuras y tablas -
Analysis 1.8

Comparison 1: 1 mg vs control, Outcome 8: Triglycerides non‐RCTs

Comparison 1: 1 mg vs control, Outcome 9: WDAE

Figuras y tablas -
Analysis 1.9

Comparison 1: 1 mg vs control, Outcome 9: WDAE

Comparison 2: 2 mg vs control, Outcome 1: LDL cholesterol RCTs

Figuras y tablas -
Analysis 2.1

Comparison 2: 2 mg vs control, Outcome 1: LDL cholesterol RCTs

Comparison 2: 2 mg vs control, Outcome 2: Total cholesterol RCTs

Figuras y tablas -
Analysis 2.2

Comparison 2: 2 mg vs control, Outcome 2: Total cholesterol RCTs

Comparison 2: 2 mg vs control, Outcome 3: HDL cholesterol RCTs

Figuras y tablas -
Analysis 2.3

Comparison 2: 2 mg vs control, Outcome 3: HDL cholesterol RCTs

Comparison 2: 2 mg vs control, Outcome 4: Triglycerides RCTs

Figuras y tablas -
Analysis 2.4

Comparison 2: 2 mg vs control, Outcome 4: Triglycerides RCTs

Comparison 2: 2 mg vs control, Outcome 5: LDL‐cholesterol non‐RCTs

Figuras y tablas -
Analysis 2.5

Comparison 2: 2 mg vs control, Outcome 5: LDL‐cholesterol non‐RCTs

Comparison 2: 2 mg vs control, Outcome 6: Total cholesterol non‐RCTs

Figuras y tablas -
Analysis 2.6

Comparison 2: 2 mg vs control, Outcome 6: Total cholesterol non‐RCTs

Comparison 2: 2 mg vs control, Outcome 7: HDL‐cholesterol non‐RCTs

Figuras y tablas -
Analysis 2.7

Comparison 2: 2 mg vs control, Outcome 7: HDL‐cholesterol non‐RCTs

Comparison 2: 2 mg vs control, Outcome 8: Triglycerides non‐RCTs

Figuras y tablas -
Analysis 2.8

Comparison 2: 2 mg vs control, Outcome 8: Triglycerides non‐RCTs

Comparison 2: 2 mg vs control, Outcome 9: WDAE

Figuras y tablas -
Analysis 2.9

Comparison 2: 2 mg vs control, Outcome 9: WDAE

Comparison 3: 4 mg vs control, Outcome 1: LDL‐cholesterol RCTs

Figuras y tablas -
Analysis 3.1

Comparison 3: 4 mg vs control, Outcome 1: LDL‐cholesterol RCTs

Comparison 3: 4 mg vs control, Outcome 2: Total cholesterol RCTs

Figuras y tablas -
Analysis 3.2

Comparison 3: 4 mg vs control, Outcome 2: Total cholesterol RCTs

Comparison 3: 4 mg vs control, Outcome 3: HDL cholesterol RCTs

Figuras y tablas -
Analysis 3.3

Comparison 3: 4 mg vs control, Outcome 3: HDL cholesterol RCTs

Comparison 3: 4 mg vs control, Outcome 4: Triglycerides RCTs

Figuras y tablas -
Analysis 3.4

Comparison 3: 4 mg vs control, Outcome 4: Triglycerides RCTs

Comparison 3: 4 mg vs control, Outcome 5: LDL‐cholesterol non‐RCTs

Figuras y tablas -
Analysis 3.5

Comparison 3: 4 mg vs control, Outcome 5: LDL‐cholesterol non‐RCTs

Comparison 3: 4 mg vs control, Outcome 6: Total cholesterol non‐RCTs

Figuras y tablas -
Analysis 3.6

Comparison 3: 4 mg vs control, Outcome 6: Total cholesterol non‐RCTs

Comparison 3: 4 mg vs control, Outcome 7: HDL‐cholesterol non‐RCTs

Figuras y tablas -
Analysis 3.7

Comparison 3: 4 mg vs control, Outcome 7: HDL‐cholesterol non‐RCTs

Comparison 3: 4 mg vs control, Outcome 8: Triglycerides non‐RCTs

Figuras y tablas -
Analysis 3.8

Comparison 3: 4 mg vs control, Outcome 8: Triglycerides non‐RCTs

Comparison 3: 4 mg vs control, Outcome 9: WDAE

Figuras y tablas -
Analysis 3.9

Comparison 3: 4 mg vs control, Outcome 9: WDAE

Comparison 4: 8 mg vs control, Outcome 1: LDL cholesterol RCTs

Figuras y tablas -
Analysis 4.1

Comparison 4: 8 mg vs control, Outcome 1: LDL cholesterol RCTs

Comparison 4: 8 mg vs control, Outcome 2: Total cholesterol RCTs

Figuras y tablas -
Analysis 4.2

Comparison 4: 8 mg vs control, Outcome 2: Total cholesterol RCTs

Comparison 4: 8 mg vs control, Outcome 3: HDL cholesterol RCTs

Figuras y tablas -
Analysis 4.3

Comparison 4: 8 mg vs control, Outcome 3: HDL cholesterol RCTs

Comparison 4: 8 mg vs control, Outcome 4: Triglycerides RCTs

Figuras y tablas -
Analysis 4.4

Comparison 4: 8 mg vs control, Outcome 4: Triglycerides RCTs

Comparison 5: 16 mg vs control, Outcome 1: LDL cholesterol RCTs

Figuras y tablas -
Analysis 5.1

Comparison 5: 16 mg vs control, Outcome 1: LDL cholesterol RCTs

Comparison 6: All doses of pitavastatin vs placebo, Outcome 1: WDAE

Figuras y tablas -
Analysis 6.1

Comparison 6: All doses of pitavastatin vs placebo, Outcome 1: WDAE

Summary of findings 1. Low‐density lipoprotein (LDL) cholesterol‐lowering efficacy of pitavastatin

Low‐density lipoprotein (LDL) cholesterol‐lowering efficacy of pitavastatin

Patient or population: participants with normal or abnormal lipid profiles

Settings: ambulatory clinics

Intervention: different fixed doses of pitavastatin

Comparison: placebo or baseline

pitavastatin dose

Anticipated absolute effects

mmol/L (95%CI)

Percentage change from baseline
(95% CI)

No of participants
(trials)

Certainty of the evidence
(GRADE)

Comments

LDL‐cholesterol before exposure to pitavastatina

LDL‐cholesterol after exposure to pitavastatin

1 mg/day

5.06

(4.39 to 5.74)

3.38

(3.32 to 3.44)

‐33.2

(‐34.3 to ‐32.1)

759
(10)

⊕⊕⊕⊕
high

Effect predicted from log dose‐response curve, ‐33.3%

2 mg/day

4.51

(4.24 to 4.79)

2.77

(2.75 to 2.79)

‐38.65

(‐39.1 to ‐38.2)

3847

(36)

⊕⊕⊕⊕
high

Effect predicted from log dose‐response curve, ‐38.6%

4 mg/day

5.04

(4.24 to 5.85)

2.82

(2.73 to 2.91)

‐44.0

(‐45.8 to ‐42.3)

469

(7)

⊕⊕⊕⊕
high

Effect predicted from log dose‐response curve, ‐44.0%

CI: Confidence interval

GRADE Working Group grades of evidence
High quality: Further research is very unlikely to change our confidence in the estimate of effect.
Moderate quality: Further research is likely to have an important impact on our confidence in the estimate of effect and may change the estimate.
Low quality: Further research is very likely to have an important impact on our confidence in the estimate of effect and is likely to change the estimate.
Very low quality: We are very uncertain about the estimate.

aMean baseline values.

Figuras y tablas -
Summary of findings 1. Low‐density lipoprotein (LDL) cholesterol‐lowering efficacy of pitavastatin
Summary of findings 2. Total cholesterol‐lowering efficacy of pitavastatin

Total cholesterol‐lowering efficacy ofpitavastatin

Patient or population: participants with normal or abnormal lipid profiles

Settings: ambulatory clinics

Intervention: different fixed doses of pitavastatin

Comparison: placebo or baseline

Pitavastatin dose

Anticipated absolute effects

mmol/L (95%CI)

Percentage change from baseline
(95% CI)

№ of participants
(trials)

Certainty of the evidence
(GRADE)

Comments

Total cholesterol before exposure to pitavastatina

Total cholesterol after exposure to pitavastatin

1 mg/day

7.24

(6.67 to 7.82)

5.55

(5.49 to 5.60)

‐23.4

(‐24.2 to ‐22.7)

777
(10)

⊕⊕⊕⊕
high

Effect predicted from log dose‐response equation is ‐23.3%

2 mg/day

6.65

(6.33 to 6.97)

4.84

(4.81 to 4.87)

‐27.25

(‐27.65 to ‐26.84)

2789
(32)

⊕⊕⊕⊕
high

Effect predicted from log dose‐response equation is ‐27.3%

4 mg/day

7.21

(6.49 to 7.94)

4.97

(4.87 to 5.07)

‐31.1

(‐32.4 to ‐29.7)

477
(7)

⊕⊕⊕⊕
high

Effect predicted from log dose‐response equation is ‐31.2%

CI: Confidence interval

GRADE Working Group grades of evidence
High quality: Further research is very unlikely to change our confidence in the estimate of effect.
Moderate quality: Further research is likely to have an important impact on our confidence in the estimate of effect and may change the estimate.
Low quality: Further research is very likely to have an important impact on our confidence in the estimate of effect and is likely to change the estimate.
Very low quality: We are very uncertain about the estimate.

aMean baseline values.

Figuras y tablas -
Summary of findings 2. Total cholesterol‐lowering efficacy of pitavastatin
Summary of findings 3. Triglyceride‐lowering efficacy of pitavastatin

Triglyceride‐lowering efficacy of pitavastatin

Patient or population: participants with normal or abnormal lipid profiles

Settings: ambulatory clinics

Intervention: different fixed doses of pitavastatin

Comparison: placebo or baseline

Pitavastatin dose

Anticipated absolute effects

mmol/L (95%CI)

Percentage change from baseline
(95% CI)

№ of participants
(trials)

Certainty of the evidence
(GRADE)

Comments

Triglycerides before exposure to pitavastatina

Triglycerides after exposure to pitavastatin

1 mg/day

1.71

(1.27 to 2.15)

1.49

(1.45 to 1.52)

‐13.1

(‐15.4 to ‐10.85)

673
(8)

⊕⊕⊕⊕
high

Effect predicted from log dose‐response equation is ‐13.0%

2 mg/day

1.88

(1.75 to 2.02)

1.56

(1.54 to 1.59)

‐16.8

(‐18.2 to ‐15.5)

2035
(26)

⊕⊕⊕⊕
high

Effect predicted from log dose‐response equation is ‐16.8%

4 mg/day

2.04

(1.29 to 2.79)

1.67

(1.57 to 1.77)

‐18.0

(‐23.0 to ‐13.0)

424

(6)

⊕⊕⊕⊕
high

Effect predicted from log dose‐response equation is ‐20.6%

CI: Confidence interval

GRADE Working Group grades of evidence
High quality: Further research is very unlikely to change our confidence in the estimate of effect.
Moderate quality: Further research is likely to have an important impact on our confidence in the estimate of effect and may change the estimate.
Low quality: Further research is very likely to have an important impact on our confidence in the estimate of effect and is likely to change the estimate.
Very low quality: We are very uncertain about the estimate.

aMean baseline values.

Figuras y tablas -
Summary of findings 3. Triglyceride‐lowering efficacy of pitavastatin
Table 1. Pitavastatin overall efficacy

Pitavastatin dose mg/day

1

2

4

8

16

Mean percentage

change from control

of LDL‐Ca

(95% confidence interval)

‐33.2

(‐34.3 to ‐32.1)

‐38.65

(‐39.1 to ‐38.2)

‐44.0

(‐45.8 to ‐42.3)

‐48.7

(‐52.4 to ‐45.0)

‐54.5

(‐59.4 to ‐49.6)

Mean percentage

change from

control of total

cholesterol

(95% confidence interval)

‐23.4

(‐24.2 to ‐22.7)

‐27.25

(‐27.65 to ‐26.84)

‐31.1

(‐32.4 to ‐29.7)

‐37.0

(‐41.4 to ‐32.6)

Mean percentage

change from

control

of triglycerides

(95% confidence interval)

‐13.1

(‐15.4 to ‐10.85)

‐16.8

(‐18.2 to ‐15.5)

‐18.0

(‐23.0 to ‐13.0)

‐32.9

(‐45.0 to ‐20.8)

aLDL‐C: low‐density lipoprotein cholesterol

Figuras y tablas -
Table 1. Pitavastatin overall efficacy
Comparison 1. 1 mg vs control

Outcome or subgroup title

No. of studies

No. of participants

Statistical method

Effect size

1.1 LDL cholesterol RCTs Show forest plot

3

255

Mean Difference (IV, Fixed, 95% CI)

‐26.85 [‐29.89, ‐23.81]

1.2 Total cholesterol RCTs Show forest plot

3

255

Mean Difference (IV, Fixed, 95% CI)

‐19.43 [‐21.90, ‐16.97]

1.3 HDL cholesterol RCTs Show forest plot

2

202

Mean Difference (IV, Fixed, 95% CI)

6.28 [3.36, 9.20]

1.4 Triglycerides RCTs Show forest plot

2

202

Mean Difference (IV, Fixed, 95% CI)

‐19.22 [‐28.52, ‐9.91]

1.5 LDL‐cholesterol non‐RCTs Show forest plot

7

504

Mean Difference (IV, Random, 95% CI)

‐33.37 [‐35.87, ‐30.86]

1.6 Total cholesterol non‐RCTs Show forest plot

7

522

Mean Difference (IV, Random, 95% CI)

‐23.51 [‐25.98, ‐21.04]

1.7 HDL‐cholesterol non‐RCTs Show forest plot

5

402

Mean Difference (IV, Random, 95% CI)

3.71 [‐1.29, 8.70]

1.8 Triglycerides non‐RCTs Show forest plot

6

471

Mean Difference (IV, Fixed, 95% CI)

‐12.72 [‐15.05, ‐10.38]

1.9 WDAE Show forest plot

2

Risk Ratio (IV, Fixed, 95% CI)

Totals not selected

Figuras y tablas -
Comparison 1. 1 mg vs control
Comparison 2. 2 mg vs control

Outcome or subgroup title

No. of studies

No. of participants

Statistical method

Effect size

2.1 LDL cholesterol RCTs Show forest plot

3

253

Mean Difference (IV, Fixed, 95% CI)

‐31.00 [‐34.09, ‐27.90]

2.2 Total cholesterol RCTs Show forest plot

3

253

Mean Difference (IV, Fixed, 95% CI)

‐22.77 [‐25.32, ‐20.22]

2.3 HDL cholesterol RCTs Show forest plot

2

200

Mean Difference (IV, Fixed, 95% CI)

6.25 [3.32, 9.19]

2.4 Triglycerides RCTs Show forest plot

2

200

Mean Difference (IV, Fixed, 95% CI)

‐24.63 [‐33.45, ‐15.80]

2.5 LDL‐cholesterol non‐RCTs Show forest plot

33

3594

Mean Difference (IV, Random, 95% CI)

‐37.97 [‐39.53, ‐36.41]

2.6 Total cholesterol non‐RCTs Show forest plot

29

2536

Mean Difference (IV, Fixed, 95% CI)

‐27.36 [‐27.77, ‐26.96]

2.7 HDL‐cholesterol non‐RCTs Show forest plot

28

1996

Mean Difference (IV, Random, 95% CI)

3.98 [2.40, 5.55]

2.8 Triglycerides non‐RCTs Show forest plot

24

1835

Mean Difference (IV, Fixed, 95% CI)

‐16.66 [‐18.00, ‐15.31]

2.9 WDAE Show forest plot

2

Risk Ratio (IV, Fixed, 95% CI)

Totals not selected

Figuras y tablas -
Comparison 2. 2 mg vs control
Comparison 3. 4 mg vs control

Outcome or subgroup title

No. of studies

No. of participants

Statistical method

Effect size

3.1 LDL‐cholesterol RCTs Show forest plot

4

315

Mean Difference (IV, Fixed, 95% CI)

‐39.97 [‐42.86, ‐37.08]

3.2 Total cholesterol RCTs Show forest plot

4

315

Mean Difference (IV, Random, 95% CI)

‐28.09 [‐32.73, ‐23.46]

3.3 HDL cholesterol RCTs Show forest plot

3

264

Mean Difference (IV, Fixed, 95% CI)

6.65 [3.57, 9.73]

3.4 Triglycerides RCTs Show forest plot

3

264

Mean Difference (IV, Fixed, 95% CI)

‐24.81 [‐32.20, ‐17.41]

3.5 LDL‐cholesterol non‐RCTs Show forest plot

3

154

Mean Difference (IV, Fixed, 95% CI)

‐46.39 [‐48.54, ‐44.24]

3.6 Total cholesterol non‐RCTs Show forest plot

3

162

Mean Difference (IV, Fixed, 95% CI)

‐32.28 [‐33.95, ‐30.60]

3.7 HDL‐cholesterol non‐RCTs Show forest plot

4

319

Mean Difference (IV, Random, 95% CI)

6.69 [‐1.04, 14.43]

3.8 Triglycerides non‐RCTs Show forest plot

3

160

Mean Difference (IV, Fixed, 95% CI)

‐12.00 [‐18.87, ‐5.14]

3.9 WDAE Show forest plot

3

Risk Ratio (IV, Fixed, 95% CI)

Totals not selected

Figuras y tablas -
Comparison 3. 4 mg vs control
Comparison 4. 8 mg vs control

Outcome or subgroup title

No. of studies

No. of participants

Statistical method

Effect size

4.1 LDL cholesterol RCTs Show forest plot

2

256

Mean Difference (IV, Random, 95% CI)

‐48.96 [‐54.93, ‐43.00]

4.2 Total cholesterol RCTs Show forest plot

1

100

Mean Difference (IV, Fixed, 95% CI)

‐37.00 [‐41.46, ‐32.54]

4.3 HDL cholesterol RCTs Show forest plot

1

100

Mean Difference (IV, Fixed, 95% CI)

6.00 [0.44, 11.56]

4.4 Triglycerides RCTs Show forest plot

1

100

Mean Difference (IV, Fixed, 95% CI)

‐32.90 [‐45.17, ‐20.63]

Figuras y tablas -
Comparison 4. 8 mg vs control
Comparison 5. 16 mg vs control

Outcome or subgroup title

No. of studies

No. of participants

Statistical method

Effect size

5.1 LDL cholesterol RCTs Show forest plot

1

156

Mean Difference (IV, Fixed, 95% CI)

‐54.50 [‐59.47, ‐49.53]

Figuras y tablas -
Comparison 5. 16 mg vs control
Comparison 6. All doses of pitavastatin vs placebo

Outcome or subgroup title

No. of studies

No. of participants

Statistical method

Effect size

6.1 WDAE Show forest plot

3

371

Risk Ratio (IV, Fixed, 95% CI)

1.35 [0.15, 12.04]

Figuras y tablas -
Comparison 6. All doses of pitavastatin vs placebo