Fluvastatina para la disminución de los lípidos
Resumen
Antecedentes
Se considera que la fluvastatina es la estatina menos potente en el mercado; sin embargo, se desconoce la magnitud del efecto relacionada con la dosis de la fluvastatina sobre los lípidos en sangre.
Objetivos
Objetivo primario
Cuantificar los efectos de diversas dosis de fluvastatina sobre el colesterol total sérico, el colesterol de lipoproteínas de baja densidad (LDL, por sus siglas en inglés), el colesterol de lipoproteínas de alta densidad (HDL, por sus siglas en inglés) y los triglicéridos en participantes con y sin evidencia de enfermedad cardiovascular.
Objetivos secundarios
Cuantificar la variabilidad del efecto de diversas dosis de fluvastatina.
Cuantificar los retiros debido a efectos adversos (RDEA) en los ensayos aleatorios controlados con placebo.
Métodos de búsqueda
El especialista en información del Grupo Cochrane de Hipertensión (Cochrane Hypertension Group) buscó ensayos controlados aleatorios en las siguientes bases de datos hasta febrero de 2017: Registro Cochrane Central de Ensayos Controlados (Cochrane Central Register of Controlled Trials) (CENTRAL) (2017, número 1), MEDLINE (1946 hasta febrero, semana 2, 2017), MEDLINE In‐Process, MEDLINE Epub Ahead of Print, Embase (1974 hasta febrero, semana 2, 2017), la World Health Organization International Clinical Trials Registry Platform, CDSR, DARE, Epistemonikos y ClinicalTrials.gov. También se contactó con los autores de artículos pertinentes con respecto a otros trabajos publicados y no publicados. No se aplicaron restricciones de idioma.
Criterios de selección
Ensayos aleatorios controlados con placebo y ensayos no controlados tipo antes y después que evaluaron la dosis‐respuesta de diferentes dosis fijas de fluvastatina sobre los lípidos en sangre durante tres a 12 semanas en participantes de cualquier edad con y sin evidencia de enfermedad cardiovascular.
Obtención y análisis de los datos
Dos autores de la revisión evaluaron de forma independiente los criterios de elegibilidad para los estudios a incluir y extrajeron los datos. Los datos de los ensayos controlados con placebo y los ensayos no controlados tipo antes y después se introdujeron en Review Manager 5 como datos continuos y de la varianza inversa genérica, respectivamente. Se obtuvo información de los ensayos controlados con placebo acerca de los retiros debido a efectos adversos. Todos los ensayos se evaluaron mediante la herramienta "riesgo de sesgo" en las categorías de generación de la secuencia, ocultación de la asignación, cegamiento, datos incompletos de los resultado, informe selectivo y otros sesgos potenciales.
Resultados principales
Ciento cuarenta y cinco ensayos (36 controlados con placebo y 109 tipo antes y después) evaluaron la eficacia relacionada con la dosis de fluvastatina en 18 846 participantes. Los participantes fueron de cualquier edad, con y sin evidencia de enfermedad cardiovascular, y los efectos de la fluvastatina se estudiaron en un período de tratamiento de tres a 12 semanas. Los datos logarítmicos de dosis‐respuesta sobre las dosis de 2,5 mg a 80 mg mostraron efectos lineales fuertes relacionados con la dosis sobre el colesterol total en sangre y el colesterol LDL y un efecto lineal débil relacionado con la dosis sobre los triglicéridos en sangre. No hubo efectos de la fluvastatina relacionados con la dosis sobre el colesterol HDL en sangre. La fluvastatina 10 mg/día a 80 mg/día redujo el colesterol LDL en el 15% al 33%, el colesterol total en el 11% al 25% y los triglicéridos en el 3% al 17,5%. Por cada aumento de la dosis al doble hubo una disminución del 6,0% (IC del 95%: 5,4 a 6,6) en el colesterol LDL en sangre, una disminución del 4,2% (IC del 95%: 3,7 a 4,8) en el colesterol total en sangre y una disminución del 4,2% (IC del 95%: 2,0 a 6,3) en los triglicéridos en sangre. La calidad de la evidencia para estos efectos se consideró alta. En comparación con la atorvastatina y la rosuvastatina, la fluvastatina fue cerca de 12 veces menos potente que la atorvastatina y 46 veces menos potente que la rosuvastatina para disminuir el colesterol LDL. Evidencia de muy baja calidad no mostró diferencias en los RDEA entre la fluvastatina y placebo en 16 de 36 de estos ensayos a corto plazo (cociente de riesgos 1,52 [IC del 95%: 0,94 a 2,45]).
Conclusiones de los autores
La fluvastatina disminuye el colesterol total en sangre, el colesterol LDL y los triglicéridos de una manera lineal dependiente de la dosis. Según el efecto sobre el colesterol LDL, la fluvastatina es 12 veces menos potente que la atorvastatina y 46 veces menos potente que la rosuvastatina. Esta revisión no brindó una buena estimación de la incidencia de efectos perjudiciales asociados con la fluvastatina debido a la corta duración de los ensayos y a la falta de información sobre los efectos adversos en el 56% de los ensayos controlados con placebo.
PICO
Resumen en términos sencillos
Fluvastatina para la disminución de los lípidos
Pregunta de la revisión
¿Cuál es el efecto de diversas dosis de fluvastatina sobre los lípidos en sangre?
Los efectos de diversas dosis de fluvastatina sobre los lípidos en sangre se cuantificaron en 145 estudios.
Antecedentes
Se considera que la fluvastatina es la estatina menos potente, pero su efecto preciso relacionado con la dosis sobre los lípidos no se conoce. Sería interesante conocer cuánta fluvastatina disminuye los lípidos en sangre en los 145 estudios recuperados.
Fecha de la búsqueda
La evidencia está actualizada hasta febrero de 2017.
Características de los estudios
Ensayos aleatorios controlados con placebo y ensayos no controlados tipo antes y después de diferentes dosis fijas de fluvastatina. Los estudios fueron de tres a 12 semanas de duración.
Los participantes podían ser de cualquier edad y sexo, con o sin evidencia de enfermedad cardiovascular.
Los 145 ensayos incluidos incorporaron 18 846 participantes.
Resultados clave
La fluvastatina 10 mg/día a 80 mg/día redujo el colesterol LDL en el 15% al 33%. Hubo efectos lineales fuerte relacionados con la dosis sobre el colesterol total en sangre y el colesterol LDL, y un efecto lineal débil relacionado con la dosis sobre los triglicéridos en sangre. No hubo efectos de la fluvastatina relacionados con la dosis sobre el colesterol HDL en sangre.
Según el efecto sobre el colesterol LDL, la fluvastatina es 12 veces menos potente que la atorvastatina y 46 veces menos potente que la rosuvastatina.
De los 36 ensayos controlados con placebo, solo 16 informaron los retiros debido a efectos adversos (RDEA). Los RDEA fueron mayores, con un cociente de riesgos 1,52 (intervalo de confianza [IC] del 95%: 0,94 a 2,45), lo que demuestra incertidumbre, pero también la posibilidad de un aumento de los efectos adversos.
Calidad de la evidencia
La calidad de la evidencia fue alta para los niveles de lípidos. Para los RDEA la calidad de la evidencia fue muy baja porque 20 (55,6%) de 36 ensayos controlados con placebo no informaron los RDEA.
Conclusiones de los autores
Summary of findings
| LDL cholesterol lowering efficacy of fluvastatin | ||||||
| Patient or population: participants with normal or abnormal lipid profiles Settings: ambulatory care Intervention: fluvastatin Comparison: LDL cholesterol percentage change from baseline for all trials | ||||||
| Outcomes | Anticipated absolute effects mmol/L (95%CI) | Percent reduction % | No of Participants | Quality of the evidence | Comments | |
| Before exposure to fluvastatin1 | After exposure to fluvastatin | |||||
| LDL‐cholesterol fluvastatin 10 mg/day | 4.81 (4.44 to 5.17) | 4.08 (3.98 to 4.16) | 15.2 (17.1 to 13.4) | 595 | ⊕⊕⊕⊕ | Effect predicted from log dose‐response equation is 14.8%. Randomised and before and after design not different P = 0.94. |
| LDL‐cholesterol fluvastatin 20 mg/day | 4.87 (4.54 to 5.21) | 3.90 (3.88 to 3.91) | 20.0 (19.7 to 20.3) | 9010 | ⊕⊕⊕⊕ | Effect predicted from log dose‐response equation is 20.8%. Randomised and before and after design not different P = 0.16. |
| LDL‐cholesterol fluvastatin 40 mg/day | 4.74 (4.41 to 5.06) | 3.51 (3.48 to 3.54) | 25.9 (25.3 to 26.5) | 3658 | ⊕⊕⊕⊕ | Effect predicted from log dose‐response equation is 26.8%. Randomised and before and after design not different P = 0.58. |
| LDL‐cholesterol fluvastatin 80 mg/day | 4.80 (4.47 to 5.13) | 3.13 (3.10 to 3.15) | 34.9 (35.5 to 34.3) | 4928 | ⊕⊕⊕⊕ | Effect predicted from log dose‐response equation is 32.8%. Randomised and before and after design not different P = 0.07. |
| CI: Confidence interval | ||||||
| GRADE Working Group grades of evidence | ||||||
| 1. Mean baseline values. | ||||||
| Total cholesterol lowering efficacy of fluvastatin | ||||||
| Patient or population: participants with normal or abnormal lipid profiles Settings: ambulatory care Intervention: fluvastatin Comparison: Total cholesterol percentage change from baseline for all trials | ||||||
| Outcomes | Anticipated absolute effects mmol/L (95%CI) | Percent reduction % | No of Participants | Quality of the evidence | Comments | |
| Before exposure to fluvastatin1 | After exposure to fluvastatin | |||||
| Total cholesterol fluvastatin 10 mg/day | 6.90 (6.47 to 7.33) | 6.16 (6.02 to 6.30) | 10.7 (12.7 to 8.6) | 287 | ⊕⊕⊕⊕ | Effect predicted from log dose‐response equation is 10.9%. Randomised and before and after design not different P = 0.86. |
| Total cholesterol fluvastatin 20 mg/day | 6.99 (6.61 to 7.37) | 5.96 (5.94 to 5.98) | 14.8 (15.1 to 14.5) | 6309 | ⊕⊕⊕⊕ | Effect predicted from log dose‐response equation is 15.2%. Randomised versus before and after design borderline different P = 0.044. |
| Total cholesterol fluvastatin 40 mg/day | 6.91 (6.54 to 7.27) | 5.60 (5.57 to 5.64) | 18.9 (19.3 to 18.4) | 2966 | ⊕⊕⊕⊕ | Effect predicted from log dose‐response equation is 19.4%. Randomised and before and after design not different P = 0.106. |
| Total cholesterol fluvastatin 80 mg/day | 6.97 (6.62, 7.32) | 5.24 (5.12 to 5.27) | 24.9 (25.5 to 24.4) | 3943 | ⊕⊕⊕⊕ | Effect predicted from log dose‐response equation is 23.6%. Randomised and before and after design not different P = 0.595. |
| CI: Confidence interval | ||||||
| GRADE Working Group grades of evidence | ||||||
| 1. Mean baseline values. | ||||||
| Triglyceride lowering efficacy of fluvastatin | ||||||
| Patient or population: participants with normal or abnormal lipid profiles Settings: ambulatory care Intervention: fluvastatin Comparison: Triglyceride percentage change from baseline for all trials | ||||||
| Outcomes | Anticipated absolute effects mmol/L (95%CI) | Percent Reduction % | No of Participants | Quality of the evidence | Comments | |
| Before exposure to fluvastatin1 | After exposure to fluvastatin | |||||
| Triglycerides fluvastatin 10 mg/day | 1.93 (1.63 to 2.22) | 1.87 (1.73 to 2.01) | 3.0 (10.1 to ‐4.2) | 259 | ⊕⊕⊕⊕ | Effect predicted from log dose‐response equation is 5.2%. Only RCT data. |
| Triglycerides fluvastatin 20 mg/day | 1.98 (1.68 to 2.28) | 1.76 (1.74 to 1.77) | 11.1 (11.8 to 10.3) | 7510 | ⊕⊕⊕⊕ | Effect predicted from log dose‐response equation is 9.4%. Randomised and before and after design not different P = 0.277. |
| Triglycerides fluvastatin 40 mg/day | 1.94 (1.70 to 2.17) | 1.72 (1.69 to 1.75) | 11.1 (12.6 to 9.6) | 2646 | ⊕⊕⊕⊕ | Effect predicted from log dose‐response equation is 13.6% Randomised and before and after design not different P = 0.186. |
| Triglycerides fluvastatin 80 mg/day | 1.92 (1.67 to 2.17) | 1.59 (1.56 to 1.62) | 17.5 (19.1 to 15.9) | 3623 | ⊕⊕⊕⊕ | Effect predicted from log dose‐response equation is 17.7% Randomised and before and after design not different P = 0.496. |
| CI: Confidence interval | ||||||
| GRADE Working Group grades of evidence | ||||||
| 1. Mean baseline values. | ||||||
| Withdrawal due to adverse events due to fluvastatin | ||||||
| Patient or population: participants with normal or abnormal lipid profiles Settings: ambulatory care Intervention: fluvastatin Comparison: WDAEs fluvastatin versus placebo | ||||||
| Outcomes | Illustrative Comparative Risks* (95%CI) | Relative effect | No of Participants | Quality of the evidence | Comments | |
| Assumed risk | Corresponding risk | |||||
| placebo | fluvastatin | |||||
| WDAEs within 3‐12 weeks | RR 1.52 (0.94 to 2.45) | 3023 | ⊕⊝⊝⊝ | only 16 out of 36 placebo controlled trials reported withdrawals due to adverse effects. | ||
| 18 per 1000 | 27 per 1000 (17 to 44) | |||||
| *The basis for the assumed risk is the measure of absolute effect with the placebo group. The corresponding risk (and its 95% confidence interval) is based on the assumed risk in the comparison group and the relative effect of the intervention (and its 95% CI). CI: Confidence interval; RR: Risk Ratio | ||||||
| GRADE Working Group grades of evidence | ||||||
| 1. Downgraded 2 levels due to high risk of selective reporting and other biases. 2. Downgraded 1 level due to wide confidence intervals. | ||||||
Antecedentes
Descripción de la afección
Las enfermedades cardiovasculares son la causa principal de muerte y discapacidad en el mundo desarrollado (Eisenberg 1998). La evidencia existente muestra una asociación débil en los adultos jóvenes entre los eventos adversos cardiovasculares y la concentración sérica de colesterol total o de colesterol de lipoproteína de baja densidad (LDL) (NCEP 1993).
El tratamiento actual recomendado para la prevención secundaria de los eventos cardiovasculares adversos, además de los cambios en la dieta y el estilo de vida, es la farmacoterapia con la clase de fármaco ampliamente conocida como "estatinas".
Descripción de la intervención
La fluvastatina es una estatina ampliamente prescrita en el mundo, y es la menos potente. La fluvastatina y las otras siete estatinas se prescriben para prevenir los eventos cardiovasculares adversos y disminuir el colesterol total y el colesterol LDL. Es importante señalar que, en los ensayos controlados aleatorios individuales (ECA) y en una revisión y metanálisis sistemático de ECA, se ha mostrado que las estatinas disminuyen la mortalidad y los eventos vasculares graves en los pacientes con vasculopatía oclusiva (CTT 2005).
De qué manera podría funcionar la intervención
Las estatinas actúan en el hígado al inhibir la enzima que limita la tasa de síntesis de colesterol, la 3‐hidroxi‐3‐metil‐glutaril‐CoA (HMG Co‐A) reductasa. Esta enzima es el primer paso de una secuencia de reacciones que dan lugar a la producción de colesterol y sus derivados, el colesterol LDL y el colesterol de lipoproteínas de muy baja densidad (VLDL, por sus siglas en inglés). La hipótesis predominante es que las estatinas disminuyen la mortalidad y la morbilidad en los pacientes con vasculopatía oclusiva al disminuir la producción de colesterol. Sin embargo, la enzima HMG Co‐A reductasa también es responsable de la producción de la coenzima Q₁₀, la vitamina D, las hormonas esteroides y muchos otros compuestos. Por lo tanto, aún es posible que los efectos beneficiosos de las estatinas se deban a una acción diferente de la disminución del colesterol, a menudo denominada efecto pleiotrópico de las estatinas (Liao 2005).
Más importante para esta revisión es el hecho de que el perfil de lípidos en sangre en ayunas que consiste en colesterol total, colesterol LDL, colesterol HDL y triglicéridos, se utiliza clínicamente para monitorizar el efecto de una estatina prescrita. Por lo tanto, el resultado de esta revisión, presentado como la disminución del porcentaje de los cinco lípidos séricos, representa el mejor marcador farmacológico disponible de la magnitud del efecto de la estatina.
Por qué es importante realizar esta revisión
Las estatinas son la clase más ampliamente prescrita de fármacos en el mundo. Está en aumento la prescripción de estatinas y las dosis de prescripción promedio. Los médicos tienen un sentido aproximado de las potencias diferentes de diversas estatinas, pero no se ha publicado una evaluación sistemática de la potencia, la pendiente de la relación dosis‐respuesta y la variabilidad del efecto de ninguna de las estatinas. Es posible que además de las diferencias en la potencia, la pendiente de la relación dosis‐respuesta o la variabilidad de la respuesta sean diferentes para diferentes estatinas. Un escaso número de revisiones sistemáticas anteriores ha evaluado los efectos de las estatinas sobre los lípidos séricos (Bandolier 2004; Edwards 2003; Law 2003; Ward 2007). Dichas revisiones han demostrado que diferentes estatinas tienen diferentes potencias en cuanto a la disminución de los lípidos, y que las dosis mayores de estatinas causan una mayor disminución de los lípidos séricos que las dosis inferiores (Kellick 1997; Schaefer 2004; Schectman 1996). Sin embargo, ninguna de estas revisiones sistemáticas ha calculado la pendiente de la relación dosis‐respuesta ni la variabilidad del efecto, y ninguna está actualizada. La revisión sistemática más exhaustiva hasta la fecha (Law 2003) tiene la limitación de que presenta los datos sobre la base de la disminución promedio de la concentración de colesterol LDL, en lugar de la disminución porcentual a partir del valor inicial. El objetivo de esta revisión sistemática es ampliar el trabajo de Law. Como la fluvastatina es la estatina menos potente, se ha elegido como el tercer fármaco a estudiar en esta clase, para complementar las revisiones publicadas sobre la eficacia de la atorvastatina para la disminución de los lípidos (Adams 2014) y la rosuvastatina (Adams 2015). Se utilizó un marcador alternativo para medir el efecto farmacológico de las estatinas, la disminución porcentual a partir del valor inicial, para describir la relación dosis‐respuesta del efecto de la fluvastatina sobre el colesterol total, el colesterol LDL, el colesterol HDL y los triglicéridos. Se planificó utilizar la metodología establecida para la atorvastatina (Adams 2014) y la rosuvastatina (Adams 2015) para estudiar los otros fármacos en la clase (cerivastatina, lovastatina, pravastatina, simvastatina y pitavastatina) en revisiones posteriores, y para comparar los resultados con la fluvastatina, la rosuvastatina y atorvastatina.
Objetivos
Objetivo primario
Cuantificar los efectos de diversas dosis de fluvastatina sobre los marcadores alternativos: colesterol total en sangre, colesterol LDL, triglicéridos y colesterol HDL en los pacientes con y sin evidencia de enfermedad cardiovascular.
Se reconoce que los resultados importantes para los pacientes son la mortalidad y la morbilidad cardiovascular, pero no es el objetivo de esta revisión sistemática. Se deseaba aprender más acerca de la farmacología de la fluvastatina al caracterizar el efecto relacionado con la dosis y la variabilidad del efecto de la fluvastatina sobre los marcadores alternativos.
Objetivo secundario
Cuantificar la variabilidad del efecto de diversas dosis de fluvastatina sobre los retiros debido a efectos adversos (RDEA).
Métodos
Criterios de inclusión de estudios para esta revisión
Tipos de estudios
Ensayos aleatorios controlados con placebo. También se incluyeron los ensayos no controlados tipo antes y después porque se ha mostrado que no hay un efecto placebo de las estatinas sobre los parámetros lipídicos. Por lo tanto, en este caso no es fundamental un control placebo (Tsang 2002). No se incluyeron los ensayos cruzados (crossover), excepto si se informaron los resultados de los brazos paralelos antes del cruzamiento.
Tipos de participantes
Los participantes podían tener cualquier edad, con y sin evidencia de enfermedad cardiovascular. Podían tener parámetros de los lípidos normales o cualquier tipo de hiperlipidemia o dislipidemia. Se aceptaron participantes con diversas afecciones concomitantes como diabetes mellitus tipo 2, hipertensión, síndrome metabólico, insuficiencia renal crónica o enfermedad cardiovascular.
Tipos de intervenciones
La fluvastatina se debe haber administrado a una dosis diaria constante en comparación con placebo, o sola durante un período de tres a 12 semanas. Se eligió esta ventana de tiempo de administración para permitir al menos tres semanas para que ocurriera un efecto de estado constante de la fluvastatina, y que fuera suficientemente corta para disminuir los abandonos de los participantes. Se incluyeron los estudios en los que la fluvastatina se administró una vez al día en la mañana o en la tarde, dos veces al día o no se especificó. Los ensayos requirieron un período inicial de lavado para la estabilización dietética de al menos tres semanas, durante el que se retiró toda la medicación anterior que modifica los lípidos. Esta fase inicial aseguró que los participantes siguieran una dieta estándar que regula los lípidos y ayudara a estabilizar los valores iniciales de los lípidos antes de comenzar el tratamiento. En los ensayos en los que los participantes recibieron fármacos o suplementos alimentarios que modificaran los lípidos antes de recibir el fármaco de prueba, no se requirieron períodos de lavado de estabilización dietética inicial.
Tipos de medida de resultado
Las dosis de fluvastatina que se prescriben de manera predominante son 10 mg/día, 20 mg/día, 40 mg/día y 80 mg/día. Debido a lo anterior, y a que la mayoría de los ensayos estudiaron estas dosis, se presentan en las tablas "Resumen de los hallazgos".
Parámetros lipídicos: Para los ensayos controlados con placebo se presenta el cambio porcentual promedio a partir del valor inicial para diferentes dosis de fluvastatina menos el cambio porcentual promedio a partir del valor inicial con placebo para cada uno de los parámetros lipídicos especificados a continuación. Para los ensayos tipo antes y después se presenta el cambio porcentual promedio a partir del valor inicial de las diferentes dosis de fluvastatina. Los datos de los ECA y de los ensayos tipo antes y después se combinaron porque para la mayoría de los datos se mostró que hubo una falta de diferencias en las diferencias de medias entre los dos tipos de estudios.
Resultados primarios
-
Colesterol LDL.
Resultados secundarios
-
Colesterol total.
-
Colesterol HDL.
-
Triglicéridos.
-
Variabilidad al final del tratamiento (desviación estándar [DE]) y coeficiente de variación de las mediciones del colesterol LDL para cada dosis de fluvastatina. Es importante conocer si la fluvastatina tiene un efecto sobre la variabilidad de las medidas de los lípidos y, fundamentalmente, comparar este efecto con los efectos de otras estatinas.
-
Los retiros debido a efectos adversos (RDEA) se limitaron a los ensayos controlados con placebo.
Métodos de búsqueda para la identificación de los estudios
Búsquedas electrónicas
The Cochrane Hypertension Information Specialist conducted systematic searches in the following databases for randomised controlled trials (RCTs) without language, publication year or publication status restrictions:
-
the Cochrane Central Register of Controlled Trials (CENTRAL) via the Cochrane Register of Studies (CRS‐Web) (searched 10 February 2017);
-
MEDLINE Ovid (1946 to February Week 2 2017), MEDLINE Ovid Epub Ahead of Print, and MEDLINE Ovid In‐Process & Other Non‐Indexed Citations (searched 10 February 2017);
-
Embase Ovid (searched 10 February 2017);
-
ClinicalTrials.gov (www.clinicaltrials.gov) searched 10 February 2017);
-
World Health Organization International Clinical Trials Registry Platform (www.who.int/trialsearch) searched 10 February 2017).
The Information Specialist modelled subject strategies for databases on the search strategy designed for MEDLINE. We present search strategies for major databases in Appendix 1.
Búsqueda de otros recursos
-
The Cochrane Hypertension Information Specialist searched the Cochrane Database of Systematic Reviews (CDSR) via Wiley, the Database of Abstracts of Reviews of Effects (DARE) via Wiley, and Epistemonikos to retrieve existing systematic reviews relevant to this systematic review, so that we could scan their reference lists for additional trials.
-
We checked the bibliographies of included studies and any relevant systematic reviews identified for further references to relevant trials.
-
We contacted experts/organisations in the field to obtain additional information on relevant trials.
-
We contacted original authors for clarification and further data if trial reports were unclear.
-
We performed an initial search of Web of Science on 4 April 2016 and omitted this database from subsequent searches, as it did not yield any unique included studies.
We included grey literature by searching other resources:
-
ProQuest Dissertations and Theses (search.proquest.com/pqdtft/);
-
Novartis (www.novartis.ca/products/en/pharmaceuticals‐az.shtml);
-
US Food and Drug Administration (www.fda.gov/);
-
European Patent Office (worldwide.espacenet.com.
Obtención y análisis de los datos
Selección de los estudios
Initial selection of trials involved retrieving and reading the titles and abstracts of each paper found from the electronic search databases or bibliographic citations. We have provided a PRISMA flow diagram (Figure 1). Two review authors (SA and SS) analysed the full‐text papers independently, to decide on the trials to be included. We resolved disagreements by recourse to a third review author (JMW). Two review authors (SA and SS) independently extracted the appropriate data from each of the included trials. If there was disagreement over a value, we reached consensus by data recalculation to determine the correct value.
Extracción y manejo de los datos
We directly extracted the mean percentage change from the data or calculated it from the baseline and endpoint values. We added the calculated data to the Data and analyses section of the review. When the calculated data differed from the given data by more than 10%, we judged the data set as not being reliable and these data were not included in the review. We extracted standard deviations (SDs) and standard errors (SEs) from the report or calculated them when possible. We entered data from placebo‐controlled and uncontrolled before and after trials into Review Manager 5 (RevMan 2014) as continuous and generic inverse variance data, respectively.
Evaluación del riesgo de sesgo de los estudios incluidos
We assessed all trials using the 'Risk of bias' tool under the categories of adequate sequence generation, allocation concealment, blinding, incomplete outcome data, selective reporting, and other potential biases. We appreciate that the first three items are inappropriate for before and after trials and that this is a limitation. However, because the lipid parameters were measured in a remote laboratory they were considered unlikely to be affected by the trial design. We produced 'Risk of bias' tables' as outlined in the Cochrane Handbook for Systematic Reviews of Interventions, Chapter 8 (Higgins 2011).
Medidas del efecto del tratamiento
We analysed the treatment effects as mean difference for each dose in the placebo‐controlled RCTs and generic inverse variance for each dose in the before and after uncontrolled trials separately. In the event that the mean effects from the two trial designs were not different, we re‐analysed all efficacy study data using the generic inverse variance to determine the overall weighted treatment effects and their 95% confidence intervals (CIs) for serum total cholesterol, LDL cholesterol, HDL cholesterol, and triglycerides.
Cuestiones relativas a la unidad de análisis
The unit of analysis is the mean values for the people completing the trial for each trial. We expected follow‐up to be reasonably high for these short‐term trials. The data however represent treatment efficacy and not real‐world effectiveness of fluvastatin on these lipid parameters.
Manejo de los datos faltantes
When data were missing, we requested them from the authors. The most common type of value that was not reported was the SD of the change.
In the case of a missing SD for the change in lipid parameters, we imputed the SD using the following hierarchy (listed from high to low preference).
-
SD calculated either from the t statistics corresponding to the exact P value reported or from the 95% CI of the mean difference between treatment groups.
-
Average weighted SD of the change from other trials in the review (Furukawa 2006).
Because it is common for the SD to be miscalculated, and in order not to overweight trials where it is inaccurately calculated and lower than expected, when SD values were less than 40% of the average weighted SDs, we used the imputed value by the method of Furukawa (Furukawa 2006).
Evaluación de la heterogeneidad
The Chi2 test to identify heterogeneity is not appropriate because it has low power when there are few studies, but has excessive power to detect clinically unimportant heterogeneity when there are many studies. The I² is a better statistic. The I² calculates between‐study variance/(between‐study variance + within‐study variance). This measures the proportion of total variation in the estimate of the treatment effect that is due to heterogeneity between studies. This statistic is also independent of the number of studies in the analysis (Higgins 2002).
Evaluación de los sesgos de notificación
We assessed publication bias using funnel plots, as outlined in the Cochrane Handbook for Systematic Reviews of Interventions, Chapter 10 (Sterne 2011).
Síntesis de los datos
We entered all placebo‐controlled studies into Review Manager 5 (RevMan 2014) as mean difference fixed‐effect model data to determine the weighted treatment effect and 95% CIs for serum total cholesterol, LDL cholesterol, HDL cholesterol, and triglycerides. We entered all uncontrolled before and after studies as generic inverse variance fixed‐effect model data to determine the weighted treatment effect. If the effect in the placebo‐controlled trials was not statistically significantly different from the before and after trials, we entered all trials for each dose as generic inverse variance to determine the best overall weighted treatment effect for each dose.
If an I² was ≥50%, we used the random‐effects model to assess whether the pooled effect was statistically significant.
We recorded trial data of each study and dose in GraphPad Prism 4, to yield a weighted least squares analysis based on the inverse of the square of the standard error (SE) for each lipid parameter, to generate weighted log dose response curves. We entered the number of participants in placebo‐controlled trials who prematurely withdrew due to at least one adverse effect in Review Manager 5 (RevMan 2014) as dichotomous data for each dose and all combined doses of fluvastatin.
The relative potency of fluvastatin with respect to atorvastatin and rosuvastatin, was determined as the ratio of the milligram (mg) amount of fluvastatin to the mg amount of atorvastatin or rosuvastatin needed to produce the same specified effect. These values were calculated from the log dose response curves of fluvastatin, atorvastatin and rosuvastatin for total cholesterol, LDL cholesterol and triglycerides. The relative potencies were estimated from these dose ratios.
Data presentation ‐ ’Summary of findings’ tables
We used the Grading of Recommendations, Assessment, Development and Evaluation (GRADE) approach to assess the quality of the supporting evidence behind each estimate of treatment effect (Schünemann 2011a; Schünemann 2011b). We presented key findings of the review, including a summary of the amount of data, the magnitude of the effect size and the overall quality of the evidence, in Summary of findings table 1. We preselected the following outcomes: LDL cholesterol lowering efficacy of fluvastatin (by dose), and WDAEs.
Análisis de subgrupos e investigación de la heterogeneidad
The main subgroup analyses are the different doses of fluvastatin. We assessed heterogeneity using I² (Higgins 2002). If the I² was ≥ 50%, we attempted to identify possible causes for this by carrying out a number of planned subgroup analyses, provided there were sufficient numbers of trials (see below).
We analysed subgroups based on the following factors.
-
Placebo‐controlled trials versus before and after trials (described above).
-
Men versus women.
-
Morning administration time versus evening administration time.
-
Novartis funded versus non‐Novartis funded trials.
Análisis de sensibilidad
We conducted sensitivity analyses to assess the effect of different co morbidities, such as familial hyperlipidaemia, on the treatment effect. We compared the treatment effects as generic inverse variance between trials whose participants were reported to have type IIa or familial hypercholesterolaemia versus trials whose participants were not reported to have genetic hypercholesterolaemia. Trials were not included in the comparison if the participants had both familial and non‐familial hypercholesterolaemia. We conducted sensitivity analyses to assess the effect of different methods of dosing, such as twice daily versus single dose, on the treatment effect.
Results
Description of studies
This review included 145 trials involving 18,846 people. There were 109 before and after trials, 35 randomised double‐blind placebo‐controlled trials, one randomised single‐blind placebo‐controlled trial. The number of placebo and fluvastatin participants were 2925 and 15,921, respectively. The number of male and female participants reported in 125 of the 145 trials were 9836 and 8845, respectively. Participants could be of any age. There were 13 familial hypercholesterolaemia trials and 99 non‐familial hypercholesterolaemia trials.
Results of the search
Database searching identified a total of 10,530 records. After the duplicates were removed, 8085 records remained. The number of irrelevant records was 7776. From these remaining records, 309 were obtained as full‐text articles and assessed for eligibility. The number of excluded records with reasons was 79 trials. The final number of included studies was 145. (Figure 1).
Included studies
Two hundred and twenty citations to 145 trials met the inclusion criteria and had extractable data to evaluate the dose‐related blood lipid‐lowering effect of fluvastatin. Each included study is summarised in the Characteristics of included studies table. The publication languages of the 145 included studies were 119 (82.1%) English, seven (4.8%) Japanese, six (4.1%) Russian, three (2.1%) Chinese, three (2.1%) German, three (2.1%) Polish, one (0.7%) Czech, French, Hungarian and Spanish, respectively. Of the 36 placebo‐controlled trials, 33 (91.7%) were double‐blind, one (2.8%) was single‐blind, and two (5.6%) were open‐label trials. Trials evaluating the lipid‐altering efficacy of fluvastatin were first published in 1994. Between 1994 and 2014, the number of available studies increased and then decreased. The year with the most available studies was 1995 (Figure 2).

Number of included studies according to publication year
The baseline mean (range) lipid parameters were as follows: total cholesterol, 7.01 mmol/L (3.88 mmol/L to 10.52 mmol/L), 271 mg/dL (150 mg/dL to 407 mg/dL); LDL‐cholesterol, 4.93 mmol/L (2.07 mmol/L to 8.00 mmol/L), 191 mg/dL (80 mg/dL to 309 mg/dL); HDL‐cholesterol 1.24 mmol/L (0.87 mmol/L to 1.77 mmol/L), 47.9 mg/dL (33.6 mg/dL to 68.4 mg/dL) and triglycerides, 2.04 mmol/L (0.8 to mmol/L 5.9 mmol/L), 181 mg/dL (71 mg/dL to 523 mg/dL). Trials were available for the dose range of 2.5 mg to 80 mg fluvastatin daily and were sufficient to generate dose‐response regression lines for total cholesterol, LDL cholesterol and triglycerides (Figure 3; Figure 4; Figure 5).
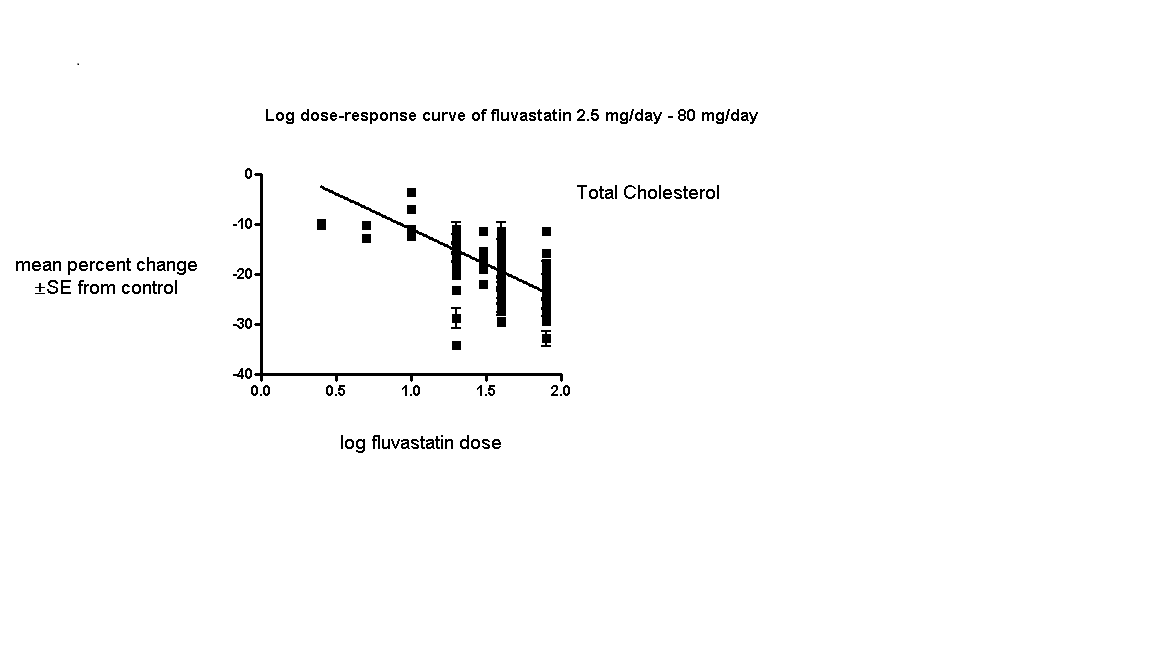
Log dose fluvastatin response curve for total cholesterol
Values represent the results of each trial for each dose comparison. The standard error bars cannot be seen because they all lie within the points

Log dose fluvastatin response curve for LDL cholesterol
Values represent the results of each trial for each dose comparison. The standard error bars cannot be seen because they all lie within the points

Log dose fluvastatin response curve for triglycerides
Values represent the results of each trial for each dose comparison. The standard error bars cannot be seen because they all lie within the points
Excluded studies
Seventy‐nine studies were excluded. Reasons for exclusion included confounding, inappropriate dosing, pooled data, attrition bias if more than 25% participants were not included in the efficacy analysis, inappropriate outcomes such as median percentage change from baseline or absolute change from baseline that could not be converted to percentage change from baseline, inadequate dietary baseline stabilisation period and combined data for all cross‐over periods. Trials in which participants were receiving drugs that affect blood lipid level concentrations, for example immunosuppressants such as cyclosporine and protease inhibitors such as ritonavir and indinavir were classified as excluded trials. The reasons for excluding each trial are listed in the Characteristics of excluded studies table.
Risk of bias in included studies
Sequence generation was not applicable to the 109 before‐and‐after trials. Of the 36 randomised placebo‐controlled trials, four (11.1%) were judged to have low risk of bias for sequence generation. The others were judged unclear.
Allocation
Allocation concealment was not applicable to the 109 before‐and‐after trials. The single‐blinded trial was judged a high risk of bias for this category. Of the 35 double‐blind randomised placebo‐controlled trials, three (8.6%) were judged a low risk of bias for allocation concealment.
Blinding
We judged the risk of performance and detection bias for lipid parameters to be low for all the trials as they were done in remote laboratories and unlikely to influenced by the investigators.
There was a high risk of detection bias of withdrawals due to adverse effects (WDAEs) assessment in the two open‐label randomised placebo‐controlled trials and in the single‐blind randomised placebo‐controlled trial. Of the 33 double‐blind randomised placebo‐controlled trials, six (18.2%) were judged a low risk of detection bias for WDAEs.
Incomplete outcome data
Incomplete outcome reporting leading to attrition bias was not a problem in this review as few participants were lost to follow‐up and were balanced across the groups in the placebo‐controlled trials. Overall, 91.9% of the participants completed the treatment.
Selective reporting
Out of 145 trials, 143 (98.6%) reported the primary lipid outcome LDL‐C, thus selection bias was not a potential source of bias for this outcome.
Out of 36 placebo‐controlled trials, only 16 (44.4%) reported WDAEs. The trials that did not report could have deliberately not done so because WDAEs were increased. Therefore, selective reporting bias was judged an important source of bias for this outcome. See 'Risk of bias' tables in Characteristics of included studies, and for the overall risk of bias, see (Figure 6).

'Risk of bias' graph: Summary of overall risk of bias for the lipid parameters according to each item.
Other potential sources of bias
The main other potential source of bias was industry funding. Out of the 145 trials, 48 (33.1%) reported funding by industry, 14 (9.7%) reported no industry funding and in 83 (57.2%) trials, the source of funding was not reported. Out of 48 industry funded trials, 35 (72.9%) were funded by Novartis, marketers of fluvastatin and 13 (27.1%) were funded by other pharmaceutical companies. The Novartis funded trials might be biased in favour of fluvastatin and would be expected to overestimate the treatment effect while trials funded by rival pharmaceutical companies might be biased against fluvastatin and be expected to underestimate the treatment effect. In trials where the source of funding was not reported, bias could be for or against fluvastatin. Novartis funded versus non‐Novartis funded LDL cholesterol efficacy data were available for the doses of 10 mg/day, 20 mg/day, 40 mg/day and 80 mg/day. These data were analysed separately using the generic inverse variance fixed‐effect model in RevMan 5. The sensitivity analysis revealed that the lipid‐lowering efficacy of fluvastatin in Novartis‐funded versus non‐Novartis funded trials were not different for most doses analysed; 10 mg/day (‐16.6% versus ‐16.2%; P = 0.94), 20 mg/day (‐19.77% versus ‐18.94%; P = 0.05), 40 mg/day (‐23.25% versus ‐25.65%; P = 0.007), and 80 mg/day (‐34.80% versus ‐33.88%; P = 0.28). Assessment for publication bias was done by reviewing the funnel plots for all lipid outcomes with 10 or more trials. None of these funnel plots suggested publication bias.
The determination of lipids in the blood samples were done by laboratories not connected to the trial personnel or participants, therefore we judged the overall risk of bias to be low for both the placebo‐controlled RCTs and for the before and after design trials (see Figure 6).
Effects of interventions
See: Summary of findings for the main comparison ; Summary of findings 2 ; Summary of findings 3 ; Summary of findings 4
See: summary of findings Table for the main comparison for the main comparison LDL‐cholesterol lowering efficacy of fluvastatin for all trials.
Overall efficacy of fluvastatin
Values from all data describing the efficacy of fluvastatin to lower the lipid parameters from placebo and before and after trials from the Data and analyses section were entered as generic inverse variance data separately into GraphPad Prism 4 to yield log dose‐response curves for placebo and before and after trials. To compare slope results of placebo‐controlled versus before and after trials, t‐tests from the formula t = (Placebo Slope‐Before and After Slope)/SQRT(SE2placebo slope+SE2before and after slope) were performed from the slopes and standard errors of the curves for total cholesterol, LDL cholesterol, HDL cholesterol and triglycerides. The results showed that for most lipid parameters there were no differences between placebo‐controlled trials and before and after trials for total cholesterol P = 0.118, LDL cholesterol P = 0.0077, HDL cholesterol P = 0.115 and triglycerides P = 0.624. This demonstrates that the two trial designs provide similar estimates of the lipid‐lowering efficacy of fluvastatin except for LDL cholesterol.
In addition, two‐tailed one sample t‐tests were performed from the placebo‐controlled trials to test for the difference between placebo mean effects and zero.The results of these tests demonstrated the placebo means were not different from zero except for the triglycerides: total cholesterol: 0.61 (95% CI ‐0.54 to 1.76) P = 0.3057, LDL cholesterol: 0.59 (95% CI ‐0.97 to 2.15) P = 0.4627, HDL cholesterol 0.68 (95%CI ‐1.116 to 2.47) P = 0.5028 and triglycerides: 5.59 (95%CI 2.51 to 8.68) P = 0.001. The triglyceride placebo mean appears to be different because blood triglyceride measurements are extremely variable and are not as reliable because there is a broad biological variability both within and among individuals. The evidence of lack of a placebo effect provided further justification for combining all the trials to determine the overall efficacy.
Validation for combining the results from the two trial designs was previously shown in the atorvastatin and rosuvastatin reviews (Adams 2014; Adams 2015).
Combining the results from the two trial designs was done by entering all data into the RevMan 5 using the generic inverse variance model outside of this review (data and analysis are not shown). The mean parameters from this analysis are summarised in Table 1.
| Fluvastatin dose (mg/day) | 2.5 | 5 | 10 | 20 | 30 | 40 | 80 |
| Total Cholesterol (mean percentage change from control) | ‐9.8 | ‐11.7 | ‐10.7 | ‐14.8 | ‐18.0 | ‐18.85 | ‐24.9 |
| 95% confidence interval | (‐12.0 to ‐7.7) | (‐14.2 to ‐9.2) | (‐12.7 to ‐8.6) | (‐15.1 to ‐14.5) | (‐19.2 to ‐16.7) | (‐19.3 to ‐18.4) | (‐25.4 to ‐24.4) |
| LDL‐Ca (mean percentage change from control) | ‐12.1 | ‐14.5 | ‐15.2 | ‐20.0 | ‐25.3 | ‐25.9 | ‐34.9 |
| 95% confidence interval | (‐14.2 to ‐10.1) | (‐16.3 to ‐12.7) | (‐17.1 to ‐13.3) | (‐20.3 to ‐19.7) | (‐26.9 to ‐23.7) | (‐26.5 to ‐25.3) | (‐35.5 to ‐34.3) |
| Triglycerides (mean percentage change from control) | ‐3.3 | ‐5.3 | ‐3.0 | ‐11.1 | ‐5.9 | ‐11.1 | ‐17.5 |
| 95% confidence interval | (‐14.6 to 8.0) | (‐13.1 to 2.5) | (‐10.1 to 4.2) | (‐11.8 to ‐10.3) | (‐20.1 to 8.3) | (‐12.6 to ‐9.6) | (‐19.1 to ‐15.9) |
aLDL‐C: low‐density lipoprotein cholesterol
Primary Outcome: LDL cholesterol
In total 143/145 (98.6%) trials and 18,606/18,846 (97%) participants contributed to the LDL cholesterol data analysis.
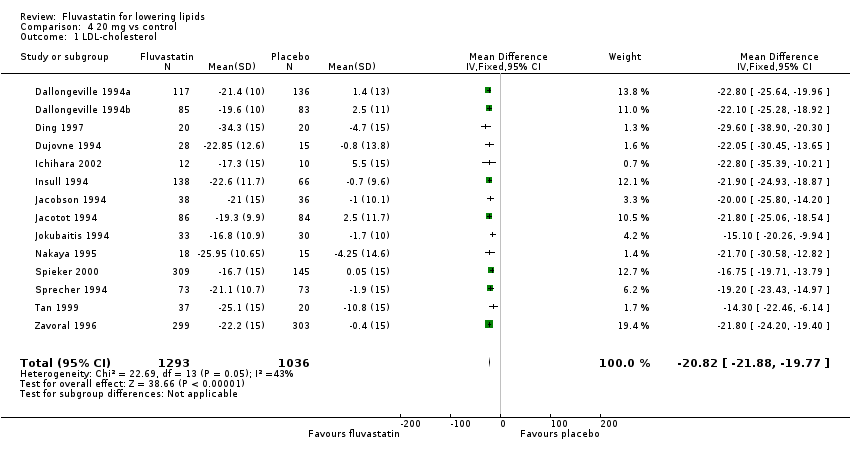
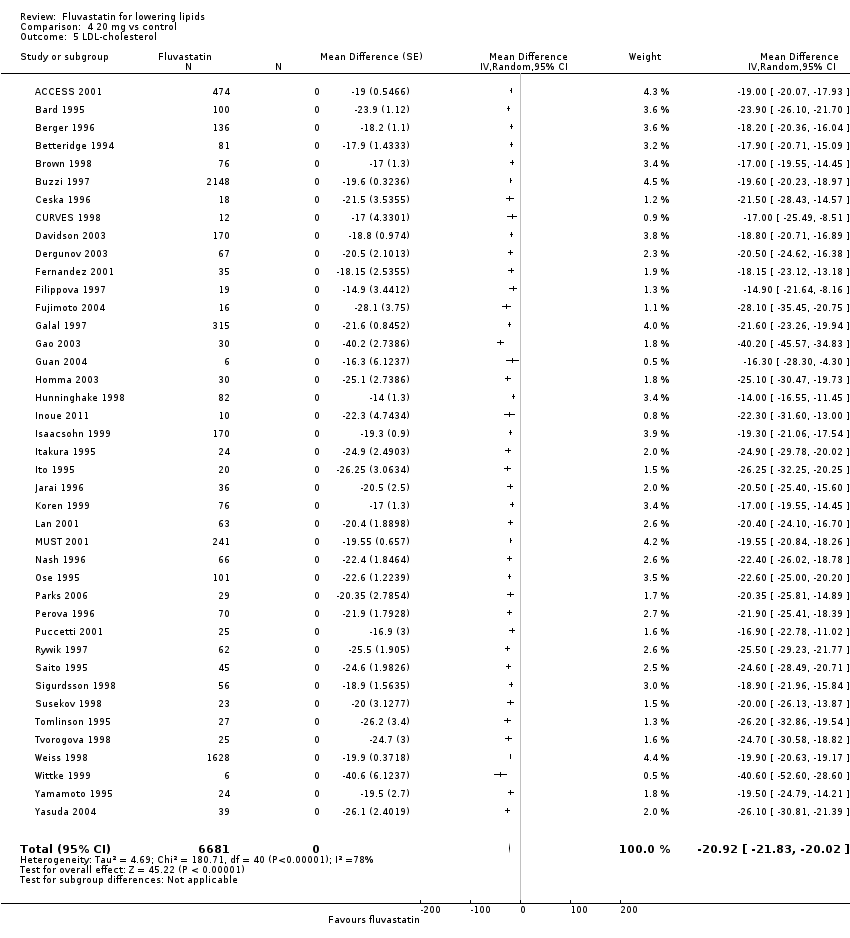
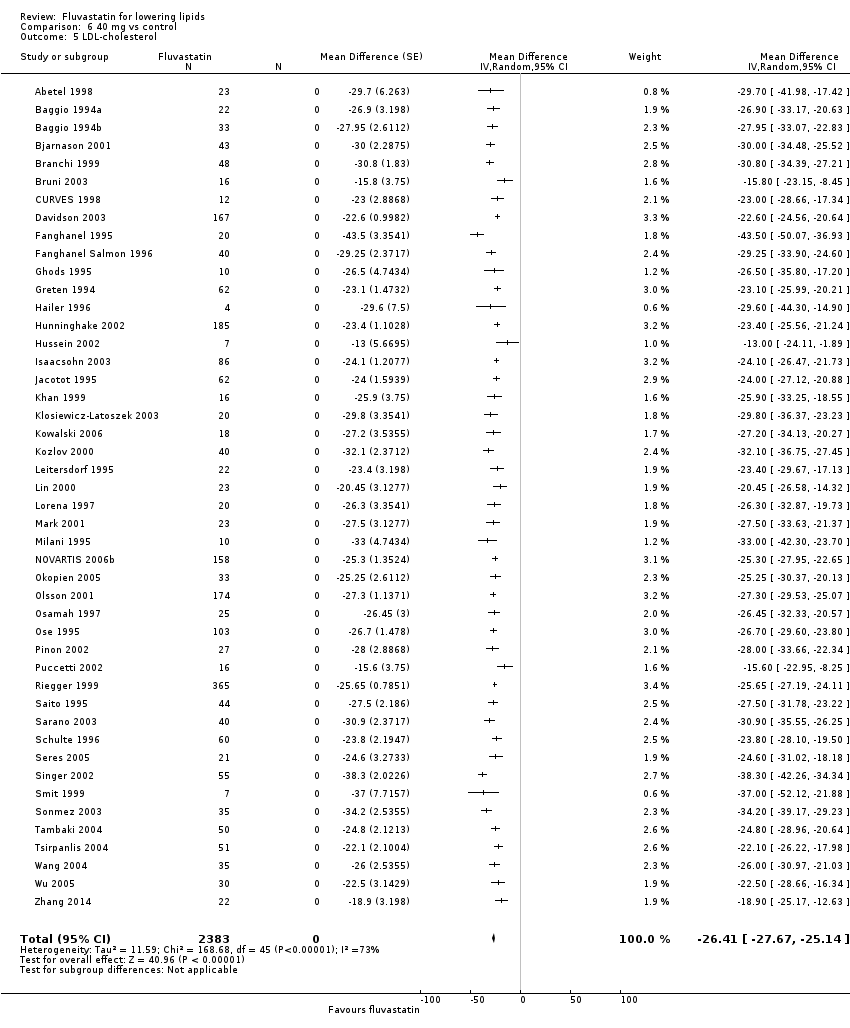
The effect of different doses of fluvastatin on LDL cholesterol are shown in the Data and analyses section (Analysis 1.1; Analysis 2.1; Analysis 2.2; Analysis 3.1; Analysis 4.1; Analysis 4.5; Analysis 5.1; Analysis 6.1; Analysis 6.5; Analysis 7.1; Analysis 7.5). The analysis for LDL cholesterol yielded the log dose‐response straight‐line equation, y = ‐19.98 log(x) + 5.181. This equation provides the best estimate of the mean reductions in blood LDL‐cholesterol from baseline for fluvastatin doses ranging from 2.5 mg/day to 80 mg/day as it uses all the available data. Using this formula, the calculated reductions in total blood LDL‐cholesterol for doses of 2.5 mg per day to 80 mg per day ranged from 2.8% to 32.8%. For every two‐fold dose increase there was a 6.01% (95% CI 5.43 to 6.60) percentage decrease in blood LDL cholesterol (Figure 4).
Secondary Outcome: Total cholesterol
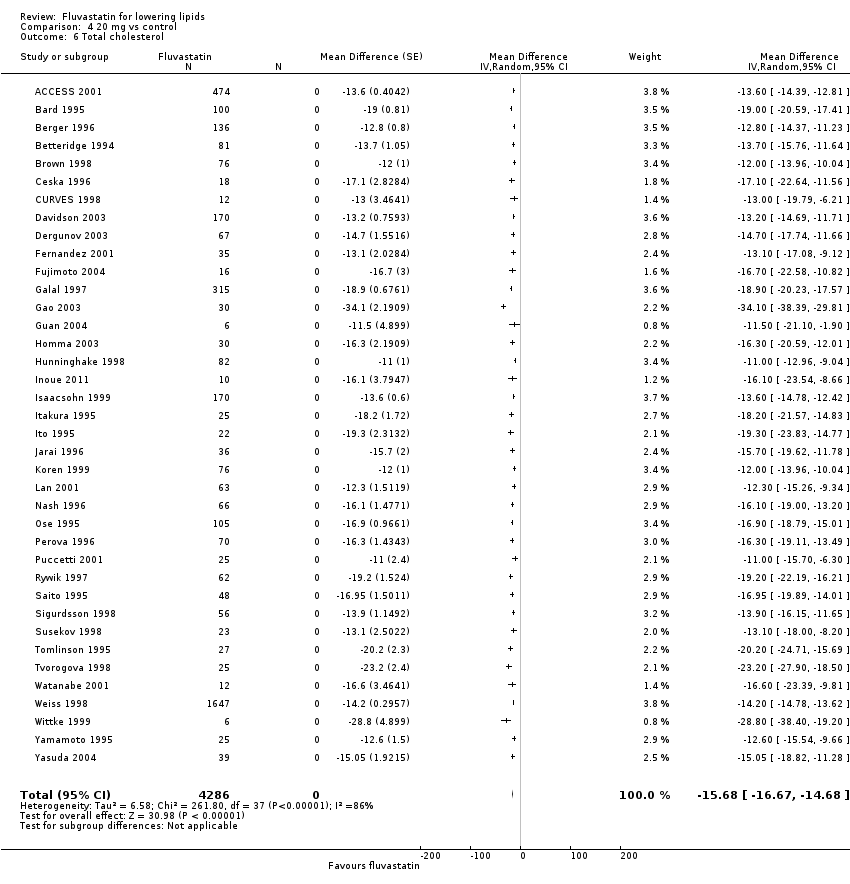
In total 131/145 (90.3%) trials and 13,797/18,846 (73.2%) participants contributed to the total cholesterol data analysis.
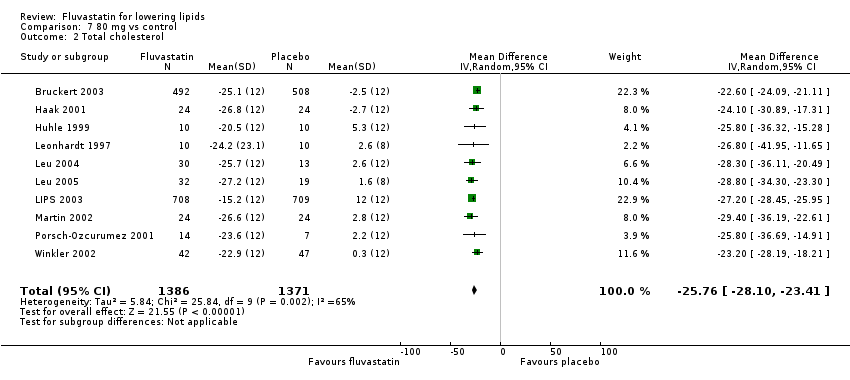
The effect of different doses of fluvastatin on total cholesterol are shown in the Data and analyses section (Analysis 3.2; Analysis 4.2; Analysis 4.6; Analysis 5.2; Analysis 6.2; Analysis 6.6; Analysis 7.2; Analysis 7.6). The analysis for total cholesterol yielded the log dose‐response straight‐line equation, y = ‐14.08 log(x) + 3.155. This equation provides the best estimate of the mean reductions in blood total cholesterol from baseline for fluvastatin doses ranging from 2.5 mg/day to 80 mg/day as it uses all the available data. Using this formula, the calculated reductions in total blood cholesterol for doses of 2.5 mg per day to 80 mg per day ranged from 2.45% to 23.6%. For every two‐fold dose increase there was a 4.24% (95% CI 3.68 to 4.8) percentage decrease in blood total cholesterol (Figure 3).
Secondary Outcome: HDL cholesterol
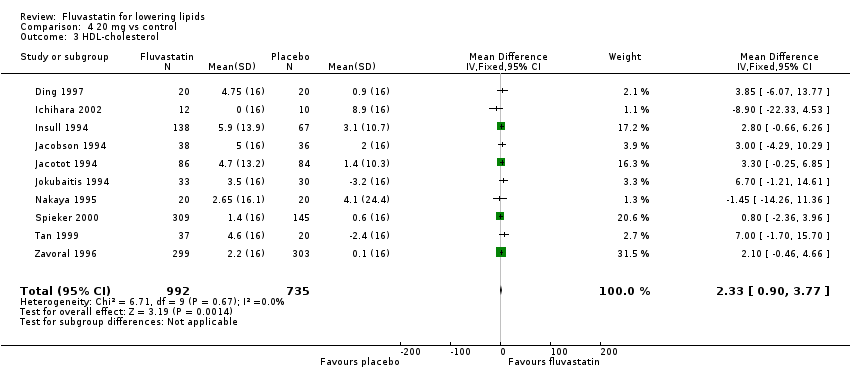
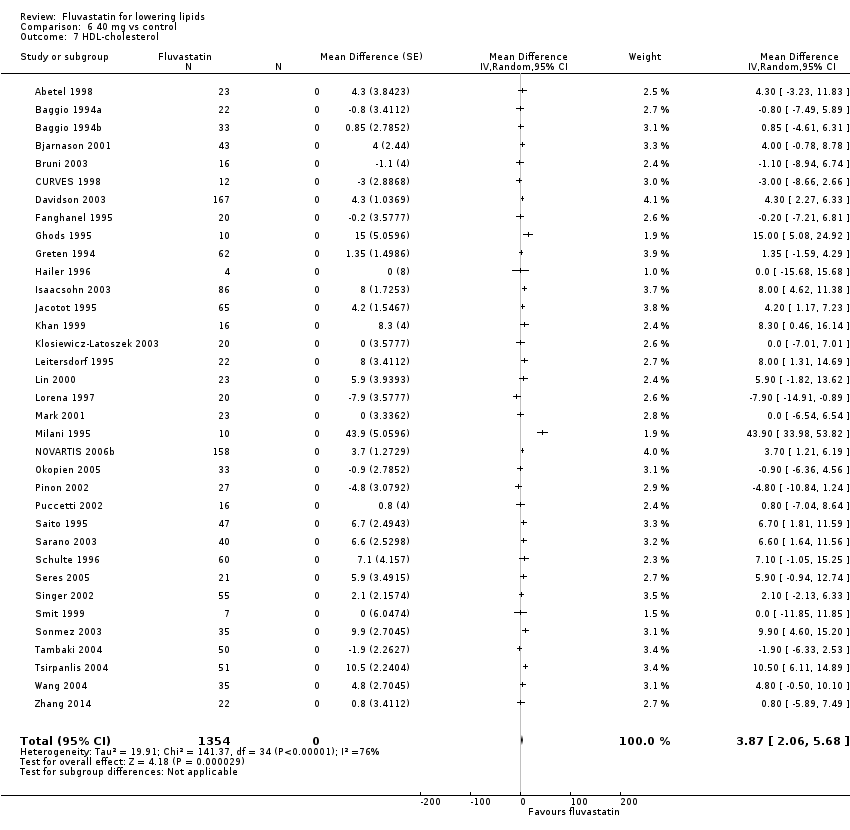
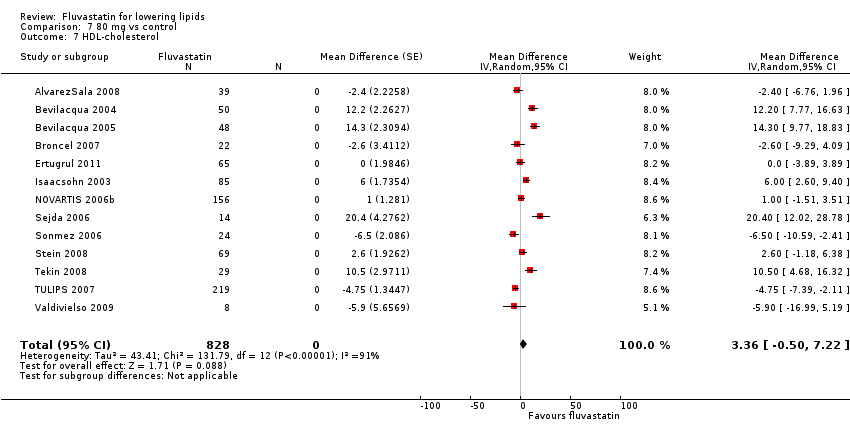
The GraphPad Prism 4 analysis showed that fluvastatin doses ranging from 2.5 mg/day to 80 mg/day had no dose‐related effect on blood HDL cholesterol. All doses of fluvastatin caused a small increase in HDL cholesterol. When all trials and doses were pooled using generic inverse variance the magnitude of the increase was 3.7% (95% CI 3.4 to 4.0).
Secondary Outcome: Triglycerides
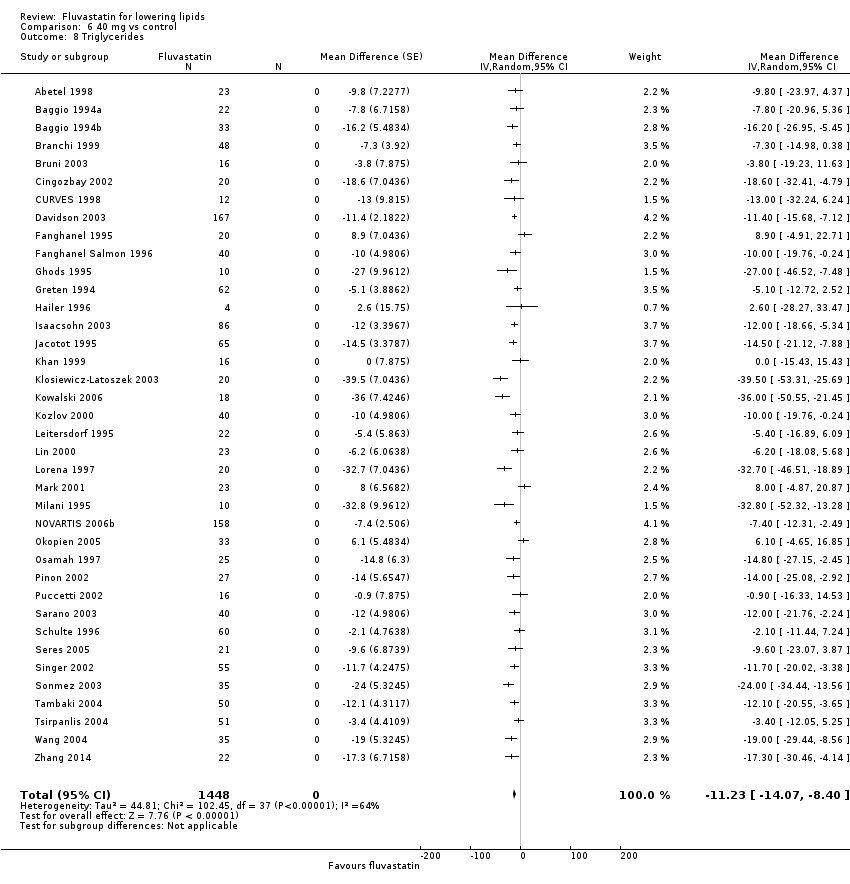
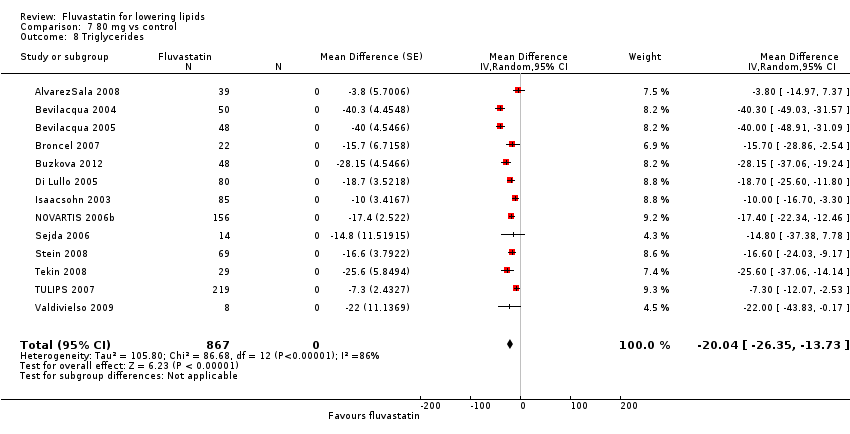
In total 112/145 (77.2%) trials and 14,324/18,846 (76%) participants contributed to the triglyceride data analysis. The effect of different doses of fluvastatin on triglycerides are shown in the Data and analyses section (Analysis 3.4; Analysis 4.4; Analysis 4.8; Analysis 6.4; Analysis 6.8; Analysis 7.4; Analysis 7.8). The analysis for triglycerides yielded the log dose‐response straight‐line equation, y = ‐13.83 log(x) + 8.602. This equation provides the best estimate of the mean reductions in blood triglycerides from baseline for fluvastatin doses ranging from 2.5 mg/day to 80 mg/day as it uses all the available data. Using this formula, the calculated reductions in total blood triglycerides for doses of 5 mg per day to 80 mg per day ranged from 1.1% to 17.7%. For every two‐fold dose increase there was a 4.16% (95% CI 1.98 to 6.34) percentage decrease in blood triglycerides (Figure 5).
Secondary Outcome: End of treatment variability
End‐of‐treatment variabilities of fluvastatin and placebo were compared to determine the effect of fluvastatin on variability of blood lipids when expressed as a co‐efficient of variation. Compared with placebo, fluvastatin (all doses) increased the co‐efficient of variation of blood LDL cholesterol (24.75 versus 30.1; P = 0.03 N = 55). Fluvastatin did not significantly affect the end‐of‐treatment variabilities of total cholesterol, HDL‐cholesterol and triglycerides.
Secondary Outcome: Withdrawal data
Sixteen (44.4%) of the 36 placebo‐controlled trials reported WDAEs during the three to 12 week treatment period. In seven trials, no participant discontinued treatment due to adverse effects or died during the study, therefore a risk ratio was not estimable. There was no fluvastatin dose‐response relationship for WDAEs. The effect of different doses of fluvastatin on withdrawal due to adverse effects (WDAEs) are shown in the Data and analyses section (Analysis 1.2; Analysis 2.3; Analysis 3.5; Analysis 4.9; Analysis 6.9; Analysis 7.9). WDAEs were not different between fluvastatin and placebo for any of the fluvastatin doses. The pooled estimate for all doses compared to placebo showed a risk ratio (RR) of 1.52 (95% CI 0.94 to 2.45) for WDAEs in these short‐term trials (Analysis 8.1).
Subgroup Analyses
Male versus female participant data were available for the 5 mg/day, 20 mg/day and 40 mg/day doses. These data were analysed separately for LDL‐cholesterol lowering efficacy using the generic inverse variance fixed‐effect model in RevMan 5 outside of this review. The subgroup analysis revealed that the efficacy of fluvastatin in male participants and female participants were not different. The efficacy for the 5 mg/day dose (male versus female participant) was: (‐13.9 versus ‐13.2; P = 0.79); for the 20 mg/day dose (male versus female participant) was: (‐21.83 versus ‐18.15; P = 0.21); and for the 40 mg/day dose (male versus female participant) was: (‐25.61 versus ‐27.82; P = 0.43).
A comparison of morning administration time versus evening administration time was not possible because only one trial provided appropriate data. Twice‐daily administration versus single‐dose administration were available for doses of 20 mg/day, 40 mg/day and 80 mg/day. These data were compared for LDL cholesterol lowering efficacy. The percentage reductions in twice‐daily versus single‐dose regimens showed no difference: 20 mg/day ‐20.01 (95 % CI ‐20.33 to ‐19.69) versus ‐19.99 (95 % CI ‐20.31 to ‐19.68) P = 0.965; 40 mg/day ‐25.90 (95 % CI ‐26.45 to ‐25.35) versus ‐26.07 (95 % CI ‐26.62 to ‐25.51) P = 0.670; and 80 mg/day ‐34.89 (95 % CI ‐35.45 to ‐34.33) versus ‐34.33 (95 % CI ‐34.93 to ‐33.73) P = 0.224.
Sensitivity Analyses
Familial versus non‐familial hypercholesterolaemia participant data were available for the doses 5 mg/day, 20 mg/day, 30 mg/day and 40 mg/day. These data were analysed separately for LDL cholesterol lowering efficacy using the generic inverse variance fixed‐effect model in RevMan 5. The efficacy of fluvastatin in familial patients tended to be less than in non‐familial patients: 5 mg/day ‐13.6 (95% CI ‐16.0 to ‐11.2) versus ‐15.9 (95% CI ‐20.2 to ‐11.6) P = 0.36; 20 mg/day ‐18.8 (95% CI ‐22.8 to ‐14.8) versus ‐19.8 (95% CI ‐20.2 to ‐19.4) P = 0.37; 30 mg/day ‐13.4 (95% CI ‐19.0 to ‐7.8) versus ‐26.9 (95% CI ‐30.4 to ‐23.5) P = 0.003; and 40 mg/day ‐26.2 (95% CI ‐28.1 to ‐24.4) versus ‐24.3 (95% CI ‐24.8 to ‐23.9) P = 1.00.
Discusión
Resumen de los resultados principales
La ingesta diaria de fluvastatina a largo plazo es efectiva para disminuir las concentraciones de colesterol LDL en sangre, y lo hace de una manera previsible, relacionada con la dosis. La tabla "Resumen de los hallazgos" documenta que la fluvastatina disminuye el colesterol LDL en el 15% a 10 mg/día y en el 33% a 80 mg/día (Tabla 1 Resumen de los hallazgos). Estas disminuciones moderadas reflejan una disminución de la síntesis del colesterol por el hígado e indican que la HMG CoA reductasa hepática es inhibida hasta en la tercera parte con este rango de dosis. Lo anterior tiene implicaciones significativas más allá de la circulación del colesterol LDL, ya que es sólo uno de muchos productos bioquímicos importantes que son producidos por la vía de la reductasa HMG CoA. Dichos productos, incluida la coenzima Q10, la hematina A, la vitamina D, las hormonas esteroides y muchos otros compuestos, también es probable que disminuyan en cerca de un tercio con la dosis de 80 mg de fluvastatina. Es importante reconocer que actualmente se desconocen las consecuencias a largo plazo de la disminución de estos productos.
En la sección "Datos y análisis" se puede observar que hay más ensayos y datos de los ensayos con diseño tipo antes y después que de los ensayos controlados con placebo. Para las dosis en las que hay un gran número de ensayos y participantes, se puede observar que las estimaciones del efecto de la fluvastatina sobre los parámetros lipídicos son similares con los dos diseños diferentes. Lo anterior, más la demostración de que el efecto placebo no fue diferente de cero, justificó el uso de la varianza inversa genérica y la muestra de las estimaciones combinadas en la Tabla 1. Además, todos los datos de los ensayos se entraron en GraphPad Prism 4 para calcular las líneas de regresión mostradas en la Figura 3; Figura 4 y Figura 5. Los resultados de eficacia general obtenidos de GraphPad Prism 4 proporcionan la mejor estimación del efecto del tratamiento porque se basan en una línea de regresión calculada a partir de todos los datos de todas las dosis. Las estimaciones del efecto promedio del tratamiento a partir de las líneas de regresión son similares al valor medio para todos los datos para cada dosis (ver tabla 1 Resumen de los hallazgos).
En esta revisión se estableció, mediante el análisis de regresión, que hubo una correlación entre el valor inicial y el efecto de la fluvastatina sobre el colesterol LDL cuando el efecto se expresó como cambio absoluto a partir del valor inicial (P < 0,0001). No hubo correlación entre el valor inicial y el efecto de la fluvastatina cuando el efecto se expresó como disminución porcentual a partir del valor inicial (P = 0,21). Este hallazgo apoya fuertemente el hecho de que las revisiones sistemáticas que informan el efecto de las estatinas sobre los cambios absolutos en los parámetros lipídicos son problemáticas y potencialmente engañosas.
¿Cuál es el efecto de la fluvastatina en la variabilidad al final del tratamiento?
Se compararon las variabilidades al final del tratamiento de la fluvastatina y placebo para determinar el efecto de la fluvastatina sobre la variabilidad de los lípidos en sangre cuando se expresó como un coeficiente de variación. En comparación con placebo, la fluvastatina en todas las dosis aumentó el coeficiente de variación del colesterol total y el colesterol LDL en sangre. La fluvastatina no afectó significativamente desde el punto de vista estadístico la variabilidad de las mediciones del colesterol total, el colesterol HDL ni los triglicéridos. Para aumentar el poder estadístico para responder esta pregunta se identificaron 66 ensayos controlados con placebo de revisiones de atorvastatina (Adams 2015), rosuvastatina (Adams 2014) y fluvastatina. En esta comparación, la variabilidad al final del tratamiento expresada como coeficiente de la varianza para la estatina aumentó significativamente en comparación con placebo: colesterol total (19,5 versus 15,9; p = 0,0005 N = 150) y colesterol LDL (29,0 versus 23,3; P = 0,0004 N = 171). No hubo un aumento en la variabilidad al final del tratamiento para la estatina en comparación con placebo para el colesterol HDL (25,28 versus 25,32; p = 0,977 N = 142) ni los triglicéridos (52,8 versus 51,1; P = 0,776 N = 123). La explicación más verosímil para el aumento de la variabilidad al final del tratamiento con las estatinas para el colesterol total y el colesterol LDL es que refleja cierta variabilidad individual en respuesta a la estatina que no estaría presente en los pacientes que reciben placebo.
¿La fluvastatina aumenta los retiros debido a efectos adversos?
De 36 ensayos controlados con placebo, 16 (44%) informaron retiros debido a efectos adversos (RDEA). Este análisis representó a sólo 3023 participantes, de los cuales 1759 recibieron fluvastatina y 1264 recibieron placebo. La estimación agrupada de todas las dosis proporcionó un cociente de riesgos (CR) de 1,52 (IC del 95%: 0,94 a 2,45), lo que demuestra incertidumbre, pero también la posibilidad de un aumento de los efectos adversos, incluso en estos ensayos a corto plazo. Como 20 (56%) de 36 ensayos controlados con placebo no informaron los RDEA, el riesgo de sesgo de informe selectivo de este resultado es alto y el efecto nulo puede ser un resultado de este sesgo. Además, este análisis estuvo limitado a los ensayos de tres a 12 semanas de duración, por lo que no refleja los efectos adversos de la fluvastatina que se presentan después de la ingesta por una duración más prolongada. El riesgo de sesgo de selección de los participantes también es alto en estos ensayos, ya que muchos de los participantes estudiados pudieron haber sido seleccionados porque que se sabía al inicio que toleraban las estatinas.
Compleción y aplicabilidad general de las pruebas
Esta revisión incluyó 145 ensayos con 18 846 participantes. Como tal, proporcionó evidencia consistente de los efectos de disminución de los lípidos relacionados con la dosis de la fluvastatina. Cuando se realizó la revisión no se sabía si el momento de la administración de la fluvastatina es importante en cuanto a la disminución de los lípidos. Solamente un ensayo (Scharnagl 2006) comparó la administración diurna y nocturna y no mostró diferencias. Un análisis de sensibilidad que comparó un régimen dos veces versus un régimen de dosis única tuvo datos disponibles para las dosis 20 mg/día, 40 mg/día y 80 mg/día. Las disminuciones porcentuales en los regímenes dos veces al día versus dosis única no mostraron diferencias. Por lo tanto, se justifica combinar los datos de ambos regímenes de dosis. Recientemente una revisión Cochrane ha intentado responder esta pregunta y concluyó que el efecto de disminución de los lípidos de la estatina es el mismo durante la administración diurna y nocturna (Izquiero‐Palomares 2016).
Los médicos pueden utilizar esta evidencia para calcular los efectos esperados de las dosis de fluvastatina habitualmente utilizadas en la sociedad. Es poco probable que estudios de investigación adicionales cambien estas estimaciones de forma significativa. Sin embargo, se observó una heterogeneidad significativa en muchas de las estimaciones y es posible que se debiera a diferencias en las poblaciones estudiadas (p.ej. diferencias de género o genéticas) (Thompson 2005). Para explorar lo anterior, cuando fue posible, se comparó el efecto de la fluvastatina en los hombres y las mujeres más en los pacientes con hipercolesterolemia familiar y no familiar. Un análisis de subgrupos que comparó los datos de participantes masculinos y femeninos estuvo disponible para las dosis 5 mg/día, 20 mg/día y 40 mg/día, y no se encontraron diferencias. Sin embargo, se consideró que la cantidad de datos disponibles no fue suficiente para responder si el efecto de disminución de los lípidos de la fluvastatina difirió en los hombres y las mujeres. En todo acaso, se prevería que el efecto sería mayor en las mujeres porque, en promedio, pesan menos que los hombres. Es importante que los autores informen los datos por separado por sexo y, si se hubiera hecho en todos estos ensayos, es probable que se hubiera podido responder esta pregunta importante. Los resultados de este análisis de subgrupos para la atorvastatina y para la rosuvastatina indicaron un efecto mayor en las mujeres que en los hombres: atorvastatina 10 mg/día (Adams 2015) hombres versus mujeres ‐39,2 (IC del 95%: ‐41,6 a ‐36,9) versus ‐41,8 (IC del 95%: ‐43,4 a ‐40,2) p = 0,08, y rosuvastatina 10 mg/día (Adams 2014) hombres versus mujeres 45,1 (IC del 95%: ‐47,9 a ‐42,2) versus ‐49,4 (IC del 95%: ‐51,7 a ‐47,2) P = 0,02.
Los datos de los participantes con hipercolesterolemia familiar versus no familiar estuvieron disponibles para las dosis de fluvastatina 5 mg/día, 20 mg/día, 30 mg/día y 40 mg/día. Estos datos se analizaron por separado para la eficacia en la disminución del colesterol LDL mediante el modelo de la varianza inversa genérica de efectos fijos en RevMan 5. La disminución porcentual en los pacientes con hipercolesterolemia familiar fue menor que en los pacientes con hipercolesterolemia no familiar para todas las dosis, excepto 40 mg/día (ver resultados). Estos resultados de un efecto menor en los participantes con hipercolesterolemia familiar son consistentes con lo que se encontraron para la atorvastatina (Adams 2015): atorvastatina 10 mg/día ‐34,7 (IC del 95%: ‐36,6 a ‐32,8) versus ‐36,3 (IC del 95%: ‐36,7 a ‐35,8) p = 0,12, y 20 mg/día ‐38,0 (IC del 95%: ‐39,8 a ‐36,2) versus ‐43,6 (IC del 95%: ‐44,4 a ‐42,8) P < 0,00001.
Probablemente los médicos que tratan a los pacientes con estos fármacos aprecien el efecto marcado y relativamente consistente de la fluvastatina sobre los parámetros de los lípidos demostrado en esta revisión. La capacidad de conocer si un paciente toma o no una estatina también es más probable que sea evidente para los investigadores involucrados en los ensayos aleatorios controlados con placebo de estatinas. El conocimiento de los parámetros de los lípidos casi sin duda resulta en la pérdida del cegamiento en los ECA de estatinas. La presente revisión subraya este problema e indica que se necesitan esfuerzos para prevenir esta pérdida de cegamiento en los ECA futuros de estatinas (Higgins 2011).
Se utilizaron los datos de las publicaciones de los Cholesterol Treatment Trialists (CTT) para determinar los efectos de la fluvastatina, la atorvastatina y la rosuvastatina sobre la disminución del colesterol LDL y la disminución del infarto de miocardio. En dos ECA una dosis de media de fluvastatina de 72 mg/día redujo el colesterol LDL en el 31,9% y redujo el infarto de miocardio, riesgo relativo 0,68 (IC del 95%: 0,55 a 0,85), en comparación con placebo. En cinco ECA una dosis media de atorvastatina de 26 mg/día redujo el colesterol LDL en el 44,0% y redujo el infarto de miocardio, riesgo relativo 0,67 (IC del 95%: 0,58 a 0,77), en comparación con placebo. En cuatro ECA una dosis media de rosuvastatina de 16 mg/día redujo el colesterol LDL en el 48,8% y redujo el infarto de miocardio, riesgo relativo 0,82 (IC del 95%: 0,73 a 0,93), en comparación con placebo. Por lo tanto, a pesar de disminuir el colesterol LDL en una cantidad mucho menor con fluvastatina que con atorvastatina y rosuvastatina, fluvastatina redujo el infarto de miocardio en una cantidad similar a la atorvastatina y en un mayor grado que la rosuvastatina. Fluvastatina 72 mg es equivalente a cerca de 6 mg de atorvastatina y cerca de 1,6 mg de rosuvastatina para la disminución del colesterol LDL. Estos hallazgos ponen en duda la creencia comúnmente aceptada de que el efecto de las estatinas para disminuir el infarto de miocardio se debe exclusivamente a la disminución de los lípidos. Indica sin dudas que las estatinas podrían actuar mediante algún otro mecanismo para disminuir el infarto de miocardio y se requieren más ECA directos que comparen diferentes estatinas.
Calidad de la evidencia
El resumen de todos los parámetros de "Riesgo de sesgo" de los efectos de los lípidos indica un alto riesgo de sesgo (Figura 6). Sin embargo, es probable que los resultados relacionados con los parámetros de los lípidos sean relativamente resistentes al sesgo. Si acaso, un alto riesgo de sesgo daría lugar a la sobrestimación de los efectos de disminución de los lípidos, en lugar de a una subestimación. Sin embargo, debido a la objetividad de los parámetros de los lípidos, se considera que las estimaciones de los efectos son razonablemente exactas. Este criterio está apoyado por el hecho de que los dos diseños diferentes de los ensayos, ECA controlados con placebo y ensayos tipo antes y después, produjeron resultados similares. Además, no fue posible mostrar evidencia de sesgo de financiamiento. La comparación de los ensayos financiados por Novartis, en los que sería de esperar una sobrestimación del efecto, y los ensayos no financiados por Novartis, en los que sería de esperar un sesgo hacia la subestimación del efecto de la fluvastatina, no mostró diferencias en el efecto de la fluvastatina sobre los parámetros lipídicos. Además, la revisión de los gráficos en embudo no indicó evidencia de sesgo de publicación.
El bajo riesgo de sesgo no es cierto para el resultado de efectos perjudiciales, retiros debido a efectos adversos (RDEA). Lo anterior se informó en 16 (44,4%) de los 36 ensayos controlados con placebo. Por lo tanto, hay un alto riesgo de sesgo de informe selectivo para este resultado, lo que, combinado con el alto riesgo de otros sesgos significa que no es posible tener certeza de que es correcto no haber encontrado un aumento significativo en los RDEA (Tabla 4 Resumen de los hallazgos).
Sesgos potenciales en el proceso de revisión
La combinación de ensayos controlados con placebo y ensayos tipo antes y después es una limitación de la revisión. Se ha explicado por qué el aumento del riesgo de sesgo asociado con el diseño de antes y después es menor en este caso, porque los parámetros lipídicos se midieron en un laboratorio alejado. Otra limitación de esta revisión es que muchos ensayos no informaron las desviaciones estándar de los efectos de disminución de los lípidos. Cuando fue posible, estos valores se determinaron mediante el método de (Furukawa 2006), de la estadística t correspondiente a los valores exactos de p informados o al IC del 95% de la diferencia de medias entre los grupos de tratamiento. En los ensayos en los que no se informó la desviación estándar y no fue posible calcularla, las desviaciones estándar se imputaron como el promedio de este parámetro de los ensayos en que se informó. Dicha imputación podría brindarle una ponderación mayor o menor a algunos estudios; Sin embargo, en otras revisiones se ha mostrado que no tiene un gran efecto sobre la estimación del tamaño del efecto (Heran 2008; Musini 2014). Otra limitación es que hubo pocos estudios disponibles para demostrar el efecto de disminución de los lípidos de la fluvastatina a dosis muy bajas y muy altas. La calidad de la evidencia no se disminuyó debido a la heterogeneidad del colesterol LDL porque los intervalos de confianza para las estimaciones de los resultados agrupados fueron estrechos.
Acuerdos y desacuerdos con otros estudios o revisiones
La mejor estimación de la disminución porcentual media del colesterol LDL en sangre para cualquier dosis de fluvastatina se puede calcular a partir de la ecuación logarítmica de dosis‐respuesta. Con el uso de esta ecuación y = ‐19,73 log(x) + 4,869 una dosis de fluvastatina de 40 mg/día disminuye el colesterol LDL en un promedio de 26,7%. Lo anterior está cerca del rango de la disminución del 22,0% al 26,0% del colesterol LDL en los seis ensayos comparativos del Drug Effectiveness Review Project (DERP) (Smith 2009) y de un rango de disminución del 24,8% al 29,4% del colesterol LDL en 23 ensayos controlados con placebo de (Law 2003).
Comparación del efecto con otras estatinas
El valor más alto de hacer este tipo de revisión es la capacidad de comparar la fluvastatina con otras estatinas. Actualmente es posible comparar fluvastatina con atorvastatina y rosuvastatina, que se han examinado mediante el mismo protocolo. El resultado más importante en esta revisión es que la pendiente del efecto dosis‐respuesta de la dosis para la fluvastatina sobre el LDL, el colesterol total y los triglicéridos no es diferente de las pendientes de la curva de dosis‐respuesta para la atorvastatina (Adams 2015) y la rosuvastatina (Adams 2014). Lo anterior proporciona cierta confirmación de que las tres estatinas causan la disminución de los lípidos mediante un mecanismo similar. Sin embargo, también demuestra que la fluvastatina es mucho menos potente que los otros dos fármacos: la fluvastatina es 12 veces menos potente que la atorvastatina para la disminución del colesterol LDL y 46 veces menos potente que la rosuvastatina. Lo anterior significa que 80 mg/día de fluvastatina disminuyen el colesterol LDL como promedio en el 32,7%; la dosis de atorvastatina y rosuvastatina para lograr la misma disminución del colesterol LDL es 7 mg/día y 2 mg/día, respectivamente.

Fluvastatin flow diagram
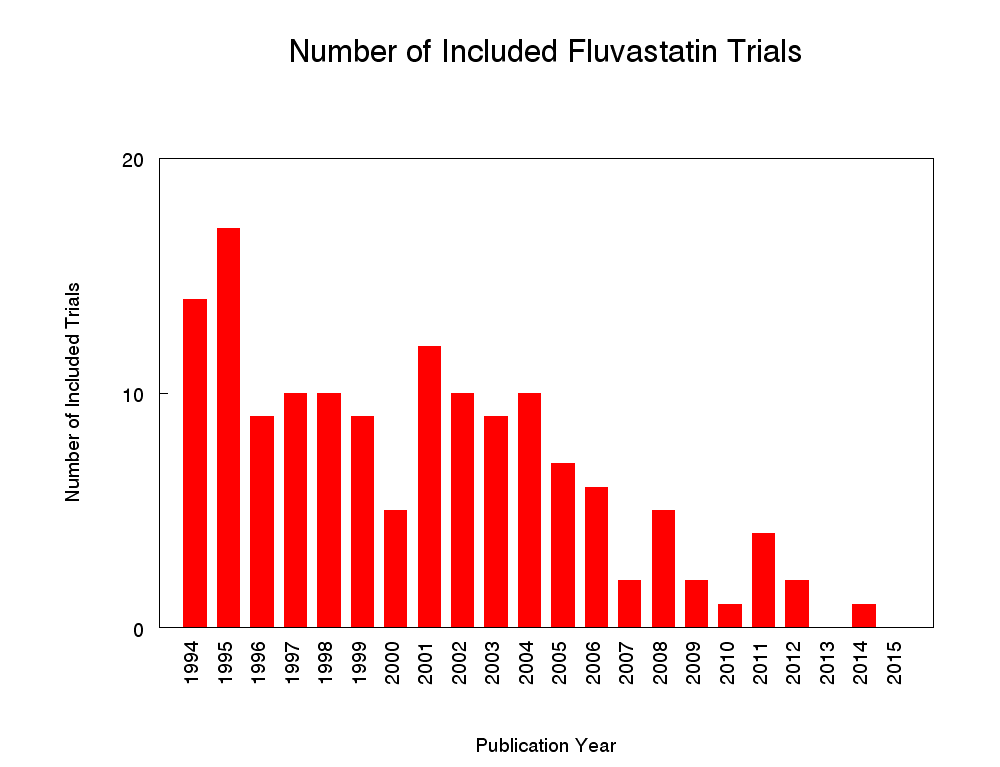
Number of included studies according to publication year

Log dose fluvastatin response curve for total cholesterol
Values represent the results of each trial for each dose comparison. The standard error bars cannot be seen because they all lie within the points

Log dose fluvastatin response curve for LDL cholesterol
Values represent the results of each trial for each dose comparison. The standard error bars cannot be seen because they all lie within the points

Log dose fluvastatin response curve for triglycerides
Values represent the results of each trial for each dose comparison. The standard error bars cannot be seen because they all lie within the points

'Risk of bias' graph: Summary of overall risk of bias for the lipid parameters according to each item.
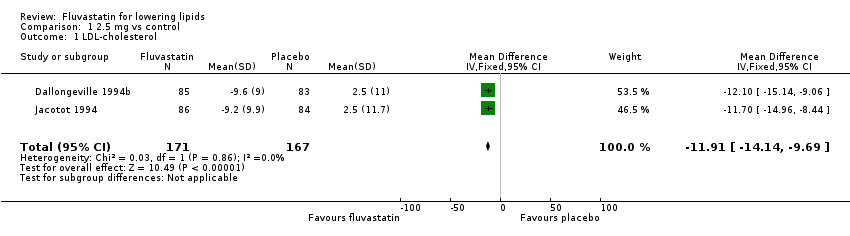
Comparison 1 2.5 mg vs control, Outcome 1 LDL‐cholesterol.
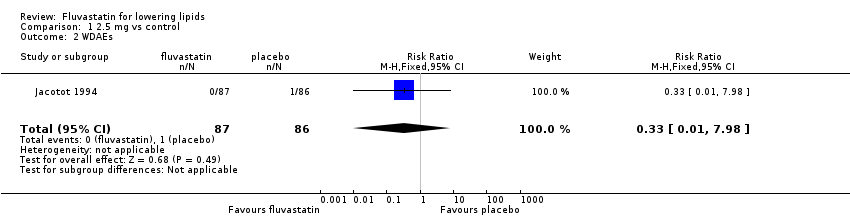
Comparison 1 2.5 mg vs control, Outcome 2 WDAEs.

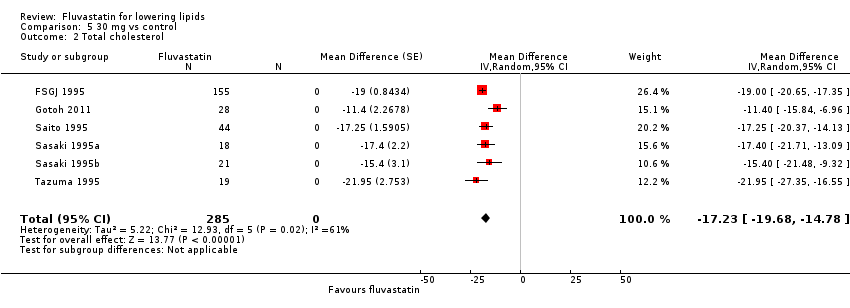
Comparison 2 5 mg vs control, Outcome 1 LDL‐cholesterol.

Comparison 2 5 mg vs control, Outcome 2 LDL‐cholesterol.

Comparison 2 5 mg vs control, Outcome 3 WDAEs.

Comparison 3 10 mg vs control, Outcome 1 LDL‐cholesterol.

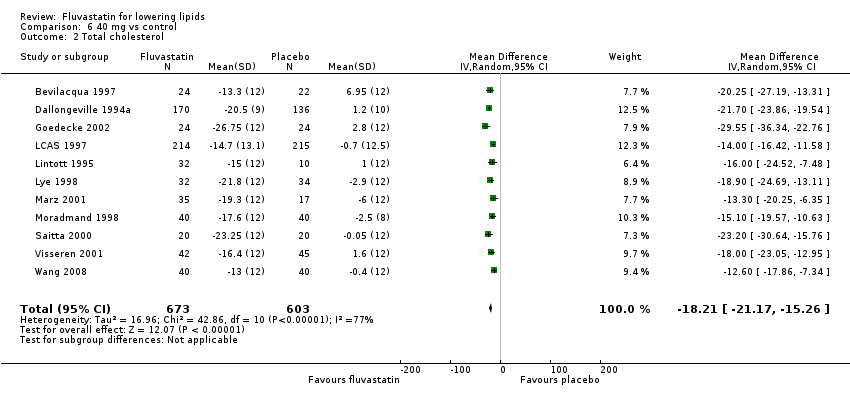
Comparison 3 10 mg vs control, Outcome 2 Total cholesterol.

Comparison 3 10 mg vs control, Outcome 3 HDL‐cholesterol.

Comparison 3 10 mg vs control, Outcome 4 Triglycerides.

Comparison 3 10 mg vs control, Outcome 5 WDAEs.
Comparison 4 20 mg vs control, Outcome 1 LDL‐cholesterol.

Comparison 4 20 mg vs control, Outcome 2 Total cholesterol.
Comparison 4 20 mg vs control, Outcome 3 HDL‐cholesterol.

Comparison 4 20 mg vs control, Outcome 4 Triglycerides.
Comparison 4 20 mg vs control, Outcome 5 LDL‐cholesterol.
Comparison 4 20 mg vs control, Outcome 6 Total cholesterol.

Comparison 4 20 mg vs control, Outcome 7 HDL‐cholesterol.

Comparison 4 20 mg vs control, Outcome 8 Triglycerides.

Comparison 4 20 mg vs control, Outcome 9 WDAE.

Comparison 5 30 mg vs control, Outcome 1 LDL‐cholesterol.
Comparison 5 30 mg vs control, Outcome 2 Total cholesterol.

Comparison 5 30 mg vs control, Outcome 3 HDL‐cholesterol.

Comparison 6 40 mg vs control, Outcome 1 LDL‐cholesterol.
Comparison 6 40 mg vs control, Outcome 2 Total cholesterol.
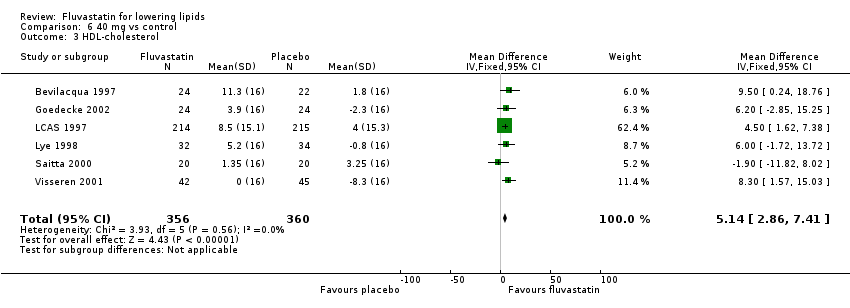
Comparison 6 40 mg vs control, Outcome 3 HDL‐cholesterol.
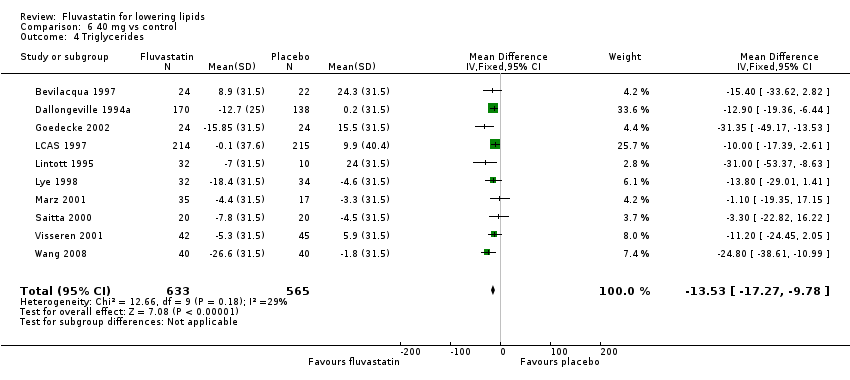
Comparison 6 40 mg vs control, Outcome 4 Triglycerides.
Comparison 6 40 mg vs control, Outcome 5 LDL‐cholesterol.

Comparison 6 40 mg vs control, Outcome 6 Total cholesterol.
Comparison 6 40 mg vs control, Outcome 7 HDL‐cholesterol.
Comparison 6 40 mg vs control, Outcome 8 Triglycerides.

Comparison 6 40 mg vs control, Outcome 9 WDAE.

Comparison 7 80 mg vs control, Outcome 1 LDL‐cholesterol.
Comparison 7 80 mg vs control, Outcome 2 Total cholesterol.

Comparison 7 80 mg vs control, Outcome 3 HDL‐cholesterol.

Comparison 7 80 mg vs control, Outcome 4 Triglycerides.

Comparison 7 80 mg vs control, Outcome 5 LDL‐cholesterol.

Comparison 7 80 mg vs control, Outcome 6 Total cholesterol.
Comparison 7 80 mg vs control, Outcome 7 HDL‐cholesterol.
Comparison 7 80 mg vs control, Outcome 8 Triglycerides.

Comparison 7 80 mg vs control, Outcome 9 WDAEs.

Comparison 8 all doses vs control, Outcome 1 WDAEs.
| LDL cholesterol lowering efficacy of fluvastatin | ||||||
| Patient or population: participants with normal or abnormal lipid profiles Settings: ambulatory care Intervention: fluvastatin Comparison: LDL cholesterol percentage change from baseline for all trials | ||||||
| Outcomes | Anticipated absolute effects mmol/L (95%CI) | Percent reduction % | No of Participants | Quality of the evidence | Comments | |
| Before exposure to fluvastatin1 | After exposure to fluvastatin | |||||
| LDL‐cholesterol fluvastatin 10 mg/day | 4.81 (4.44 to 5.17) | 4.08 (3.98 to 4.16) | 15.2 (17.1 to 13.4) | 595 | ⊕⊕⊕⊕ | Effect predicted from log dose‐response equation is 14.8%. Randomised and before and after design not different P = 0.94. |
| LDL‐cholesterol fluvastatin 20 mg/day | 4.87 (4.54 to 5.21) | 3.90 (3.88 to 3.91) | 20.0 (19.7 to 20.3) | 9010 | ⊕⊕⊕⊕ | Effect predicted from log dose‐response equation is 20.8%. Randomised and before and after design not different P = 0.16. |
| LDL‐cholesterol fluvastatin 40 mg/day | 4.74 (4.41 to 5.06) | 3.51 (3.48 to 3.54) | 25.9 (25.3 to 26.5) | 3658 | ⊕⊕⊕⊕ | Effect predicted from log dose‐response equation is 26.8%. Randomised and before and after design not different P = 0.58. |
| LDL‐cholesterol fluvastatin 80 mg/day | 4.80 (4.47 to 5.13) | 3.13 (3.10 to 3.15) | 34.9 (35.5 to 34.3) | 4928 | ⊕⊕⊕⊕ | Effect predicted from log dose‐response equation is 32.8%. Randomised and before and after design not different P = 0.07. |
| CI: Confidence interval | ||||||
| GRADE Working Group grades of evidence | ||||||
| 1. Mean baseline values. | ||||||
| Total cholesterol lowering efficacy of fluvastatin | ||||||
| Patient or population: participants with normal or abnormal lipid profiles Settings: ambulatory care Intervention: fluvastatin Comparison: Total cholesterol percentage change from baseline for all trials | ||||||
| Outcomes | Anticipated absolute effects mmol/L (95%CI) | Percent reduction % | No of Participants | Quality of the evidence | Comments | |
| Before exposure to fluvastatin1 | After exposure to fluvastatin | |||||
| Total cholesterol fluvastatin 10 mg/day | 6.90 (6.47 to 7.33) | 6.16 (6.02 to 6.30) | 10.7 (12.7 to 8.6) | 287 | ⊕⊕⊕⊕ | Effect predicted from log dose‐response equation is 10.9%. Randomised and before and after design not different P = 0.86. |
| Total cholesterol fluvastatin 20 mg/day | 6.99 (6.61 to 7.37) | 5.96 (5.94 to 5.98) | 14.8 (15.1 to 14.5) | 6309 | ⊕⊕⊕⊕ | Effect predicted from log dose‐response equation is 15.2%. Randomised versus before and after design borderline different P = 0.044. |
| Total cholesterol fluvastatin 40 mg/day | 6.91 (6.54 to 7.27) | 5.60 (5.57 to 5.64) | 18.9 (19.3 to 18.4) | 2966 | ⊕⊕⊕⊕ | Effect predicted from log dose‐response equation is 19.4%. Randomised and before and after design not different P = 0.106. |
| Total cholesterol fluvastatin 80 mg/day | 6.97 (6.62, 7.32) | 5.24 (5.12 to 5.27) | 24.9 (25.5 to 24.4) | 3943 | ⊕⊕⊕⊕ | Effect predicted from log dose‐response equation is 23.6%. Randomised and before and after design not different P = 0.595. |
| CI: Confidence interval | ||||||
| GRADE Working Group grades of evidence | ||||||
| 1. Mean baseline values. | ||||||
| Triglyceride lowering efficacy of fluvastatin | ||||||
| Patient or population: participants with normal or abnormal lipid profiles Settings: ambulatory care Intervention: fluvastatin Comparison: Triglyceride percentage change from baseline for all trials | ||||||
| Outcomes | Anticipated absolute effects mmol/L (95%CI) | Percent Reduction % | No of Participants | Quality of the evidence | Comments | |
| Before exposure to fluvastatin1 | After exposure to fluvastatin | |||||
| Triglycerides fluvastatin 10 mg/day | 1.93 (1.63 to 2.22) | 1.87 (1.73 to 2.01) | 3.0 (10.1 to ‐4.2) | 259 | ⊕⊕⊕⊕ | Effect predicted from log dose‐response equation is 5.2%. Only RCT data. |
| Triglycerides fluvastatin 20 mg/day | 1.98 (1.68 to 2.28) | 1.76 (1.74 to 1.77) | 11.1 (11.8 to 10.3) | 7510 | ⊕⊕⊕⊕ | Effect predicted from log dose‐response equation is 9.4%. Randomised and before and after design not different P = 0.277. |
| Triglycerides fluvastatin 40 mg/day | 1.94 (1.70 to 2.17) | 1.72 (1.69 to 1.75) | 11.1 (12.6 to 9.6) | 2646 | ⊕⊕⊕⊕ | Effect predicted from log dose‐response equation is 13.6% Randomised and before and after design not different P = 0.186. |
| Triglycerides fluvastatin 80 mg/day | 1.92 (1.67 to 2.17) | 1.59 (1.56 to 1.62) | 17.5 (19.1 to 15.9) | 3623 | ⊕⊕⊕⊕ | Effect predicted from log dose‐response equation is 17.7% Randomised and before and after design not different P = 0.496. |
| CI: Confidence interval | ||||||
| GRADE Working Group grades of evidence | ||||||
| 1. Mean baseline values. | ||||||
| Withdrawal due to adverse events due to fluvastatin | ||||||
| Patient or population: participants with normal or abnormal lipid profiles Settings: ambulatory care Intervention: fluvastatin Comparison: WDAEs fluvastatin versus placebo | ||||||
| Outcomes | Illustrative Comparative Risks* (95%CI) | Relative effect | No of Participants | Quality of the evidence | Comments | |
| Assumed risk | Corresponding risk | |||||
| placebo | fluvastatin | |||||
| WDAEs within 3‐12 weeks | RR 1.52 (0.94 to 2.45) | 3023 | ⊕⊝⊝⊝ | only 16 out of 36 placebo controlled trials reported withdrawals due to adverse effects. | ||
| 18 per 1000 | 27 per 1000 (17 to 44) | |||||
| *The basis for the assumed risk is the measure of absolute effect with the placebo group. The corresponding risk (and its 95% confidence interval) is based on the assumed risk in the comparison group and the relative effect of the intervention (and its 95% CI). CI: Confidence interval; RR: Risk Ratio | ||||||
| GRADE Working Group grades of evidence | ||||||
| 1. Downgraded 2 levels due to high risk of selective reporting and other biases. 2. Downgraded 1 level due to wide confidence intervals. | ||||||
| Fluvastatin dose (mg/day) | 2.5 | 5 | 10 | 20 | 30 | 40 | 80 |
| Total Cholesterol (mean percentage change from control) | ‐9.8 | ‐11.7 | ‐10.7 | ‐14.8 | ‐18.0 | ‐18.85 | ‐24.9 |
| 95% confidence interval | (‐12.0 to ‐7.7) | (‐14.2 to ‐9.2) | (‐12.7 to ‐8.6) | (‐15.1 to ‐14.5) | (‐19.2 to ‐16.7) | (‐19.3 to ‐18.4) | (‐25.4 to ‐24.4) |
| LDL‐Ca (mean percentage change from control) | ‐12.1 | ‐14.5 | ‐15.2 | ‐20.0 | ‐25.3 | ‐25.9 | ‐34.9 |
| 95% confidence interval | (‐14.2 to ‐10.1) | (‐16.3 to ‐12.7) | (‐17.1 to ‐13.3) | (‐20.3 to ‐19.7) | (‐26.9 to ‐23.7) | (‐26.5 to ‐25.3) | (‐35.5 to ‐34.3) |
| Triglycerides (mean percentage change from control) | ‐3.3 | ‐5.3 | ‐3.0 | ‐11.1 | ‐5.9 | ‐11.1 | ‐17.5 |
| 95% confidence interval | (‐14.6 to 8.0) | (‐13.1 to 2.5) | (‐10.1 to 4.2) | (‐11.8 to ‐10.3) | (‐20.1 to 8.3) | (‐12.6 to ‐9.6) | (‐19.1 to ‐15.9) |
| aLDL‐C: low‐density lipoprotein cholesterol | |||||||
| Outcome or subgroup title | No. of studies | No. of participants | Statistical method | Effect size |
| 1 LDL‐cholesterol Show forest plot | 2 | 338 | Mean Difference (IV, Fixed, 95% CI) | ‐11.91 [‐14.14, ‐9.69] |
| 2 WDAEs Show forest plot | 1 | 173 | Risk Ratio (M‐H, Fixed, 95% CI) | 0.33 [0.01, 7.98] |
| Outcome or subgroup title | No. of studies | No. of participants | Statistical method | Effect size |
| 1 LDL‐cholesterol Show forest plot | 2 | 332 | Mean Difference (IV, Fixed, 95% CI) | ‐15.76 [‐18.91, ‐12.60] |
| 2 LDL‐cholesterol Show forest plot | 2 | 91 | Mean Difference (Fixed, 95% CI) | ‐13.85 [‐16.02, ‐11.69] |
| 3 WDAEs Show forest plot | 1 | 171 | Risk Ratio (M‐H, Fixed, 95% CI) | 0.34 [0.01, 8.16] |
| Outcome or subgroup title | No. of studies | No. of participants | Statistical method | Effect size |
| 1 LDL‐cholesterol Show forest plot | 5 | 570 | Mean Difference (IV, Random, 95% CI) | ‐14.49 [‐17.95, ‐11.02] |
| 2 Total cholesterol Show forest plot | 3 | 259 | Mean Difference (IV, Random, 95% CI) | ‐8.44 [‐13.95, ‐2.93] |
| 3 HDL‐cholesterol Show forest plot | 3 | 259 | Mean Difference (IV, Fixed, 95% CI) | 1.86 [‐1.28, 5.00] |
| 4 Triglycerides Show forest plot | 3 | 259 | Mean Difference (IV, Fixed, 95% CI) | ‐2.96 [‐10.19, 4.28] |
| 5 WDAEs Show forest plot | 2 | 211 | Risk Ratio (M‐H, Fixed, 95% CI) | 0.34 [0.01, 8.16] |
| Outcome or subgroup title | No. of studies | No. of participants | Statistical method | Effect size |
| 1 LDL‐cholesterol Show forest plot | 14 | 2329 | Mean Difference (IV, Fixed, 95% CI) | ‐20.82 [‐21.88, ‐19.77] |
| 2 Total cholesterol Show forest plot | 12 | 2023 | Mean Difference (IV, Fixed, 95% CI) | ‐15.81 [‐16.75, ‐14.88] |
| 3 HDL‐cholesterol Show forest plot | 10 | 1727 | Mean Difference (IV, Fixed, 95% CI) | 2.33 [0.90, 3.77] |
| 4 Triglycerides Show forest plot | 10 | 1712 | Mean Difference (IV, Fixed, 95% CI) | ‐9.67 [‐12.61, ‐6.73] |
| 5 LDL‐cholesterol Show forest plot | 41 | 6681 | Mean Difference (Random, 95% CI) | ‐20.92 [‐21.83, ‐20.02] |
| 6 Total cholesterol Show forest plot | 38 | 4286 | Mean Difference (Random, 95% CI) | ‐15.68 [‐16.67, ‐14.68] |
| 7 HDL‐cholesterol Show forest plot | 32 | 6239 | Mean Difference (Random, 95% CI) | 5.34 [4.51, 6.17] |
| 8 Triglycerides Show forest plot | 29 | 5798 | Mean Difference (Random, 95% CI) | ‐9.15 [‐11.36, ‐6.94] |
| 9 WDAE Show forest plot | 7 | 1060 | Risk Ratio (M‐H, Random, 95% CI) | 0.87 [0.14, 5.46] |
| Outcome or subgroup title | No. of studies | No. of participants | Statistical method | Effect size |
| 1 LDL‐cholesterol Show forest plot | 7 | 336 | Mean Difference (Random, 95% CI) | ‐24.03 [‐27.72, ‐20.34] |
| 2 Total cholesterol Show forest plot | 6 | 285 | Mean Difference (Random, 95% CI) | ‐17.23 [‐19.68, ‐14.78] |
| 3 HDL‐cholesterol Show forest plot | 2 | 47 | Mean Difference (Random, 95% CI) | 7.86 [‐0.36, 16.07] |
| Outcome or subgroup title | No. of studies | No. of participants | Statistical method | Effect size |
| 1 LDL‐cholesterol Show forest plot | 11 | 1275 | Mean Difference (IV, Random, 95% CI) | ‐27.04 [‐30.69, ‐23.40] |
| 2 Total cholesterol Show forest plot | 11 | 1276 | Mean Difference (IV, Random, 95% CI) | ‐18.21 [‐21.17, ‐15.26] |
| 3 HDL‐cholesterol Show forest plot | 6 | 716 | Mean Difference (IV, Fixed, 95% CI) | 5.14 [2.86, 7.41] |
| 4 Triglycerides Show forest plot | 10 | 1198 | Mean Difference (IV, Fixed, 95% CI) | ‐13.53 [‐17.27, ‐9.78] |
| 5 LDL‐cholesterol Show forest plot | 46 | 2383 | Mean Difference (Random, 95% CI) | ‐26.41 [‐27.67, ‐25.14] |
| 6 Total cholesterol Show forest plot | 44 | 1690 | Mean Difference (Random, 95% CI) | ‐19.52 [‐20.60, ‐18.45] |
| 7 HDL‐cholesterol Show forest plot | 35 | 1354 | Mean Difference (Random, 95% CI) | 3.87 [2.06, 5.68] |
| 8 Triglycerides Show forest plot | 38 | 1448 | Mean Difference (Random, 95% CI) | ‐11.23 [‐14.07, ‐8.40] |
| 9 WDAE Show forest plot | 4 | 236 | Risk Ratio (M‐H, Fixed, 95% CI) | 3.47 [0.75, 16.11] |
| Outcome or subgroup title | No. of studies | No. of participants | Statistical method | Effect size |
| 1 LDL‐cholesterol Show forest plot | 10 | 2727 | Mean Difference (IV, Random, 95% CI) | ‐34.62 [‐38.60, ‐30.64] |
| 2 Total cholesterol Show forest plot | 10 | 2757 | Mean Difference (IV, Random, 95% CI) | ‐25.76 [‐28.10, ‐23.41] |
| 3 HDL‐cholesterol Show forest plot | 9 | 2644 | Mean Difference (IV, Random, 95% CI) | 1.06 [‐2.26, 4.38] |
| 4 Triglycerides Show forest plot | 10 | 2756 | Mean Difference (IV, Fixed, 95% CI) | ‐17.28 [‐19.63, ‐14.92] |
| 5 LDL‐cholesterol Show forest plot | 22 | 2201 | Mean Difference (Random, 95% CI) | ‐33.04 [‐35.17, ‐30.90] |
| 6 Total cholesterol Show forest plot | 17 | 1186 | Mean Difference (Random, 95% CI) | ‐23.27 [‐24.99, ‐21.55] |
| 7 HDL‐cholesterol Show forest plot | 13 | 828 | Mean Difference (Random, 95% CI) | 3.36 [‐0.50, 7.22] |
| 8 Triglycerides Show forest plot | 13 | 867 | Mean Difference (Random, 95% CI) | ‐20.04 [‐26.35, ‐13.73] |
| 9 WDAEs Show forest plot | 4 | 1430 | Risk Ratio (M‐H, Fixed, 95% CI) | 1.33 [0.71, 2.51] |
| Outcome or subgroup title | No. of studies | No. of participants | Statistical method | Effect size |
| 1 WDAEs Show forest plot | 16 | 3023 | Risk Ratio (M‐H, Fixed, 95% CI) | 1.52 [0.94, 2.45] |