Fluvastatina para la disminución de los lípidos
Información
- DOI:
- https://doi.org/10.1002/14651858.CD012282.pub2Copiar DOI

- Base de datos:
-
- Cochrane Database of Systematic Reviews
- Versión publicada:
-
- 06 marzo 2018see what's new
- Tipo:
-
- Intervention
- Etapa:
-
- Review
- Grupo Editorial Cochrane:
-
Grupo Cochrane de Hipertensión
- Copyright:
-
- Copyright © 2018 The Cochrane Collaboration. Published by John Wiley & Sons, Ltd.
Cifras del artículo
Altmetric:
Citado por:
Autores
Contributions of authors
JMW, MT and SPA contributed to the design of the protocol.
MT, SPA and SSS extracted the data
SPA analysed the data and made contributions to the discussion
JMW interpreted the data, made contributions to the discussion and conclusions
Sources of support
Internal sources
-
Department of Anesthesiology, Pharmacology & Therapeutics, University of BC, Canada.
Office space
External sources
-
BC Ministry of Health grant to the Therapeutics Initiative, Canada.
Salary support
Declarations of interest
None known.
Acknowledgements
The review authors would like to acknowledge assistance provided by Gavin Wong, Dr Benji Heran, and Dr David Godin, who assisted with validation of the data provided by included studies.
Version history
| Published | Title | Stage | Authors | Version |
| 2018 Mar 06 | Fluvastatin for lowering lipids | Review | Stephen P Adams, Sarpreet S Sekhon, Michael Tsang, James M Wright | |
| 2016 Jul 14 | Fluvastatin for lowering lipids | Protocol | Stephen P Adams, Sarpreet S Sekhon, James M Wright, Michael Tsang | |
Differences between protocol and review
Trials in which participants were receiving drugs that affect blood lipid level concentrations such as immunosuppressants such as cyclosporine and protease inhibitors such as ritonavir and indinavir were classified as excluded trials. Trials where more than 25% of the participants were not included in the efficacy analysis were classified as excluded trials. These were not mentioned in the protocol. We conducted sensitivity analyses to assess the effect of different methods of dosing, such as twice daily versus single dose, on the treatment effect. This sensitivity analysis was not mentioned in the protocol.
Keywords
MeSH
Medical Subject Headings (MeSH) Keywords
- Cholesterol [*blood];
- Cholesterol, LDL [blood];
- Controlled Before‐After Studies;
- Dose‐Response Relationship, Drug;
- Fatty Acids, Monounsaturated [*administration & dosage];
- Fluvastatin;
- Hydroxymethylglutaryl‐CoA Reductase Inhibitors [*administration & dosage];
- Indoles [*administration & dosage];
- Randomized Controlled Trials as Topic;
- Triglycerides [blood];
Medical Subject Headings Check Words
Humans;
PICO

Fluvastatin flow diagram
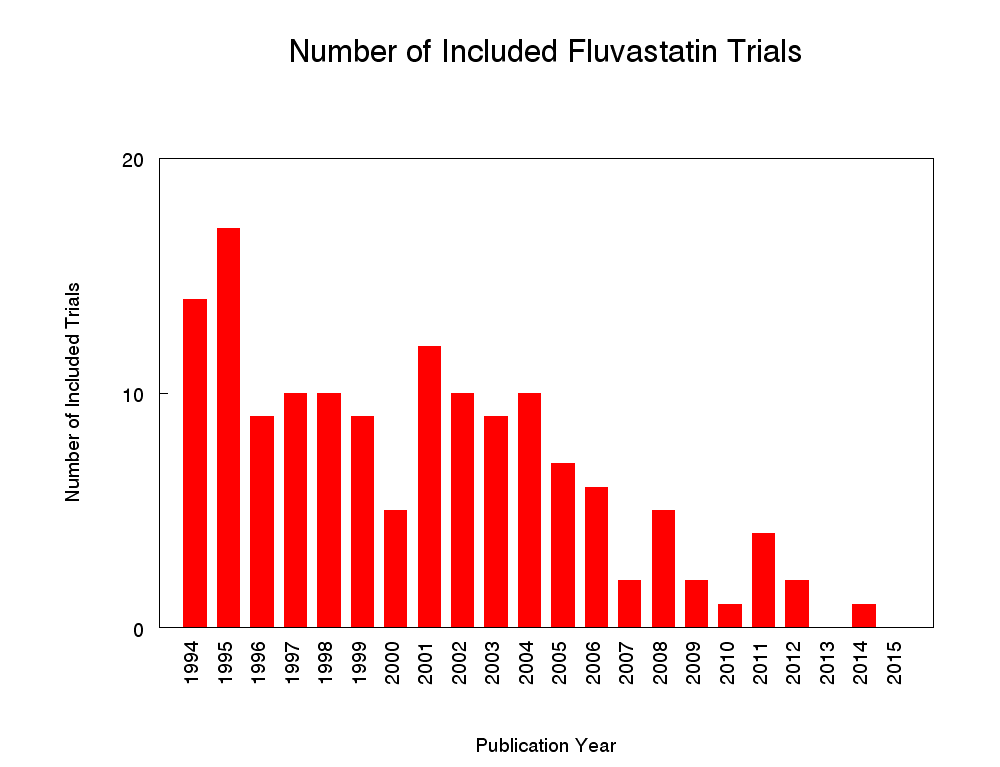
Number of included studies according to publication year

Log dose fluvastatin response curve for total cholesterol
Values represent the results of each trial for each dose comparison. The standard error bars cannot be seen because they all lie within the points

Log dose fluvastatin response curve for LDL cholesterol
Values represent the results of each trial for each dose comparison. The standard error bars cannot be seen because they all lie within the points

Log dose fluvastatin response curve for triglycerides
Values represent the results of each trial for each dose comparison. The standard error bars cannot be seen because they all lie within the points

'Risk of bias' graph: Summary of overall risk of bias for the lipid parameters according to each item.
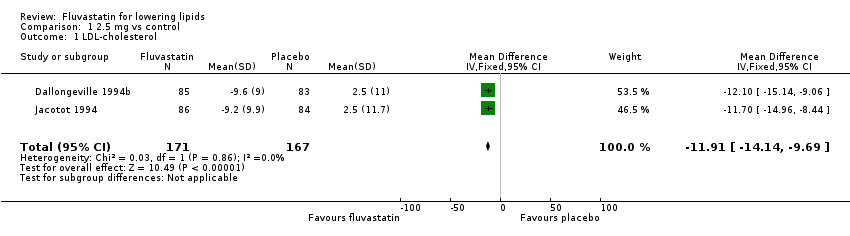
Comparison 1 2.5 mg vs control, Outcome 1 LDL‐cholesterol.
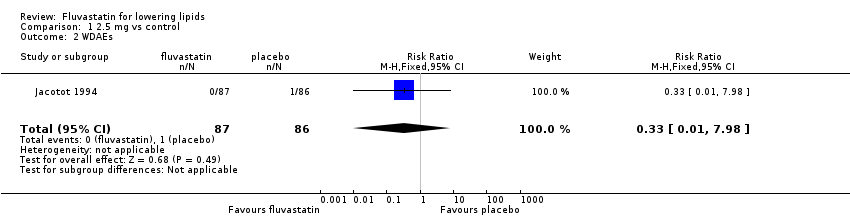
Comparison 1 2.5 mg vs control, Outcome 2 WDAEs.

Comparison 2 5 mg vs control, Outcome 1 LDL‐cholesterol.

Comparison 2 5 mg vs control, Outcome 2 LDL‐cholesterol.

Comparison 2 5 mg vs control, Outcome 3 WDAEs.

Comparison 3 10 mg vs control, Outcome 1 LDL‐cholesterol.

Comparison 3 10 mg vs control, Outcome 2 Total cholesterol.

Comparison 3 10 mg vs control, Outcome 3 HDL‐cholesterol.

Comparison 3 10 mg vs control, Outcome 4 Triglycerides.

Comparison 3 10 mg vs control, Outcome 5 WDAEs.
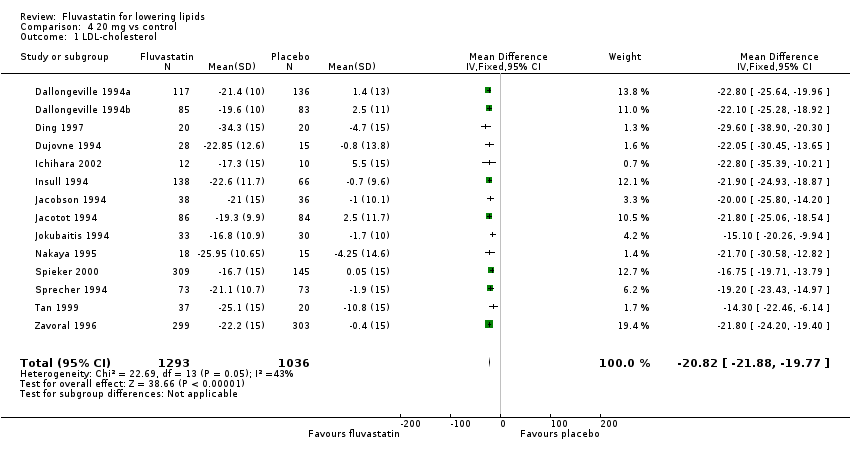
Comparison 4 20 mg vs control, Outcome 1 LDL‐cholesterol.

Comparison 4 20 mg vs control, Outcome 2 Total cholesterol.
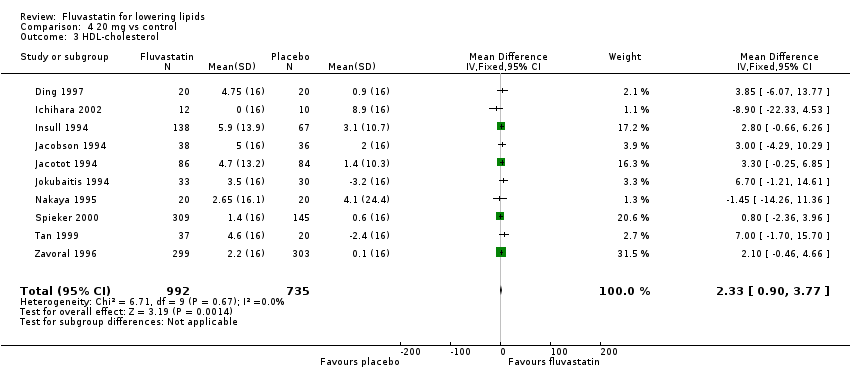
Comparison 4 20 mg vs control, Outcome 3 HDL‐cholesterol.

Comparison 4 20 mg vs control, Outcome 4 Triglycerides.
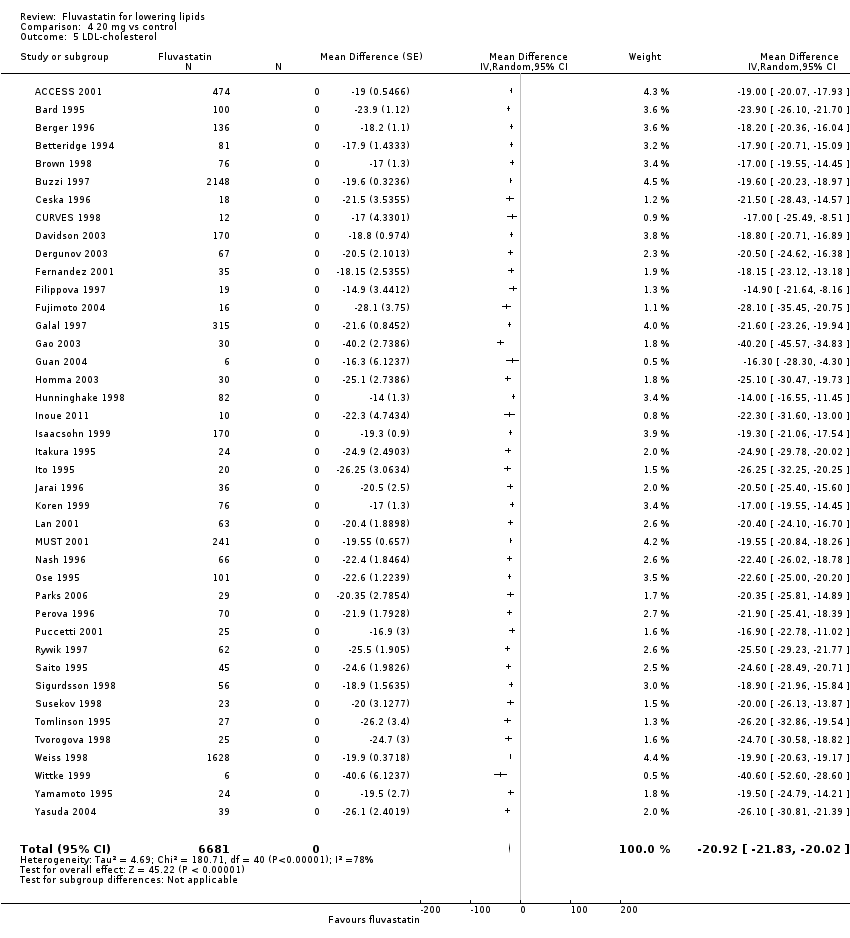
Comparison 4 20 mg vs control, Outcome 5 LDL‐cholesterol.
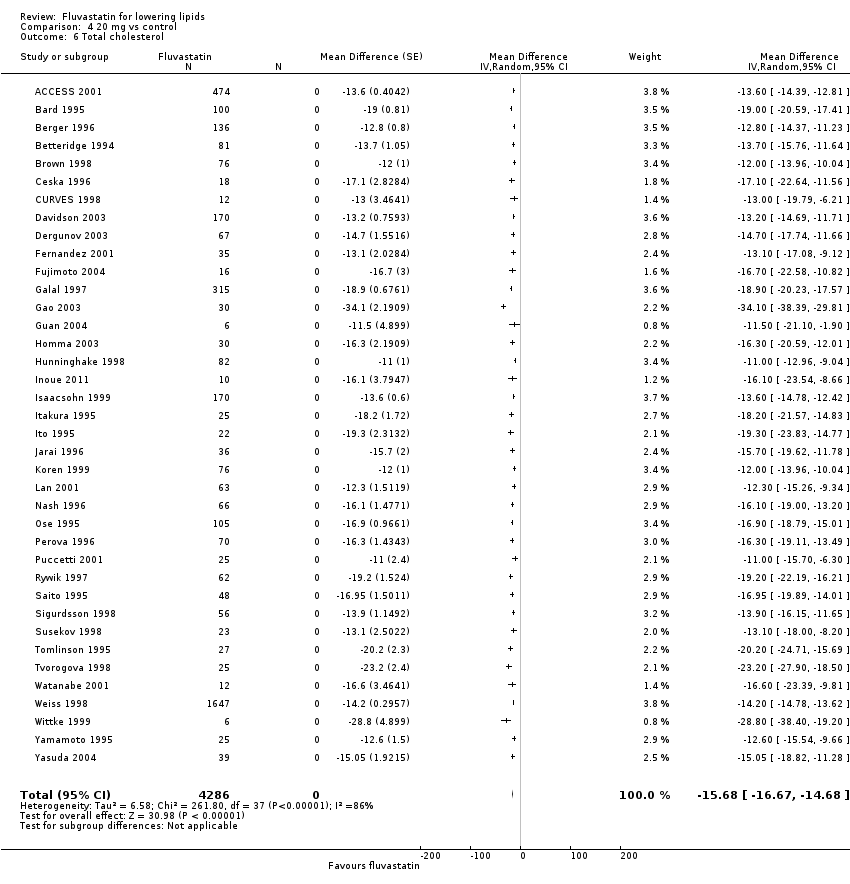
Comparison 4 20 mg vs control, Outcome 6 Total cholesterol.

Comparison 4 20 mg vs control, Outcome 7 HDL‐cholesterol.

Comparison 4 20 mg vs control, Outcome 8 Triglycerides.

Comparison 4 20 mg vs control, Outcome 9 WDAE.

Comparison 5 30 mg vs control, Outcome 1 LDL‐cholesterol.
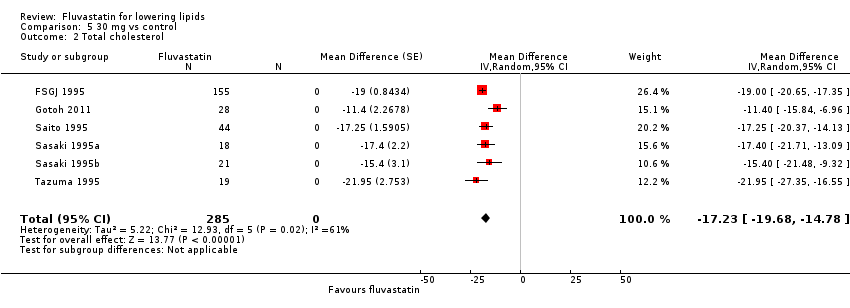
Comparison 5 30 mg vs control, Outcome 2 Total cholesterol.

Comparison 5 30 mg vs control, Outcome 3 HDL‐cholesterol.

Comparison 6 40 mg vs control, Outcome 1 LDL‐cholesterol.
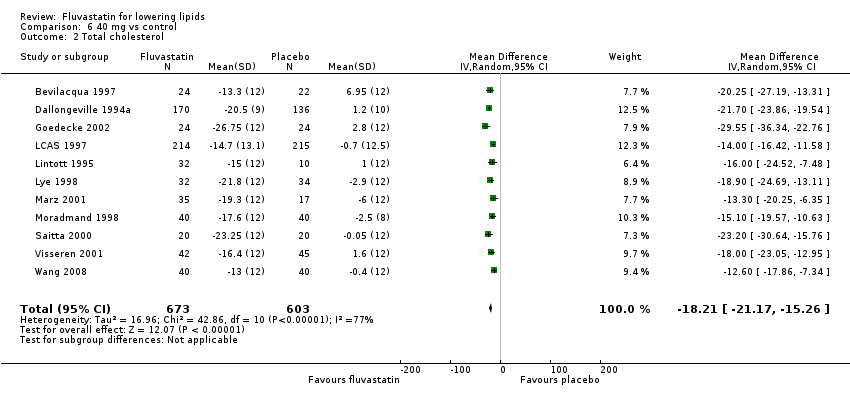
Comparison 6 40 mg vs control, Outcome 2 Total cholesterol.
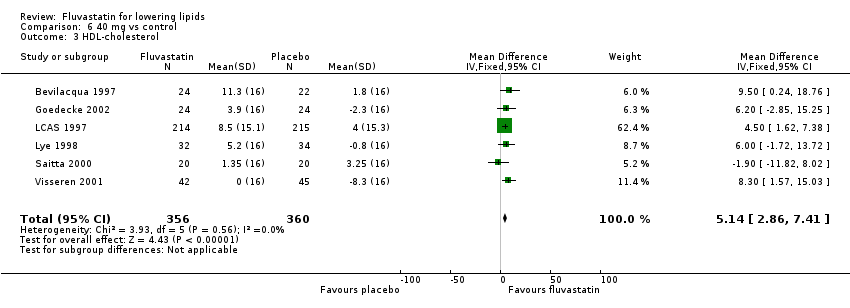
Comparison 6 40 mg vs control, Outcome 3 HDL‐cholesterol.
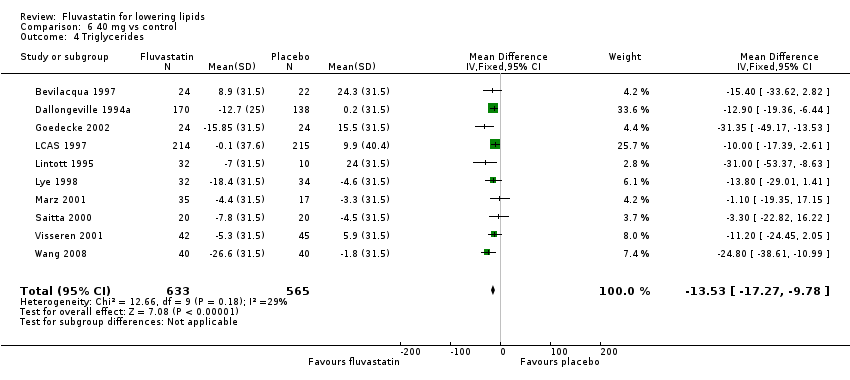
Comparison 6 40 mg vs control, Outcome 4 Triglycerides.
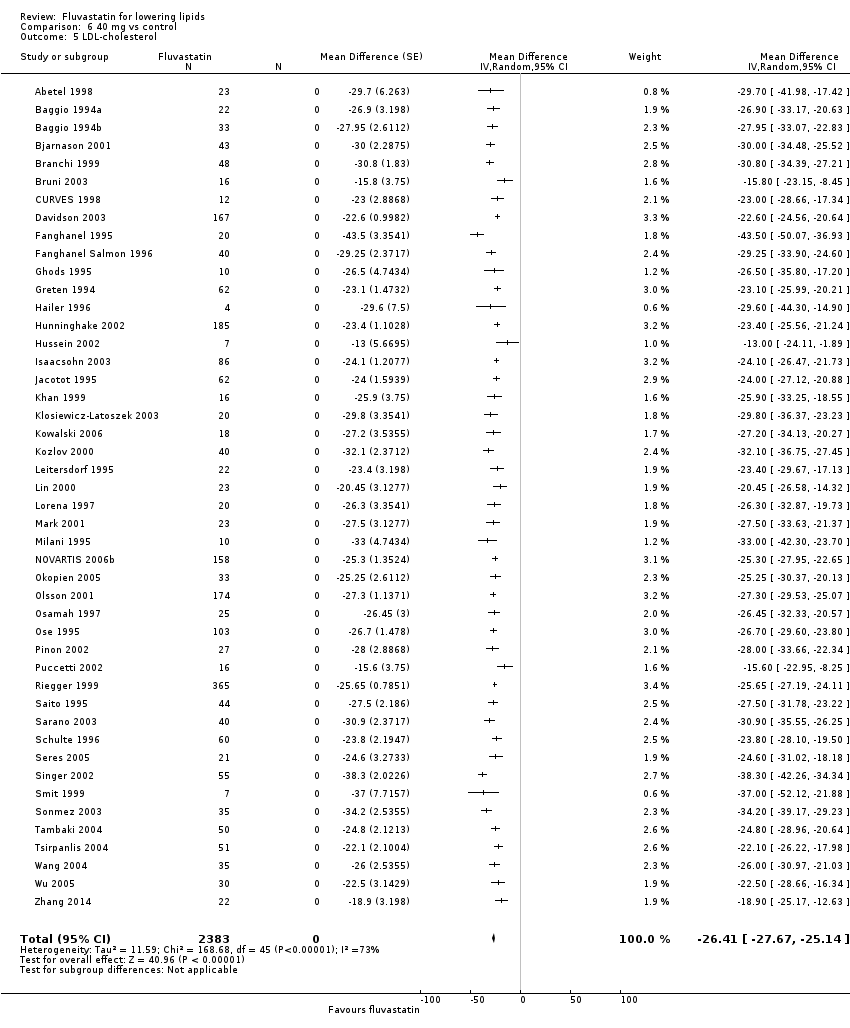
Comparison 6 40 mg vs control, Outcome 5 LDL‐cholesterol.

Comparison 6 40 mg vs control, Outcome 6 Total cholesterol.
Comparison 6 40 mg vs control, Outcome 7 HDL‐cholesterol.
Comparison 6 40 mg vs control, Outcome 8 Triglycerides.

Comparison 6 40 mg vs control, Outcome 9 WDAE.

Comparison 7 80 mg vs control, Outcome 1 LDL‐cholesterol.
Comparison 7 80 mg vs control, Outcome 2 Total cholesterol.

Comparison 7 80 mg vs control, Outcome 3 HDL‐cholesterol.

Comparison 7 80 mg vs control, Outcome 4 Triglycerides.

Comparison 7 80 mg vs control, Outcome 5 LDL‐cholesterol.

Comparison 7 80 mg vs control, Outcome 6 Total cholesterol.
Comparison 7 80 mg vs control, Outcome 7 HDL‐cholesterol.
Comparison 7 80 mg vs control, Outcome 8 Triglycerides.

Comparison 7 80 mg vs control, Outcome 9 WDAEs.

Comparison 8 all doses vs control, Outcome 1 WDAEs.
| LDL cholesterol lowering efficacy of fluvastatin | ||||||
| Patient or population: participants with normal or abnormal lipid profiles Settings: ambulatory care Intervention: fluvastatin Comparison: LDL cholesterol percentage change from baseline for all trials | ||||||
| Outcomes | Anticipated absolute effects mmol/L (95%CI) | Percent reduction % | No of Participants | Quality of the evidence | Comments | |
| Before exposure to fluvastatin1 | After exposure to fluvastatin | |||||
| LDL‐cholesterol fluvastatin 10 mg/day | 4.81 (4.44 to 5.17) | 4.08 (3.98 to 4.16) | 15.2 (17.1 to 13.4) | 595 | ⊕⊕⊕⊕ | Effect predicted from log dose‐response equation is 14.8%. Randomised and before and after design not different P = 0.94. |
| LDL‐cholesterol fluvastatin 20 mg/day | 4.87 (4.54 to 5.21) | 3.90 (3.88 to 3.91) | 20.0 (19.7 to 20.3) | 9010 | ⊕⊕⊕⊕ | Effect predicted from log dose‐response equation is 20.8%. Randomised and before and after design not different P = 0.16. |
| LDL‐cholesterol fluvastatin 40 mg/day | 4.74 (4.41 to 5.06) | 3.51 (3.48 to 3.54) | 25.9 (25.3 to 26.5) | 3658 | ⊕⊕⊕⊕ | Effect predicted from log dose‐response equation is 26.8%. Randomised and before and after design not different P = 0.58. |
| LDL‐cholesterol fluvastatin 80 mg/day | 4.80 (4.47 to 5.13) | 3.13 (3.10 to 3.15) | 34.9 (35.5 to 34.3) | 4928 | ⊕⊕⊕⊕ | Effect predicted from log dose‐response equation is 32.8%. Randomised and before and after design not different P = 0.07. |
| CI: Confidence interval | ||||||
| GRADE Working Group grades of evidence | ||||||
| 1. Mean baseline values. | ||||||
| Total cholesterol lowering efficacy of fluvastatin | ||||||
| Patient or population: participants with normal or abnormal lipid profiles Settings: ambulatory care Intervention: fluvastatin Comparison: Total cholesterol percentage change from baseline for all trials | ||||||
| Outcomes | Anticipated absolute effects mmol/L (95%CI) | Percent reduction % | No of Participants | Quality of the evidence | Comments | |
| Before exposure to fluvastatin1 | After exposure to fluvastatin | |||||
| Total cholesterol fluvastatin 10 mg/day | 6.90 (6.47 to 7.33) | 6.16 (6.02 to 6.30) | 10.7 (12.7 to 8.6) | 287 | ⊕⊕⊕⊕ | Effect predicted from log dose‐response equation is 10.9%. Randomised and before and after design not different P = 0.86. |
| Total cholesterol fluvastatin 20 mg/day | 6.99 (6.61 to 7.37) | 5.96 (5.94 to 5.98) | 14.8 (15.1 to 14.5) | 6309 | ⊕⊕⊕⊕ | Effect predicted from log dose‐response equation is 15.2%. Randomised versus before and after design borderline different P = 0.044. |
| Total cholesterol fluvastatin 40 mg/day | 6.91 (6.54 to 7.27) | 5.60 (5.57 to 5.64) | 18.9 (19.3 to 18.4) | 2966 | ⊕⊕⊕⊕ | Effect predicted from log dose‐response equation is 19.4%. Randomised and before and after design not different P = 0.106. |
| Total cholesterol fluvastatin 80 mg/day | 6.97 (6.62, 7.32) | 5.24 (5.12 to 5.27) | 24.9 (25.5 to 24.4) | 3943 | ⊕⊕⊕⊕ | Effect predicted from log dose‐response equation is 23.6%. Randomised and before and after design not different P = 0.595. |
| CI: Confidence interval | ||||||
| GRADE Working Group grades of evidence | ||||||
| 1. Mean baseline values. | ||||||
| Triglyceride lowering efficacy of fluvastatin | ||||||
| Patient or population: participants with normal or abnormal lipid profiles Settings: ambulatory care Intervention: fluvastatin Comparison: Triglyceride percentage change from baseline for all trials | ||||||
| Outcomes | Anticipated absolute effects mmol/L (95%CI) | Percent Reduction % | No of Participants | Quality of the evidence | Comments | |
| Before exposure to fluvastatin1 | After exposure to fluvastatin | |||||
| Triglycerides fluvastatin 10 mg/day | 1.93 (1.63 to 2.22) | 1.87 (1.73 to 2.01) | 3.0 (10.1 to ‐4.2) | 259 | ⊕⊕⊕⊕ | Effect predicted from log dose‐response equation is 5.2%. Only RCT data. |
| Triglycerides fluvastatin 20 mg/day | 1.98 (1.68 to 2.28) | 1.76 (1.74 to 1.77) | 11.1 (11.8 to 10.3) | 7510 | ⊕⊕⊕⊕ | Effect predicted from log dose‐response equation is 9.4%. Randomised and before and after design not different P = 0.277. |
| Triglycerides fluvastatin 40 mg/day | 1.94 (1.70 to 2.17) | 1.72 (1.69 to 1.75) | 11.1 (12.6 to 9.6) | 2646 | ⊕⊕⊕⊕ | Effect predicted from log dose‐response equation is 13.6% Randomised and before and after design not different P = 0.186. |
| Triglycerides fluvastatin 80 mg/day | 1.92 (1.67 to 2.17) | 1.59 (1.56 to 1.62) | 17.5 (19.1 to 15.9) | 3623 | ⊕⊕⊕⊕ | Effect predicted from log dose‐response equation is 17.7% Randomised and before and after design not different P = 0.496. |
| CI: Confidence interval | ||||||
| GRADE Working Group grades of evidence | ||||||
| 1. Mean baseline values. | ||||||
| Withdrawal due to adverse events due to fluvastatin | ||||||
| Patient or population: participants with normal or abnormal lipid profiles Settings: ambulatory care Intervention: fluvastatin Comparison: WDAEs fluvastatin versus placebo | ||||||
| Outcomes | Illustrative Comparative Risks* (95%CI) | Relative effect | No of Participants | Quality of the evidence | Comments | |
| Assumed risk | Corresponding risk | |||||
| placebo | fluvastatin | |||||
| WDAEs within 3‐12 weeks | RR 1.52 (0.94 to 2.45) | 3023 | ⊕⊝⊝⊝ | only 16 out of 36 placebo controlled trials reported withdrawals due to adverse effects. | ||
| 18 per 1000 | 27 per 1000 (17 to 44) | |||||
| *The basis for the assumed risk is the measure of absolute effect with the placebo group. The corresponding risk (and its 95% confidence interval) is based on the assumed risk in the comparison group and the relative effect of the intervention (and its 95% CI). CI: Confidence interval; RR: Risk Ratio | ||||||
| GRADE Working Group grades of evidence | ||||||
| 1. Downgraded 2 levels due to high risk of selective reporting and other biases. 2. Downgraded 1 level due to wide confidence intervals. | ||||||
| Fluvastatin dose (mg/day) | 2.5 | 5 | 10 | 20 | 30 | 40 | 80 |
| Total Cholesterol (mean percentage change from control) | ‐9.8 | ‐11.7 | ‐10.7 | ‐14.8 | ‐18.0 | ‐18.85 | ‐24.9 |
| 95% confidence interval | (‐12.0 to ‐7.7) | (‐14.2 to ‐9.2) | (‐12.7 to ‐8.6) | (‐15.1 to ‐14.5) | (‐19.2 to ‐16.7) | (‐19.3 to ‐18.4) | (‐25.4 to ‐24.4) |
| LDL‐Ca (mean percentage change from control) | ‐12.1 | ‐14.5 | ‐15.2 | ‐20.0 | ‐25.3 | ‐25.9 | ‐34.9 |
| 95% confidence interval | (‐14.2 to ‐10.1) | (‐16.3 to ‐12.7) | (‐17.1 to ‐13.3) | (‐20.3 to ‐19.7) | (‐26.9 to ‐23.7) | (‐26.5 to ‐25.3) | (‐35.5 to ‐34.3) |
| Triglycerides (mean percentage change from control) | ‐3.3 | ‐5.3 | ‐3.0 | ‐11.1 | ‐5.9 | ‐11.1 | ‐17.5 |
| 95% confidence interval | (‐14.6 to 8.0) | (‐13.1 to 2.5) | (‐10.1 to 4.2) | (‐11.8 to ‐10.3) | (‐20.1 to 8.3) | (‐12.6 to ‐9.6) | (‐19.1 to ‐15.9) |
| aLDL‐C: low‐density lipoprotein cholesterol | |||||||
| Outcome or subgroup title | No. of studies | No. of participants | Statistical method | Effect size |
| 1 LDL‐cholesterol Show forest plot | 2 | 338 | Mean Difference (IV, Fixed, 95% CI) | ‐11.91 [‐14.14, ‐9.69] |
| 2 WDAEs Show forest plot | 1 | 173 | Risk Ratio (M‐H, Fixed, 95% CI) | 0.33 [0.01, 7.98] |
| Outcome or subgroup title | No. of studies | No. of participants | Statistical method | Effect size |
| 1 LDL‐cholesterol Show forest plot | 2 | 332 | Mean Difference (IV, Fixed, 95% CI) | ‐15.76 [‐18.91, ‐12.60] |
| 2 LDL‐cholesterol Show forest plot | 2 | 91 | Mean Difference (Fixed, 95% CI) | ‐13.85 [‐16.02, ‐11.69] |
| 3 WDAEs Show forest plot | 1 | 171 | Risk Ratio (M‐H, Fixed, 95% CI) | 0.34 [0.01, 8.16] |
| Outcome or subgroup title | No. of studies | No. of participants | Statistical method | Effect size |
| 1 LDL‐cholesterol Show forest plot | 5 | 570 | Mean Difference (IV, Random, 95% CI) | ‐14.49 [‐17.95, ‐11.02] |
| 2 Total cholesterol Show forest plot | 3 | 259 | Mean Difference (IV, Random, 95% CI) | ‐8.44 [‐13.95, ‐2.93] |
| 3 HDL‐cholesterol Show forest plot | 3 | 259 | Mean Difference (IV, Fixed, 95% CI) | 1.86 [‐1.28, 5.00] |
| 4 Triglycerides Show forest plot | 3 | 259 | Mean Difference (IV, Fixed, 95% CI) | ‐2.96 [‐10.19, 4.28] |
| 5 WDAEs Show forest plot | 2 | 211 | Risk Ratio (M‐H, Fixed, 95% CI) | 0.34 [0.01, 8.16] |
| Outcome or subgroup title | No. of studies | No. of participants | Statistical method | Effect size |
| 1 LDL‐cholesterol Show forest plot | 14 | 2329 | Mean Difference (IV, Fixed, 95% CI) | ‐20.82 [‐21.88, ‐19.77] |
| 2 Total cholesterol Show forest plot | 12 | 2023 | Mean Difference (IV, Fixed, 95% CI) | ‐15.81 [‐16.75, ‐14.88] |
| 3 HDL‐cholesterol Show forest plot | 10 | 1727 | Mean Difference (IV, Fixed, 95% CI) | 2.33 [0.90, 3.77] |
| 4 Triglycerides Show forest plot | 10 | 1712 | Mean Difference (IV, Fixed, 95% CI) | ‐9.67 [‐12.61, ‐6.73] |
| 5 LDL‐cholesterol Show forest plot | 41 | 6681 | Mean Difference (Random, 95% CI) | ‐20.92 [‐21.83, ‐20.02] |
| 6 Total cholesterol Show forest plot | 38 | 4286 | Mean Difference (Random, 95% CI) | ‐15.68 [‐16.67, ‐14.68] |
| 7 HDL‐cholesterol Show forest plot | 32 | 6239 | Mean Difference (Random, 95% CI) | 5.34 [4.51, 6.17] |
| 8 Triglycerides Show forest plot | 29 | 5798 | Mean Difference (Random, 95% CI) | ‐9.15 [‐11.36, ‐6.94] |
| 9 WDAE Show forest plot | 7 | 1060 | Risk Ratio (M‐H, Random, 95% CI) | 0.87 [0.14, 5.46] |
| Outcome or subgroup title | No. of studies | No. of participants | Statistical method | Effect size |
| 1 LDL‐cholesterol Show forest plot | 7 | 336 | Mean Difference (Random, 95% CI) | ‐24.03 [‐27.72, ‐20.34] |
| 2 Total cholesterol Show forest plot | 6 | 285 | Mean Difference (Random, 95% CI) | ‐17.23 [‐19.68, ‐14.78] |
| 3 HDL‐cholesterol Show forest plot | 2 | 47 | Mean Difference (Random, 95% CI) | 7.86 [‐0.36, 16.07] |
| Outcome or subgroup title | No. of studies | No. of participants | Statistical method | Effect size |
| 1 LDL‐cholesterol Show forest plot | 11 | 1275 | Mean Difference (IV, Random, 95% CI) | ‐27.04 [‐30.69, ‐23.40] |
| 2 Total cholesterol Show forest plot | 11 | 1276 | Mean Difference (IV, Random, 95% CI) | ‐18.21 [‐21.17, ‐15.26] |
| 3 HDL‐cholesterol Show forest plot | 6 | 716 | Mean Difference (IV, Fixed, 95% CI) | 5.14 [2.86, 7.41] |
| 4 Triglycerides Show forest plot | 10 | 1198 | Mean Difference (IV, Fixed, 95% CI) | ‐13.53 [‐17.27, ‐9.78] |
| 5 LDL‐cholesterol Show forest plot | 46 | 2383 | Mean Difference (Random, 95% CI) | ‐26.41 [‐27.67, ‐25.14] |
| 6 Total cholesterol Show forest plot | 44 | 1690 | Mean Difference (Random, 95% CI) | ‐19.52 [‐20.60, ‐18.45] |
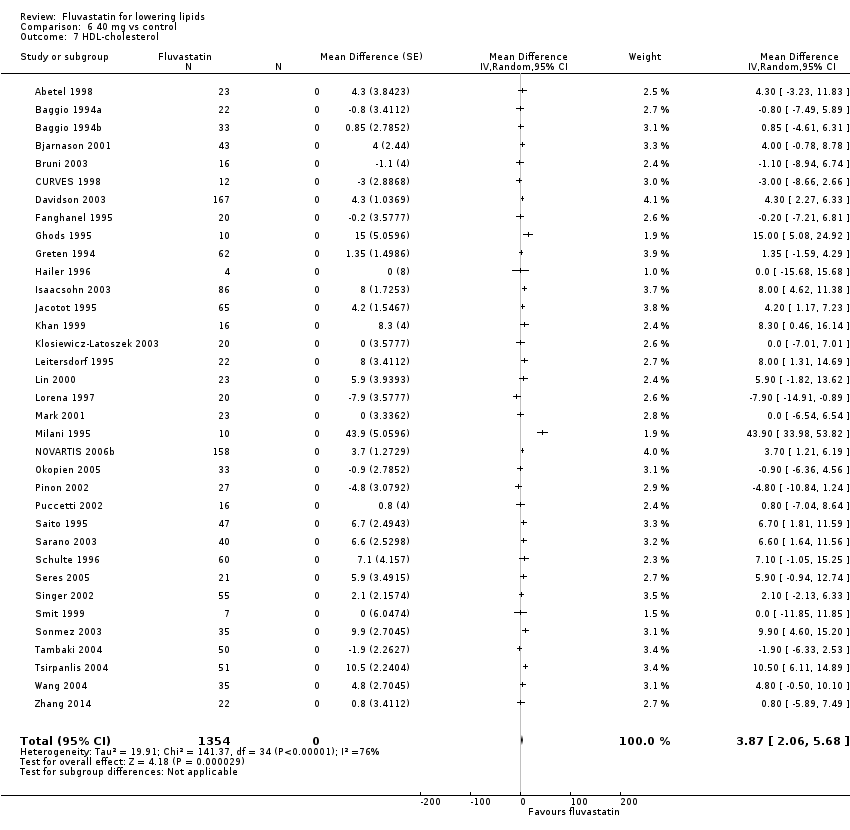
| 7 HDL‐cholesterol Show forest plot | 35 | 1354 | Mean Difference (Random, 95% CI) | 3.87 [2.06, 5.68] |
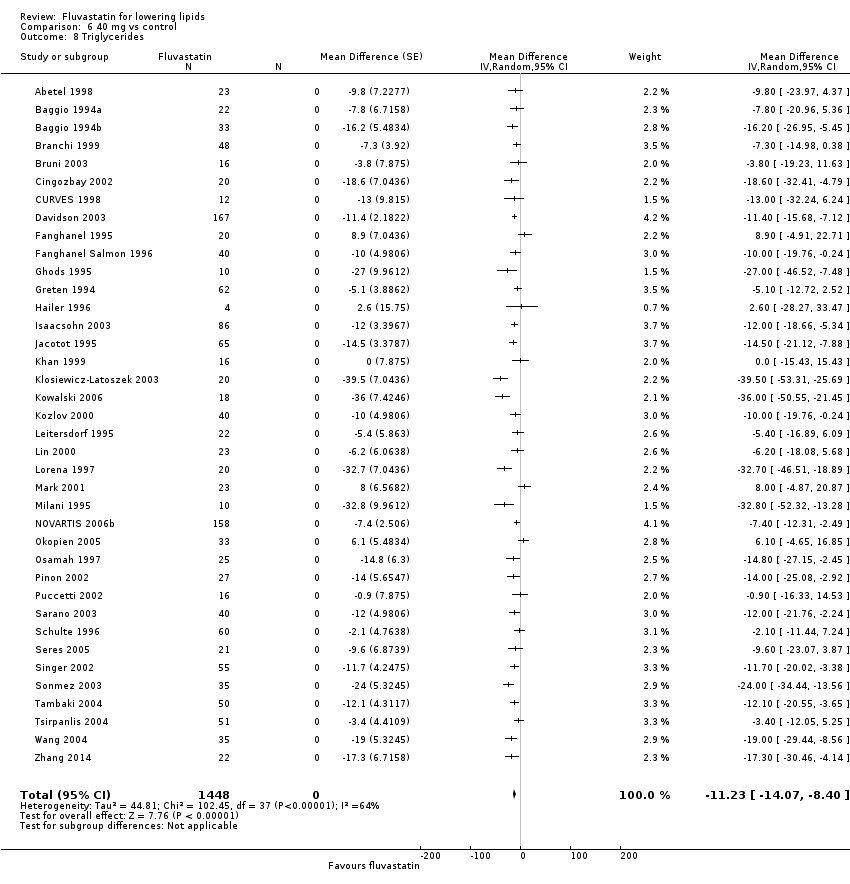
| 8 Triglycerides Show forest plot | 38 | 1448 | Mean Difference (Random, 95% CI) | ‐11.23 [‐14.07, ‐8.40] |
| 9 WDAE Show forest plot | 4 | 236 | Risk Ratio (M‐H, Fixed, 95% CI) | 3.47 [0.75, 16.11] |
| Outcome or subgroup title | No. of studies | No. of participants | Statistical method | Effect size |
| 1 LDL‐cholesterol Show forest plot | 10 | 2727 | Mean Difference (IV, Random, 95% CI) | ‐34.62 [‐38.60, ‐30.64] |
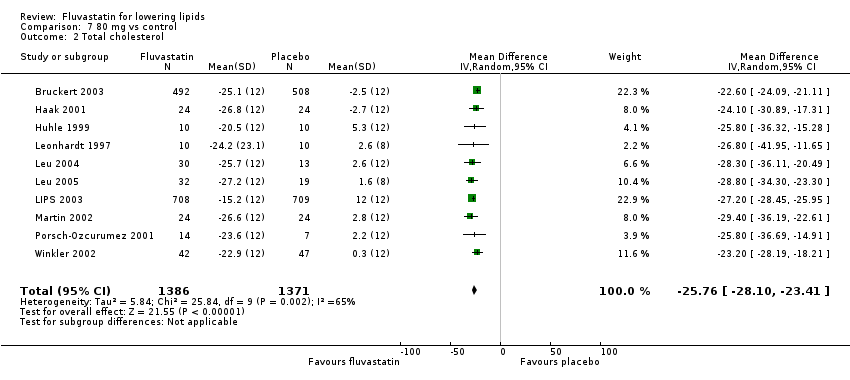
| 2 Total cholesterol Show forest plot | 10 | 2757 | Mean Difference (IV, Random, 95% CI) | ‐25.76 [‐28.10, ‐23.41] |
| 3 HDL‐cholesterol Show forest plot | 9 | 2644 | Mean Difference (IV, Random, 95% CI) | 1.06 [‐2.26, 4.38] |
| 4 Triglycerides Show forest plot | 10 | 2756 | Mean Difference (IV, Fixed, 95% CI) | ‐17.28 [‐19.63, ‐14.92] |
| 5 LDL‐cholesterol Show forest plot | 22 | 2201 | Mean Difference (Random, 95% CI) | ‐33.04 [‐35.17, ‐30.90] |
| 6 Total cholesterol Show forest plot | 17 | 1186 | Mean Difference (Random, 95% CI) | ‐23.27 [‐24.99, ‐21.55] |
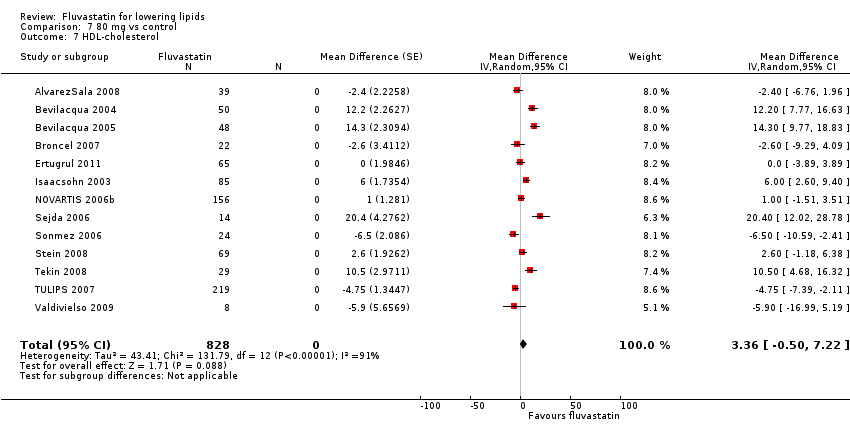
| 7 HDL‐cholesterol Show forest plot | 13 | 828 | Mean Difference (Random, 95% CI) | 3.36 [‐0.50, 7.22] |
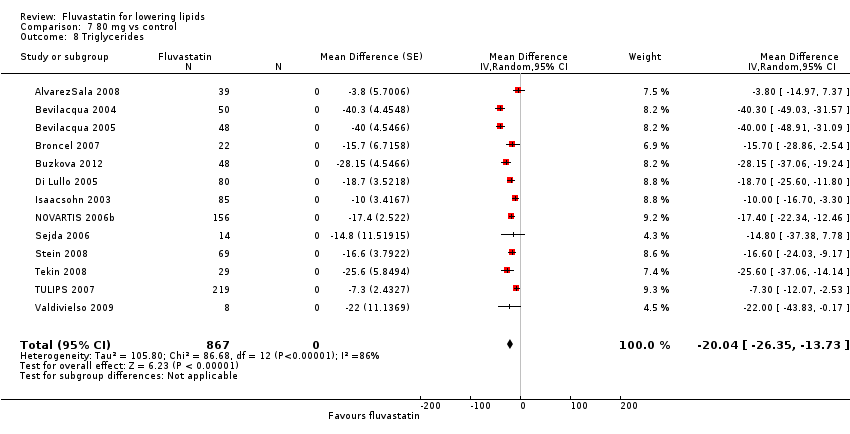
| 8 Triglycerides Show forest plot | 13 | 867 | Mean Difference (Random, 95% CI) | ‐20.04 [‐26.35, ‐13.73] |
| 9 WDAEs Show forest plot | 4 | 1430 | Risk Ratio (M‐H, Fixed, 95% CI) | 1.33 [0.71, 2.51] |
| Outcome or subgroup title | No. of studies | No. of participants | Statistical method | Effect size |
| 1 WDAEs Show forest plot | 16 | 3023 | Risk Ratio (M‐H, Fixed, 95% CI) | 1.52 [0.94, 2.45] |