Betabloqueantes e inhibidores del sistema de renina‐angiotensina‐aldosterona para la insuficiencia cardíaca crónica con fracción de expulsión conservada
Información
- DOI:
- https://doi.org/10.1002/14651858.CD012721.pub2Copiar DOI

- Base de datos:
-
- Cochrane Database of Systematic Reviews
- Versión publicada:
-
- 28 junio 2018see what's new
- Tipo:
-
- Intervention
- Etapa:
-
- Review
- Grupo Editorial Cochrane:
-
Grupo Cochrane de Corazón
- Copyright:
-
- Copyright © 2018 The Cochrane Collaboration. Published by John Wiley & Sons, Ltd.
Cifras del artículo
Altmetric:
Citado por:
Autores
Contributions of authors
NM: selection of studies, data extraction, analysis, GRADE assessment, co‐wrote the manuscript.
KM: selection of studies, GRADE assessment.
JT: contributed to review design, approved the final version.
CD: contributed to review design, GRADE assessment, approved the final version.
TL: guarantor of review, designed the review, data extraction, analysis, GRADE assessment, co‐wrote the manuscript.
Sources of support
Internal sources
-
R Thomas Lumbers, UK.
NIHR Academic Clinical Lectureship
External sources
-
This project was supported by the National Institute for Health Research via Cochrane Infrastructure and NIHR Incentive funding to Cochrane Heart. The views and opinions expressed therein are those of the authors and do not necessarily reflect those of the Systematic Reviews Programme, NIHR, NHS or the Department of Health, UK.
Declarations of interest
NM: none known.
KM: none known.
JT: none known.
CD: has received sponsorship from Servier, Roche and Novartis to attend cardiology conferences, payment from GE Healthcare to give lectures on heart failure, and has served as a paid consultant to Servier and Vifor.
TL: has received research grants from Pfizer and has served as an unpaid consultant to GSK.
Acknowledgements
T.L was supported by an NIHR Clinical Lectureship and, subsequently, a UKRI Health Data Research Fellowship. We are grateful to Marta Battle Lopez, Derya Senturk, Hatoko Sasaki, Lu Chunli, Teresa Cantisani, Liliya Eugenevna Ziganshina, Hanneke Dominicus, Joanna Zajac, Anna Aryee, and Vaclav Papez for their help with the full text assessment of non‐English language papers. We are also grateful to Rui Providencia for assessing and extracting data from non‐English language papers, and to Juan‐Pablo Casas for his guidance in designing this review.
Version history
| Published | Title | Stage | Authors | Version |
| 2021 May 22 | Beta‐blockers and inhibitors of the renin‐angiotensin aldosterone system for chronic heart failure with preserved ejection fraction | Review | Nicole Martin, Karthick Manoharan, Ceri Davies, R Thomas Lumbers | |
| 2018 Jun 28 | Beta‐blockers and inhibitors of the renin‐angiotensin aldosterone system for chronic heart failure with preserved ejection fraction | Review | Nicole Martin, Karthick Manoharan, James Thomas, Ceri Davies, R Thomas Lumbers | |
| 2017 Jul 17 | Beta‐blockers and inhibitors of the renin‐angiotensin aldosterone system for chronic heart failure with preserved ejection fraction | Protocol | R Thomas Lumbers, Nicole Martin, Karthick Manoharan, Jonathan Nyong, James Thomas, Juan P Casas, Ceri Davies | |
Differences between protocol and review
We originally planned to include participants with LVEF ≥ 40% but changed this to LVEF > 40%, since this is a more frequently used cut‐off in clinical trials.
We originally limited our population to symptomatic heart failure (NYHA class > I) at enrolment; however, this criterion was removed to include people with diagnosis of heart failure in whom symptoms had improved the functional class.
We added a clarification regarding the exclusion of cross‐over trials.
We originally planned to include withdrawals due to adverse events in the 'Summary of findings' table. This was changed because this outcome was frequently reported inconsistently, which limits the applicability of a pooled analysis. Instead, we added hyperkalaemia to the 'Summary of findings' table because this adverse event outcome has relevance for clinical decision making. For the same reason, hyperkalaemia was switched from secondary to primary outcomes and withdrawals due to adverse events was switched from primary to secondary outcomes.
We did not pre specify which scale for quality of life we would focus on in the 'Summary of findings' table. To aid comparisons across the 'Summary of findings' tables we chose to include the Minnsota Living with Heart Failure Questionnaire and not the standardised mean difference across two scales which applied only to MRA versus placebo or no treatment comparison.
Keywords
MeSH
Medical Subject Headings (MeSH) Keywords
- *Stroke Volume;
- Adrenergic beta‐Antagonists [*therapeutic use];
- Angiotensin Receptor Antagonists [*therapeutic use];
- Angiotensin‐Converting Enzyme Inhibitors [*therapeutic use];
- Chronic Disease;
- Heart Failure [*drug therapy, mortality];
- Hospitalization;
- Mineralocorticoid Receptor Antagonists [*therapeutic use];
- Neprilysin [antagonists & inhibitors];
- Quality of Life;
- Randomized Controlled Trials as Topic;
- Renin‐Angiotensin System [*drug effects];
Medical Subject Headings Check Words
Humans;
PICO

Study flow diagram

Risk of bias graph: review authors' judgements about each risk of bias item presented as percentages across all included studies.

Risk of bias summary: review authors' judgements about each risk of bias item for each included study.
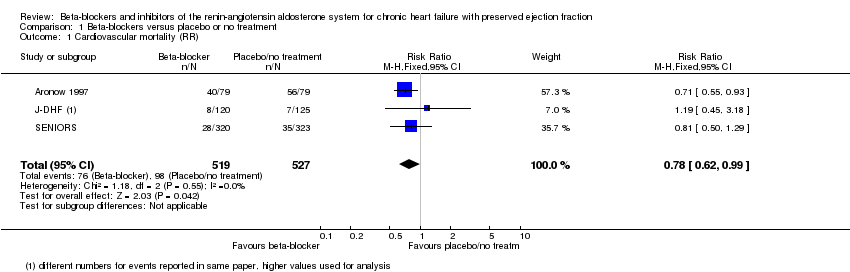
Comparison 1 Beta‐blockers versus placebo or no treatment, Outcome 1 Cardiovascular mortality (RR).

Comparison 1 Beta‐blockers versus placebo or no treatment, Outcome 2 Heart failure hospitalisation (RR).
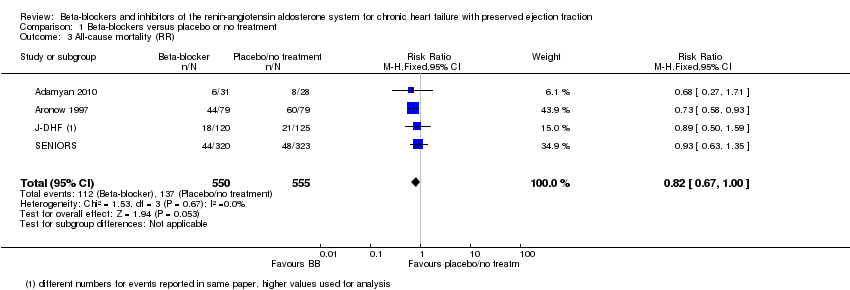
Comparison 1 Beta‐blockers versus placebo or no treatment, Outcome 3 All‐cause mortality (RR).
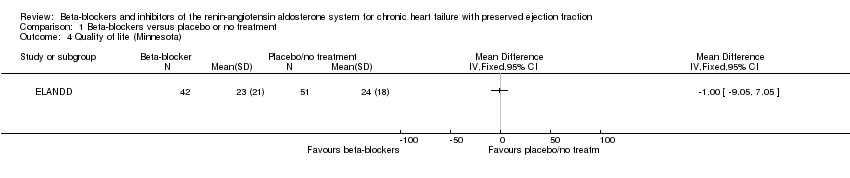
Comparison 1 Beta‐blockers versus placebo or no treatment, Outcome 4 Quality of life (Minnesota).
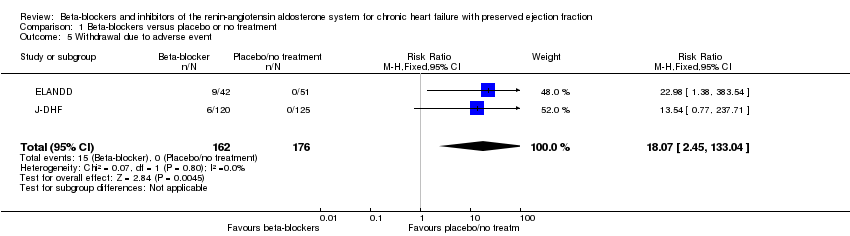
Comparison 1 Beta‐blockers versus placebo or no treatment, Outcome 5 Withdrawal due to adverse event.

Comparison 2 Mineralocorticoid receptor antagonists versus placebo or no treatment, Outcome 1 Cardiovascular mortality (RR).
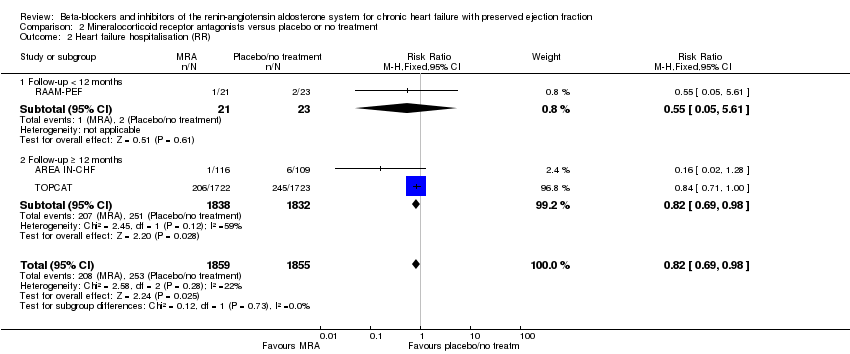
Comparison 2 Mineralocorticoid receptor antagonists versus placebo or no treatment, Outcome 2 Heart failure hospitalisation (RR).
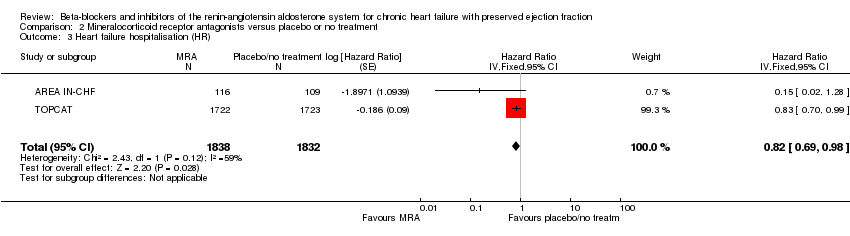
Comparison 2 Mineralocorticoid receptor antagonists versus placebo or no treatment, Outcome 3 Heart failure hospitalisation (HR).

Comparison 2 Mineralocorticoid receptor antagonists versus placebo or no treatment, Outcome 4 Hyperkalaemia.
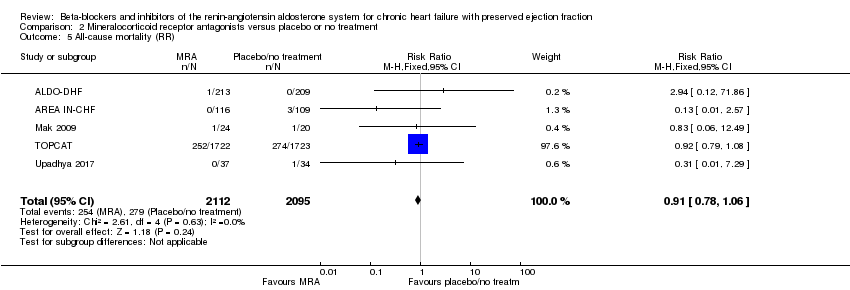
Comparison 2 Mineralocorticoid receptor antagonists versus placebo or no treatment, Outcome 5 All‐cause mortality (RR).

Comparison 2 Mineralocorticoid receptor antagonists versus placebo or no treatment, Outcome 6 Quality of life.

Comparison 2 Mineralocorticoid receptor antagonists versus placebo or no treatment, Outcome 7 Quality of life (KCCQ).

Comparison 2 Mineralocorticoid receptor antagonists versus placebo or no treatment, Outcome 8 Quality of life (Minnesota).

Comparison 2 Mineralocorticoid receptor antagonists versus placebo or no treatment, Outcome 9 Withdrawal due to adverse event.

Comparison 3 Angiotensin converting enzyme inhibitors versus placebo or no treatment, Outcome 1 Cardiovascular mortality (RR).
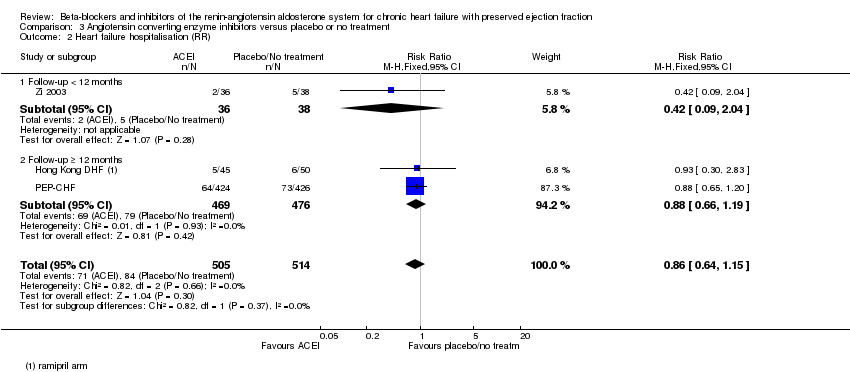
Comparison 3 Angiotensin converting enzyme inhibitors versus placebo or no treatment, Outcome 2 Heart failure hospitalisation (RR).

Comparison 3 Angiotensin converting enzyme inhibitors versus placebo or no treatment, Outcome 3 Hyperkalaemia.
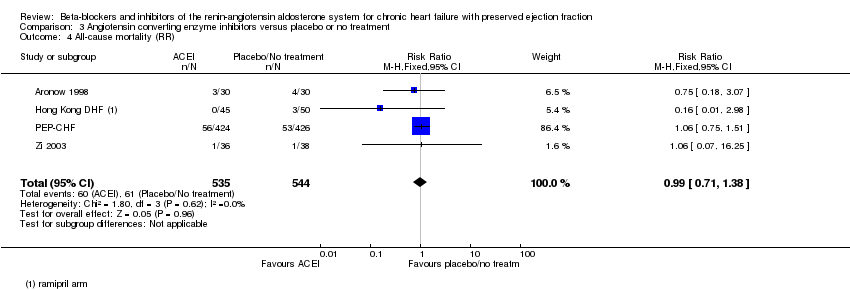
Comparison 3 Angiotensin converting enzyme inhibitors versus placebo or no treatment, Outcome 4 All‐cause mortality (RR).

Comparison 3 Angiotensin converting enzyme inhibitors versus placebo or no treatment, Outcome 5 Quality of life (Minnesota).

Comparison 3 Angiotensin converting enzyme inhibitors versus placebo or no treatment, Outcome 6 Withdrawal due to adverse event.

Comparison 4 Angiotensin receptor blockers versus placebo or no treatment, Outcome 1 Cardiovascular mortality (RR).

Comparison 4 Angiotensin receptor blockers versus placebo or no treatment, Outcome 2 Cardiovascular mortality (HR).

Comparison 4 Angiotensin receptor blockers versus placebo or no treatment, Outcome 3 Heart failure hospitalisation (RR).

Comparison 4 Angiotensin receptor blockers versus placebo or no treatment, Outcome 4 Heart failure hospitalisation (HR).
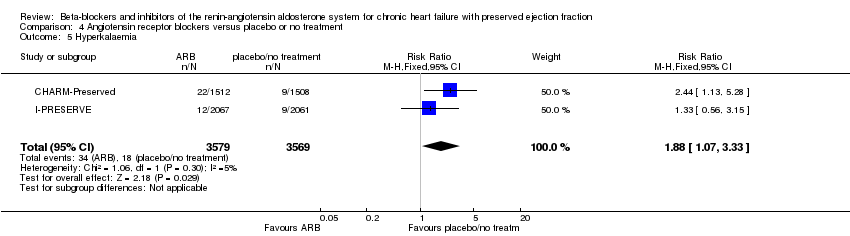
Comparison 4 Angiotensin receptor blockers versus placebo or no treatment, Outcome 5 Hyperkalaemia.
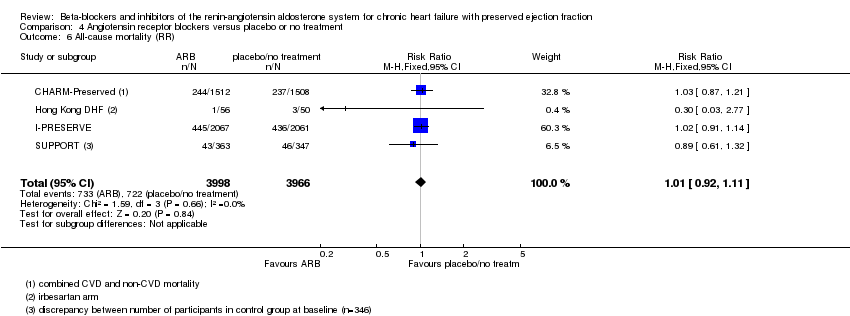
Comparison 4 Angiotensin receptor blockers versus placebo or no treatment, Outcome 6 All‐cause mortality (RR).
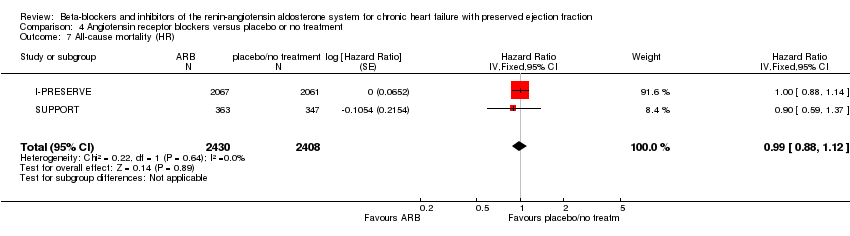
Comparison 4 Angiotensin receptor blockers versus placebo or no treatment, Outcome 7 All‐cause mortality (HR).

Comparison 4 Angiotensin receptor blockers versus placebo or no treatment, Outcome 8 Quality of life (Minnesota).
Comparison 4 Angiotensin receptor blockers versus placebo or no treatment, Outcome 9 Withdrawal due to adverse event.
| Beta‐blockers compared to placebo or no treatment for chronic heart failure with preserved ejection fraction | ||||||
| Patient or population: chronic heart failure with preserved ejection fraction | ||||||
| Outcomes | Anticipated absolute effects* (95% CI) | Relative effect | № of participants | Certainty of the evidence | Comments | |
| Risk with placebo/no treatment | Risk with Beta‐blockers | |||||
| Cardiovascular mortality (RR) | Study population | RR 0.78 | 1046 | ⊕⊕⊝⊝ | Three additional studies (ELANDD; SWEDIC; Takeda 2004) reported that no deaths occurred | |
| 173 per 1000 | 135 per 1000 | |||||
| Heart failure hospitalisation (RR) | Study population | RR 0.73 | 449 | ⊕⊝⊝⊝ | Follow‐up unclear for SWEDIC. ELANDD reported that no hospitalisation due to heart failure occurred | |
| 117 per 1000 | 86 per 1000 | |||||
| Hyperkalaemia | 245 (1 RCT) | ⊕⊝⊝⊝ | J‐DHF reported one participant in the intervention group (N = 120) experienced hyperkalaemia but did not report on this outcome for the control group. No further data were available from any of the other studies. | |||
| All‐cause mortality (RR) | Study population | RR 0.82 | 1105 | ⊕⊕⊝⊝ | Follow‐up unclear for Adamyan 2010. ELANDD, SWEDIC and Takeda 2004 reported that no deaths occurred | |
| 243 per 1000 | 199 per 1000 | |||||
| Quality of life (Minnesota) | Mean quality of life (Minnesota) was 24 | MD 1 lower | ‐ | 93 | ⊕⊝⊝⊝ | Lower = better, 5 point difference considered to be clinically meaningful |
| *The risk in the intervention group (and its 95% confidence interval) is based on the assumed risk in the comparison group and the relative effect of the intervention (and its 95% CI). | ||||||
| GRADE Working Group grades of evidence | ||||||
| 1 Downgraded by one level due to unclear selection bias in most studies. 2 Downgraded by one level due to concerns about the smaller study being more precise than the larger study. 3 Downgraded by one level due to large variation in size of effect. 4 Downgraded by two levels due to few events and wide CI. 5 Downgraded by two levels due to very small sample size. 6 Suspected publication bias; this is a patient‐relevant outcome that is not reported in most studies. 7 Downgraded by two levels due to incomplete reporting. | ||||||
| MRA compared to placebo or no treatment for chronic heart failure with preserved ejection fraction | ||||||
| Patient or population: chronic heart failure with preserved ejection fraction | ||||||
| Outcomes | Anticipated absolute effects* (95% CI) | Relative effect | № of participants | Certainty of the evidence | Comments | |
| Risk with placebo/no treatment | Risk with MRA | |||||
| Cardiovascular mortality (RR) | Study population | RR 0.90 | 4070 | ⊕⊕⊕⊝ | Two additional trials (RAAM‐PEF, Kurrelmeyer 2014) reported that no deaths occurred | |
| 88 per 1000 | 79 per 1000 | |||||
| Heart failure hospitalisation (RR) | Study population | RR 0.82 | 3714 | ⊕⊕⊕⊝ | Three additional trials (ALDO‐DHF ,Kurrelmeyer 2014, Upadhya 2017) reported that no hospitalisation due to heart failure occurred | |
| 136 per 1000 | 112 per 1000 | |||||
| Hyperkalaemia | Study population | RR 2.11 | 4291 | ⊕⊕⊕⊕ | Two trials defined hyperkalaemia ≥ 5.5 mEg/L | |
| 83 per 1000 | 175 per 1000 | |||||
| All‐cause mortality | Study population | RR 0.91 | 4207 | ⊕⊕⊕⊝ | Two additional trials (RAAM‐PEF, Kurrelmeyer 2014) reported that no deaths occurred | |
| 133 per 1000 | 121 per 1000 | |||||
| Quality of life (Minnesota) | Mean quality of life (Minnesota) ranged from 20 to 25 | MD 0.84 higher | ‐ | 511 | ⊕⊕⊝⊝ | Lower = better, 5 points are considered a clinically significant difference We did not pre‐specify which QoL scale was to be reported in the 'Summary of findings' table. To aid comparisons among 'Summary of findings' tables we chose to include the Minnesota Living with Heart Failure questionnaire and not the SMD across two scales |
| *The risk in the intervention group (and its 95% confidence interval) is based on the assumed risk in the comparison group and the relative effect of the intervention (and its 95% CI). | ||||||
| GRADE Working Group grades of evidence | ||||||
| 1 Downgraded by one level due to imprecision. 2 Downgraded by one level because one trial was open label. 3 Downgraded by one level due to small sample size. | ||||||
| ACEI compared to placebo or no treatment for chronic heart failure with preserved ejection fraction | ||||||
| Patient or population: chronic heart failure with preserved ejection fraction | ||||||
| Outcomes | Anticipated absolute effects* (95% CI) | Relative effect | № of participants | Certainty of the evidence | Comments | |
| Risk with placebo/no treatment | Risk with ACEI | |||||
| Cardiovascular mortality (RR) | Study population | RR 0.93 | 945 | ⊕⊕⊕⊝ | One additional trial (Kitzman 2010) reported that no deaths occurred | |
| 86 per 1000 | 81 per 1000 | |||||
| Heart failure hospitalisation (RR) | Study population | RR 0.86 | 1019 | ⊕⊕⊕⊝ | ||
| 13 per 1000 | 11 per 1000 | |||||
| Hyperkalaemia | 74 (1 RCTs) | ⊕⊝⊝⊝ | One trial (Zi 2003) reported 2 events in the intervention group (N = 36), 0 events in the control group (N = 38) (RR 5.27, 95% CI 0.26 to 106.16) | |||
| All‐cause mortality (RR) | Study population | RR 0.99 | 1079 | ⊕⊕⊕⊝ | One additional trial (Kitzman 2010) reported that no deaths occurred | |
| 119 per 1000 | 119 per 1000 | |||||
| Quality of life (Minnesota) | Mean quality of life (Minnesota) ranged from 10.9 to 29 | MD 0.09 lower | ‐ | 154 | ⊕⊕⊝⊝ | Scale: 0 to 105, lower = better, 5 point difference considered clinically relevant One trial (SNEGOVIK) reported mean change from baseline of ‐19.8 for intervention and ‐10.7 for control |
| *The risk in the intervention group (and its 95% confidence interval) is based on the assumed risk in the comparison group and the relative effect of the intervention (and its 95% CI). | ||||||
| GRADE Working Group grades of evidence | ||||||
| 1 Downgraded by one level due to wide CI. 2 Downgraded by one level due to risk of bias (open label). 3 Downgraded by one level due to low sample size. 4 Downgraded by one level due to unclear selection bias. | ||||||
| ARB compared to placebo or no treatment for chronic heart failure with preserved ejection fraction | ||||||
| Patient or population: chronic heart failure with preserved ejection fraction | ||||||
| Outcomes | Anticipated absolute effects* (95% CI) | Relative effect | № of participants | Certainty of the evidence | Comments | |
| Risk with placebo/no treatment | Risk with ARB | |||||
| Cardiovascular mortality (RR) | Study population | RR 1.02 | 7254 | ⊕⊕⊕⊕ | One additional trial (Parthasarathy 2009) reported that no deaths occurred | |
| 131 per 1000 | 133 per 1000 | |||||
| Heart failure hospitalisation (RR) | Study population | RR 0.92 | 7254 | ⊕⊕⊕⊕ | ||
| 171 per 1,‐000 | 157 per 1,‐000 | |||||
| Hyperkalaemia | Study population | RR 1.88 | 7148 | ⊕⊕⊕⊕ | ||
| 3 per 1,000 | 5 per 1,000 | |||||
| All‐cause mortality (RR) | Study population | RR 1.01 | 7964 | ⊕⊕⊕⊕ | One additional trial (Parthasarathy 2009) reported that no deaths occurred | |
| 72 per 1000 | 73 per 1,‐000 | |||||
| Quality of life (Minnesota) | Mean quality of life (Minnesota) ranged from 10.9 to 31.6 | MD 0.41 higher | ‐ | 3117 | ⊕⊕⊕⊕ | Scale: 0 to 105, lower = better, 5 point difference considered clinically relevant |
| *The risk in the intervention group (and its 95% confidence interval) is based on the assumed risk in the comparison group and the relative effect of the intervention (and its 95% CI). | ||||||
| GRADE Working Group grades of evidence | ||||||
| Outcome or subgroup title | No. of studies | No. of participants | Statistical method | Effect size |
| 1 Cardiovascular mortality (RR) Show forest plot | 3 | 1046 | Risk Ratio (M‐H, Fixed, 95% CI) | 0.78 [0.62, 0.99] |
| 2 Heart failure hospitalisation (RR) Show forest plot | 4 | 449 | Risk Ratio (M‐H, Fixed, 95% CI) | 0.73 [0.47, 1.13] |
| 2.1 Follow‐up < 12 months | 1 | 67 | Risk Ratio (M‐H, Fixed, 95% CI) | 0.31 [0.09, 1.02] |
| 2.2 Follow‐up ≥ 12 months | 2 | 285 | Risk Ratio (M‐H, Fixed, 95% CI) | 0.79 [0.48, 1.31] |
| 2.3 Follow‐up unknown | 1 | 97 | Risk Ratio (M‐H, Fixed, 95% CI) | 5.31 [0.26, 107.85] |
| 3 All‐cause mortality (RR) Show forest plot | 4 | 1105 | Risk Ratio (M‐H, Fixed, 95% CI) | 0.82 [0.67, 1.00] |
| 4 Quality of life (Minnesota) Show forest plot | 1 | Mean Difference (IV, Fixed, 95% CI) | Totals not selected | |
| 5 Withdrawal due to adverse event Show forest plot | 2 | 338 | Risk Ratio (M‐H, Fixed, 95% CI) | 18.07 [2.45, 133.04] |
| Outcome or subgroup title | No. of studies | No. of participants | Statistical method | Effect size |
| 1 Cardiovascular mortality (RR) Show forest plot | 3 | 4070 | Risk Ratio (M‐H, Fixed, 95% CI) | 0.90 [0.74, 1.11] |
| 2 Heart failure hospitalisation (RR) Show forest plot | 3 | 3714 | Risk Ratio (M‐H, Fixed, 95% CI) | 0.82 [0.69, 0.98] |
| 2.1 Follow‐up < 12 months | 1 | 44 | Risk Ratio (M‐H, Fixed, 95% CI) | 0.55 [0.05, 5.61] |
| 2.2 Follow‐up ≥ 12 months | 2 | 3670 | Risk Ratio (M‐H, Fixed, 95% CI) | 0.82 [0.69, 0.98] |
| 3 Heart failure hospitalisation (HR) Show forest plot | 2 | 3670 | Hazard Ratio (Fixed, 95% CI) | 0.82 [0.69, 0.98] |
| 4 Hyperkalaemia Show forest plot | 6 | 4291 | Risk Ratio (M‐H, Fixed, 95% CI) | 2.11 [1.77, 2.51] |
| 5 All‐cause mortality (RR) Show forest plot | 5 | 4207 | Risk Ratio (M‐H, Fixed, 95% CI) | 0.91 [0.78, 1.06] |
| 6 Quality of life Show forest plot | 5 | 603 | Std. Mean Difference (IV, Random, 95% CI) | 0.05 [‐0.23, 0.34] |
| 7 Quality of life (KCCQ) Show forest plot | 2 | 92 | Mean Difference (IV, Random, 95% CI) | ‐0.78 [‐28.02, 26.46] |
| 8 Quality of life (Minnesota) Show forest plot | 3 | 511 | Mean Difference (IV, Random, 95% CI) | 0.84 [‐2.30, 3.98] |
| 9 Withdrawal due to adverse event Show forest plot | 4 | 3986 | Risk Ratio (M‐H, Fixed, 95% CI) | 1.10 [1.00, 1.21] |
| Outcome or subgroup title | No. of studies | No. of participants | Statistical method | Effect size |
| 1 Cardiovascular mortality (RR) Show forest plot | 2 | 945 | Risk Ratio (M‐H, Fixed, 95% CI) | 0.93 [0.61, 1.42] |
| 2 Heart failure hospitalisation (RR) Show forest plot | 3 | 1019 | Risk Ratio (M‐H, Fixed, 95% CI) | 0.86 [0.64, 1.15] |
| 2.1 Follow‐up < 12 months | 1 | 74 | Risk Ratio (M‐H, Fixed, 95% CI) | 0.42 [0.09, 2.04] |
| 2.2 Follow‐up ≥ 12 months | 2 | 945 | Risk Ratio (M‐H, Fixed, 95% CI) | 0.88 [0.66, 1.19] |
| 3 Hyperkalaemia Show forest plot | 1 | Risk Ratio (M‐H, Fixed, 95% CI) | Totals not selected | |
| 4 All‐cause mortality (RR) Show forest plot | 4 | 1079 | Risk Ratio (M‐H, Fixed, 95% CI) | 0.99 [0.71, 1.38] |
| 5 Quality of life (Minnesota) Show forest plot | 2 | 154 | Mean Difference (IV, Fixed, 95% CI) | ‐0.09 [‐3.66, 3.48] |
| 6 Withdrawal due to adverse event Show forest plot | 3 | 1019 | Risk Ratio (M‐H, Random, 95% CI) | 1.53 [0.26, 9.00] |
| Outcome or subgroup title | No. of studies | No. of participants | Statistical method | Effect size |
| 1 Cardiovascular mortality (RR) Show forest plot | 3 | 7254 | Risk Ratio (M‐H, Fixed, 95% CI) | 1.02 [0.90, 1.14] |
| 2 Cardiovascular mortality (HR) Show forest plot | 2 | 5087 | Hazard Ratio (Fixed, 95% CI) | 1.00 [0.89, 1.13] |
| 3 Heart failure hospitalisation (RR) Show forest plot | 3 | 7254 | Risk Ratio (M‐H, Fixed, 95% CI) | 0.92 [0.83, 1.02] |
| 4 Heart failure hospitalisation (HR) Show forest plot | 2 | 7148 | Hazard Ratio (Fixed, 95% CI) | 0.90 [0.80, 1.01] |
| 5 Hyperkalaemia Show forest plot | 2 | 7148 | Risk Ratio (M‐H, Fixed, 95% CI) | 1.88 [1.07, 3.33] |
| 6 All‐cause mortality (RR) Show forest plot | 4 | 7964 | Risk Ratio (M‐H, Fixed, 95% CI) | 1.01 [0.92, 1.11] |
| 7 All‐cause mortality (HR) Show forest plot | 2 | 4838 | Hazard Ratio (Fixed, 95% CI) | 0.99 [0.88, 1.12] |
| 8 Quality of life (Minnesota) Show forest plot | 3 | 3117 | Mean Difference (IV, Fixed, 95% CI) | 0.41 [‐0.86, 1.67] |
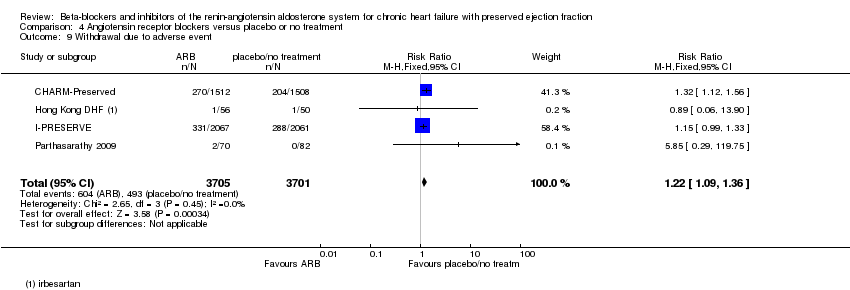
| 9 Withdrawal due to adverse event Show forest plot | 4 | 7406 | Risk Ratio (M‐H, Fixed, 95% CI) | 1.22 [1.09, 1.36] |