Penyekat‐beta dan perencat sistem renin‐angiotensin aldosteron untuk kegagalan jantung kronik dengan ejeksi pecahan terpelihara
Abstract
Background
Beta‐blockers and inhibitors of the renin‐angiotensin aldosterone system improve survival and reduce morbidity in people with heart failure with reduced left ventricular ejection fraction. There is uncertainty whether these treatments are beneficial for people with heart failure with preserved ejection fraction and a comprehensive review of the evidence is required.
Objectives
To assess the effects of beta‐blockers, angiotensin converting enzyme inhibitors, angiotensin receptor blockers, angiotensin receptor neprilysin inhibitors, and mineralocorticoid receptor antagonists in people with heart failure with preserved ejection fraction.
Search methods
We searched CENTRAL, MEDLINE, Embase and two clinical trial registries on 25 July 2017 to identify eligible studies. Reference lists from primary studies and review articles were checked for additional studies. There were no language or date restrictions.
Selection criteria
We included randomised controlled trials with a parallel group design enrolling adult participants with heart failure with preserved ejection fraction, defined by a left ventricular ejection fraction of greater than 40 percent.
Data collection and analysis
Two review authors independently selected studies for inclusion and extracted data. The outcomes assessed included cardiovascular mortality, heart failure hospitalisation, hyperkalaemia, all‐cause mortality and quality of life. Risk ratios (RR) and, where possible, hazard ratios (HR) were calculated for dichotomous outcomes. For continuous data, mean difference (MD) or standardised mean difference (SMD) were calculated. We contacted trialists where neccessary to obtain missing data.
Main results
37 randomised controlled trials (207 reports) were included across all comparisons with a total of 18,311 participants.
Ten studies (3087 participants) investigating beta‐blockers (BB) were included. A pooled analysis indicated a reduction in cardiovascular mortality (15% of participants in the intervention arm versus 19% in the control arm; RR 0.78; 95% confidence interval (CI) 0.62 to 0.99; number needed to treat to benefit (NNTB) 25; 1046 participants; 3 studies). However, the quality of evidence was low and no effect on cardiovascular mortality was observed when the analysis was limited to studies with a low risk of bias (RR 0.81; 95% CI 0.50 to 1.29; 643 participants; 1 study). There was no effect on all‐cause mortality, heart failure hospitalisation or quality of life measures, however there is uncertainty about these effects given the limited evidence available.
12 studies (4408 participants) investigating mineralocorticoid receptor antagonists (MRA) were included with the quality of evidence assessed as moderate. MRA treatment reduced heart failure hospitalisation (11% of participants in the intervention arm versus 14% in the control arm; RR 0.82; 95% CI 0.69 to 0.98; NNTB 41; 3714 participants; 3 studies; moderate‐quality evidence) however, little or no effect on all‐cause and cardiovascular mortality and quality of life measures was observed. MRA treatment was associated with a greater risk of hyperkalaemia (16% of participants in the intervention group versus 8% in the control group; RR 2.11; 95% CI 1.77 to 2.51; 4291 participants; 6 studies; high‐quality evidence).
Eight studies (2061 participants) investigating angiotensin converting enzyme inhibitors (ACEI) were included with the overall quality of evidence assessed as moderate. The evidence suggested that ACEI treatment likely has little or no effect on cardiovascular mortality, all‐cause mortality, heart failure hospitalisation, or quality of life. Data for the effect of ACEI on hyperkalaemia were only available from one of the included studies.
Eight studies (8755 participants) investigating angiotensin receptor blockers (ARB) were included with the overall quality of evidence assessed as high. The evidence suggested that treatment with ARB has little or no effect on cardiovascular mortality, all‐cause mortality, heart failure hospitalisation, or quality of life. ARB was associated with an increased risk of hyperkalaemia (0.9% of participants in the intervention group versus 0.5% in the control group; RR 1.88; 95% CI 1.07 to 3.33; 7148 participants; 2 studies; high‐quality evidence).
We identified a single ongoing placebo‐controlled study investigating the effect of angiotensin receptor neprilysin inhibitors (ARNI) in people with heart failure with preserved ejection fraction.
Authors' conclusions
There is evidence that MRA treatment reduces heart failure hospitalisation in heart failure with preserverd ejection fraction, however the effects on mortality related outcomes and quality of life remain unclear. The available evidence for beta‐blockers, ACEI, ARB and ARNI is limited and it remains uncertain whether these treatments have a role in the treatment of HFpEF in the absence of an alternative indication for their use. This comprehensive review highlights a persistent gap in the evidence that is currently being addressed through several large ongoing clinical trials.
PICO
Ringkasan bahasa mudah
Penyekat‐beta dan perencat sistem renin‐angiotensin aldosteron untuk kegagalan jantung kronik dengan ejeksi pecahan terpelihara
Soalan ulasan
Kami menyiasat kesan‐kesan penyekat‐beta (BB), antagonis reseptor mineralokortikoid (MRA), perencat enzim penukaran angiotensin (ACEI), penyekat reseptor angiotensin (ARB) dan perencat neprilysin reseptor angiotensin (ARNI) ke atas kelangsungan hidup, kemasukan ke hospital kerana kegagalan jantung, kualiti hidup dan tahap kalium dalam orang dengan kegagalan jantung dengan ejeksi pecahan terpelihara.
Latar belakang
Kegagalan jantung adalah keadaan biasa yang berlaku apabila fungsi otot jantung merosot dikaitkan dengan simptom sesak nafas dan keletihan, dan pengurangan kelangsungan hidup. Dalam kira‐kira separuh kes yang mana terdapat pengurangan kontraksi (kegagalan jantung dengan pengurangan ejeksi pecahan, HFrEF), beberapa rawatan yang diketahui berkesan dalam menambah baik kelangsungan hidup dan mengurangkan hospitalisasi. Dalam kes yang selebihnya yang mana relaksasi merosot (kegagalan jantung dengan ejeksi pecahan terpelihara, HFpEF), adalah tidak jelas sama ada rawatan ubat yang sama juga berkesan dalam menambah baik hasil.
Kriteria pemilihan
Kami menyiasat sama ada rawatan HFrEF juga berkesan dalam HFpEF. Kami menjalankan kajian yang menyeluruh bagi semua kajian yang menyelidik BB, MRA, ACEI, ARB atau ARNI (bukti terkini hingga 25 Julai 2017).
Keputusan dan kesimpulan
Kami menyertakan 10 kajian dengan 3087 peserta yang dirawakkan bagi BB, 12 kajian dengan 4408 peserta yang dirawakkan bagi MRA, lapan kajian dengan 2061 peserta yang dirawakkan bagi ACEI dan lapan kajian dengan 8755 peserta yang dirawakkan bagi ARB. Kami menggabungkan bukti ke dalam analisis terkumpul bagi setiap kelas ubat dan bagi setiap hasil yang dinilai. Tidak semua kajian yang disertakan adalah sebahagian daripada setiap analisis.
Kami mendapati penyekat‐beta mungkin memperbaiki mortaliti kardiovaskular, tetapi kualiti bukti adalah rendah kerana kajian yang kecil dan ketidakpastian tentang kaedah yang digunakan. Bagi MRA, keputusan mencadangkan pengurangan hospitalisasi kegagalan jantung mempunyai sedikit atau tiada kesan terhadap mortaliti kardiovaskular dan semua sebab, tetapi kualiti bukti adalah sederhana. Bagi ACEI, rawatan mungkin mempunyai sedikit atau tiada kesan ke atas hasil mortaliti kardiovaskular, kematian semua sebab dan hospitalisasi kegagalan jantung, tetapi kualiti bukti adalah hanya sederhana. Kami menemui bukti kualiti yang tinggi bagi rawatan ARB dan keputusan mencadangkan sedikit atau tiada kesan daripada rawatan ini. Tiada kajian yang lengkap disediakan bagi ARNI. Rawatan dengan MRA dan ARB didapati meningkatkan risiko kalium yang tinggi dalam darah.
Kesimpulannya, BB mungkin menambah baik hasil dalam pesakit dengan HFpEF tetapi ia kekal tidak pasti. MRA didapati menyebabkan sedikit pengurangan dalam risiko hospitalisasi kerana kegagalan jantung. Rawatan dengan ACEI berkemungkinan tidak mempunyai kesan, tetapi masih tidak pasti. Bukti mencadangkan rawatan dengan ARB mempunyai sedikit atau tiada manfaat dalam orang dengan HFpEF.
Kualiti bukti
Kualiti bukti berkisar daripada tinggi ke rendah merentasi hasil dan kelas ubat yang dikaji. Kecuali ARB, terdapat kekurangan kajian HFpEF berskala besar bagi intervensi dan hasil yang diuji.
Authors' conclusions
Summary of findings
| Beta‐blockers compared to placebo or no treatment for chronic heart failure with preserved ejection fraction | ||||||
| Patient or population: chronic heart failure with preserved ejection fraction | ||||||
| Outcomes | Anticipated absolute effects* (95% CI) | Relative effect | № of participants | Certainty of the evidence | Comments | |
| Risk with placebo/no treatment | Risk with Beta‐blockers | |||||
| Cardiovascular mortality (RR) | Study population | RR 0.78 | 1046 | ⊕⊕⊝⊝ | Three additional studies (ELANDD; SWEDIC; Takeda 2004) reported that no deaths occurred | |
| 173 per 1000 | 135 per 1000 | |||||
| Heart failure hospitalisation (RR) | Study population | RR 0.73 | 449 | ⊕⊝⊝⊝ | Follow‐up unclear for SWEDIC. ELANDD reported that no hospitalisation due to heart failure occurred | |
| 117 per 1000 | 86 per 1000 | |||||
| Hyperkalaemia | 245 (1 RCT) | ⊕⊝⊝⊝ | J‐DHF reported one participant in the intervention group (N = 120) experienced hyperkalaemia but did not report on this outcome for the control group. No further data were available from any of the other studies. | |||
| All‐cause mortality (RR) | Study population | RR 0.82 | 1105 | ⊕⊕⊝⊝ | Follow‐up unclear for Adamyan 2010. ELANDD, SWEDIC and Takeda 2004 reported that no deaths occurred | |
| 243 per 1000 | 199 per 1000 | |||||
| Quality of life (Minnesota) | Mean quality of life (Minnesota) was 24 | MD 1 lower | ‐ | 93 | ⊕⊝⊝⊝ | Lower = better, 5 point difference considered to be clinically meaningful |
| *The risk in the intervention group (and its 95% confidence interval) is based on the assumed risk in the comparison group and the relative effect of the intervention (and its 95% CI). | ||||||
| GRADE Working Group grades of evidence | ||||||
| 1 Downgraded by one level due to unclear selection bias in most studies. 2 Downgraded by one level due to concerns about the smaller study being more precise than the larger study. 3 Downgraded by one level due to large variation in size of effect. 4 Downgraded by two levels due to few events and wide CI. 5 Downgraded by two levels due to very small sample size. 6 Suspected publication bias; this is a patient‐relevant outcome that is not reported in most studies. 7 Downgraded by two levels due to incomplete reporting. | ||||||
| MRA compared to placebo or no treatment for chronic heart failure with preserved ejection fraction | ||||||
| Patient or population: chronic heart failure with preserved ejection fraction | ||||||
| Outcomes | Anticipated absolute effects* (95% CI) | Relative effect | № of participants | Certainty of the evidence | Comments | |
| Risk with placebo/no treatment | Risk with MRA | |||||
| Cardiovascular mortality (RR) | Study population | RR 0.90 | 4070 | ⊕⊕⊕⊝ | Two additional trials (RAAM‐PEF, Kurrelmeyer 2014) reported that no deaths occurred | |
| 88 per 1000 | 79 per 1000 | |||||
| Heart failure hospitalisation (RR) | Study population | RR 0.82 | 3714 | ⊕⊕⊕⊝ | Three additional trials (ALDO‐DHF ,Kurrelmeyer 2014, Upadhya 2017) reported that no hospitalisation due to heart failure occurred | |
| 136 per 1000 | 112 per 1000 | |||||
| Hyperkalaemia | Study population | RR 2.11 | 4291 | ⊕⊕⊕⊕ | Two trials defined hyperkalaemia ≥ 5.5 mEg/L | |
| 83 per 1000 | 175 per 1000 | |||||
| All‐cause mortality | Study population | RR 0.91 | 4207 | ⊕⊕⊕⊝ | Two additional trials (RAAM‐PEF, Kurrelmeyer 2014) reported that no deaths occurred | |
| 133 per 1000 | 121 per 1000 | |||||
| Quality of life (Minnesota) | Mean quality of life (Minnesota) ranged from 20 to 25 | MD 0.84 higher | ‐ | 511 | ⊕⊕⊝⊝ | Lower = better, 5 points are considered a clinically significant difference We did not pre‐specify which QoL scale was to be reported in the 'Summary of findings' table. To aid comparisons among 'Summary of findings' tables we chose to include the Minnesota Living with Heart Failure questionnaire and not the SMD across two scales |
| *The risk in the intervention group (and its 95% confidence interval) is based on the assumed risk in the comparison group and the relative effect of the intervention (and its 95% CI). | ||||||
| GRADE Working Group grades of evidence | ||||||
| 1 Downgraded by one level due to imprecision. 2 Downgraded by one level because one trial was open label. 3 Downgraded by one level due to small sample size. | ||||||
| ACEI compared to placebo or no treatment for chronic heart failure with preserved ejection fraction | ||||||
| Patient or population: chronic heart failure with preserved ejection fraction | ||||||
| Outcomes | Anticipated absolute effects* (95% CI) | Relative effect | № of participants | Certainty of the evidence | Comments | |
| Risk with placebo/no treatment | Risk with ACEI | |||||
| Cardiovascular mortality (RR) | Study population | RR 0.93 | 945 | ⊕⊕⊕⊝ | One additional trial (Kitzman 2010) reported that no deaths occurred | |
| 86 per 1000 | 81 per 1000 | |||||
| Heart failure hospitalisation (RR) | Study population | RR 0.86 | 1019 | ⊕⊕⊕⊝ | ||
| 13 per 1000 | 11 per 1000 | |||||
| Hyperkalaemia | 74 (1 RCTs) | ⊕⊝⊝⊝ | One trial (Zi 2003) reported 2 events in the intervention group (N = 36), 0 events in the control group (N = 38) (RR 5.27, 95% CI 0.26 to 106.16) | |||
| All‐cause mortality (RR) | Study population | RR 0.99 | 1079 | ⊕⊕⊕⊝ | One additional trial (Kitzman 2010) reported that no deaths occurred | |
| 119 per 1000 | 119 per 1000 | |||||
| Quality of life (Minnesota) | Mean quality of life (Minnesota) ranged from 10.9 to 29 | MD 0.09 lower | ‐ | 154 | ⊕⊕⊝⊝ | Scale: 0 to 105, lower = better, 5 point difference considered clinically relevant One trial (SNEGOVIK) reported mean change from baseline of ‐19.8 for intervention and ‐10.7 for control |
| *The risk in the intervention group (and its 95% confidence interval) is based on the assumed risk in the comparison group and the relative effect of the intervention (and its 95% CI). | ||||||
| GRADE Working Group grades of evidence | ||||||
| 1 Downgraded by one level due to wide CI. 2 Downgraded by one level due to risk of bias (open label). 3 Downgraded by one level due to low sample size. 4 Downgraded by one level due to unclear selection bias. | ||||||
| ARB compared to placebo or no treatment for chronic heart failure with preserved ejection fraction | ||||||
| Patient or population: chronic heart failure with preserved ejection fraction | ||||||
| Outcomes | Anticipated absolute effects* (95% CI) | Relative effect | № of participants | Certainty of the evidence | Comments | |
| Risk with placebo/no treatment | Risk with ARB | |||||
| Cardiovascular mortality (RR) | Study population | RR 1.02 | 7254 | ⊕⊕⊕⊕ | One additional trial (Parthasarathy 2009) reported that no deaths occurred | |
| 131 per 1000 | 133 per 1000 | |||||
| Heart failure hospitalisation (RR) | Study population | RR 0.92 | 7254 | ⊕⊕⊕⊕ | ||
| 171 per 1,‐000 | 157 per 1,‐000 | |||||
| Hyperkalaemia | Study population | RR 1.88 | 7148 | ⊕⊕⊕⊕ | ||
| 3 per 1,000 | 5 per 1,000 | |||||
| All‐cause mortality (RR) | Study population | RR 1.01 | 7964 | ⊕⊕⊕⊕ | One additional trial (Parthasarathy 2009) reported that no deaths occurred | |
| 72 per 1000 | 73 per 1,‐000 | |||||
| Quality of life (Minnesota) | Mean quality of life (Minnesota) ranged from 10.9 to 31.6 | MD 0.41 higher | ‐ | 3117 | ⊕⊕⊕⊕ | Scale: 0 to 105, lower = better, 5 point difference considered clinically relevant |
| *The risk in the intervention group (and its 95% confidence interval) is based on the assumed risk in the comparison group and the relative effect of the intervention (and its 95% CI). | ||||||
| GRADE Working Group grades of evidence | ||||||
Background
Description of the condition
Heart failure is a clinical syndrome characterised by breathlessness and fatigue that results when abnormalities of cardiac structure and function lead to inadequate cardiac output, or elevated ventricular filling pressures, or both (Ponikowski 2016). Based on available data from the United States and Europe, the prevalence of heart failure is estimated from 1% to 12% of the adult population and is projected to increase with population aging and improved survival from cardiovascular disease (Roger 2013). Heart failure is a significant public health problem accounting for 5% of emergency hospital admissions in the United Kingdom, and is associated with significant mortality with five‐year survival estimated at 50% (NICE 2010). Heart failure is classified according to the left ventricular ejection fraction (LVEF) into heart failure with reduced ejection fraction (HFrEF, typically considered as LVEF < 40%), and heart failure with preserved ejection fraction (HFpEF, typically LVEF > 40%). Recently, an intermediate subgroup was defined by the European Society of Cardiology as heart failure with mid‐range ejection fraction (HFmrEF) defined as LVEF 40% to 49% (Ponikowski 2016). This was defined by the American College of Cardiology as borderline HFpEF, defined as LVEF 41% to 49% (Yancy 2013). In this review, we defined HFpEF as LVEF > 40% because completed and ongoing HFpEF trials have used a range of LVEF cut‐offs between 40% and 50%. HFpEF accounts for approximately half of all cases of heart failure; mortality outcomes are similar to those for HFrEF (Gerber 2015).
Description of the intervention
Neurohumoral inhibition with beta‐blockers (BB), angiotensin converting enzyme inhibitors (ACEI), and mineralocorticoid receptor antagonists (MRAs) leads to improved survival and a reduction in hospitalisations for heart failure in people with HFrEF (CIBIS Investigators 1999; Consensus Trial Study Group 1987; Flather 2005; Hjalmarson 2000; Kotecha 2014; MERIT‐HF Study Group 1999; Packer 1999; Packer 2002; Packer 2001; Pitt 1999; Ponikowski 2016; SOLVD Investigators 1991; SOLVD Investigators 1992; Zannad 2011). Where ACEI or MRA are contra‐indicated or not tolerated, angiotensin receptor antagonists (ARB) are recommended as an alternative for either, although evidence is limited (Granger 2003). Angiotensin receptor neprilysin inhibitors (ARNI) are recommended as an alternative to ACEI with superior efficacy in people with HFrEF who remain symptomatic despite optimal therapy (McMurray 2014). Although neurohumoral activation is observed in HFpEF (Hogg 2005), comparatively fewer clinical trials of neurohumoral inhibitor therapies have been performed in this population. The existing evidence from individual trials of BB, MRA, ACEI, ARB or MRAs in people with HFpEF does not support a reduction in mortality with these treatments (Ponikowski 2016). However, limited evidence indicates that candesartan (an ARB) (Yusuf 2003) and spironolactone (an MRA) (Pitt 2014) may be effective in reducing numbers of people hospitalised with heart failure.
This review sought to determine whether neurohumoral inhibition with therapies that improve mortality and morbidity in those with HFrEF (BB, MRA, ACEI, ARB, and ARNI) have similar benefit in people with HFpEF.
How the intervention might work
In people with HFpEF, inadequate cardiac function triggers compensatory neurohumoral responses similar to those observed in HFrEF (Hogg 2005). Activation of the renin‐angiotensin aldosterone system (RAAS) and increased tone of the sympathetic nervous system may be adaptive in the short term; however, chronic activation is likely to be detrimental. Pre‐clinical disease models of HFpEF suggest that RAAS activation leads to maladaptive hypertrophy and fibrosis (Sharma 2014). ACEIs, ARBs or MRAs inhibit components of the RAAS system to counter the over activation that occurs in people with heart failure. ARNIs combine inhibition of RAAS with an ARB (valsartan) with augmentation of the natriuretic peptide system by inhibition of neprilysin (sacubitril). Neprilysin is a neutral endopeptidase that degrades a number of endogenous vasoactive peptides serving to counteract some of the effects of RAAS activation (McMurray 2014). The beneficial effects of beta‐blocker therapy in people with HFrEF are likely to be mediated by a reduction in the detrimental effects of increased sympathetic tone that may include increased heart rate, adverse myocardial energetics, and stimulation of RAAS (Sackner‐Bernstein 1995). These mechanisms may also be important in HFpEF and the effect of beta‐blockers to increase diastolic filling time may be particularly important (Sharma 2014). The population of people with HFpEF is heterogeneous, both with respect to disease aetiology and comorbidity. However, it is possible that neurohumoral activation represents a common pathophysiological mechanism that could be successfully targeted to improve clinical outcomes in people with heart failure across the spectrum of LVEF.
Why it is important to do this review
There is uncertainty as to whether beta‐blockers or RAAS inhibitors are effective at reducing mortality and heart failure hospitalisation and improving quality of life in people with HFpEF. Guidelines offer no specific treatment recommendations regarding the use of these therapies beyond the management of comorbidities, aside from a recommendation for the use of ARBs to reduce hospitalisations (IIb recommendation, Yancy 2013) and for the use of MRAs (weak recommendation; moderate‐quality evidence, Ezekowitz 2017). The UK's National Institute for Health and Care Excellence (NICE) highlighted a review of the evidence as a research priority (NICE 2010).
A recent systematic review and meta‐analysis of pharmacotherapy in HFpEF included beta‐blockers and RAAS inhibitors (ACEI, ARB and MRA) and suggested a reduction in cardiovascular and all‐cause mortality with beta‐blocker therapy (Zheng 2017). An updated review with a more comprehensive search strategy is needed to inform new guideline recommendations and to inform the conduct of further clinical trials.
Objectives
To assess the effects of beta‐blockers, angiotensin converting enzyme inhibitors, angiotensin receptor blockers, angiotensin receptor neprilysin inhibitors, and mineralocorticoid receptor antagonists in people with heart failure with preserved ejection fraction.
Methods
Criteria for considering studies for this review
Types of studies
We included randomised controlled trials (RCTs) with parallel group design. We excluded cross‐over trials because we considered these to be inappropriate for our review question due to the progressive nature of heart failure.
Studies published in full‐text or as abstracts, or available only as unpublished data, were eligible for inclusion.
Types of participants
We included studies with adult participants (aged ≥ 18 years) with HFpEF defined by a left ventricular ejection fraction of greater than 40 percent (LVEF > 40%). It was recognised there was likely to be significant heterogeneity between study populations relating to the disease definition and a narrative summary is included in the Discussion. We contacted study authors to obtain data on the subgroup of interest for studies with mixed populations in relation to ejection fraction.
Types of interventions
We performed separate meta‐analyses of studies that compared BB, MRA, ACEI, or ARB, in addition to standard care, with placebo or no treatment control. We did not perform a meta‐analysis of ARNI because no trials were identified.
Types of outcome measures
Primary outcomes
-
Cardiovascular mortality.
-
Heart failure hospitalisation.
-
Hyperkalaemia.
Secondary outcomes
-
All‐cause mortality.
-
Quality of life (measured using either the Minnesota Living With Heart Failure Questionnaire or Kansas City Cardiomyopathy Questionnaire).
-
Withdrawal due to adverse event (hypotension, hyperkalaemia or renal impairment).
Reporting one of more of the listed outcomes in the trial was not an inclusion criterion for the review. We assessed outcomes at the longest reported follow‐up.
Search methods for identification of studies
Electronic searches
We identified trials through systematic searches of the following bibliographic databases on 25 July 2017:
-
Cochrane Central Register of Controlled Trials (CENTRAL) in the Cochrane Library (Wiley, Issue 6, June 2017);
-
MEDLINE (Ovid, 1946 to July Week 2 2017);
-
MEDLINE In‐Process & Other Non‐Indexed Citations, Epub Ahead of Print (Ovid, 24 July 2017); and
-
Embase and Embase Classic (embase.com, 1974 to 25 July 2017).
The search strategies used are included in Appendix 1. We applied the Cochrane sensitivity‐maximising RCT filter (Lefebvre 2011) to the main segment of MEDLINE (Ovid) (point 2 above) but did not use the filter when searching the MEDLINE Epub and In‐Process database segments. We used the multi‐term Embase filter with the best optimisation of sensitivity and specificity (Wong 2006) translated from Ovid to embase.com syntax.
We did not impose any restriction on language of publication.
Searching other resources
We searched ClinicalTrials.gov (https://clinicaltrials.gov/) and the World Health Organization (WHO) International Clinical Trials Registry Platform (ICTRP) Search Portal (http://apps.who.int/trialsearch/) on 25 July 2017 to identify ongoing and unpublished trials. Search terms for the trials registers are also listed in Appendix 1.
We checked all primary references of included studies and systematic reviews for additional references. For any studies identified as eligible from clinical trial register records, we searched for the trials registry number on PubMed for publications about this study.
We contacted study authors to clarify details or obtain additional information not included in the published reports.
Data collection and analysis
Selection of studies
Two review authors (KM and NM) independently screened titles and abstracts of all records identified in our search and coded them as 'retrieve' (eligible or potentially eligible/unclear) or 'do not retrieve'. In the event of disagreement, a third review author was asked to arbitrate (TL). We then retrieved the full‐text study reports for records identified as eligible, potentially eligible or unclear. Two review authors (KM and NM) independently screened the full‐text and identified studies for inclusion. We recorded reasons for exclusion of ineligible studies. We resolved any disagreement by consensus or consulted a third review author (TL). We identified and excluded duplicates and collated multiple reports of the same study so that each study rather than each report is the unit of interest in the review. We recorded the selection process and completed a PRISMA flow diagram (Figure 1) and Characteristics of excluded studies table.
Study flow diagram
Data extraction and management
We used a data collection form to record study characteristics and outcome data from included studies, which had been piloted on two studies in the review (PEP‐CHF; TOPCAT). Some modifications were made after the pilot phase. Two review authors (NM and TL) extracted study characteristics from included studies as follows:
-
Methods: study design, duration of follow‐up, details of any 'run in' period, number of study centres and location, study setting, withdrawals, and start/end date of enrolment.
-
Participants: N randomised/withdrawn/lost to follow‐up/analysed, mean age/age range, % male, inclusion criteria, exclusion criteria, systolic blood pressure, heart rate, body mass index, serum creatinine, B‐type natriuretic peptide, NT pro B‐type natriuretic peptide, LVEF, New York Heart Association (NYHA) class, comorbidity (hypertension, diabetes, atrial fibrillation, hospitalisation for heart failure, coronary heart disease, stroke, medications at baseline).
-
Interventions: intervention, comparison, concomitant medications (diuretic, digoxin, BB, ACEI, ARB, MRA).
-
Outcomes: planned and reported.
-
Notes: sources of funding, and notable conflicts of interest of trial authors.
Two review authors (NM and TL) independently extracted outcome data from included studies. Disagreements were resolved by consensus. One review author (NM) transferred data into the Review Manager (RevMan 2014) file. One review author (TL) double‐checked that data were entered correctly by comparing the data presented in the systematic review with the data extraction sheet.
Assessment of risk of bias in included studies
Two review authors (NM and TL) independently assessed risk of bias for each study using the criteria outlined in the Cochrane Handbook for Systematic Reviews of Interventions (Higgins 2011). Disagreements were resolved by consensus. We assessed the risk of bias according to the following domains.
-
Random sequence generation.
-
Allocation concealment.
-
Blinding of participants and personnel.
-
Blinding of outcome assessment.
-
Incomplete outcome data.
-
Selective outcome reporting.
-
Other bias.
We judged each potential source of bias as high, low or unclear and provided quotes from study reports together with justification for our judgment in the 'Risk of bias' table. We summarised the 'Risk of bias' judgements across different studies for each of the domains listed. Where information on risk of bias related to unpublished data or correspondence with a trialist, we noted this in the 'Risk of bias' table.
When considering treatment effects in the pooled analysis, we accounted for risk of bias for the studies that contributed to each outcome tested.
Assessment of bias in conducting the systematic review
We conducted the review according to the published protocol and reported protocol deviations in the Differences between protocol and review section.
Measures of treatment effect
We analysed dichotomous data as risk ratios (RR) with 95% confidence intervals (CI) and continuous data as mean difference (MD) or standardised mean difference (SMD) with 95% CIs. We analysed mortality data as hazard ratios (HR). We used SMD for one analysis when combining quality of life data reported for two different scales. We entered data presented as a scale with a consistent direction of effect.
Unit of analysis issues
We included one three‐arm trial (Hong Kong DHF); because two intervention arms contributed to two separate comparisons, no unit of analysis issue arose.
Dealing with missing data
We contacted investigators or study sponsors to verify key study characteristics and obtain missing numerical outcome data where possible.
Assessment of heterogeneity
We used the I² statistic to measure heterogeneity among the trials in each analysis. We considered possible causes in cases of substantial heterogeneity (I² ≥ 50%).
Assessment of reporting biases
We pooled fewer than 10 trials for each comparison. Therefore, we did not examine funnel plots to explore possible small‐study biases for the primary outcomes.
Data synthesis
We undertook meta‐analyses only where this was meaningful, that is, if the treatments, participants and the underlying clinical question were similar enough for pooling to make sense. We used a fixed‐effect model in the absence of substantial heterogeneity (I² < 50%) and a random‐effects model when unexplained substantial heterogeneity was present (I² ≥ 50%). We applied a random‐effects model for quality of life analyses for MRA to account the high heterogeneity observed for the Kansas City Cardiomyopathy Questionnaire (KCCQ) (Analysis 2.7; I² = 86%) and to permit a combined analysis with outcome data from the Minnesota Living With Heart Failure Questionnaire (MLHFQ) (Analysis 2.6; I² = 50%).
We considered two relevant quality of life scales: the MLHFQ or KCCQ. The MLHFQ score has a range from 0 to 105, lower scores indicate better quality of life. The KCCQ score has a range from 0 to 100, higher scores indicate better quality of life. To account for the difference in the direction of the scale of the KCCQ, the mean values were multiplied by ‐1 (Cochrane Handbook for Systematic Reviews of Interventions, section 9.2.3.2, Deeks 2011). For the purpose of interpretation, we considered a five point difference in score as clinically significant for the MLHFQ (Rector 1995) and KCCQ (Spertus 2005).
'Summary of findings' table
We created 'Summary of findings' tables for each of our four interventions and included the following outcomes: cardiovascular mortality, heart failure hospitalisation, all‐cause mortality, quality of life (Minnesota Living with Heart Failure Questionnaire) and hyperkalaemia. We used the five GRADE considerations (study limitations, inconsistencies, imprecision, indirectness and publication bias) to assess the quality of the body of evidence as it related to the studies which contributed data to the meta‐analyses for the prespecified outcomes. We used methods and recommendations described in Section 8.5 and Chapter 12 of the Cochrane Handbook for Systematic Reviews of Interventions (Higgins 2011) using GRADEpro software (GRADEpro GDT). Four review authors assessed the quality of evidence (TL, NM, KM, CD). We documented our justification for decisions to downgrade the quality of evidence using footnotes.
Subgroup analysis and investigation of heterogeneity
We planned to carry out the following subgroup analyses.
-
Age.
-
Sex.
-
Heart failure with mid‐range ejection fraction (HFmrEF) LVEF 40% to 49% and preserved LVEF ≥ 50%.
-
Length of follow‐up < 12 months and ≥ 12 months.
We were only able to perform a subgroup analysis based on length of follow‐up because data for the prespecified subgroups were unavailable.
We used the outcomes cardiovascular mortality and hospitalisation for heart failure in subgroup analyses.
We used the formal test for subgroup interactions in Review Manager (RevMan 2014).
Sensitivity analysis
We performed a sensitivity analysis for risk of bias by performing a pooled analysis including only studies with a low risk of bias (where at least four of the six domains for bias assessment were judged to be low risk and no domain was at high risk of bias).
Results
Description of studies
Results of the search
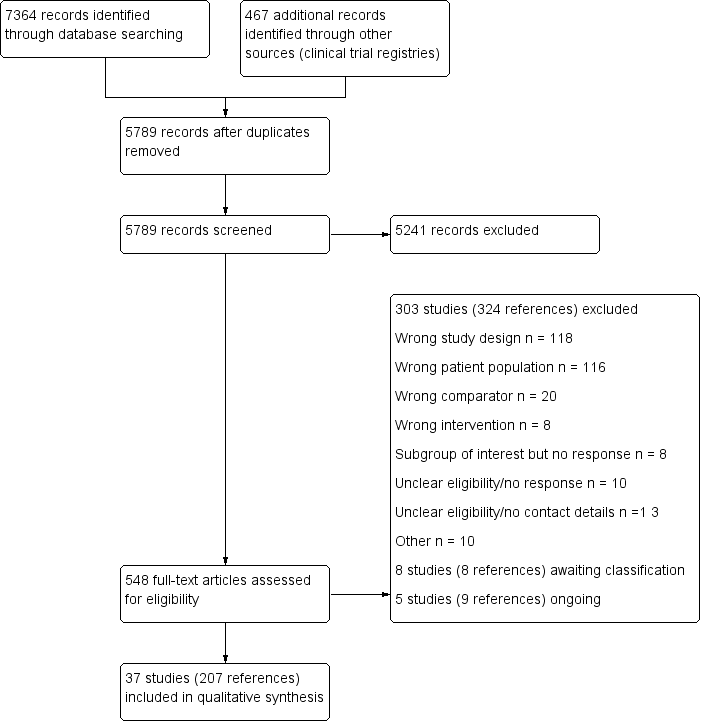
The database searches retrieved 7364 records and the search of clinical trial registries retrieved 467 records. After de‐duplication, 5789 records were screened by title and abstract. Of these, 5241 records did not meet the inclusion criteria and were excluded. The remaining 548 records were assessed for eligibility in full‐text and 303 studies (324 references) were excluded.
Included studies
We included 37 studies (207 reports) that involved a total of 18,311 participants.
Beta‐blockers
We included 10 studies (3087 participants) that investigated beta‐blockers for HFpEF. Of these, five studies compared beta‐blockers versus placebo (ELANDD; Mittal 2017; Sahoo 2016; SENIORS; SWEDIC) and five versus usual care (Adamyan 2010; Aronow 1997; J‐DHF; Shu 2005; Takeda 2004). Four studies investigated carvedilol: Adamyan 2010 (up to 50 mg daily), J‐DHF (up to 10 mg twice daily), SWEDIC (up to 25 mg twice daily or 50 mg twice daily in people weighing over 85 kg), Takeda 2004 (up to 20 mg daily). Two studies used nebivolol: ELANDD (up to 10 mg daily) and SENIORS (up to 10 mg daily). One study used propranolol: Aronow 1997 (30 mg, 3 times daily); and two studies investigated metoprolol succinate: Mittal 2017; Sahoo 2016 (up to 100 mg daily). Shu 2005 investigated bisoprolol (up to 10 mg daily).
Numbers of participants randomised ranged from 40 (Mittal 2017; Takeda 2004) to 643 (SENIORS).
Four were multicentre studies. ELANDD was conducted across 12 centres in eight countries in Europe; J‐DHF was assumed to have taken place in Japan; SENIORS took place in 11 countries (Czech Republic, France, Germany, Hungary, Italy, Netherlands, Romania, Spain, Switzerland, UK and Ukraine), and SWEDIC took place in 12 centres in Sweden. Mittal 2017 and Sahoo 2016 were each conducted in one centre in India. Adamyan 2010, Aronow 1997 and Shu 2005 did not report numbers of centres or countries, but we assumed that Adamyan 2010 likely took place in Armenia. Takeda 2004 was a single centre trial in Japan.
Three studies did not report LVEF of the included participants at baseline (Adamyan 2010; Shu 2005; SWEDIC). Six studies reported LVEF at baseline with a mean ranging from 56% to 63% (Aronow 1997; ELANDD; J‐DHF; Mittal 2017; Sahoo 2016; Takeda 2004). SENIORS included participants with a "clinical history of chronic HF with at least 1 of the following features: documented hospital admission within the previous 12 months with a discharge diagnosis of congestive HF or documented LVEF ≤ 35% within the previous 6 months". The SENIORS study reported a subgroup of participants with LVEF > 40% and these outcome data were used in our analysis (643 participants).
Most participants were NYHA class II (51% to 78%). Shu 2005 did not report participants' NYHA class at baseline. Participants' mean age ranged from 30 years to 81 years; six studies reported mean age less than 70 years (Adamyan 2010; ELANDD; Mittal 2017; Sahoo 2016; Shu 2005; SWEDIC) and four reported mean age above 70 years (Aronow 1997; J‐DHF; SENIORS; Takeda 2004).
Three studies were funded by industry (ELANDD; SENIORS; SWEDIC); two studies were funded by not‐for‐profit organisations (J‐DHF; Mittal 2017); and five did not report sources of funding (Adamyan 2010; Aronow 1997; Sahoo 2016; Shu 2005; Takeda 2004).
Mineralocorticoid receptor antagonists (MRA)
We included 12 studies that investigated MRAs for HFpEF. Of these, eight compared MRA versus placebo (ALDO‐DHF; AREA IN‐CHF; Kurrelmeyer 2014; Mottram 2004; RAAM‐PEF; STRUCTURE; TOPCAT; Upadhya 2017) and four versus usual care (Karapysh 2015; Mak 2009; Orea‐Tejeda 2007; Wang 2010). Nine studies investigated spironolactone (ALDO‐DHF; Kurrelmeyer 2014; Mottram 2004; STRUCTURE; Upadhya 2017 (25 mg/d); Karapysh 2015; Orea‐Tejeda 2007 (25 mg/d up‐titrated if tolerated to 50 mg/d); TOPCAT (15 mg/d, increased to a maximum of 45 mg/d); Wang 2010 (50 mg/d)). Two studies used eplerenone (Mak 2009; RAAM‐PEF (25 mg/d to a maximum of 50 mg/d)). AREA IN‐CHF investigated canrenone at a maximum dose of 50 mg/d.
Numbers of participants randomised ranged from 28 (Orea‐Tejeda 2007) to 3445 (TOPCAT). Four were multicentre trials; ALDO‐DHF included 10 centres in Germany and Austria; AREA IN‐CHF was conducted in 46 centres in Italy; STRUCTURE had centres in Poland (the number is unclear but publication states "of each centre"); and TOPCAT was conducted across 233 sites in six countries (Argentina, Brazil, Canada, Georgia, Russia, USA). Two studies were single‐centre trials in USA (Kurrelmeyer 2014; RAAM‐PEF). Mottram 2004 was a single centre trial in Australia. Wang 2010 was a single centre trial in Taiwan. Mak 2009 was a single‐centre trial but the country was unspecified. Three trials did not report on numbers of centres or countries (Karapysh 2015; Orea‐Tejeda 2007; Upadhya 2017).
Two studies (Karapysh 2015; Mottram 2004) did not report participants' LVEF at baseline. AREA IN‐CHF had a mean LVEF at baseline of 39.9% (intervention) and 39.7% (control) for the overall included participants (N = 467). However, we obtained outcome data for the subgroup of participants with LVEF > 40% (N = 225). The LVEF in the remaining seven studies ranged from 62% to 72%.
Most participants in five studies were NYHA class II (52% to 88%; ALDO‐DHF; Mak 2009; RAAM‐PEF; STRUCTURE; TOPCAT). Most participants in two studies were NYHA class III (58% to 64%; Kurrelmeyer 2014; Upadhya 2017). Three studies did not report NYHA class for participants eligible for inclusion in our review (AREA IN‐CHF; Karapysh 2015; Mottram 2004). Orea‐Tejeda 2007 reported that most participants in the intervention arm were NYHA class III (57.1%) and NYHA class I (75%) in the control arm.
Participants' mean age ranged from 54.5 years to 80 years; seven studies included participants whose mean age was less than 70 years (ALDO‐DHF; AREA IN‐CHF; Karapysh 2015; Mottram 2004; Orea‐Tejeda 2007; STRUCTURE; TOPCAT). In four studies, participants' mean age was over 70 years (Kurrelmeyer 2014; Mak 2009; RAAM‐PEF; Upadhya 2017).
AREA IN‐CHF was industry funded; six studies were funded by not‐for‐profit organisations (ALDO‐DHF; Kurrelmeyer 2014; RAAM‐PEF; STRUCTURE; TOPCAT; Upadhya 2017). Five studies did not report sources of funding (Karapysh 2015; Mak 2009; Mottram 2004; Orea‐Tejeda 2007; Wang 2010).
Angiotensin converting enzyme inhibitors (ACEI)
We included eight studies that investigated ACEIs for HFpEF. Of these, three compared ACEI with placebo (Kitzman 2010; PEP‐CHF; Zi 2003), and five versus usual care (Aronow 1993; Aronow 1998; Hong Kong DHF; SNEGOVIK; Yuksek 2012). Two studies investigated enalapril (Aronow 1993, up to 20 mg daily; Kitzman 2010, up to 10 mg daily). Aronow 1998 investigated benazepril (up to 40 mg/d). Two studies investigated perindopril (PEP‐CHF, up to 4 mg daily; Yuksek 2012, up to 10 mg). Hong Kong DHF investigated ramipril in one of two active arms (maximum of 10 mg daily). Two studies investigated quinapril (SNEGOVIK, dose not reported; Zi 2003, up to 40 mg daily).
Numbers of participants randomised ranged from 21 (Aronow 1993) to 850 (PEP‐CHF). Two studies were reportedly multicentre trials (Hong Kong DHF; PEP‐CHF). Hong Kong DHF did not report details on the number of centres. PEP‐CHF was conducted at 53 centres in Bulgaria (3), Czech Republic (5), Hungary (10), Ireland (1), Poland (26), Russia (1), Slovakia (2), and the UK (5). Zi 2003 took place at one hospital in the UK and Yuksek 2012 was conducted in Turkey. The countries or number of centres were not reported in four studies (Aronow 1993; Aronow 1998; Kitzman 2010; SNEGOVIK).
The mean LVEF of the included participants at baseline was not reported by two studies (SNEGOVIK; Zi 2003). LVEF ranged from 61% to 69% in five studies (Aronow 1993; Aronow 1998; Hong Kong DHF; Kitzman 2010; PEP‐CHF). Most participants were classified in NYHA class II in four studies (Hong Kong DHF; Kitzman 2010; PEP‐CHF; Zi 2003) and in NYHA class III in one study (Aronow 1993). Two studies did not report participants' NYHA class at baseline (Aronow 1998; SNEGOVIK).
Participants' mean age ranged from 70 years to 82 years with all studies equal to or over a mean age of 70 years.
Four studies did not report funding sources (Aronow 1993; Aronow 1998; SNEGOVIK; Yuksek 2012). Three studies were industry funded (Hong Kong DHF; PEP‐CHF; Zi 2003) and one study was funded by a not‐for profit organisation (Kitzman 2010).
Angiotensin receptor blockers (ARB)
We included eight studies that investigated ARBs for HFpEF. Of these, five compared ARB versus placebo (CAN‐DHF; CHARM‐Preserved; I‐PRESERVE; Kasama 2005; Parthasarathy 2009) and three compared ARB versus usual care (CandHeart; Hong Kong DHF; SUPPORT). Four studies investigated candesartan (CAN‐DHF; CandHeart; CHARM‐Preserved (up to 32 mg daily), Kasama 2005 (8 mg to 12 mg daily)). Two studies investigated irbesartan (one of the two active treatment arms in Hong Kong DHF (up to 75 mg daily), I‐PRESERVE (up to 300 mg)). Parthasarathy 2009 investigated valsartan (80 mg daily). SUPPORT investigated olmesartan (up to 40 mg daily).
Numbers of participants randomised ranged from 22 (CAN‐DHF) to 4128 (I‐PRESERVE). Seven were multicentre trials: CAN‐DHF was conducted at eight centres in Germany; CandHeart at 70 centres in Italy; CHARM‐Preserved was conducted at 618 centres in 26 countries; I‐PRESERVE involved 293 centres in 25 countries; Parthasarathy 2009 was conducted at five centres each in Germany and the UK; and SUPPORT was conducted at 17 centres in Japan. Hong Kong DHF was reported to be a multicentre trial but no details were provided on numbers of centres or countries. Kasama 2005 was reported to be a single‐centre trial in Japan.
The mean LVEF of the included participants at baseline was not reported by CAN‐DHF and ranged from 49% to 72% in seven studies (CandHeart; CHARM‐Preserved; Hong Kong DHF; I‐PRESERVE; Kasama 2005; Parthasarathy 2009; SUPPORT). Most participants were assessed as NYHA class II at baseline in five studies (CandHeart; CHARM‐Preserved; Hong Kong DHF; Kasama 2005; SUPPORT); NYHA class III in I‐PRESERVE; and was not reported by two studies (CAN‐DHF; Parthasarathy 2009).
Participants' mean age ranged from 61 years to 75 years. Mean age was below 70 years in six studies (CAN‐DHF; CandHeart; CHARM‐Preserved; Kasama 2005; Parthasarathy 2009; SUPPORT) and over 70 years in two studies (Hong Kong DHF; I‐PRESERVE).
Six studies were funded by industry (CAN‐DHF; CandHeart; CHARM‐Preserved; Hong Kong DHF; I‐PRESERVE; Parthasarathy 2009). SUPPORT was funded by a not‐for‐profit organisation. Kasama 2005 did not report the source of funding.
Angiotensin receptor neprilysin inhibitors (ARNI)
We did not identify any completed trials that compared ARNI to placebo or no treatment control. However, one completed and two ongoing active controlled studies were identified investigating ARNI for HFpEF. Although people with HFpEF and co‐existing hypertension are often treated with the active comparators used in these studies (ARB or ACEI), these therapies are not considered as usual care for HFpEF.
The PARAMOUNT study, which randomised participants with HFpEF defined as heart failure with LVEF ≥ 45%, investigated ARNI (sacubitril/valsartan), (N = 149) or matching ARB (valsartan), (N = 152) (Zile 2016). The primary outcome measure was change in N‐terminal pro b‐type natriuretic peptide (NT‐proBNP), and secondary outcomes included echocardiographic parameters, NYHA class, and quality of life (KCCQ). During the 36‐week follow‐up, one death occurred in the ARNI group and two deaths in the ARB group. Hyperkalaemia and quality of life outcomes did not differ between groups (Solomon 2012). PERSPECTIVE (NCT02884206) is an ongoing RCT to examine the effect of LCZ696 compared to valsartan on cognitive outcomes in participants with HFpEF, defined as LVEF > 40%. NCT03066804 is a four‐arm, parallel group study to compare the effects of sacubitril/valsartan, enalapril, valsartan and placebo in participants with HFpEF (LVEF ≥ 45%), with estimated enrolment of 2200 participants.
PARAGON‐HF (NCT01920711) is a large active comparator RCT comparing sacubitril/valsartan with valsartan for a composite primary outcome of cardiovascular death and heart failure hospitalisation. The study is ongoing with 4822 participants enrolled, and an estimated study completion date of March 2019.
Excluded studies
We excluded 303 studies (324 references) based on full‐text assessment. Details for the reasons for exclusion are provided in the Characteristics of excluded studies table. In summary we made exclusions based on:
-
wrong population: n = 116;
-
wrong intervention: n = 8;
-
wrong comparator: n = 20;
-
wrong study design: n = 118;
-
subgroup of interest but no response to our enquiry for data: n = 8;
-
unclear eligibility and no response to our enquiry for details: n = 10;
-
unclear eligibility and no current contact details: n = 13;
-
completed status in trial registry record but no published results and no response to our enquiry for data: n = 1;
-
missing data and response that no details can be provided: n = 6;
-
retraction: n = 1; and
-
did not take place as planned: n = 2.
Studies awaiting classification
We identified eight studies that await classification (Anonymous 2003d; Botoni 2010; Dielievska 2015; Gao 2010; Liu 2006; Metra 1999; Rapezzi 1999; Zheng 2009; Characteristics of studies awaiting classification). We are waiting to retrieve the full‐text (n = 4), responses from translators (n = 3) and response from the trialists to clarify eligibility (n = 1).
Ongoing studies
We identified five ongoing studies (EudraCT 2013‐000867‐10; IMPRESS‐AF; NCT02901184; NCT03066804; Zhou 2010; Characteristics of ongoing studies). Three studies are investigating MRAs: spironolactone versus placebo (EudraCT 2013‐000867‐10; IMPRESS‐AF); spironolactone versus usual care (NCT02901184). NCT03066804 is a four‐arm trial comparing ARNI (sacubitril/valsartan), ACEI (enalapril), ARB (valsartan) and matching placebo. Zhou 2010 is testing a beta‐blocker (metoprolol succinate) versus usual care.
Risk of bias in included studies
The risk of bias assessments are detailed in the Characteristics of included studies tables, and summarised in the text below and in Figure 2 and Figure 3.

Risk of bias graph: review authors' judgements about each risk of bias item presented as percentages across all included studies.
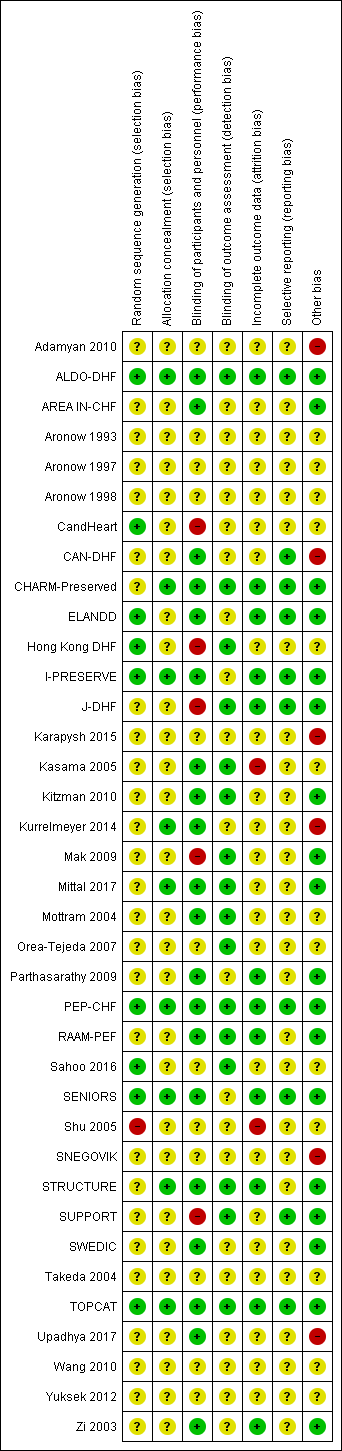
Risk of bias summary: review authors' judgements about each risk of bias item for each included study.
Allocation
Nine studies reported random sequence methods and were rated as low risk of bias (ALDO‐DHF; CandHeart; ELANDD; Hong Kong DHF; I‐PRESERVE; PEP‐CHF; Sahoo 2016; SENIORS; TOPCAT). We assessed 28 studies at unclear risk of bias for this domain because no information was provided in study reports.
Nine studies used a method for allocation concealment that was judged to be of low risk of bias (ALDO‐DHF; CHARM‐Preserved; I‐PRESERVE; Kurrelmeyer 2014; Mittal 2017; PEP‐CHF; SENIORS; STRUCTURE; TOPCAT). We assessed 28 studies at unclear risk of bias for this domain because no information was provided in study reports.
Blinding
We assessed 20 studies as low risk of bias regarding blinding of participants and personnel (ALDO‐DHF; AREA IN‐CHF; CAN‐DHF; CHARM‐Preserved; ELANDD; I‐PRESERVE; Kasama 2005; Kitzman 2010; Kurrelmeyer 2014; Mittal 2017; Mottram 2004; Parthasarathy 2009; PEP‐CHF; RAAM‐PEF; SENIORS; STRUCTURE; SWEDIC; TOPCAT; Upadhya 2017; Zi 2003). Five studies were open‐label designs and therefore judged to be at high risk of bias for this domain (CandHeart; Hong Kong DHF; J‐DHF; Mak 2009; SUPPORT). The remaining 12 studies were assessed at unclear risk of bias because no information was provided.
Detection bias was judged to be at low risk in 16 studies (ALDO‐DHF; CHARM‐Preserved; Hong Kong DHF; J‐DHF; Kasama 2005; Kitzman 2010; Mak 2009; Mittal 2017; Mottram 2004; Orea‐Tejeda 2007; PEP‐CHF; RAAM‐PEF; Sahoo 2016; STRUCTURE; SUPPORT; TOPCAT). The remaining 21 studies did not provide information and were judged to be at unclear risk of detection bias.
Incomplete outcome data
Attrition bias was judged to be at low risk in 12 studies (ALDO‐DHF; CHARM‐Preserved; ELANDD; I‐PRESERVE; J‐DHF; Parthasarathy 2009; PEP‐CHF; RAAM‐PEF; SENIORS; STRUCTURE; TOPCAT; Zi 2003). We judged Kasama 2005 to be at high risk of bias for this domain because the study report did not indicate if losses to follow‐up or withdrawals occurred. All other 25 studies were assessed as unclear risk of bias for attrition bias as no information was reported to allow judgement.
Selective reporting
We assessed 10 studies to be at low risk of reporting bias (ALDO‐DHF; CAN‐DHF; CHARM‐Preserved; ELANDD; I‐PRESERVE; J‐DHF; PEP‐CHF; SENIORS; SUPPORT; TOPCAT). These 10 studies reported planned outcomes in either published protocols or clinical trial registers before enrolment started. We were unable to assess reporting bias in 27 studies because either no information was available in the form of protocols or clinical trial registry entries, or they were published/entered after enrolment was completed.
Other potential sources of bias
We judged 18 studies to be at low risk of other biases (mainly based on providing details on funding and declaring any conflict of interest by the authors) (ALDO‐DHF; AREA IN‐CHF; CHARM‐Preserved; ELANDD; I‐PRESERVE; J‐DHF; Kitzman 2010; Mak 2009; Mittal 2017; Parthasarathy 2009; PEP‐CHF; RAAM‐PEF; SENIORS; STRUCTURE; SUPPORT; SWEDIC; TOPCAT; Zi 2003).
We judged six studies to be at high risk of other bias. Kurrelmeyer 2014 was originally registered as an observational study and this detail was changed after completion of the trial but before the results were published. Five studies (Adamyan 2010; CAN‐DHF; Karapysh 2015; SNEGOVIK; Upadhya 2017) were published as conference abstracts only; withholding the full results from publication may present a form of bias. The remaining 26 studies were judged to be at unclear risk of bias.
Effects of interventions
See: Summary of findings for the main comparison Beta‐blockers compared to placebo or no treatment for chronic heart failure with preserved ejection fraction; Summary of findings 2 MRA compared to placebo or no treatment for chronic heart failure with preserved ejection fraction; Summary of findings 3 ACEI compared to placebo or no treatment for chronic heart failure with preserved ejection fraction; Summary of findings 4 ARB compared to placebo or no treatment for chronic heart failure with preserved ejection fraction
Beta‐blockers versus placebo or no treatment
We included 10 studies that involved a total of 3087 participants that assessed beta‐blockers versus placebo or no treatment. The main outcomes for this comparison are included in summary of findings Table for the main comparison.
Cardiovascular mortality
Six studies reported cardiovascular mortality (Aronow 1997; ELANDD; J‐DHF; SENIORS; SWEDIC; Takeda 2004). Three studies reported that no deaths occurred (ELANDD; SWEDIC; Takeda 2004). We included three studies in the meta‐analysis (Aronow 1997; J‐DHF; SENIORS) (15% of participants in the intervention arm versus 19% in the control arm; RR 0.78; 95% CI 0.62 to 0.99; NNTB 25; 1046 participants; I² = 0%; low‐quality evidence; Analysis 1.1).
J‐DHF reported cardiovascular mortality but with different numbers for events within the same table (Table 2 in the primary reference). We contacted the study authors to seek clarification but are yet to receive a response; we used the higher numbers in the analysis.
SENIORS reported a hazard ratio (HR 0.80; 95% CI 0.49 to 1.32; 643 participants).
Heart failure hospitalisation
We included five studies that reported heart failure hospitalisation (ELANDD; J‐DHF; Shu 2005; SWEDIC; Takeda 2004). ELANDD reported that no hospitalisation occurred due to heart failure. Data from four studies (J‐DHF; Shu 2005; SWEDIC; Takeda 2004) contributed to the meta‐analysis (RR 0.73; 95% CI 0.47 to 1.13; 449 participants; I² = 22%; very low‐quality evidence; Analysis 1.2).
Hyperkalaemia
J‐DHF reported that one participant in the intervention group (N = 120) experienced hyperkalaemia but did not report on this outcome for the control group (very low‐quality evidence). No further data were available from any other studies.
All‐cause mortality
We included seven studies that reported all‐cause mortality (Adamyan 2010; Aronow 1997; ELANDD; J‐DHF; SENIORS; SWEDIC; Takeda 2004). Of these, three studies reported that no deaths occurred (ELANDD; SWEDIC; Takeda 2004). We included data from four studies in the meta‐analysis (Adamyan 2010; Aronow 1997; J‐DHF; SENIORS) (RR 0.82; 95% CI 0.67 to 1.00; 1105 participants; I² = 0%; low‐quality evidence; Analysis 1.3).
J‐DHF reported all‐cause mortality but with different numbers for events within the same table (Table 2 in the primary reference). We contacted the study authors to seek clarification but are yet to receive a response. We used the higher number of deaths in the analysis.
SENIORS reported a hazard ratio (HR 0.92; 95% CI 0.61 to 1.36; 643 participants).
Quality of life
We included two studies that reported quality of life (ELANDD; Mittal 2017). Mittal 2017 reported quality of life using SF‐36, which was not a scale we considered for our analysis. ELANDD reported end scores for the Minnesota Living with Heart Failure Questionnaire (MLHFQ) total score and showed MD ‐1.00 between the treatment arms, favouring the intervention (95% CI ‐9.05 to 7.05; 93 participants; very low‐quality evidence).
Withdrawal due to adverse event
We included five studies that reported withdrawals due to adverse events (Aronow 1997; ELANDD; J‐DHF; Mittal 2017; Sahoo 2016). Mittal 2017 and Sahoo 2016 reported no withdrawals due to adverse events. Aronow 1997 reported 11 withdrawals due to "worsening CHF [chronic heart failure] in 7 patients and hypotension in 4 patients" but did not provide this information by intervention arm. Only two studies (ELANDD; J‐DHF) contributed data for meta‐analysis (9% of participants in the intervention arm versus 0% in the control arm, RR 18.07; 95% CI 2.45 to 133.04; 338 participants; I² = 0%; Analysis 1.5; number needed to harm (NNTH) 11).
Mineralocorticoid receptor antagonists (MRA) versus placebo or no treatment
We included 12 studies (4408 participants) that assessed MRA versus placebo or no treatment. The main outcomes for this comparison are included in summary of findings Table 2. The findings for this comparison were driven by one trial (TOPCAT). Four trials (Karapysh 2015; Mottram 2004; Orea‐Tejeda 2007; Wang 2010) did not contribute any outcome data of interest for this review.
Cardiovascular mortality
We included five studies that reported cardiovascular mortality (ALDO‐DHF; AREA IN‐CHF; Kurrelmeyer 2014; RAAM‐PEF; TOPCAT). Of these, two studies reported that no deaths occurred (Kurrelmeyer 2014; RAAM‐PEF). We included data from three studies in the meta‐analysis (ALDO‐DHF; AREA IN‐CHF; TOPCAT) (RR 0.90; 95% CI 0.74 to 1.11; 4070 participants; I² = 0%; moderate‐quality evidence; Analysis 2.1).
TOPCAT also reported a hazard ratio (HR 0.90; 95% CI 0.73 to 1.12; 3445 participants).
Heart failure hospitalisation
We included six studies that reported heart failure hospitalisation (ALDO‐DHF; AREA IN‐CHF; Kurrelmeyer 2014; RAAM‐PEF; TOPCAT; Upadhya 2017). Of these, three studies reported no hospitalisations due to heart failure (ALDO‐DHF; Kurrelmeyer 2014; Upadhya 2017). We included data from three studies in the meta‐analysis (AREA IN‐CHF; RAAM‐PEF; TOPCAT) (11% of participants in the intervention arm versus 14% in the control arm, RR 0.82; 95% CI 0.69 to 0.98; 3714 participants; NNTB 41; I² = 22%; moderate‐quality evidence; Analysis 2.2).
Hazard ratios for time to first heart failure hospitalisation were reported for two studies (AREA IN‐CHF; TOPCAT) (HR 0.82; 95% CI 0.69 to 0.98; 3670 participants; I² = 59%; Analysis 2.3). The substantial heterogeneity was explained by differences in population characteristics (TOPCAT, LVEF ≥ 45%; AREA IN‐CHF subgroup, LVEF 40% to 45%).
Hyperkalaemia
We included six studies that reported hyperkalaemia (ALDO‐DHF; AREA IN‐CHF; Kurrelmeyer 2014; RAAM‐PEF; STRUCTURE; TOPCAT) (16% of participants in the intervention arm versus 8% in the control arm, RR 2.11; 95% CI 1.77 to 2.51; 4291 participants; I² = 0%; high‐quality evidence; Analysis 2.4).
All‐cause mortality
We included eight studies that reported all‐cause mortality (ALDO‐DHF; AREA IN‐CHF; Kurrelmeyer 2014; Mak 2009; RAAM‐PEF; STRUCTURE; TOPCAT; Upadhya 2017). Of these, three studies reported that no deaths occurred (Kurrelmeyer 2014; RAAM‐PEF; STRUCTURE). The meta‐analysis included data from five studies (ALDO‐DHF; AREA IN‐CHF; Mak 2009; TOPCAT; Upadhya 2017) (RR 0.91; 95% CI 0.78 to 1.06; 4207 participants; I² = 0%; moderate‐quality evidence; Analysis 2.5).
TOPCAT also reported a hazard ratio (HR 0.91; 95% CI 0.77 to 1.08; 3445 participants).
Quality of life
We included six studies that reported quality of life (ALDO‐DHF; Kurrelmeyer 2014; Mak 2009; RAAM‐PEF; TOPCAT; Upadhya 2017). TOPCAT reported quality of life in a report by Lewis 2016, but the end scores per treatment arm were not provided. We contacted the investigators and await details.
Three studies (ALDO‐DHF; Mak 2009; Upadhya 2017) reported total MLFHQ scores and were pooled for analysis (MD 0.84; 95% CI ‐2.30 to 3.98; 511 participants; I² = 0%; low‐quality evidence; Analysis 2.8). Kurrelmeyer 2014 and RAAM‐PEF reported Kansas City Cardiomyopathy Questionnaire (KCCQ) results and were pooled (MD ‐0.78; 95% CI ‐28.02 to 26.46; 92 participants; I² = 86%; Analysis 2.7). The substantial heterogeneity could not be explained.
All five studies that used MLHFQ and KCCQ were pooled (SMD 0.05; 95% CI ‐0.23 to 0.34; 603 participants; I² = 50%; Analysis 2.6). The substantial heterogeneity could not be explained.
Withdrawal due to adverse event
Four studies reported this outcome (ALDO‐DHF; Kurrelmeyer 2014; TOPCAT; Upadhya 2017) and contributed to the meta‐analysis (RR 1.10; 95% CI 1.00 to 1.21; 3986 participants; I² = 0%; Analysis 2.9).
Angiotensin converting enzyme inhibitors (ACEI) versus placebo or no treatment
We included eight studies that involved a total of 2061 participants that assessed ACEI versus placebo or no treatment. The main outcomes for this comparison are presented in summary of findings Table 3. The findings for this comparison were driven by PEP‐CHF. Two studies (Aronow 1993; Yuksek 2012) did not contribute any outcome data of interest for this review.
Cardiovascular mortality
Three studies reported cardiovascular mortality (Hong Kong DHF; Kitzman 2010; PEP‐CHF). Kitzman 2010 reported that no deaths occurred. Hong Kong DHF and PEP‐CHF contributed data to the meta‐analysis (RR 0.93; 95% CI 0.61 to 1.42; 945 participants; I² = 0%; moderate‐quality evidence; Analysis 3.1).
PEP‐CHF also reported a hazard ratio (HR 0.98; 95% CI 0.63 to 1.52; 850 participants).
Heart failure hospitalisation
Three studies (Hong Kong DHF; PEP‐CHF; Zi 2003) reported heart failure hospitalisation and were pooled for analysis (RR 0.86, 95% CI 0.64 to 1.15; 1019 participants; I² = 0%; moderate‐quality evidence; Analysis 3.2).
PEP‐CHF also reported a hazard ratio (HR 0.86, 95% CI 0.61 to 1.20; 850 participants).
Hyperkalaemia
Zi 2003 reported hyperkalaemia (RR 5.27; 95% CI 0.26 to 106.16; 74 participants; very low‐quality evidence; Analysis 3.3).
All‐cause mortality
We included five studies that reported all‐cause mortality (Aronow 1998; Hong Kong DHF; Kitzman 2010; PEP‐CHF; Zi 2003). Kitzman 2010 reported that no deaths occurred. Four studies (Aronow 1998; Hong Kong DHF; PEP‐CHF; Zi 2003) contributed to the meta‐analysis (RR 0.99; 95% CI 0.71 to 1.38; 1079 participants; I² = 0%; moderate‐quality evidence; Analysis 3.4).
PEP‐CHF also reported a hazard ratio (HR 1.09; 95% CI 0.75 to 1.58; 850 participants).
Quality of life
Three studies reported quality of life assessed using the MLHFQ scale (Hong Kong DHF; Kitzman 2010; SNEGOVIK). SNEGOVIK reported quality of life assessment based on the MLHFQ scale as change from baseline per treatment arm (‐18.9 for intervention, ‐10.7 for control). We were unsuccessful in our attempts to contact study authors to obtain scores at the end of follow‐up. Two studies (Hong Kong DHF; Kitzman 2010) contributed to the meta‐analysis (MD ‐0.09; 95% CI ‐3.66 to 3.48; 154 participants; I² = 4%; low‐quality evidence; Analysis 3.5).
Zi 2003 assessed quality of life using the McMaster quality of life questionnaire and reported end scores at six months and reported 12.9 ± 3.1 for the intervention and 13.1 ± 4.7 for the control arm.
Withdrawal due to adverse event
Three studies (Hong Kong DHF; PEP‐CHF; Zi 2003) reported this outcome and were pooled for analysis (RR 1.53; 95% CI 0.26 to 9.00; 1019 participants; I² = 59%; Analysis 3.6).
Angiotensin receptor blockers (ARB) versus placebo or no treatment
We included eight studies that involved a total of 8755 participants that assessed ARB versus placebo or no treatment. The main outcomes for this comparison are included in summary of findings Table 4. The findings for this comparison were driven by two studies (CHARM‐Preserved; I‐PRESERVE). Three trials (CAN‐DHF; CandHeart; Kasama 2005) did not contribute any outcome data of interest for this review.
Cardiovascular mortality
Four studies reported this outcome (CHARM‐Preserved; Hong Kong DHF; I‐PRESERVE; Parthasarathy 2009). Parthasarathy 2009 reported that no deaths occurred. Three studies (CHARM‐Preserved; Hong Kong DHF; I‐PRESERVE) contributed to the meta‐analysis (RR 1.02; 95% CI 0.90 to 1.14; 7254 participants; I² = 0%; high‐quality evidence; Analysis 4.1).
Two studies (CHARM‐Preserved; I‐PRESERVE) were also pooled for analysis (HR 1.00; 95% CI 0.89 to 1.13; 5087 participants; Analysis 4.2).
Heart failure hospitalisation
Three studies (CHARM‐Preserved; Hong Kong DHF; I‐PRESERVE) reported this outcome and were pooled for analysis (RR 0.92; 95% CI 0.83 to 1.02; 7254 participants; I² = 0%; high‐quality evidence; Analysis 4.3).
Two studies (CHARM‐Preserved; I‐PRESERVE) were also pooled for analysis (HR 0.90; 95% CI 0.80 to 1.01; 7148 participants; Analysis 4.4).
Hyperkalaemia
Two studies reported this outcome and were pooled for analysis (CHARM‐Preserved; I‐PRESERVE) (0.9% of participants in the intervention group and 0.5% in the control group; RR 1.88; 95% CI 1.07 to 3.33; participants = 7148; high‐quality evidence; Analysis 4.5).
All‐cause mortality
Five studies reported this outcome (CHARM‐Preserved; Hong Kong DHF; I‐PRESERVE; Parthasarathy 2009; SUPPORT). Parthasarathy 2009 reported that no deaths occurred. Four studies (CHARM‐Preserved; Hong Kong DHF; I‐PRESERVE; SUPPORT) contributed to the meta‐analysis (RR 1.01; 95% CI 0.92 to 1.11; 7964 participants; I² = 0%; high‐quality evidence; Analysis 4.6). For the SUPPORT trial, data for participants with LVEF ≥ 50% were analysed according to the definition of HFpEF used in this trial.
Two studies (I‐PRESERVE; SUPPORT) were also pooled for analysis (HR 0.99; 95% CI 0.88 to 1.12; 4838 participants; Analysis 4.7).
Quality of life
Four studies reported this outcome (CHARM‐Preserved; Hong Kong DHF; I‐PRESERVE; Parthasarathy 2009). CHARM‐Preserved reported quality of life (MLHF) in a study report (Lewis 2007): however, end scores per treatment arm were not provided. Three studies (Hong Kong DHF; I‐PRESERVE; Parthasarathy 2009) contributed to the meta‐analysis for MLHF (MD 0.41; 95% CI ‐0.86 to 1.67; 3117 participants; I² = 19%; high‐quality evidence; Analysis 4.8).
Withdrawal due to adverse event
Four studies (CHARM‐Preserved; Hong Kong DHF; I‐PRESERVE; Parthasarathy 2009) reported this outcome and contributed to the meta‐analysis (16% of participants in the intervention arm versus 13% in the control arm; RR 1.22; 95% CI 1.09 to 1.36; 7406 participants; I² = 0%; Analysis 4.9; NNTH 33).
Angiotensin receptor neprilysin inhibitors (ARNI) versus placebo or no treatment
We did not identify any completed trials that assessed ARNI.
Subgroup analyses
We were unable to perform a subgroup analysis for length of follow up for cardiovascular mortality as all included studies fell into one category of follow‐up (≥ 12 months: Analysis 1.1; Analysis 2.1; Analysis 3.1; Analysis 4.1). Similarly, we were unable to perform a subgroup analysis for ARB and heart failure hospitalisation (Analysis 4.3).
Heart failure hospitalisation for the comparison of beta‐blockers versus control (Analysis 1.2) showed no difference among the subgroups (< 12 months: RR 0.31; 95% CI 0.09 to 1.02; 67 participants; 1 study; versus ≥ 12 months: RR 0.79; 95% CI 0.48 to 1.31; 285 participants; studies = 2). SWEDIC did not report length of follow‐up.
Heart failure hospitalisation for the comparison of MRA versus control (Analysis 2.2) showed a confirmation of the overall effect estimate (RR 0.82; 95% CI 0.69 to 0.98; 3714 participants; 3 studies) only in the subgroup for follow‐up ≥ 12 months (RR 0.82; 95% CI 0.69 to 0.98; 3670 participants; 2 studies) while the much smaller study of shorter duration (< 12 months) showed RR 0.55; 95% CI 0.05 to 5.61; 44 participants.
Heart failure hospitalisation for the comparison of ACEI versus control (Analysis 3.2) showed no difference between subgroups (< 12 months: RR 0.42; 95% CI 0.09 to 2.04; 74 participants; 1 study; versus ≥ 12 months: RR 0.88; 95% CI 0.66 to 1.19; 945 participants; 2 studies).
Sensitivity analyses
We conducted a sensitivity analysis by only including studies assessed at low risk of bias. Across comparisons, the estimates were not significantly changed with the exception of beta‐blockers where no effect on cardiovascular mortality was observed (1 low risk of bias study (SENIORS): RR 0.81; 95% CI 0.50 to 1.29 versus overall analysis of 3 studies: RR 0.78; 95% CI 0.62 to 0.99).
Discussion
Summary of main results
We examined the evidence for the effects of BB and RAAS inhibitors for the treatment of HFpEF. We included 37 trials, reported in 207 publications that involved a total of 18,311 participants. We identified five ongoing trials with treatment arms that include interventions assessed in this review. A further eight studies await assessment.
We performed a pooled analysis for the outcomes of cardiovascular and all‐cause mortality, heart failure hospitalisation, quality of life and hyperkalaemia. We used data from the Minnesota Living with Heart Failure (MLHF) questionnaire for quality of life outcomes because this was most frequently reported instrument.
Withdrawals due to adverse events were inconsistently reported; these data could not be included in 'Summary of findings' tables.
We conducted a sensitivity analysis by including only studies assessed with overall low risk of bias. The effect estimates were not significantly changed except for beta‐blockers.
Beta‐blockers
A total of 10 included studies (3087 participants) assessed beta‐blockers compared with placebo or no intervention. We performed meta‐analyses including up to four studies and 1105 participants. The results suggested that treatment may improve cardiovascular mortality, however the quality of evidence was low due to imprecision and risk of bias. When we performed a sensitivity analysis by including only studies at low overall risk of bias, the effects on cardiovascular mortality did not persist. The two largest studies (J‐DHF; SENIORS) reported high rates of study drug discontinuation due to intolerance rather than adverse events, which may have attenuated any true treatment effects. There is uncertainty about the effects of beta‐blocker pharmacotherapy in people with HFpEF. A large, randomised, controlled, open label, clinical outcomes trial of metoprolol for HFpEF is ongoing (Zhou 2010, beta‐PRESERVE).
Mineralocorticoid receptor antagonists (MRA)
A total of 12 studies (4408 participants) assessed MRA compared with placebo or no intervention. We combined evidence from up to six trials and 4291 participants in meta‐analyses. We found that treatment with MRA reduces the risk of heart failure hospitalisation but found little or no effect on cardiovascular and all‐cause mortality; however the quality of evidence was moderate and uncertainty remains over these treatment effects. As expected, MRA treatment was associated with an increased risk of hyperkalaemia; potassium monitoring is therefore required in people being treated using MRA. A large, registry‐randomised clinical outcomes trial of spironolactone for HFpEF is ongoing and due to complete in 2022 (NCT02901184: Spironolactone Initiation Registry Randomized Interventional Trial in Heart Failure with Preserved Ejection Fraction, SPIRRIT).
Angiotensin converting enzyme inhibitors (ACEI)
A total of eight included studies (2062 participants) assessed ACEI versus placebo or no intervention. We conducted a meta‐analysis of data from four trials and 1079 participants. We found that there was probably little or no effect on cardiovascular mortality, all‐cause mortality, heart failure hospitalisation or quality of life and data on hyperkalaemia were limited. No large clinical trials (>1000 participants) were available and the quality of evidence was assessed as moderate due to imprecision. The effectiveness of ACEI therapy in the treatment of people with HFpEF remains unclear.
Angiotensin receptor antagonists (ARB)
A total of eight included studies (8755 participants) assessed ARB therapy for people with HFpEF with the evidence quality assessed as high. We combined evidence from up to four trials and 7964 participants for meta‐analysis and found little or no overall difference on the outcomes of cardiovascular mortality, all‐cause mortality, heart failure hospitalisation or quality of life. The CHARM study found an effect on heart failure hospitalisation based on a time to event analysis, and the strength of this association was increased in a subsequent analysis based on recurrent events (Rogers 2014). As expected, ARB treatment was associated with an increased risk of hyperkalaemia; potassium monitoring is therefore required.
Overall completeness and applicability of evidence
This review provides the most comprehensive appraisal of the evidence to date. We included 37 studies (207 reports) that involved 18,311 participants. The included trials assessed beta‐blockers (10 studies, 3087 participants), MRA (12 studies, 4408 participants), ACEI (8 studies, 2061 participants) and ARB (8 studies, 8755 participants).
We searched clinical trials registries and identified five ongoing clinical trials, several of which have potential to influence the review findings. We also identified eight studies that were classified as Studies awaiting classification, for which there was insufficient information to determine whether these studies met our inclusion criteria. These studies were mostly small and it is therefore unlikely that they would influence the results of this review. In total, we identified 207 reports of 37 trials, 8 studies awaiting classification, and 5 ongoing trials, compared with a total of 22 identified by Zheng 2017 for the same comparisons.
The LVEF threshold for defining the HFpEF trial populations varied among the included studies and may contribute to indirectness with implications for the applicability of the evidence. Nine studies included participants with an ejection fraction cut‐off of 40%, 10 used 45%, 14 used 50%, and one used 55%. Adamyan 2010 included participants with preserved ejection fraction but did not specify the cut‐off. SENIORS reported a subgroup of participants with LVEF > 40% and we obtained outcomes for a subgroup with LVEF > 40% for AREA IN‐CHF. No trials reported outcomes for the subgroup in the 40% to 49% mid‐range so we were unable to investigate this subgroup.
The included studies had enrolment start dates from 1997 to 2011. In more recent studies, B‐type natriuretic peptides have been used as a key inclusion criterion to improve the specificity of the HFpEF population and enrich the trial populations for people at higher risk for clinical outcomes (e.g. CAN‐DHF; Mak 2009; RAAM‐PEF). Similarly, new measures of diastolic function have been included in more recent studies to increase the specificity (e.g. ELANDD; J‐DHF; PEP‐CHF). We noted considerable clinical heterogeneity between study populations with respect to comorbidities and cardiovascular therapies at baseline, which may influence the applicability of the evidence.
Quality of the evidence
We used the GRADE method to assess evidence quality for the outcomes of cardiovascular mortality, all‐cause mortality, heart failure hospitalisation, quality of life (assessed using the Minnesota Living with Heart Failure questionnaire), and hyperkalaemia. For beta‐blockers, evidence quality for clinical outcomes (cardiovascular mortality, all‐cause mortality and heart failure hospitalisation) ranged from low to very low. In the combined analysis, most participants were from a subgroup of a single large trial; the other included studies were small with high or unclear risk of bias.
For MRA, the TOPCAT study contributed the majority of participants to the meta‐analysis for which the overall evidence quality for clinical outcomes was assessed as moderate. We noted differences in participant populations among the included studies (TOPCAT, LVEF > 40%; RAAM‐PEF, LVEF ≥ 50%; AREA IN‐CHF LVEF 40% to 45%) and it is reported that ejection fraction is a modifier of treatment effect for MRA (Solomon 2016). Notably, a post hoc analysis of the TOPCAT study reported important differences in the placebo event rates among participants enrolled from the Americas (Argentina, Brazil, Canada, USA) and participants enrolled from Russia and Georgia (Pfeffer 2015). Furthermore, a pharmacology substudy of participants at 12 months (206 participants from USA and Canada; 160 participants from Russia) found that drug metabolites were undetectable in a greater proportion of participants from Russia compared with participants from the USA and Canada (30% versus 3%, P < 0.001) (de Denus 2017). A geographical subgroup analysis suggested possible clinical benefit from spironolactone in HFpEF in participants who were enrolled in the Americas (United States, Canada, Brazil, Argentina; cardiovascular mortality HR 0.74, 95% CI 0.57 to 0.97; all‐cause mortality HR 0.83, 95% CI 0.68 to 1.02; heart failure hospitalisation HR 0.82, 95% CI 0.67 to 0.99). These findings will be investigated further in the ongoing SPIRRIT study (NCT02901184).
For ARB, several large trials contributed a large number of events to the meta‐analysis for the clinical outcomes of mortality and heart failure hospitalisation, and the evidence quality was high. For ACEI, fewer trials were included in the combined analysis, event numbers were low and the evidence quality was assessed as moderate. For beta‐blockers, the quality of evidence was low due to small study sizes and risk of bias.
Potential biases in the review process
Although we conducted a comprehensive search of major databases, it is possible we missed studies on clinical trials registers, had not been reported, or both. Where information on relevant subgroups or outcomes were not reported, we attempted to contact the study authors however only a limited number of responses were received. Given the small number of included studies per analysis, we were unable to formally assess for the existence of publication bias.
Agreements and disagreements with other studies or reviews
Our results were largely consistent with those from the most recent comprehensive review of evidence for beta‐blockers and RAAS inhibitors in people with HFpEF (Zheng 2017). However, important differences were noted. Our analysis included more studies for each comparison, but the additional studies were small and did not significantly alter the overall effect estimates. A further distinction is that we used a fixed‐effect model rather than a random‐effects model for meta‐analysis given the low heterogeneity among studies for all comparisons. We found a reduction in cardiovascular mortality for beta‐blocker therapy but this was not robust to a sensitivity analysis that included only studies assessed at low risk of bias. In contrast to Zheng 2017, we did not find an effect of beta‐blocker treatment on all‐cause mortality that achieved statistical significance.

Study flow diagram

Risk of bias graph: review authors' judgements about each risk of bias item presented as percentages across all included studies.

Risk of bias summary: review authors' judgements about each risk of bias item for each included study.
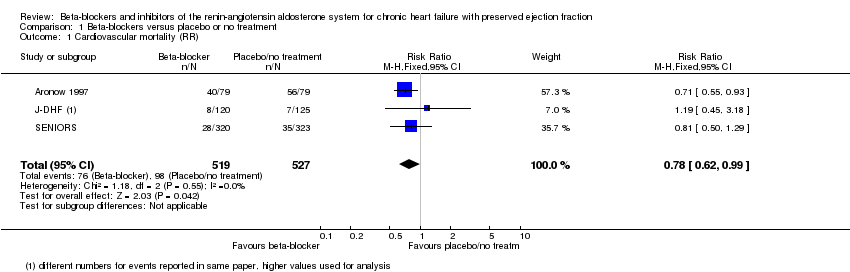
Comparison 1 Beta‐blockers versus placebo or no treatment, Outcome 1 Cardiovascular mortality (RR).

Comparison 1 Beta‐blockers versus placebo or no treatment, Outcome 2 Heart failure hospitalisation (RR).
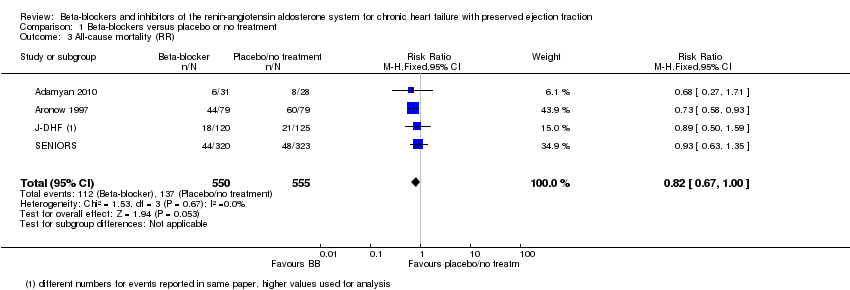
Comparison 1 Beta‐blockers versus placebo or no treatment, Outcome 3 All‐cause mortality (RR).
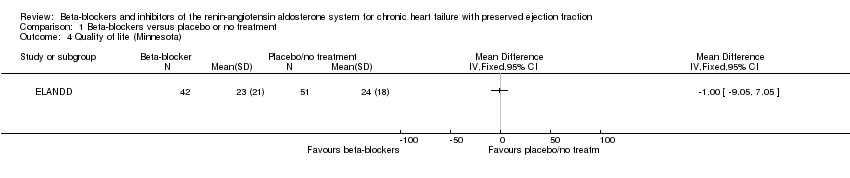
Comparison 1 Beta‐blockers versus placebo or no treatment, Outcome 4 Quality of life (Minnesota).
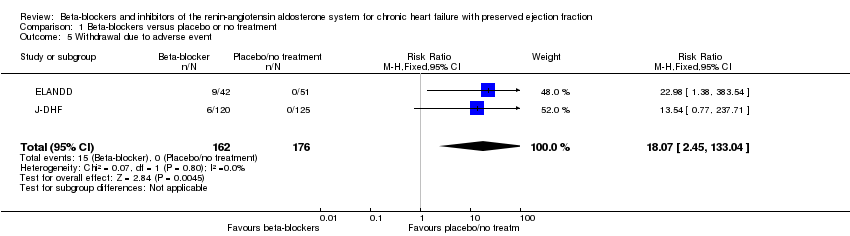
Comparison 1 Beta‐blockers versus placebo or no treatment, Outcome 5 Withdrawal due to adverse event.

Comparison 2 Mineralocorticoid receptor antagonists versus placebo or no treatment, Outcome 1 Cardiovascular mortality (RR).
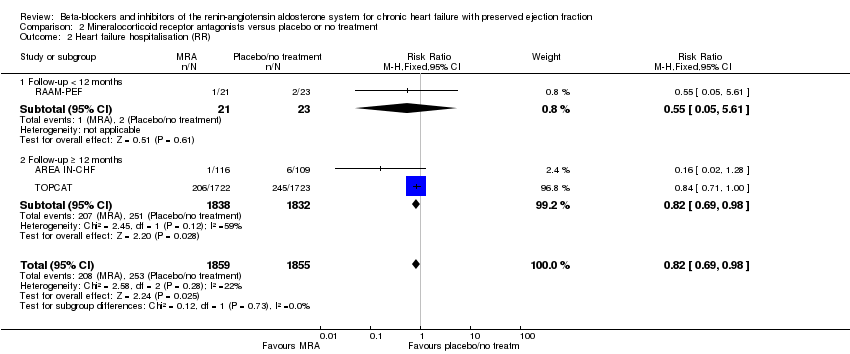
Comparison 2 Mineralocorticoid receptor antagonists versus placebo or no treatment, Outcome 2 Heart failure hospitalisation (RR).
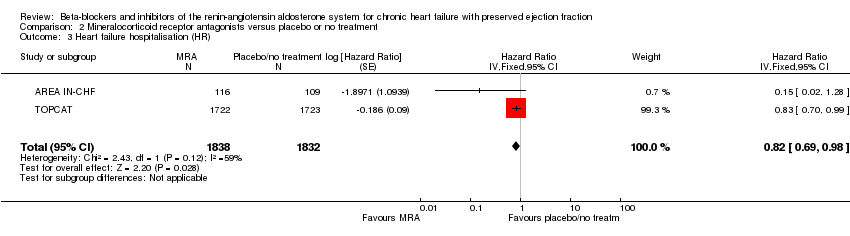
Comparison 2 Mineralocorticoid receptor antagonists versus placebo or no treatment, Outcome 3 Heart failure hospitalisation (HR).

Comparison 2 Mineralocorticoid receptor antagonists versus placebo or no treatment, Outcome 4 Hyperkalaemia.
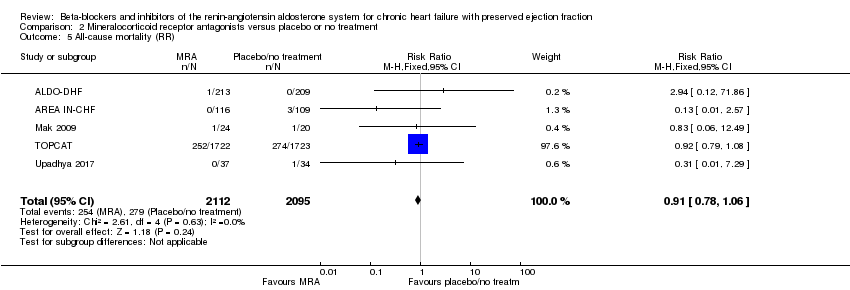
Comparison 2 Mineralocorticoid receptor antagonists versus placebo or no treatment, Outcome 5 All‐cause mortality (RR).

Comparison 2 Mineralocorticoid receptor antagonists versus placebo or no treatment, Outcome 6 Quality of life.

Comparison 2 Mineralocorticoid receptor antagonists versus placebo or no treatment, Outcome 7 Quality of life (KCCQ).

Comparison 2 Mineralocorticoid receptor antagonists versus placebo or no treatment, Outcome 8 Quality of life (Minnesota).

Comparison 2 Mineralocorticoid receptor antagonists versus placebo or no treatment, Outcome 9 Withdrawal due to adverse event.

Comparison 3 Angiotensin converting enzyme inhibitors versus placebo or no treatment, Outcome 1 Cardiovascular mortality (RR).
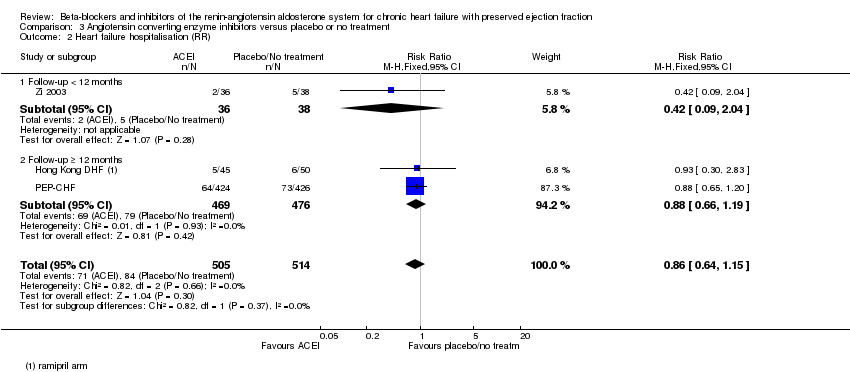
Comparison 3 Angiotensin converting enzyme inhibitors versus placebo or no treatment, Outcome 2 Heart failure hospitalisation (RR).

Comparison 3 Angiotensin converting enzyme inhibitors versus placebo or no treatment, Outcome 3 Hyperkalaemia.
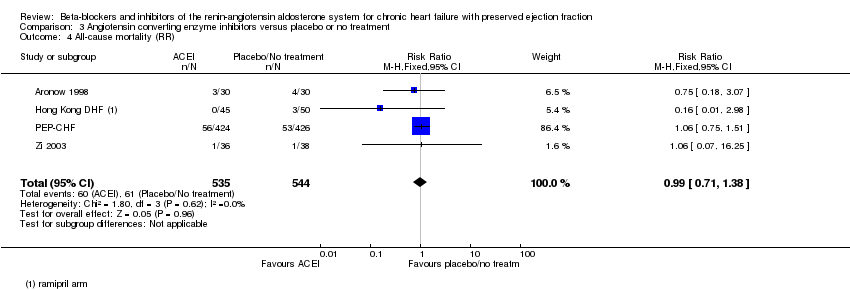
Comparison 3 Angiotensin converting enzyme inhibitors versus placebo or no treatment, Outcome 4 All‐cause mortality (RR).

Comparison 3 Angiotensin converting enzyme inhibitors versus placebo or no treatment, Outcome 5 Quality of life (Minnesota).

Comparison 3 Angiotensin converting enzyme inhibitors versus placebo or no treatment, Outcome 6 Withdrawal due to adverse event.

Comparison 4 Angiotensin receptor blockers versus placebo or no treatment, Outcome 1 Cardiovascular mortality (RR).

Comparison 4 Angiotensin receptor blockers versus placebo or no treatment, Outcome 2 Cardiovascular mortality (HR).

Comparison 4 Angiotensin receptor blockers versus placebo or no treatment, Outcome 3 Heart failure hospitalisation (RR).

Comparison 4 Angiotensin receptor blockers versus placebo or no treatment, Outcome 4 Heart failure hospitalisation (HR).
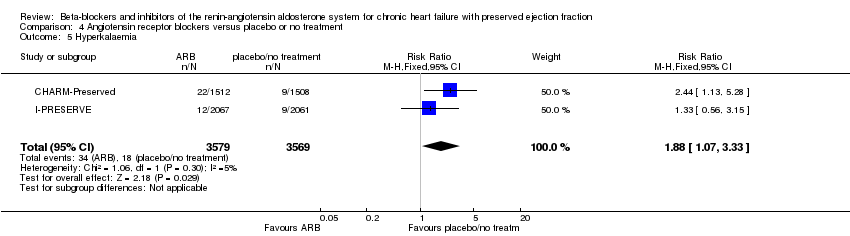
Comparison 4 Angiotensin receptor blockers versus placebo or no treatment, Outcome 5 Hyperkalaemia.
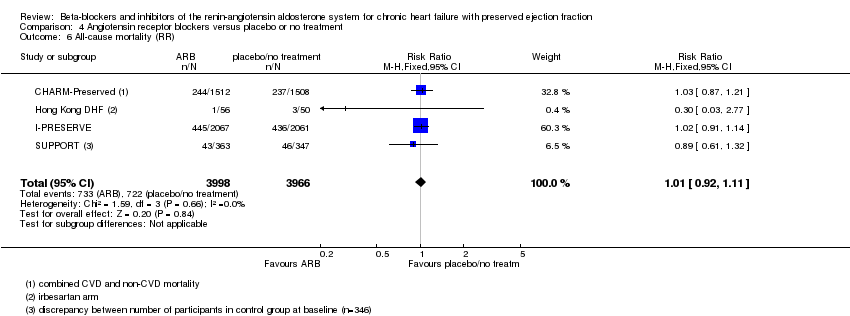
Comparison 4 Angiotensin receptor blockers versus placebo or no treatment, Outcome 6 All‐cause mortality (RR).
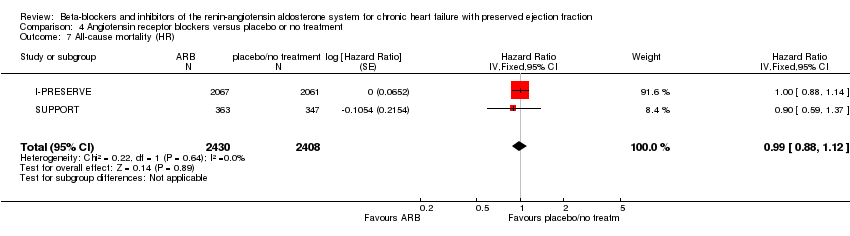
Comparison 4 Angiotensin receptor blockers versus placebo or no treatment, Outcome 7 All‐cause mortality (HR).

Comparison 4 Angiotensin receptor blockers versus placebo or no treatment, Outcome 8 Quality of life (Minnesota).
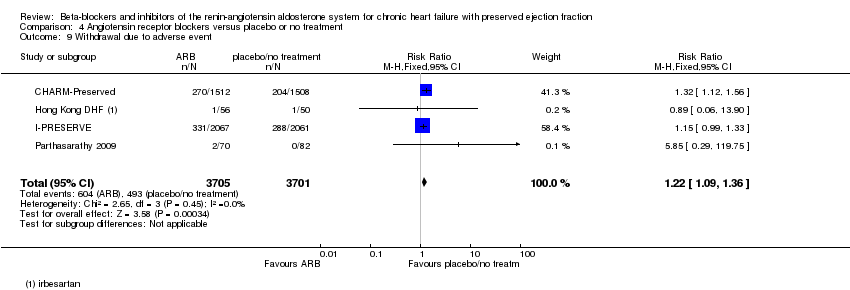
Comparison 4 Angiotensin receptor blockers versus placebo or no treatment, Outcome 9 Withdrawal due to adverse event.
| Beta‐blockers compared to placebo or no treatment for chronic heart failure with preserved ejection fraction | ||||||
| Patient or population: chronic heart failure with preserved ejection fraction | ||||||
| Outcomes | Anticipated absolute effects* (95% CI) | Relative effect | № of participants | Certainty of the evidence | Comments | |
| Risk with placebo/no treatment | Risk with Beta‐blockers | |||||
| Cardiovascular mortality (RR) | Study population | RR 0.78 | 1046 | ⊕⊕⊝⊝ | Three additional studies (ELANDD; SWEDIC; Takeda 2004) reported that no deaths occurred | |
| 173 per 1000 | 135 per 1000 | |||||
| Heart failure hospitalisation (RR) | Study population | RR 0.73 | 449 | ⊕⊝⊝⊝ | Follow‐up unclear for SWEDIC. ELANDD reported that no hospitalisation due to heart failure occurred | |
| 117 per 1000 | 86 per 1000 | |||||
| Hyperkalaemia | 245 (1 RCT) | ⊕⊝⊝⊝ | J‐DHF reported one participant in the intervention group (N = 120) experienced hyperkalaemia but did not report on this outcome for the control group. No further data were available from any of the other studies. | |||
| All‐cause mortality (RR) | Study population | RR 0.82 | 1105 | ⊕⊕⊝⊝ | Follow‐up unclear for Adamyan 2010. ELANDD, SWEDIC and Takeda 2004 reported that no deaths occurred | |
| 243 per 1000 | 199 per 1000 | |||||
| Quality of life (Minnesota) | Mean quality of life (Minnesota) was 24 | MD 1 lower | ‐ | 93 | ⊕⊝⊝⊝ | Lower = better, 5 point difference considered to be clinically meaningful |
| *The risk in the intervention group (and its 95% confidence interval) is based on the assumed risk in the comparison group and the relative effect of the intervention (and its 95% CI). | ||||||
| GRADE Working Group grades of evidence | ||||||
| 1 Downgraded by one level due to unclear selection bias in most studies. 2 Downgraded by one level due to concerns about the smaller study being more precise than the larger study. 3 Downgraded by one level due to large variation in size of effect. 4 Downgraded by two levels due to few events and wide CI. 5 Downgraded by two levels due to very small sample size. 6 Suspected publication bias; this is a patient‐relevant outcome that is not reported in most studies. 7 Downgraded by two levels due to incomplete reporting. | ||||||
| MRA compared to placebo or no treatment for chronic heart failure with preserved ejection fraction | ||||||
| Patient or population: chronic heart failure with preserved ejection fraction | ||||||
| Outcomes | Anticipated absolute effects* (95% CI) | Relative effect | № of participants | Certainty of the evidence | Comments | |
| Risk with placebo/no treatment | Risk with MRA | |||||
| Cardiovascular mortality (RR) | Study population | RR 0.90 | 4070 | ⊕⊕⊕⊝ | Two additional trials (RAAM‐PEF, Kurrelmeyer 2014) reported that no deaths occurred | |
| 88 per 1000 | 79 per 1000 | |||||
| Heart failure hospitalisation (RR) | Study population | RR 0.82 | 3714 | ⊕⊕⊕⊝ | Three additional trials (ALDO‐DHF ,Kurrelmeyer 2014, Upadhya 2017) reported that no hospitalisation due to heart failure occurred | |
| 136 per 1000 | 112 per 1000 | |||||
| Hyperkalaemia | Study population | RR 2.11 | 4291 | ⊕⊕⊕⊕ | Two trials defined hyperkalaemia ≥ 5.5 mEg/L | |
| 83 per 1000 | 175 per 1000 | |||||
| All‐cause mortality | Study population | RR 0.91 | 4207 | ⊕⊕⊕⊝ | Two additional trials (RAAM‐PEF, Kurrelmeyer 2014) reported that no deaths occurred | |
| 133 per 1000 | 121 per 1000 | |||||
| Quality of life (Minnesota) | Mean quality of life (Minnesota) ranged from 20 to 25 | MD 0.84 higher | ‐ | 511 | ⊕⊕⊝⊝ | Lower = better, 5 points are considered a clinically significant difference We did not pre‐specify which QoL scale was to be reported in the 'Summary of findings' table. To aid comparisons among 'Summary of findings' tables we chose to include the Minnesota Living with Heart Failure questionnaire and not the SMD across two scales |
| *The risk in the intervention group (and its 95% confidence interval) is based on the assumed risk in the comparison group and the relative effect of the intervention (and its 95% CI). | ||||||
| GRADE Working Group grades of evidence | ||||||
| 1 Downgraded by one level due to imprecision. 2 Downgraded by one level because one trial was open label. 3 Downgraded by one level due to small sample size. | ||||||
| ACEI compared to placebo or no treatment for chronic heart failure with preserved ejection fraction | ||||||
| Patient or population: chronic heart failure with preserved ejection fraction | ||||||
| Outcomes | Anticipated absolute effects* (95% CI) | Relative effect | № of participants | Certainty of the evidence | Comments | |
| Risk with placebo/no treatment | Risk with ACEI | |||||
| Cardiovascular mortality (RR) | Study population | RR 0.93 | 945 | ⊕⊕⊕⊝ | One additional trial (Kitzman 2010) reported that no deaths occurred | |
| 86 per 1000 | 81 per 1000 | |||||
| Heart failure hospitalisation (RR) | Study population | RR 0.86 | 1019 | ⊕⊕⊕⊝ | ||
| 13 per 1000 | 11 per 1000 | |||||
| Hyperkalaemia | 74 (1 RCTs) | ⊕⊝⊝⊝ | One trial (Zi 2003) reported 2 events in the intervention group (N = 36), 0 events in the control group (N = 38) (RR 5.27, 95% CI 0.26 to 106.16) | |||
| All‐cause mortality (RR) | Study population | RR 0.99 | 1079 | ⊕⊕⊕⊝ | One additional trial (Kitzman 2010) reported that no deaths occurred | |
| 119 per 1000 | 119 per 1000 | |||||
| Quality of life (Minnesota) | Mean quality of life (Minnesota) ranged from 10.9 to 29 | MD 0.09 lower | ‐ | 154 | ⊕⊕⊝⊝ | Scale: 0 to 105, lower = better, 5 point difference considered clinically relevant One trial (SNEGOVIK) reported mean change from baseline of ‐19.8 for intervention and ‐10.7 for control |
| *The risk in the intervention group (and its 95% confidence interval) is based on the assumed risk in the comparison group and the relative effect of the intervention (and its 95% CI). | ||||||
| GRADE Working Group grades of evidence | ||||||
| 1 Downgraded by one level due to wide CI. 2 Downgraded by one level due to risk of bias (open label). 3 Downgraded by one level due to low sample size. 4 Downgraded by one level due to unclear selection bias. | ||||||
| ARB compared to placebo or no treatment for chronic heart failure with preserved ejection fraction | ||||||
| Patient or population: chronic heart failure with preserved ejection fraction | ||||||
| Outcomes | Anticipated absolute effects* (95% CI) | Relative effect | № of participants | Certainty of the evidence | Comments | |
| Risk with placebo/no treatment | Risk with ARB | |||||
| Cardiovascular mortality (RR) | Study population | RR 1.02 | 7254 | ⊕⊕⊕⊕ | One additional trial (Parthasarathy 2009) reported that no deaths occurred | |
| 131 per 1000 | 133 per 1000 | |||||
| Heart failure hospitalisation (RR) | Study population | RR 0.92 | 7254 | ⊕⊕⊕⊕ | ||
| 171 per 1,‐000 | 157 per 1,‐000 | |||||
| Hyperkalaemia | Study population | RR 1.88 | 7148 | ⊕⊕⊕⊕ | ||
| 3 per 1,000 | 5 per 1,000 | |||||
| All‐cause mortality (RR) | Study population | RR 1.01 | 7964 | ⊕⊕⊕⊕ | One additional trial (Parthasarathy 2009) reported that no deaths occurred | |
| 72 per 1000 | 73 per 1,‐000 | |||||
| Quality of life (Minnesota) | Mean quality of life (Minnesota) ranged from 10.9 to 31.6 | MD 0.41 higher | ‐ | 3117 | ⊕⊕⊕⊕ | Scale: 0 to 105, lower = better, 5 point difference considered clinically relevant |
| *The risk in the intervention group (and its 95% confidence interval) is based on the assumed risk in the comparison group and the relative effect of the intervention (and its 95% CI). | ||||||
| GRADE Working Group grades of evidence | ||||||
| Outcome or subgroup title | No. of studies | No. of participants | Statistical method | Effect size |
| 1 Cardiovascular mortality (RR) Show forest plot | 3 | 1046 | Risk Ratio (M‐H, Fixed, 95% CI) | 0.78 [0.62, 0.99] |
| 2 Heart failure hospitalisation (RR) Show forest plot | 4 | 449 | Risk Ratio (M‐H, Fixed, 95% CI) | 0.73 [0.47, 1.13] |
| 2.1 Follow‐up < 12 months | 1 | 67 | Risk Ratio (M‐H, Fixed, 95% CI) | 0.31 [0.09, 1.02] |
| 2.2 Follow‐up ≥ 12 months | 2 | 285 | Risk Ratio (M‐H, Fixed, 95% CI) | 0.79 [0.48, 1.31] |
| 2.3 Follow‐up unknown | 1 | 97 | Risk Ratio (M‐H, Fixed, 95% CI) | 5.31 [0.26, 107.85] |
| 3 All‐cause mortality (RR) Show forest plot | 4 | 1105 | Risk Ratio (M‐H, Fixed, 95% CI) | 0.82 [0.67, 1.00] |
| 4 Quality of life (Minnesota) Show forest plot | 1 | Mean Difference (IV, Fixed, 95% CI) | Totals not selected | |
| 5 Withdrawal due to adverse event Show forest plot | 2 | 338 | Risk Ratio (M‐H, Fixed, 95% CI) | 18.07 [2.45, 133.04] |
| Outcome or subgroup title | No. of studies | No. of participants | Statistical method | Effect size |
| 1 Cardiovascular mortality (RR) Show forest plot | 3 | 4070 | Risk Ratio (M‐H, Fixed, 95% CI) | 0.90 [0.74, 1.11] |
| 2 Heart failure hospitalisation (RR) Show forest plot | 3 | 3714 | Risk Ratio (M‐H, Fixed, 95% CI) | 0.82 [0.69, 0.98] |
| 2.1 Follow‐up < 12 months | 1 | 44 | Risk Ratio (M‐H, Fixed, 95% CI) | 0.55 [0.05, 5.61] |
| 2.2 Follow‐up ≥ 12 months | 2 | 3670 | Risk Ratio (M‐H, Fixed, 95% CI) | 0.82 [0.69, 0.98] |
| 3 Heart failure hospitalisation (HR) Show forest plot | 2 | 3670 | Hazard Ratio (Fixed, 95% CI) | 0.82 [0.69, 0.98] |
| 4 Hyperkalaemia Show forest plot | 6 | 4291 | Risk Ratio (M‐H, Fixed, 95% CI) | 2.11 [1.77, 2.51] |
| 5 All‐cause mortality (RR) Show forest plot | 5 | 4207 | Risk Ratio (M‐H, Fixed, 95% CI) | 0.91 [0.78, 1.06] |
| 6 Quality of life Show forest plot | 5 | 603 | Std. Mean Difference (IV, Random, 95% CI) | 0.05 [‐0.23, 0.34] |
| 7 Quality of life (KCCQ) Show forest plot | 2 | 92 | Mean Difference (IV, Random, 95% CI) | ‐0.78 [‐28.02, 26.46] |
| 8 Quality of life (Minnesota) Show forest plot | 3 | 511 | Mean Difference (IV, Random, 95% CI) | 0.84 [‐2.30, 3.98] |
| 9 Withdrawal due to adverse event Show forest plot | 4 | 3986 | Risk Ratio (M‐H, Fixed, 95% CI) | 1.10 [1.00, 1.21] |
| Outcome or subgroup title | No. of studies | No. of participants | Statistical method | Effect size |
| 1 Cardiovascular mortality (RR) Show forest plot | 2 | 945 | Risk Ratio (M‐H, Fixed, 95% CI) | 0.93 [0.61, 1.42] |
| 2 Heart failure hospitalisation (RR) Show forest plot | 3 | 1019 | Risk Ratio (M‐H, Fixed, 95% CI) | 0.86 [0.64, 1.15] |
| 2.1 Follow‐up < 12 months | 1 | 74 | Risk Ratio (M‐H, Fixed, 95% CI) | 0.42 [0.09, 2.04] |
| 2.2 Follow‐up ≥ 12 months | 2 | 945 | Risk Ratio (M‐H, Fixed, 95% CI) | 0.88 [0.66, 1.19] |
| 3 Hyperkalaemia Show forest plot | 1 | Risk Ratio (M‐H, Fixed, 95% CI) | Totals not selected | |
| 4 All‐cause mortality (RR) Show forest plot | 4 | 1079 | Risk Ratio (M‐H, Fixed, 95% CI) | 0.99 [0.71, 1.38] |
| 5 Quality of life (Minnesota) Show forest plot | 2 | 154 | Mean Difference (IV, Fixed, 95% CI) | ‐0.09 [‐3.66, 3.48] |
| 6 Withdrawal due to adverse event Show forest plot | 3 | 1019 | Risk Ratio (M‐H, Random, 95% CI) | 1.53 [0.26, 9.00] |
| Outcome or subgroup title | No. of studies | No. of participants | Statistical method | Effect size |
| 1 Cardiovascular mortality (RR) Show forest plot | 3 | 7254 | Risk Ratio (M‐H, Fixed, 95% CI) | 1.02 [0.90, 1.14] |
| 2 Cardiovascular mortality (HR) Show forest plot | 2 | 5087 | Hazard Ratio (Fixed, 95% CI) | 1.00 [0.89, 1.13] |
| 3 Heart failure hospitalisation (RR) Show forest plot | 3 | 7254 | Risk Ratio (M‐H, Fixed, 95% CI) | 0.92 [0.83, 1.02] |
| 4 Heart failure hospitalisation (HR) Show forest plot | 2 | 7148 | Hazard Ratio (Fixed, 95% CI) | 0.90 [0.80, 1.01] |
| 5 Hyperkalaemia Show forest plot | 2 | 7148 | Risk Ratio (M‐H, Fixed, 95% CI) | 1.88 [1.07, 3.33] |
| 6 All‐cause mortality (RR) Show forest plot | 4 | 7964 | Risk Ratio (M‐H, Fixed, 95% CI) | 1.01 [0.92, 1.11] |
| 7 All‐cause mortality (HR) Show forest plot | 2 | 4838 | Hazard Ratio (Fixed, 95% CI) | 0.99 [0.88, 1.12] |
| 8 Quality of life (Minnesota) Show forest plot | 3 | 3117 | Mean Difference (IV, Fixed, 95% CI) | 0.41 [‐0.86, 1.67] |
| 9 Withdrawal due to adverse event Show forest plot | 4 | 7406 | Risk Ratio (M‐H, Fixed, 95% CI) | 1.22 [1.09, 1.36] |